1
5.3. Scan for selective sweeps with pre-computed empirical spectrum and recombination
map
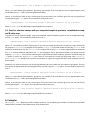
To perform a scan for selective sweeps with a pre-computed empirical frequency spectrum and a recombination map,
use the -lr option. The command to perform this scan is
./SweepFinder2 –lr G FreqFile SpectFile RecFile OutFile
where G is a user-defined number of grid points ( test sites are equally spaced across the genomic region spanned by
the positions in FreqFile) to compute the test statistic, FreqFile is the allele frequency input file, RecFile is the
respective recombination rate file, SpectFile is an input file containing the empirical derived allele frequency
spectrum calculated using the –f option in section 4.1, and OutFile is the name of a file where the results will be
printed. Here, FreqFile and RecFile would be for a specific chromosome (or region of the genome) rather than
combined across all chromosomes.
Sometimes it is more convenient to set the spacing between grid points rather than the number of grid points. The user
may specify the approximate desired spacing between test sites using the –lrg option. The command to perform this
scan is
./SweepFinder2 –lrg g FreqFile SpectFile RecFile OutFile
where g is a user-defined space between grid points. For example, if the user desired a test site approximately every
one kilobase, then
, representing 1000 nucleotides.
Further, it can often be useful to use a custom grid of test sites rather than a uniform grid. The user may specify this
custom grid using the –lru option. The command to perform this scan is
./SweepFinder2 –lru GridFile FreqFile SpectFile RecFile OutFile
where GridFile is a user-defined grid input file defined in section 3.4.
5.4. Scan for selective sweeps with pre-computed empirical spectrum and B-value map
To perform a scan for selective sweeps with a pre-computed empirical frequency spectrum and a recombination map,
use the –lb option. The command to perform this scan is
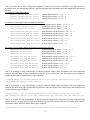
./SweepFinder2 –lb G FreqFile SpectFile BValFile N1 N2 T OutFile
where G is a user-defined number of grid points ( test sites are equally spaced across the genomic region spanned by
the positions in FreqFile) to compute the test statistic, FreqFile is the allele frequency input file, BvalFile is
the respective B-value file, N1 is current ingroup effective population size, N2 is ancestral effective population size, T is
the divergence time in generations between the ingroup and the outgroup, SpectFile is an input file containing the
empirical derived allele frequency spectrum calculated using the –f option in section 4.1, and OutFile is the name of
a file where the results will be printed. Here, FreqFile and BValFile would be for a specific chromosome (or region
of the genome) rather than combined across all chromosomes.
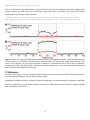
Sometimes it is more convenient to set the spacing between grid points rather than the number of grid points. The user
may specify the approximate desired spacing between test sites using the –lbg option. The command to perform this
scan is
6