1
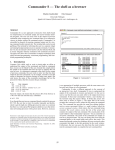
User Manual for datatool bundle
version 2.10
Nicola L.C. Talbot
School of Computing Sciences
University of East Anglia
Norwich. Norfolk
NR4 7TJ. United Kingdom.
http://theoval.cmp.uea.ac.uk/~nlct/
2012-07-18
The datatool bundle comes with the following documentation:
datatool-user.pdf This document is the main user guide for the datatool
bundle.
datatool.pdf Advanced users wishing to know more about the inner
workings of all the packages provided in the datatool bundle should
read “Documented Code for datatool v2.10”
INSTALL Installation instructions.
CHANGES Change log.
README Package summary.
The datatool bundle is provided to help perform repetitive commands,
such as mail merging, but since TEX is designed as a typesetting language, don’t expect this bundle to perform as efficiently as custom
database systems or a dedicated mathematical or scripting language.
This bundle consists of the following packages:
datatool Main package providing database support. Automatically loads
datatool-base.
datatool-base Provides the main library code for numerical and string
functions. Automatically loads datatool-fp or datatool-pgfmath
depending on package options.
databar Package for drawing bar charts. Automatically loads datatool.
datapie Package for drawing pie charts. Automatically loads datatool.
dataplot Package for drawing simple line graphs. Automatically loads
datatool.
databib Package for loading a bibliography into a database.
Automatically loads datatool.
person Package for referencing people by the appropriate gender
pronouns. Automatically loads datatool.
In addition, there are two mutually exclusive packages datatool-fp and
datatool-pgfmath that provide mathematical related commands that are just
wrapper functions for fp or pgfmath commands. These can be loaded
individually without loading datatool. For example, the following
documents produce the same results, but the first uses the fp package and
the second uses the pgfmath package:
i
1. Using fp macros:
\documentclass{article}
\usepackage{datatool-fp}
\begin{document}
1=2: \dtlifnumeq{1}{2}{true}{false}.
\end{document}
2. Using pgfmath macros:
\documentclass{article}
\usepackage{datatool-pgfmath}
\begin{document}
1=2: \dtlifnumeq{1}{2}{true}{false}.
\end{document}
ii
Contents
1
Introduction
2
2
Data Types
4
2.1
2.2
Conditionals . . . . . . . . . . . . . . . . . . . . . . . . . . . . 5
ifthen conditionals . . . . . . . . . . . . . . . . . . . . . . . . . 16
3
Fixed Point Arithmetic
22
4
Strings
32
5
Databases
35
5.1
5.2
5.3
5.4
5.5
5.6
5.7
5.8
5.9
5.10
5.11
6
.
.
.
.
.
.
.
.
.
.
.
.
.
.
.
.
.
.
.
.
.
.
.
.
.
.
.
.
.
.
.
.
.
.
.
.
.
.
.
.
.
.
.
.
.
.
.
.
.
.
.
.
.
.
.
.
.
.
.
.
.
.
.
.
.
.
.
.
.
.
.
.
.
.
.
.
.
.
.
.
.
.
.
.
Pie Charts (datapie package)
6.1
6.2
6.3
6.4
7
Creating a New Database . . . . . . . . . . . . .
Loading a Database from an External ASCII File
Displaying the Contents of a Database . . . . . .
Iterating Through a Database . . . . . . . . . . .
Null Values . . . . . . . . . . . . . . . . . . . . . .
Editing Database Rows . . . . . . . . . . . . . . .
Arithmetical Computations on Database Entries
Sorting a Database . . . . . . . . . . . . . . . . .
Saving a Database to an External File . . . . . . .
Deleting or Clearing a Database . . . . . . . . . .
Advanced Database Commands . . . . . . . . .
5.11.1 Operating on Current Row . . . . . . . .
86
Pie Chart Variables . . . . . . . . . . . . . . . . . . . . . .
Pie Chart Label Formatting . . . . . . . . . . . . . . . . .
Pie Chart Colours . . . . . . . . . . . . . . . . . . . . . . .
Adding Extra Commands Before and After the Pie Chart
.
.
.
.
.
.
.
.
93
93
94
97
.
.
.
.
.
.
.
.
.
.
.
.
107
108
108
109
110
111
Scatter and Line Plots (dataplot package)
7.1
7.2
7.3
35
38
42
48
63
66
68
73
78
79
79
83
Adding Information to the Plot
Global Plot Settings . . . . . . .
7.2.1 Lengths . . . . . . . . .
7.2.2 Counters . . . . . . . . .
7.2.3 Macros . . . . . . . . . .
Adding to a Plot Stream . . . .
iii
.
.
.
.
.
.
99
.
.
.
.
.
.
.
.
.
.
.
.
.
.
.
.
.
.
.
.
.
.
.
.
.
.
.
.
.
.
.
.
.
.
.
.
.
.
.
.
.
.
.
.
.
.
.
.
.
.
.
.
.
.
.
.
.
.
.
.
.
.
.
.
.
.
.
.
.
.
.
.
.
.
.
.
.
.
.
.
.
.
.
.
8
Bar Charts (databar package)
8.1
9
115
Changing the Appearance of a Bar Chart . . . . . . . . . . . 117
Converting a BIBTEX database into a datatool database (databib
package)
9.1
9.2
9.3
9.4
9.5
9.6
BIBTEX: An Overview . . . . . . . .
9.1.1 BIBTEX database . . . . . . .
Loading a databib database . . . . .
Displaying a databib database . . .
Changing the bibliography style .
9.4.1 Modifying an existing style
Iterating through a databib database
Multiple Bibliographies . . . . . .
.
.
.
.
.
.
.
.
.
.
.
.
.
.
.
.
.
.
.
.
.
.
.
.
.
.
.
.
.
.
.
.
.
.
.
.
.
.
.
.
.
.
.
.
.
.
.
.
.
.
.
.
.
.
.
.
.
.
.
.
.
.
.
.
.
.
.
.
.
.
.
.
.
.
.
.
.
.
.
.
.
.
.
.
.
.
.
.
.
.
.
.
.
.
.
.
129
.
.
.
.
.
.
.
.
.
.
.
.
.
.
.
.
.
.
.
.
.
.
.
.
10 Referencing People (person package)
10.1 Defining and Undefining People . . . . .
10.2 Displaying Information . . . . . . . . . . .
10.3 Advanced Commands . . . . . . . . . . .
10.3.1 Conditionals . . . . . . . . . . . . .
10.3.2 Iterating Through Defined People
10.3.3 Accessing Individual Information
129
130
133
134
138
138
143
145
149
.
.
.
.
.
.
.
.
.
.
.
.
.
.
.
.
.
.
.
.
.
.
.
.
.
.
.
.
.
.
.
.
.
.
.
.
.
.
.
.
.
.
.
.
.
.
.
.
.
.
.
.
.
.
.
.
.
.
.
.
.
.
.
.
.
.
149
150
156
156
158
158
Bibliography
160
Acknowledgements
161
Index
162
iv
List of Examples
1
2
3
4
5
6
7
8
9
10
11
12
13
14
15
16
17
18
19
20
21
22
23
24
25
26
27
28
29
30
31
32
33
34
35
36
37
Displaying the Contents of a Database . . . . . . . . .
Balance Sheet . . . . . . . . . . . . . . . . . . . . . . .
Student scores . . . . . . . . . . . . . . . . . . . . . . .
Student Scores—Labelling . . . . . . . . . . . . . . . .
Filtering Rows . . . . . . . . . . . . . . . . . . . . . . .
Breaking Out of a Loop . . . . . . . . . . . . . . . . . .
Stripy Tables . . . . . . . . . . . . . . . . . . . . . . . .
Two Database Rows per Tabular Row . . . . . . . . .
Iterating Through Keys in a Row . . . . . . . . . . . .
Nested \DTLforeach . . . . . . . . . . . . . . . . . .
Dynamically Allocating Field Name . . . . . . . . . .
Null Values . . . . . . . . . . . . . . . . . . . . . . . . .
Editing Database Rows . . . . . . . . . . . . . . . . . .
Arithmetical Computations . . . . . . . . . . . . . . .
Mail Merging . . . . . . . . . . . . . . . . . . . . . . .
Sorting a Database . . . . . . . . . . . . . . . . . . . .
Influencing the sort order . . . . . . . . . . . . . . . .
Two Database Rows Per Tabular Row (Column-Wise)
A Pie Chart . . . . . . . . . . . . . . . . . . . . . . . . .
Separating Segments from the Pie Chart . . . . . . . .
Changing the Inner and Outer Labels . . . . . . . . .
Changing the Inner and Outer Label Format . . . . .
Pie Segment Colours . . . . . . . . . . . . . . . . . . .
Adding Information to the Pie Chart . . . . . . . . . .
A Basic Graph . . . . . . . . . . . . . . . . . . . . . . .
Plotting Multiple Data Sets . . . . . . . . . . . . . . .
Adding Information to a Plot . . . . . . . . . . . . . .
Adding to a Plot Stream . . . . . . . . . . . . . . . . .
Plotting Multiple Keys in the Same Database . . . . .
A Basic Bar Chart . . . . . . . . . . . . . . . . . . . . .
A Labelled Bar Chart . . . . . . . . . . . . . . . . . . .
Profit/Loss Bar Chart . . . . . . . . . . . . . . . . . . .
A Multi-Bar Chart . . . . . . . . . . . . . . . . . . . . .
Creating a list of publications since a given year . . .
Creating a list of my 10 most recent publications . . .
Compact bibliography . . . . . . . . . . . . . . . . . .
Highlighting a given author . . . . . . . . . . . . . . .
v
.
.
.
.
.
.
.
.
.
.
.
.
.
.
.
.
.
.
.
.
.
.
.
.
.
.
.
.
.
.
.
.
.
.
.
.
.
.
.
.
.
.
.
.
.
.
.
.
.
.
.
.
.
.
.
.
.
.
.
.
.
.
.
.
.
.
.
.
.
.
.
.
.
.
.
.
.
.
.
.
.
.
.
.
.
.
.
.
.
.
.
.
.
.
.
.
.
.
.
.
.
.
.
.
.
.
.
.
.
.
.
.
.
.
.
.
.
.
.
.
.
.
.
.
.
.
.
.
.
.
.
.
.
.
.
.
.
.
.
.
.
.
.
.
.
.
.
.
43
47
49
51
52
54
55
56
57
60
62
63
67
68
72
74
77
82
88
90
93
94
96
98
102
105
107
112
112
117
121
121
124
136
137
141
141
38
39
40
41
42
Separate List of Journals and Conference Papers
Multiple Bibliographies . . . . . . . . . . . . . .
Order of Service (Memorial) . . . . . . . . . . . .
Order of Service (Baptism) . . . . . . . . . . . . .
Mail Merging Using Appropriate Gender . . . .
vi
.
.
.
.
.
.
.
.
.
.
.
.
.
.
.
.
.
.
.
.
.
.
.
.
.
.
.
.
.
.
.
.
.
.
.
144
146
152
154
155
List of Figures
6.1
6.2
6.3
6.4
6.5
6.6
6.7
6.8
6.9
6.10
A pie chart . . . . . . . . . . . . . . . . . . . . . . . . . .
A pie chart (outer labels set) . . . . . . . . . . . . . . . .
A pie chart (rotation enabled) . . . . . . . . . . . . . . .
A pie chart with cutaway segments . . . . . . . . . . . .
A pie chart with cutaway segments (cutaway={1-2})
A pie chart with cutaway segments (cutaway={1,2})
A pie chart (changing the labels) . . . . . . . . . . . . .
A pie chart (changing the label format) . . . . . . . . . .
A pie chart (using segment colours and outline) . . . .
An annotated pie chart . . . . . . . . . . . . . . . . . . .
.
.
.
.
.
.
.
.
.
.
89
89
90
91
92
92
94
95
97
98
7.1
7.2
7.3
7.4
7.5
7.6
7.7
A scatter plot . . . . . . . . . . . . . . . . . . . . . . . . . . . .
A line plot . . . . . . . . . . . . . . . . . . . . . . . . . . . . .
A scatter plot (multiple datasets) . . . . . . . . . . . . . . . .
A scatter plot (with a legend) . . . . . . . . . . . . . . . . . .
A scatter plot (using the end plot hook to annotate the plot)
Adding to a plot stream . . . . . . . . . . . . . . . . . . . . .
Time to growth data (plotting from the same database using
different keys) . . . . . . . . . . . . . . . . . . . . . . . . . . .
103
104
106
106
108
112
A basic bar chart . . . . . . . . . . . . . . . . .
A bar chart (labelled) . . . . . . . . . . . . . .
Profits for 2000–2003 (a horizontal bar chart)
Student marks (a multi-bar chart) . . . . . . .
Student marks (annotating a bar chart) . . . .
118
122
124
126
128
8.1
8.2
8.3
8.4
8.5
vii
.
.
.
.
.
.
.
.
.
.
.
.
.
.
.
.
.
.
.
.
.
.
.
.
.
.
.
.
.
.
.
.
.
.
.
.
.
.
.
.
.
.
.
.
.
.
.
.
.
.
.
.
.
.
.
.
.
.
.
.
.
.
.
.
.
114
List of Tables
5.1
5.2
5.3
5.4
5.5
5.6
5.7
5.8
5.9
5.10
5.11
5.12
5.13
5.14
5.15
5.16
5.17
5.18
5.19
5.20
5.21
5.22
5.23
5.24
5.25
Special character mappings used by \DTLloadrawdb . . .
Time to Growth Data . . . . . . . . . . . . . . . . . . . . . .
Balance Sheet . . . . . . . . . . . . . . . . . . . . . . . . . .
Student scores (displaying a database in a table) . . . . . .
Student scores (labelling rows) . . . . . . . . . . . . . . . .
Top student scores (filtering rows using \DTLisgt) . . . .
Student scores (B) — filtering rows using
\DTLisopenbetween . . . . . . . . . . . . . . . . . . . . .
First Three Rows . . . . . . . . . . . . . . . . . . . . . . . .
A stripy table (illustrating the use of \DTLifoddrow) . . .
Two database rows per tabular row (illustrating the use of
\DTLifoddrow) . . . . . . . . . . . . . . . . . . . . . . . .
Student Scores (Iterating Through Keys) . . . . . . . . . . .
Student Scores (Using \dtlforeachkey and
\DTLforeachkeyinrow) . . . . . . . . . . . . . . . . . . .
Student Scores (Filtering Out a Column) . . . . . . . . . . .
Temperature = 25, NaCl = 4.7, pH = 0.5 (illustrating nested
\DTLforeach) . . . . . . . . . . . . . . . . . . . . . . . . .
Temperature = 25, NaCl = 4.8, pH = 1.5 (illustrating nested
\DTLforeach) . . . . . . . . . . . . . . . . . . . . . . . . .
Temperature = 30, NaCl = 5.12, pH = 4.5 (illustrating nested
\DTLforeach) . . . . . . . . . . . . . . . . . . . . . . . . .
Club Membership . . . . . . . . . . . . . . . . . . . . . . . .
Student marks (with averages) . . . . . . . . . . . . . . . .
Student scores (using arithmetic computations) . . . . . . .
Student scores (sorted by score) . . . . . . . . . . . . . . . .
Student scores (sorted by name) . . . . . . . . . . . . . . . .
Student scores (case sensitive sort) . . . . . . . . . . . . . .
Student scores (case ignored when sorting) . . . . . . . . .
Student scores (influencing the sort order) . . . . . . . . . .
Two database rows per tabular row (column-wise) . . . . .
1
.
.
.
.
.
.
41
44
48
50
53
53
. 54
. 55
. 56
. 57
. 57
. 58
. 60
. 61
. 61
.
.
.
.
.
.
.
.
.
.
61
62
68
69
75
75
76
77
78
83
1 Introduction
The datatool bundle consists of the following packages: datatool (which
loads datatool-base and either datatool-fp or datatool-pgfmath), datapie,
dataplot, databar and databib.
The datatool package can be used to:
• Create or load databases.
• Sort rows of a database (either numerically or alphabetically,
ascending or descending).
• Perform repetitive operations on each row of a database (e.g. mail
merging). Conditions may be imposed to exclude rows.
• Package Options:
verbose Boolean key. If true, prints informational messages in
transcript.
math May take one of two values: fp (load datatool-fp) or pgfmath
(load datatool-pgfmath). Default is: fp.
delimiter Delimiter used in CSV files. Default is a double quote (").
separator Delimiter used in CSV files. Default is a comma (,).
The datatool-base package can be used to:
• Determine whether an argument is an integer, a real number,
currency or a string. (Scientific notation is currently not supported.)
Locale dependent number settings are supported (such as a comma
as a decimal character and a full stop as a number group character).
• Convert locale dependent numbers/currency to the decimal format
required by the fp or pgfmath packages, enabling fixed point
arithmetic to be performed on elements of the database.
• Names can be converted to initials.
• Determine if strings are all upper or lower case.
• Perform string comparisons (both case sensitive and case
insensitive).
• Package Options:
2
verbose Boolean key. If true, prints informational messages in
transcript.
math May take one of two values: fp (load datatool-fp) or pgfmath
(load datatool-pgfmath). Default is: fp.
The datapie package (see chapter 6) can be used to convert a database into
a pie chart:
• Segments can be separated from the rest of the chart to make them
stand out.
• Colour/grey scale options.
• Predefined segment colours can be changed.
• Hooks provided to add extra information to the chart
The databar package (see chapter 8) can be used to convert a database into
a bar chart:
• Colour/grey scale options.
• Predefined bar colours can be changed.
• Hooks provided to add extra information to the chart
(The datapie and databar packages do not support the creation of 3D
charts, and I have no plans to implement them at any later date. The use
of 3D charts should be discouraged. They may look pretty, but the
purpose of a chart is to be informative. Three dimensional graphics cause
distortion, which can result in misleading impressions. The pgf manual
provides a more in-depth discussion on the matter.)
The dataplot package (see chapter 7) can be used to convert a database
into a two dimensional plot using markers and/or lines. Three
dimensional plots are currently not supported.
The databib package (see chapter 9) can be used to convert a BIBTEX
database into a datatool database.
3
2 Data Types
The datatool-base package recognises four data types: integers, real
numbers, currency and strings.
Integers An integer is a sequence of digits, optionally groups of three
digits may be separated by the number group character. The
default number group character is a comma (,) but may be changed
using \DTLsetnumberchars (see below).
Real Numbers A real number is an integer followed by the decimal
character followed by one or more digits. The decimal character is a
full stop (.) by default. The number group and decimal characters
may be changed using
\DTLsetnumberchars
\DTLsetnumberchars{hnumber group characteri}{hdecimal
characteri}
Note that scientific notation is not supported, and the number
group character may not be used after the decimal character.
Currency A currency symbol followed by an integer or real number is
considered to be the currency data type. There are two predefined
currency symbols, \$ and \pounds. In addition, if any of the
following commands are defined at the start of the document, they
are also considered to be a currency symbol: \texteuro,
\textdollar, \textstirling, \textyen, \textwon,
\textcurrency, \euro and \yen. Additional currency symbols
can be defined using
\DTLnewcurrencysymbol
\DTLnewcurrencysymbol{hsymboli}
Strings Anything that doesn’t belong to the above three types is
considered to be a string.
4
2.1 Conditionals
The following conditionals are provided by the datatool-base package:
\DTLifint
\DTLifint{htexti}{htrue parti}{hfalse parti}
If htexti is an integer then do htrue parti, otherwise do hfalse parti. For
example
\DTLifint{2536}{integer}{not an integer}
produces: integer.
The number group character may appear in the number, for example:
\DTLifint{2,536}{integer}{not an integer}
produces: integer. However, the number group character may only be
followed by a group of three digits. For example:
\DTLifint{2,5,3,6}{integer}{not an integer}
produces: not an integer. The number group character may be changed.
For example:
\DTLsetnumberchars{.}{,}%
\DTLifint{2,536}{integer}{not an integer}
this now produces: not an integer, since 2,536 is now a real number.
Note that nothing else can be appended or prepended to the number. For
example:
\DTLsetnumberchars{,}{.}%
\DTLifint{2,536m}{integer}{not an integer}
produces: not an integer.
\DTLifreal
\DTLifreal{htexti}{htrue parti}{hfalse parti}
If htexti is a real number then do htrue parti, otherwise do hfalse parti. For
example
\DTLifreal{1000.0}{real}{not real}
produces: real.
Note that an integer is not considered a real number:
\DTLifreal{1,000}{real}{not real}
5
produces: not real.
Whereas
\DTLifreal{1,000.0}{real}{not real}
produces: real.
However
\DTLsetnumberchars{.}{,}%
\DTLifreal{1,000}{real}{not real}
produces: real since the comma is now the decimal character.
Currency is not considered to be real:
\DTLsetnumberchars{,}{.}%
\DTLifreal{\$1.00}{real}{not real}
produces: not real.
\DTLifcurrency
\DTLifcurrency{htexti}{htrue parti}{hfalse parti}
If htexti is currency, then do htrue parti, otherwise do false part. For
example:
\DTLifcurrency{\$5.99}{currency}{not currency}
produces: currency. Similarly:
\DTLifcurrency{\pounds5.99}{currency}{not currency}
produces: currency. Note, however, that
\DTLifcurrency{US\$5.99}{currency}{not currency}
produces: not currency. If you want this to be considered currency, you
will have to add the sequence US\$ to the set of currency symbols:
\DTLnewcurrencysymbol{US\$}%
\DTLifcurrency{US\$5.99}{currency}{not currency}
this now produces: currency.
This document has used the textcomp package which defines \texteuro,
so this is also considered to be currency. For example:
\DTLifcurrency{\texteuro5.99}{currency}{not currency}
produces: currency.
The preferred method is to display the euro symbol in a sans-serif font,
but
\DTLifcurrency{\textsf{\texteuro}5.99}{currency}{not currency}
6
will produce: not currency.
It is better to define a new command, for example:
\DeclareRobustCommand*{\euro}{\textsf{\texteuro}}
and add that command to the list of currency symbols. In fact, in this
case, if you define the command \euro in the preamble, it will
automatically be added to the list of known currency symbols. If
however you define \euro in the document, you will have to add it
using \DTLnewcurrencysymbol. For example:
\newcommand*{\euro}{\textsf{\texteuro}}%
\DTLnewcurrencysymbol{\euro}%
\DTLifcurrency{\euro5.99}{currency}{not currency}
produces: currency.
\DTLifcurrencyunit
\DTLifcurrencyunit{htexti}{hsymboli}{htrue parti}{hfalse parti}
If htexti is currency, and uses hsymboli as the unit of currency, then do
htrue parti otherwise do hfalse parti. For example:
\DTLifcurrencyunit{\$6.99}{\$}{dollars}{not dollars}
produces: dollars. Another example:
\def\cost{\euro10.50}%
\DTLifcurrencyunit{\cost}{\euro}{euros}{not euros}
produces: euros.
\DTLifnumerical
\DTLifnumerical{htexti}{htrue parti}{hfalse parti}
If htexti is numerical (either an integer, real number or currency) then do
htrue parti otherwise do hfalse parti. For example:
\DTLifnumerical{1,000.0}{number}{string}.
produces: number. Whereas
\DTLsetnumberchars{.}{,}%
\DTLifnumerical{1,000.0}{number}{string}.
produces: string. Since the number group character is now a full stop,
and the decimal character is now a comma. (The number group character
may only appear before the decimal character, not after it.)
Currency is also considered to be numerical:
\DTLsetnumberchars{,}{.}%
\DTLifnumerical{\$1,000.0}{number}{string}.
7
produces: number.
\DTLifstring
\DTLifstring{htexti}{htrue parti}{hfalse parti}
This is the opposite of \DTLifnumerical. If htexti is not numerical, do
htrue parti, otherwise do hfalse parti.
\DTLifcasedatatype
\DTLifcasedatatype{htexti}{hstring casei}{hint casei}{hreal
casei}{hcurrency casei}
If htexti is a string do hstring casei, if htexti is an integer do hint casei, if
htexti is a real number do hreal casei, if htexti is currency do hcurrency
casei. For example:
\DTLifcasedatatype{1,000}{string}{integer}{real}{currency}
produces: integer.
\dtlifnumeq
\dtlifnumeq{hnum1i}{hnum2i}{htrue parti}{hfalse patyi}
If hnum1i is equal to hnum2i, then do htrue parti, otherwise to hfalse parti
where hnum1i and hnum2i are plain numbers using a full stop as the
decimal point and no number group separator. For currency or locale
dependent numbers use \DTLifnumeq.
\DTLifnumeq
\DTLifnumeq{hnum1i}{hnum2i}{htrue parti}{hfalse parti}
If hnum1i is equal to hnum2i, then do htrue parti, otherwise do hfalse parti.
Note that both hnum1i and hnum2i must be numerical (either integers,
real numbers or currency). The currency symbol is ignored when
determining equality. For example
\DTLifnumeq{\pounds10.50}{10.5}{true}{false}
produces: true, since they are considered to be numerically equivalent.
Likewise:
\DTLifnumeq{\pounds10.50}{\$10.50}{true}{false}
produces: true.
8
\DTLifstringeq
\DTLifstringeq{hstring1i}{hstring2i}{htrue parti}{hfalse parti}
\DTLifstringeq*
\DTLifstringeq*{hstring1i}{hstring2i}{htrue parti}{hfalse parti}
If hstring1i and hstring2i are the same, then do htrue parti, otherwise do
hfalse parti. The starred version ignores the case, the unstarred version is
case sensitive. Both hstring1i and hstring2i are considered to be strings, so
for example:
\DTLifstringeq{10.50}{10.5}{true}{false}
produces: false.
Note that
\DTLifstringeq{Text}{text}{true}{false}
produces: false, whereas
\DTLifstringeq*{Text}{text}{true}{false}
produces: true, however it should also be noted that many commands
will be ignored, so:
\DTLifstringeq{\uppercase{t}ext}{text}{true}{false}
produces: true.
Spaces are considered to be equivalent to \space and ~. For example:
\DTLifstringeq{an apple}{an~apple}{true}{false}
produces: true. Consecutive spaces are treated as the same, for example:
\DTLifstringeq{an
apple}{an apple}{true}{false}
produces: true.
\DTLifeq
\DTLifeq{harg1i}{harg2i}{htrue parti}{hfalse parti}
\DTLifeq*
\DTLifeq*{harg1i}{harg2i}{htrue parti}{hfalse parti}
If both harg1i and harg2i are numerical, then this is equivalent to
\DTLifnumeq, otherwise it is equivalent to \DTLifstringeq (when
using \DTLifeq) or \DTLifstringeq* (when using \DTLifeq*).
9
\dtlifnumlt
\dtlifnumlt{hnum1i}{hnum2i}{htrue parti}{hfalse patyi}
If hnum1i is less than hnum2i, then do htrue parti, otherwise to hfalse parti
where hnum1i and hnum2i are plain numbers using a full stop as the
decimal point and no number group separator. For currency or locale
dependent numbers use \DTLifnumlt.
\DTLifnumlt
\DTLifnumlt{hnum1i}{hnum2i}{htrue parti}{hfalse parti}
If hnum1i is less than hnum2i, then do htrue parti, otherwise do hfalse
parti. Note that both hnum1i and hnum2i must be numerical (either
integers, real numbers or currency).
\DTLifstringlt
\DTLifstringlt{hstring1i}{hstring2i}{htrue parti}{hfalse parti}
\DTLifstringlt*
\DTLifstringlt*{hstring1i}{hstring2i}{htrue parti}{hfalse parti}
If hstring1i is alphabetically less than hstring2i, then do htrue parti,
otherwise do hfalse parti. The starred version ignores the case, the
unstarred version is case sensitive. For example:
\DTLifstringlt{aardvark}{zebra}{less}{not less}
produces: less.
Note that both hstring1i and hstring2i are considered to be strings, so for
example:
\DTLifstringlt{2}{10}{less}{not less}
produces: not less, since the string 2 comes after the string 10 when
arranged alphabetically.
The case sensitive (unstarred) version considers uppercase characters to
be less than lowercase characters, so
\DTLifstringlt{B}{a}{less}{not less}
produces: less, whereas
\DTLifstringlt*{B}{a}{less}{not less}
10
produces: not less.
\DTLiflt
\DTLiflt{harg1i}{harg2i}{htrue parti}{hfalse parti}
\DTLiflt*
\DTLiflt*{harg1i}{harg2i}{htrue parti}{hfalse parti}
If harg1i and harg2i are both numerical, then this is equivalent to
\DTLifnumlt, otherwise it is equivalent to \DTLstringlt (when
using \DTLiflt) or \DTLstringlt* (when using \DTLiflt*).
\DTLifnumgt
\DTLifnumgt{hnum1i}{hnum2i}{htrue parti}{hfalse parti}
If hnum1i is greater than hnum2i, then do htrue parti, otherwise do hfalse
parti. Note that both hnum1i and hnum2i must be numerical (either
integers, real numbers or currency).
\DTLifstringgt
\DTLifstringgt{hstring1i}{hstring2i}{htrue parti}{hfalse parti}
\DTLifstringgt*
\DTLifstringgt*{hstring1i}{hstring2i}{htrue parti}{hfalse parti}
If hstring1i is alphabetically greater than hstring2i, then do htrue parti,
otherwise do hfalse parti. The starred version ignores the case, the
unstarred version is case sensitive. For example:
\DTLifstringgt{aardvark}{zebra}{greater}{not greater}
produces: not greater.
Note that both hstring1i and hstring2i are considered to be strings, so for
example:
\DTLifstringgt{2}{10}{greater}{not greater}
produces: greater, since the string 2 comes after the string 10 when
arranged alphabetically.
As with \DTLifstringlt, uppercase characters are considered to be
less than lower case characters when performing a case sensitive
comparison so:
\DTLifstringgt{B}{a}{greater}{not greater}
11
produces: not greater, whereas
\DTLifstringgt*{B}{a}{greater}{not greater}
produces: greater.
\DTLifgt
\DTLifgt{harg1i}{harg2i}{htrue parti}{hfalse parti}
\DTLifgt*
\DTLifgt*{harg1i}{harg2i}{htrue parti}{hfalse parti}
If harg1i and harg2i are both numerical, then this is equivalent to
\DTLifnumgt, otherwise it is equivalent to \DTLstringgt (when
using \DTLifgt) or \DTLstringgt* (when using \DTLifgt*).
\DTLifnumclosedbetween
\DTLifnumclosedbetween{hnumi}{hmini}{hmaxi}{htrue
parti}{hfalse parti}
If hmini ≤ hnumi ≤ hmaxi then do htrue parti, otherwise do hfalse parti.
Note that hnumi, hmini and hmaxi must be numerical (either integers, real
numbers or currency). The currency symbol is ignored when
determining equality. For example:
\DTLifnumclosedbetween{5.4}{5}{7}{inside}{outside}
produces: inside. Note that the closed range includes end points:
\DTLifnumclosedbetween{5}{5}{7}{inside}{outside}
produces: inside.
\DTLifstringclosedbetween
\DTLifstringclosedbetween{hstringi}{hmini}{hmaxi}{htrue
parti}{hfalse parti}
\DTLifstringclosedbetween*
\DTLifstringclosedbetween*{hstringi}{hmini}{hmaxi}{htrue
parti}{hfalse parti}
This determines if hstringi is between hmini and hmaxi in the alphabetical
sense, or is equal to either hmini or hmaxi. The starred version ignores the
case, the unstarred version is case sensitive.
12
\DTLifclosedbetween
\DTLifclosedbetween{hargi}{hmini}{hmaxi}{htrue parti}{hfalse
parti}
\DTLifclosedbetween*
\DTLifclosedbetween*{hargi}{hmini}{hmaxi}{htrue parti}{hfalse
parti}
If hargi, hmini and hmaxi are numerical, then this is equivalent to
\DTLifnumclosedbetween
otherwise it is equivalent to
\DTLifstringclosedbetween
(when using \DTLifclosedbetween) or
\DTLifstringclosedbetween*
(when using \DTLifclosedbetween*).
\DTLifnumopenbetween
\DTLifnumopenbetween{hnumi}{hmini}{hmaxi}{htrue
parti}{hfalse parti}
If hmini hnumi hmaxi then do htrue parti, otherwise do hfalse parti. Note
that hnumi, hmini and hmaxi must be numerical (either integers, real
numbers or currency). Again, the currency symbol is ignored when
determining equality. For example:
\DTLifnumopenbetween{5.4}{5}{7}{inside}{outside}
produces: inside. Note that end points are not included. For example:
\DTLifnumopenbetween{5}{5}{7}{inside}{outside}
produces: outside.
\DTLifstringopenbetween
\DTLifstringopenbetween{hstringi}{hmini}{hmaxi}{htrue
parti}{hfalse parti}
\DTLifstringopenbetween*
\DTLifstringopenbetween*{hstringi}{hmini}{hmaxi}{htrue
parti}{hfalse parti}
This determines if hstringi is between hmini and hmaxi in the alphabetical
sense. The starred version ignores the case, the unstarred version is case
sensitive.
13
\DTLifopenbetween
\DTLifopenbetween{hargi}{hmini}{hmaxi}{htrue parti}{hfalse
parti}
\DTLifopenbetween*
\DTLifopenbetween*{hargi}{hmini}{hmaxi}{htrue parti}{hfalse
parti}
If hargi, hmini and hmaxi are numerical, then this is equivalent to
\DTLifnumopenbetween otherwise it is equivalent to
\DTLifstringopenbetween (when using \DTLifopenbetween) or
\DTLifstringopenbetween* (when using \DTLifopenbetween*).
\DTLifFPclosedbetween
\DTLifFPclosedbetween{hnumi}{hmini}{hmaxi}{htrue
parti}{hfalse parti}
If hmini ≤ hnumi ≤ hmaxi then do htrue parti, otherwise do hfalse parti
where hnumi, hmini and hmaxi are all in standard fixed point notation
(i.e. no number group separator, no currency symbols and a full stop as a
decimal point).
\DTLifFPopenbetween
\DTLifFPopenbetween{hnumi}{hmini}{hmaxi}{htrue parti}{hfalse
parti}
If hmini hnumi hmaxi then do htrue parti, otherwise do hfalse parti where
hnumi, hmini and hmaxi are all in standard fixed point notation (i.e. no
number group separator, no currency symbols and a full stop as a
decimal point).
\DTLifAllUpperCase
\DTLifAllUpperCase{hstringi}{htrue parti}{hfalse parti}
Tests if hstringi is all upper case. For example:
\DTLifAllUpperCase{WORD}{all upper}{not all upper}
produces: all upper, whereas
\DTLifAllUpperCase{Word}{all upper}{not all upper}
produces: not all upper. Note also that:
\DTLifAllUpperCase{\MakeUppercase{word}}{all upper}{not all upper}
14
also produces: all upper. \MakeTextUppercase (defined in David
Carlisle’s textcase package) and \uppercase are also detected,
otherwise, if a command is encountered, the case of the command is
considered. For example:
\DTLifAllUpperCase{MAN{\OE}UVRE}{all upper}{not all upper}
produces: all upper.
\DTLifAllLowerCase
\DTLifAllLowerCase{hstringi}{htrue parti}{hfalse parti}
Tests if hstringi is all lower case. For example:
\DTLifAllLowerCase{word}{all lower}{not all lower}
produces: all lower, whereas
\DTLifAllLowerCase{Word}{all lower}{not all lower}
produces: not all lower. Note also that:
\DTLifAllLowerCase{\MakeLowercase{WORD}}{all lower}{not all lower}
also produces: all lower. \MakeTextLowercase (defined in David
Carlisle’s textcase package) and \lowercase are also detected,
otherwise, if a command is encountered, the case of the command is
considered. For example:
\DTLifAllLowerCase{man{\oe}uvre}{all lower}{not all lower}
produces: all lower.
\DTLifSubString
\DTLifSubString{hstringi}{hsubstringi}{htrue parti}{hfalse parti}
This tests if hsubstringi is a sub-string of hstringi. This command
performs a case sensitive match. For example:
\DTLifSubString{An apple}{app}{is substring}{isn’t substring}
produces: is substring. Note that spaces are considered to be equivalent
to \space or ~, so
\DTLifSubString{An apple}{n~a}{is substring}{isn’t substring}
produces: is substring, but other commands are skipped, so
\DTLifSubString{An \uppercase{a}pple}{app}{is substring}{isn’t
substring}
15
produces: is substring, since the \uppercase command is ignored. Note
also that grouping is ignored, so:
\DTLifSubString{An {ap}ple}{app}{is substring}{isn’t substring}
produces: is substring.
\DTLifSubString is case sensitive, so:
\DTLifSubString{An Apple}{app}{is substring}{isn’t substring}
produces: isn’t substring.
\DTLifStartsWith
\DTLifStartsWith{hstringi}{hsubstringi}{htrue parti}{hfalse parti}
This is like \DTLifSubString, except that hsubstringi must occur at the
start of hstringi. This command performs a case sensitive match. For
example,
\DTLifStartsWith{An apple}{app}{prefix}{not a prefix}
produces: not a prefix. All the above remarks for \DTLifSubString
also applies to \DTLifStartsWith. For example:
\DTLifStartsWith{\uppercase{a}n apple}{an~}{prefix}{not a prefix}
produces: prefix, since \uppercase is ignored, and ~ is considered to be
the same as a space, whereas
\DTLifStartsWith{An apple}{an~}{prefix}{not a prefix}
produces: not a prefix.
2.2 ifthen conditionals
The commands described in the previous section can not be used as the
conditional part of the \ifthenelse or \whiledo commands provided
by the ifthen package. This section describes analogous commands which
may only be used in the conditional argument of \ifthenelse and
\whiledo. These may be used with the boolean operations \not, \and
and \or provided by the ifthen package. See the ifthen documentation for
further details.
\DTLisstring
\DTLisstring{htexti}
Tests if htexti is a string. For example:
\ifthenelse{\DTLisstring{some text}}{string}{not a string}
16
produces: string.
\DTLisnumerical
\DTLisnumerical{htexti}
Tests if htexti is numerical (i.e. not a string). For example:
\ifthenelse{\DTLisnumerical{\$10.95}}{numerical}{not numerical}
produces: numerical.
Note however that \DTLisnumerical requires more care than
\DTLifnumerical when used with some of the other currency
symbols. Consider:
\DTLifnumerical{\pounds10.95}{numerical}{not numerical}
This produces: numerical. However
\ifthenelse{\DTLisnumerical{\pounds10.95}}{numerical}{not numerical}
produces: not numerical. This is due to the expansion that occurs within
\ifthenelse. This can be prevented using \noexpand, for example:
\ifthenelse{\DTLisnumerical{\noexpand\pounds10.95}}{numerical}{not numerical}
produces: numerical.
Likewise:
\def\cost{\pounds10.95}%
\ifthenelse{\DTLisnumerical{\noexpand\cost}}{numerical}{not numerical}
produces: numerical.
\DTLiscurrency
\DTLiscurrency{htexti}
Tests if htexti is currency. For example:
\ifthenelse{\DTLiscurrency{\$10.95}}{currency}{not currency}
produces: currency.
The same warning given above for \DTLisnumerical also applies here.
\DTLiscurrencyunit
\DTLiscurrencyunit{htexti}{hsymboli}
Tests if htexti is currency and that currency uses hsymboli as the unit of
currency. For example:
\ifthenelse{\DTLiscurrencyunit{\$6.99}{\$}}{dollars}{not dollars}
17
produces: dollars. Another example:
\def\cost{\euro10.50}%
\ifthenelse{\DTLiscurrencyunit{\noexpand\cost}{\noexpand\euro}}%
{euros}{not euros}
produces: euros. Again note the use of \noexpand.
\DTLisreal
\DTLisreal{htexti}
Tests if htexti is a fixed point number (again, an integer is not considered
to be a fixed point number). For example:
\ifthenelse{\DTLisreal{1.5}}{real}{not real}
produces: real.
\DTLisint
\DTLisint{htexti}
Tests if htexti is an integer. For example:
\ifthenelse{\DTLisint{153}}{integer}{not an integer}
produces: integer.
\DTLislt
\DTLislt{harg1i}{harg2i}
This checks if harg1i is less than harg2i. As with \DTLiflt, if harg1i and
harg2i are numerical, a numerical comparison is used, otherwise a case
sensitive alphabetical comparison is used. (Note that there is no starred
version of this command, but you can instead use \DTLisilt to ignore
the case.)
\DTLisilt
\DTLisilt{harg1i}{harg2i}
This checks if harg1i is less than harg2i. As with \DTLiflt*, if harg1i
and harg2i are numerical, a numerical comparison is used, otherwise a
case insensitive alphabetical comparison is used.
\DTLisgt
\DTLisgt{harg1i}{harg2i}
18
This checks if harg1i is greater than harg2i. As with \DTLifgt, if harg1i
and harg2i are numerical, a numerical comparison is used, otherwise a
case sensitive alphabetical comparison is used. (Note that there is no
starred version of this command, instead use \DTLisigt to ignore the
case.)
\DTLisigt
\DTLisigt{harg1i}{harg2i}
This checks if harg1i is greater than harg2i. As with \DTLifgt*, if harg1i
and harg2i are numerical, a numerical comparison is used, otherwise a
case insensitive alphabetical comparison is used.
\DTLiseq
\DTLiseq{harg1i}{harg2i}
This checks if harg1i is equal to harg2i. As with \DTLifeq, if harg1i and
harg2i are numerical, a numerical comparison is used, otherwise a case
sensitive alphabetical comparison is used. (Note that there is no starred
version of this command, instead use \DTLisieq.)
\DTLisieq
\DTLisieq{harg1i}{harg2i}
This checks if harg1i is equal to harg2i. As with \DTLifeq*, if harg1i and
harg2i are numerical, a numerical comparison is used, otherwise a case
insensitive alphabetical comparison is used.
\DTLisclosedbetween
\DTLisclosedbetween{hargi}{hmini}{hmaxi}
This checks if hargi lies between hmini and hmaxi (end points included).
As with \DTLifclosedbetween, if the arguments are numerical, a
numerical comparison is used, otherwise a case sensitive alphabetical
comparison is used. (Note that there is no starred version of this
command, instead use \DTLisiclosedbetween.)
\DTLisiclosedbetween
\DTLisiclosedbetween{hargi}{hmini}{hmaxi}
This checks if hargi lies between hmini and hmaxi (end points included).
As with \DTLifclosedbetween*, if the arguments are numerical, a
19
numerical comparison is used, otherwise a case insensitive alphabetical
comparison is used.
\DTLisopenbetween
\DTLisopenbetween{hargi}{hmini}{hmaxi}
This checks if hargi lies between hmini and hmaxi (end points excluded).
As with \DTLifopenbetween, if the arguments are numerical, a
numerical comparison is used, otherwise a case sensitive alphabetical
comparison is used. (Note that there is no starred version of this
command, instead use \DTLisiopenbetween.)
\DTLisiopenbetween
\DTLisiopenbetween{hargi}{hmini}{hmaxi}
This checks if hargi lies between hmini and hmaxi (end points excluded).
As with \DTLifopenbetween*, if the arguments are numerical, a
numerical comparison is used, otherwise a case insensitive alphabetical
comparison is used.
\DTLisFPlt
\DTLisFPlt{hnum1i}{hnum2i}
This checks if hnum1i is less than hnum2i, where both numbers are in
standard fixed point format (i.e. no number group separators, no
currency and a full stop as a decimal point).
\DTLisFPlteq
\DTLisFPlteq{hnum1i}{hnum2i}
This checks if hnum1i is less than or equal to hnum2i, where both
numbers are in standard fixed point format (i.e. no number group
separators, no currency and a full stop as a decimal point).
\DTLisFPgt
\DTLisFPgt{hnum1i}{hnum2i}
This checks if hnum1i is greater than hnum2i, where both numbers are in
standard fixed point format (i.e. no number group separators, no
currency and a full stop as a decimal point).
\DTLisFPgteq
\DTLisFPgteq{hnum1i}{hnum2i}
20
This checks if hnum1i is greater than or equal to hnum2i, where both
numbers are in standard fixed point format (i.e. no number group
separators, no currency and a full stop as a decimal point).
\DTLisFPeq
\DTLisFPeq{hnum1i}{hnum2i}
This checks if hnum1i is equal to hnum2i, where both numbers are in
standard fixed point format (i.e. no number group separators, no
currency and a full stop as a decimal point).
\DTLisFPclosedbetween
\DTLisFPclosedbetween{hnumi}{hmini}{hmaxi}
This checks if hnumi lies between hmini and hmaxi (end points included).
All arguments must be numbers in standard fixed point format (i.e. no
number group separators, no currency and a full stop as a decimal point).
\DTLisFPopenbetween
\DTLisFPopenbetween{hnumi}{hmini}{hmaxi}
This checks if hnumi lies between hmini and hmaxi (end points excluded).
All arguments must be numbers in standard fixed point format (i.e. no
number group separators, no currency and a full stop as a decimal point).
\DTLisSubString
\DTLisSubString{hstringi}{hsubstringi}
This checks if hsubstringi is contained in hstringi. The remarks about
\DTLifSubString also apply to \DTLisSubString. This command
performs a case sensitive match.
\DTLisPrefix
\DTLisPrefix{hstringi}{hprefixi}
This checks if hstringi starts with hprefixi. The remarks about
\DTLifStartsWith also apply to \DTLisPrefix. This command
performs a case sensitive match.
21
3 Fixed Point Arithmetic
The datatool-base package uses either the fp or the pgfmath package to
perform fixed point arithmetic, however all numbers must be converted
from the locale dependent format into the format required by the fp or
pgfmath packages. A numerical value (i.e. an integer, a real or currency)
can be converted into a plain decimal number using
\DTLconverttodecimal
\DTLconverttodecimal{hnumi}{hcmdi}
The decimal number will be stored in hcmdi which must be a control
sequence. For example:
\DTLconverttodecimal{1,563.54}{\mynum}
will define \mynum to be 1563.54. The command \mynum can then be
used in any of the arithmetic macros provided by the fp or pgfmath
packages.
The arguments to \DTLconverttodecimal don’t get fully expanded
so, for example,
\def\myval{1.23}
\DTLconverttodecimal{\myval}{\mynum}
will work, but the following won’t work:
\def\myval{1.23}
\def\myotherval{\myval}
\DTLconverttodecimal{\myotherval}{\mynum}
Nor will the following work:
\def\myval{9}
\DTLconverttodecimal{\myval 9}{\mynum}
There are two commands provided to perform the reverse:
\DTLdecimaltolocale
\DTLdecimaltolocale{hnumberi}{hcmdi}
22
This converts a plain decimal number hnumberi (that uses a full stop as
the decimal character and has no number group characters) into a locale
dependent format. The resulting number is stored in hcmdi, which must
be a control sequence. For example:
\DTLdecimaltolocale{6795.3}{\mynum}
will define \mynum to be 6,795.3.
\DTLdecimaltocurrency
\DTLdecimaltocurrency{hnumberi}{hcmdi}
This will convert a plain decimal number hnumberi into a locale
dependent currency format. For example:
\DTLdecimaltocurrency{267.5}{\price}\price
will produce: £267.50.
The currency symbol used by \DTLdecimaltocurrency is initially \$,
but it will use the currency last encountered. So, for example
\DTLifcurrency{\texteuro45.00}{}{}%
\DTLdecimaltocurrency{267.5}{\price}\price
will produce: €267.50. This is because the last currency symbol to be
encountered was \texteuro. You can reset the currency symbol using
the command:
\DTLsetdefaultcurrency
\DTLsetdefaultcurrency{hsymboli}
For example:
\DTLsetdefaultcurrency{\textyen}%
\DTLdecimaltocurrency{267.5}{\price}\price
will produce: ¥267.50
The datatool-base package provides convenience commands which use
\DTLconverttodecimal, and then use the basic macros provided by
the fp/pgfmath package. The resulting value is then converted back into
the locale format using \DTLdecimaltolocale or
\DTLdecimaltocurrency. Note that since these commands use
\DTLconverttodecimal the caveat above regarding expansion also
applies to all the commands.
\DTLadd
\DTLadd{hcmdi}{hnum1i}{hnum2i}
23
\DTLgadd
\DTLgadd{hcmdi}{hnum1i}{hnum2i}
This sets the control sequence hcmdi to hnum1i+hnum2i. \DLTadd sets
hcmdi locally, while \DTLgadd sets hcmdi globally.
For example:
\DTLadd{\result}{3,562.65}{412.2}\result
will produce: 3,974.85. Since \DTLconverttodecimal can convert
currency to a real number, you can also add prices. For example:
\DTLadd{\result}{\pounds3,562.65}{\pounds452.2}\result
produces: £4,014.85.
Note that datatool isn’t aware of exchange rates! If you use different
currency symbols, the last symbol will be used. For example
\DTLadd{\result}{\pounds3,562.65}{\euro452.2}\result
produces: C4,014.85.
Likewise, if one value is a number and the other is a currency, the type of
the last value, hnum2i, will be used for the result. For example:
\DTLadd{\result}{3,562.65}{\$452.2}\result
produces: $4,014.85.
\DTLaddall
\DTLaddall{hcmdi}{hnumber listi}
\DTLgaddall
\DTLgaddall{hcmdi}{hnumber listi}
This sets the control sequence hcmdi to the sum of all the numbers in
hnumber listi. \DLTaddall sets hcmdi locally, while \DTLgaddall sets
hcmdi globally. Example:
\DTLaddall{\total}{25.1,45.2,35.6}\total
produces: 105.9. Note that if any of the numbers in hnumber listi contain a
comma, you must group the number. Example:
\DTLaddall{\total}{{1,525},{2,340},500}\total
24
produces: 4,365.
\DTLsub
\DTLsub{hcmdi}{hnum1i}{hnum2i}
\DTLgsub
\DTLgsub{hcmdi}{hnum1i}{hnum2i}
This sets the control sequence hcmdi to hnum1i−hnum2i. \DLTsub sets
hcmdi locally, while \DTLgsub sets hcmdi globally.
For example:
\DTLsub{\result}{3,562.65}{412.2}\result
will produce: 3,150.45. As with \DTLadd, hnum1i and hnum2i may be
currency.
\DTLmul
\DTLmul{hcmdi}{hnum1i}{hnum2i}
\DTLgmul
\DTLgmul{hcmdi}{hnum1i}{hnum2i}
This sets the control sequence hcmdi to hnum1i×hnum2i. \DLTmul sets
hcmdi locally, while \DTLgmul sets hcmdi globally.
For example:
\DTLmul{\result}{568.95}{2}\result
will produce: 1,137.9. Again, hnum1i or hnum2i may be currency, but
unlike \DTLadd and \DTLsub, currency overrides integer/real. For
example:
\DTLmul{\result}{\pounds568.95}{2}\result
will produce: £1,137.90. Likewise,
\DTLmul{\result}{2}{\pounds568.95}\result
will produce: £1,137.90. Although it doesn’t make sense to multiply two
currencies, datatool will allow
\DTLmul{\result}{\$2}{\pounds568.95}\result
25
which will produce: £1,137.90.
\DTLdiv
\DTLdiv{hcmdi}{hnum1i}{hnum2i}
\DTLgdiv
\DTLgdiv{hcmdi}{hnum1i}{hnum2i}
This sets the control sequence hcmdi to hnum1i÷hnum2i. \DLTdiv sets
hcmdi locally, while \DTLgdiv sets hcmdi globally.
For example:
\DTLdiv{\result}{501}{2}\result
will produce: 250.5. Again, hnum1i or hnum2i may be currency, but the
resulting type will be not be a currency if both hnum1i and hnum2i use
the same currency symbol. For example:
\DTLdiv{\result}{\$501}{\$2}\result
will produce: 250.5. Whereas
\DTLdiv{\result}{\$501}{2}\result
will produce: $250.50.
\DTLabs
\DTLabs{hcmdi}{hnumi}
\DTLgabs
\DTLgabs{hcmdi}{hnumi}
This sets hcmdi to the absolute value of hnumi. \DLTabs sets hcmdi
locally, while \DTLgabs sets hcmdi globally. Example:
\DTLabs{\result}{-\pounds2.50}\result
produces: £2.50.
\DTLneg
\DTLneg{hcmdi}{hnumi}
\DTLgneg
\DTLgneg{hcmdi}{hnumi}
26
This sets hcmdi to the negative of hnumi. \DLTneg sets hcmdi locally,
while \DTLgneg sets hcmdi globally. Example:
\DTLneg{\result}{\pounds2.50}\result
produces: -£2.50.
\DTLsqrt
\DTLsqrt{hcmdi}{hnumi}
\DTLgsqrt
\DTLgsqrt{hcmdi}{hnumi}
This sets hcmdi to the sqrt root of hnumi. \DLTsqrt sets hcmdi locally,
while \DTLgsqrt sets hcmdi globally. Example:
\DTLsqrt{\result}{2}\result
produces: 1.414213562373095042.
\DTLmin
\DTLmin{hcmdi}{hnum1i}{hnum2i}
\DTLgmin
\DTLgmin{hcmdi}{hnum1i}{hnum2i}
This sets the control sequence hcmdi to the minimum of hnum1i and
hnum2i. \DLTmin sets hcmdi locally, while \DTLgmin sets hcmdi globally.
For example:
\DTLmin{\result}{256}{32}\result
produces: 32. Again, hnum1i and hnum2i may be currency. For example:
\DTLmin{\result}{256}{\pounds32}\result
produces: £32, whereas
\DTLmin{\result}{\pounds256}{32}\result
produces: 32. As mentioned above, datatool doesn’t know about exchange
rates, so be careful about mixing currencies. For example:
\DTLmin{\result}{\pounds5}{\$6}\result
27
produces: £5, which may not necessarily be true!
\DTLminall
\DTLminall{hcmdi}{hnumber listi}
\DTLgminall
\DTLgminall{hcmdi}{hnumber listi}
This sets the control sequence hcmdi to the minimum of all the numbers
in hnumber listi. \DLTminall sets hcmdi locally, while \DTLgminall
sets hcmdi globally. Example:
\DTLminall{\theMin}{25.1,45.2,35.6}\theMin
produces: 25.1. Note that if any of the numbers in hnumber listi contain a
comma, you must group the number. Example:
\DTLminall{\theMin}{{1,525},{2,340},500}\theMin
produces: 500.
\DTLmax
\DTLmax{hcmdi}{hnum1i}{hnum2i}
\DTLgmax
\DTLgmax{hcmdi}{hnum1i}{hnum2i}
This sets the control sequence hcmdi to the maximum of hnum1i and
hnum2i. \DLTmax sets hcmdi locally, while \DTLgmax sets hcmdi globally.
For example:
\DTLmax{\result}{256}{32}\result
produces: 256. Again, hnum1i and hnum2i may be currency, but the same
warnings for \DTLmin apply.
\DTLmaxall
\DTLmaxall{hcmdi}{hnumber listi}
\DTLgmaxall
\DTLgmaxall{hcmdi}{hnumber listi}
This sets the control sequence hcmdi to the maximum of all the numbers
in hnumber listi. \DLTmaxall sets hcmdi locally, while \DTLgmaxall
sets hcmdi globally. Example:
\DTLmaxall{\theMax}{25.1,45.2,35.6}\theMax
28
produces: 45.2. Note that if any of the numbers in hnumber listi contain a
comma, you must group the number. Example:
\DTLmaxall{\theMax}{{1,525},{2,340},500}\theMax
produces: 2,340.
\DTLmeanforall
\DTLmeanforall{hcmdi}{hnumber listi}
\DTLgmeanall
\DTLgmeanforall{hcmdi}{hnumber listi}
This sets the control sequence hcmdi to the arithmetic mean of all the
numbers in hnumber listi. \DLTmeanforall sets hcmdi locally, while
\DTLgmeanforall sets hcmdi globally. Example:
\DTLmeanforall{\theMean}{25.1,45.2,35.6}\theMean
produces: 35.3. Note that if any of the numbers in hnumber listi contain a
comma, you must group the number. Example:
\DTLmeanforall{\theMean}{{1,525},{2,340},500}\theMean
produces: 1,455.
\DTLvarianceforall
\DTLvarianceforall{hcmdi}{hnumber listi}
\DTLgvarianceforall
\DTLgvarianceforall{hcmdi}{hnumber listi}
This sets the control sequence hcmdi to the variance of all the numbers in
hnumber listi. \DLTvarianceforall sets hcmdi locally, while
\DTLgvarianceforall sets hcmdi globally. Example:
\DTLvarianceforall{\theVar}{25.1,45.2,35.6}\theVar
produces: 67.38. Again note that if any of the numbers in hnumber listi
contain a comma, you must group the number.
\DTLsdforall
\DTLsdforall{hcmdi}{hnumber listi}
29
\DTLgsdforall
\DTLgsdforall{hcmdi}{hnumber listi}
This sets the control sequence hcmdi to the standard deviation of all the
numbers in hnumber listi. \DLTsdforall sets hcmdi locally, while
\DTLgsdforall sets hcmdi globally. Example:
\DTLsdforall{\theSD}{25.1,45.2,35.6}\theSD
produces: 8.208532146492453016. Note that if any of the numbers in
hnumber listi contain a comma, you must group the number. Example:
\DTLsdforall{\theSD}{{1,525},{2,340},500}\theSD
produces: 752.805862534735216539.
\DTLround
\DTLround{hcmdi}{hnumi}{hnum digitsi}
\DTLground
\DTLground{hcmdi}{hnumi}{hnum digitsi}
This sets hcmdi to hnumi rounded to hnum digitsi after the decimal
character. \DLTround sets hcmdi locally, while \DTLground sets hcmdi
globally. Example:
\DTLround{\result}{3.135276}{2}\result
produces: 3.14.
\DTLtrunc
\DTLtrunc{hcmdi}{hnumi}{hnum digitsi}
\DTLgtrunc
\DTLgtrunc{hcmdi}{hnumi}{hnum digitsi}
This sets hcmdi to hnumi truncated to hnum digitsi after the decimal
character. \DLTtrunc sets hcmdi locally, while \DTLgtrunc sets hcmdi
globally. Example:
\DTLtrunc{\result}{3.135276}{2}\result
produces: 3.13.
30
\DTLclip
\DTLclip{hcmdi}{hnumi}
\DTLgclip
\DTLgclip{hcmdi}{hnumi}
This sets hcmdi to hnumi with all unnecessary 0’s removed. \DLTclip
sets hcmdi locally, while \DTLgclip sets hcmdi globally.
31
4 Strings
Strings are considered to be anything non-numerical. The datatool
package loads the substr package, so you can use the commands defined
in that package to determine if one string is contained in another string.
In addition, the datatool provides the following macros:
\DTLsubstitute
\DTLsubstitute{hcmdi}{horiginali}{hreplacementi}
This replaces the first occurrence of horiginali in hcmdi with hreplacementi.
Note that hcmdi must be the name of a command. For example:
\def\mystr{abcdce}\DTLsubstitute{\mystr}{c}{z}\mystr
produces: abzdce.
\DTLsubstituteall
\DTLsubstituteall{hcmdi}{horiginali}{hreplacementi}
This replaces all occurrences of horiginali in hcmdi with hreplacementi,
where again, hcmdi must be the name of a command. For example:
\def\mystr{abcdce}\DTLsubstituteall{\mystr}{c}{z}\mystr
produces: abzdze.
\DTLsplitstring
\DTLsplitstring{hstringi}{hsplit texti}{hbefore cmdi}{hafter cmdi}
This splits hstringi at the first occurrence of hsplit texti and stores the
before part in the command hbefore cmdi and the after part in the
command hafter cmdi. For example:
\DTLsplitstring{abcdce}{c}{\beforepart}{\afterpart}%
Before part: ‘‘\beforepart’’. After part: ‘‘\afterpart’’
produces: Before part: “ab”. After part: “dce”. Note that for
\DTLsplitstring, hstringi is not expanded, so
\def\mystr{abcdce}%
\DTLsplitstring{\mystr}{c}{\beforepart}{\afterpart}%
Before part: ‘‘\beforepart’’. After part: ‘‘\afterpart’’
32
produces: Before part: “abcdce”. After part: “”. If you want the string
expanded, you will need to use \expandafter:
\def\mystr{abcdce}%
\expandafter\DTLsplitstring\expandafter
{\mystr}{c}{\beforepart}{\afterpart}%
Before part: ‘‘\beforepart’’. After part: ‘‘\afterpart’’
which produces: Before part: “ab”. After part: “dce”.
\DTLinitials
\DTLinitials{hstringi}
This converts hstringi (typically a name) into initials. For example:
\DTLinitials{Mary Ann}
produces: M.A. (including the final full stop). Note that
\DTLinitials{Mary-Ann}
produces: M.-A. (including the final full stop). Be careful if the initial
letter has an accent. The accented letter needs to be placed in a group, if
you want the initial to also have an accent, otherwise the accent
command will be ignored. For example:
\DTLinitials{{\’E}lise Adams}
produces: É.A., whereas
\DTLinitials{\’Elise Adams}
produces: E.A. In fact, any command which appears at the start of the
name that is not enclosed in a group will be ignored. For example:
\DTLinitials{\MakeUppercase{m}ary ann}
produces: m.a., whereas
\DTLinitials{{\MakeUppercase{m}}ary ann}
produces: M.a., but note that
\DTLinitials{\MakeUppercase{mary ann}}
produces: mary ann.
\DTLstoreinitials
\DTLstoreinitials{hstringi}{hcmdi}
This converts hstringi into initials and stores the result in hcmdi which
must be a command name. The remarks about \DTLinitials also
relate to \DTLstoreinitials. For example
\DTLstoreinitials{Marie-{\’E}lise del~Rosario}{\theInitials}\theInitials
33
produces: M.-É.d.R.
Both the above commands rely on the following to format the initials:
\DTLafterinitials
\DTLafterinitials
This indicates what to do at the end of the initials. This simply does a full
stop by default.
\DTLbetweeninitials
\DTLbetweeninitials
This indicates what to do between initials. This does a full stop by
default.
\DTLinitialhyphen
\DTLinitialhyphen
This indicates what to do at a hyphen. This simply does a hyphen by
default, but can be redefined to do nothing to prevent the hyphen
appearing in the initials.
\DTLafterinitialbeforehyphen
\DTLafterinitialbeforehyphen
This indicates what to do between an initial and a hyphen. This simply
does a full stop by default.
For example
\renewcommand*{\DTLafterinitialbeforehyphen}{}%
\DTLinitials{Marie-{\’E}lise del~Rosario}
produces: M-É.d.R. whereas
\renewcommand*{\DTLafterinitialbeforehyphen}{}%
\renewcommand*{\DTLafterinitials}{}%
\renewcommand*{\DTLbetweeninitials}{}%
\renewcommand*{\DTLinitialhyphen}{}%
\DTLinitials{Marie-{\’E}lise del~Rosario}
produces: MÉdR
34
5 Databases
The datatool package provides a means of creating and loading databases.
Once a database has been created (or loaded), it is possible to iterate
through each row of data, to make it easier to perform repetitive actions,
such as mail merging.
Whilst TEX is an excellent typesetting language, it is not designed as a
database management system, and attempting to use it as such is like
trying to fasten a screw with a knife instead of a screwdriver: it can be
done, but requires great care and is more time consuming. Version 2.0
of the datatool package uses a completely different method of storing the
data to previous versions.a As a result, the code is much more efficient,
however, large databases and complex operations will still slow the
time taken to process your document. Therefore, if you can, it is better
to do the complex operations using whatever system created the data
in the first place.
a Thanks
to Morten Høgholm for the suggestion.
Some advanced commands for accessing database information are
described in section 5.11, but using TEX is nowhere near as efficient as,
say, using a SQL database, so don’t expect too much from this package.
5.1 Creating a New Database
\DTLnewdb
\DTLnewdb{hdb namei}
This command creates a new empty database called hdb namei. You can
test if a database is empty using:
\DTLifdbempty
\DTLifdbempty{hdb namei}{htrue parti}{hfalse parti}
If the database called hdb namei is empty, do htrue parti, otherwise do
hfalse parti.
35
\DTLrowcount
\DTLrowcount{hdb namei}
This command displays the number of rows in the database called hdb
namei.
\DTLcolumncount
\DTLcolumncount{hdb namei}
This command displays the number of columns (or keys) in the database
called hdb namei.
\DTLnewrow
\DTLnewrow{hdb namei}
This command starts a new row in the database called hdb namei. This
new row becomes the current row when adding new entries.
For example, the following creates an empty database called mydata:
\DTLnewdb{mydata}
The following tests if the database is empty:
\DTLifdbempty{mydata}{empty}{not empty}!
This produces: empty!
The following adds an empty row to the database, this is the first row of
the database:
\DTLnewrow{mydata}
Note that even though the only row in the database is currently empty,
the database is no longer considered to be empty:
\DTLifdbempty{mydata}{empty}{not empty}!
This now produces: not empty! The row count is given by
\DTLrowcount{mydata}
which produces: 1. The column count is given by
\DTLcolumncount{mydata}
which produces: 0.
\DTLnewdbentry
\DTLnewdbentry{hdb namei}{hkeyi}{hvaluei}
36
This creates a new entry with the identifier hkeyi whose value is hvaluei
and adds it to the last row of the database called hdb namei. For example:
\DTLnewdbentry{mydata}{Surname}{Smith}
\DTLnewdbentry{mydata}{FirstName}{John}
Adds an entry with identifier Surname and value Smith to the last row
of the database named mydata, and then adds an entry with identifier
FirstName and value John. Note that the key should not contain any
fragile commands. It is generally best to only use non-active characters in
the key.
The value isn’t expanded by default, but you can change this using the
declaration:
\dtlexpandnewvalue
\dtlexpandnewvalue
This can be localised by placing it in a group, or you can switch back
using:
\dtlnoexpandnewvalue
\dtlnoexpandnewvalue
B
Note that database entries can’t contain paragraph breaks as many
of the macros used by datatool are short commands. If you do need
a paragraph break in an entry, you can instead use the command:
\DTLpar
\DTLpar
For example:
\DTLnewdbentry{mydata}{Description}{First paragraph.\DTLpar
Second paragraph.}
\DTLaddentryforrow
\DTLaddentryforrow{hdbi}{hassign
listi}{hconditioni}{hkeyi}{hvaluei}
This adds the entry with the key given by hkeyi and value given by
hvaluei to the first row in the database hdbi which satisfies the condition
given by hconditioni. The hassign listi argument is the same as for
\DTLforeach (described in section 5.4) and may be used to set the
values which are to be tested in hconditioni (where, again, hconditioni is
the same as for \DTLforeach). For example:
37
\DTLaddentryforrow{mydata}{\firstname=FirstName,\surname=Surname}%
{\DTLiseq{\firstname}{John}\and\DTLiseq{\surname}{Smith}}%
{Score}{75}
Note that unlike \DTLnewdbentry, the value is always expanded when
adding an entry using \DTLaddentryforrow.
\DTLsetheader
\DTLsetheader{hdbi}{hkeyi}{hheaderi}
This assigns a header for a given key in the database named hdbi. This is
used by \DTLdisplaydb and \DTLdisplaylongdb in the header row
(see section 5.3). If you don’t assign a header, the header will be given by
the key. For example:
\DTLsetheader{mydata}{Price}{Price (\$)}
5.2 Loading a Database from an External ASCII File
Instead of using the commands described in section 5.1 to create a new
database, you can load a database from an external ASCII file using:
\DTLloaddb
\DTLloaddb[hoptionsi]{hdb namei}{hfilenamei}
Make sure your document uses the same encoding as hfilenamei. For
example, if hfilenamei is UTF-8, then include the following in your document:
\usepackage[utf8]{inputenc}
This creates a new database called hdb namei, and fills it with the entries
given in the file hfilenamei. The filename may have a header row at the
start of the file, which provides the hkeyi when creating a new database
entry using \DTLnewdbentry. The optional argument hoptionsi is a
key=value list of options. Available options are:
noheader This is a boolean value and indicates if the file does not contain
a header. If no value is supplied, true is assumed (i.e. the file
doesn’t contain a header row). If this option is omitted, it is
assumed that the file contains a header row.
keys This is a comma-separated list of keys to use, where the keys are
listed in the same order as the columns. If the file has a header,
38
these keys will override the values given in the header row. If the
file has no header row and no keys are supplied in hoptionsi, then
the keys will be given by \dtldefaultkeyhni, where hni is the
column number and \dtldefaultkey defaults to “Column”.
Note that the list of keys must be delimited by braces since they
contain commas. For example:
\dtldefaultkey
\DTLloaddb[noheader,keys={Temperature,Time,T2G}]{data}{data.csv}
headers This is a comma-separated list of headers. If not supplied, the
header will be the same as that given in the header row, or the key
if there is no header row. Note that the list of headers must be
delimited by braces since they contain commas. For example:
\DTLloaddb[noheader,keys={Temperature,Time,T2G},%
headers={\shortstack{Incubation\\Temperature},%
\shortstack{Incubation\\Time},%
\shortstack{Time to\\Growth}}]{data}{data.csv}
omitlines This should be a non-negative integer that specifies how many
rows to skip at the start of the file.
By default, the entries in the database must be separated by a comma,
and optionally delimited by the double quote character ("). The
separator can be changed to a tab separator using the command:
\DTLsettabseparator
\DTLsettabseparator
To set the separator to a character other than a tab, you need to use
\DTLsetseparator
\DTLsetseparator{hcharacteri}
The delimiter can be changed using
\DTLsetdelimiter
\DTLsetdelimiter{hcharacteri}
For example, suppose you have a file called mydata.csv which contains
the following:
FirstName,Surname,Score
John,"Smith, Jr",68
Jane,Brown,75
Andy,Brown,42
Z\"oe,Adams,52
39
then
\DTLloaddb{mydata}{mydata.csv}
is equivalent to:
\DTLnewdb{mydata}
\DTLnewrow{mydata}%
\DTLnewdbentry{mydata}{FirstName}{John}%
\DTLnewdbentry{mydata}{Surname}{Smith, Jr}%
\DTLnewdbentry{mydata}{Score}{68}%
\DTLnewrow{mydata}%
\DTLnewdbentry{mydata}{FirstName}{Jane}%
\DTLnewdbentry{mydata}{Surname}{Brown}%
\DTLnewdbentry{mydata}{Score}{75}%
\DTLnewrow{mydata}%
\DTLnewdbentry{mydata}{FirstName}{Andy}%
\DTLnewdbentry{mydata}{Surname}{Brown}%
\DTLnewdbentry{mydata}{Score}{42}%
\DTLnewrow{mydata}%
\DTLnewdbentry{mydata}{FirstName}{Z\"oe}%
\DTLnewdbentry{mydata}{Score}{52}%
\DTLnewdbentry{mydata}{Surname}{Adams}%
Note that the entry Smith, Jr had to be delimited in mydata.csv
using the double quote character since it contained a comma which is
used as the separator. The percent symbol % can be used as a comment
character within the file.
The file used in the above example contained a LATEX command, namely
\". When using \DTLloaddb all the special characters that appear in the
command retain their LATEX meaning when the file is loaded. It is likely
however that the data file may have been created by another application
that is not TEX-aware, such as a spreadsheet application. For example,
suppose you have a file called, say, products.csv which looks like:
Product,Cost
Fruit & Veg,$1.25
Stationary,$0.80
This file contains two of TEX’s special characters, namely & and $. In this
case, if you try to load the file using \DTLloaddb, you will encounter
errors. Instead you can use:
\DTLloadrawdb
\DTLloadrawdb[hoptionsi]{hdb namei}{hfilenamei}
This is the same as \DTLloaddb except that it maps nine of the ten
special characters onto commands which produce that symbol. The only
character that retains its active state is the backslash character, so you will
40
still need to check the file for backslash characters. The mappings used
are listed in Table 5.1. So using the file products.csv, as described
above,
\DTLloadrawdb{mydata}{products.csv}
is equivalent to:
\DTLnewdb{mydata}
\DTLnewrow{mydata}%
\DTLnewdbentry{mydata}{Product}{Fruit \& Veg}%
\DTLnewdbentry{mydata}{Cost}{\$1.25}%
\DTLnewrow{mydata}%
\DTLnewdbentry{mydata}{Product}{Stationary}%
\DTLnewdbentry{mydata}{Cost}{\$0.80}%
Table 5.1: Special character mappings used by \DTLloadrawdb (note that
the backslash retains its active state)
Character
%
$
&
#
_
{
}
~
^
Mapping
\%
\$
\&
\#
\_
\{
\}
\textasciitilde
\textasciicircum
It may be that there are other characters that require mapping. For
example, the file products.csv may instead look like:
Product,Cost
Fruit & Veg,£1.25
Stationary,£0.80
The pound character is not an internationally standard keyboard
character, and does not generally achieve the desired effect when used in
a LATEX document. It may therefore be necessary to convert this symbol to
an appropriate control sequence. This can be done using the command:
\DTLrawmap
\DTLrawmap{hstringi}{hreplacementi}
For example:
41
\DTLrawmap{£}{\pounds}
will replace all occurrences1 of £ with \pounds. Naturally, the mappings
must be set prior to loading the data with \DTLloadrawdb.
Note that the warning in the previous section about no paragraph
breaks in an entry also applies to entries loaded from a database. If
you do need a paragraph break, use \DTLpar instead of \par, but remember that each row of data in an external data file must not have a
line break.
5.3 Displaying the Contents of a Database
Once you have created a database, either loading it from an external file,
as described in section 5.2, or using the commands described in
section 5.1, you can display the entire database in a tabular or longtable
environment.
\DTLdisplaydb
\DTLdisplaydb[homit listi]{hdbi}
This displays the database given by hdbi in a tabular environment. The
first row displays the headers for the database in bold, the subsequent
rows display the values for each key in each row of the database. The
optional argument homit listi is a comma-separated list of column keys to
omit. (All columns displayed by default.)
\DTLdisplaylongdb
\DTLdisplaylongdb[hoptionsi]{hdbi}
This is like \DTLdisplaydb except that it uses the longtable environment
instead of the tabular environment. Note that if you use this command,
you must load the longtable package, as it is not loaded by datatool. The
optional argument hoptionsi is a comma-separated list of key=value pairs.
The following keys are available:
caption The caption for the longtable.
contcaption The continuation caption.
shortcaption The caption to be used in the list of figures.
1 when
it is loaded into the LATEX database, it does not modify the data file!
42
label The label for this table.
omit Comma-separated list of column keys to omit.
foot The longtable’s foot.
lastfoot The foot for the last page of the longtable.
For example, suppose I have a database called iris, then I can display
the contents in a longtable using:
\DTLdisplaylongdb[%
caption={Iris Data},%
label={tab:iris},%
contcaption={Iris Data (continued)},%
foot={\em Continued overleaf},%
lastfoot={}%
]{iris}
I can then reference the table using \ref{tab:iris}.
See the longtable documentation for details on how to change the longtable
settings, such as how to change the table so that it is left aligned instead
of centred on the page.
Note that if you want more control over the way the data is displayed,
for example, you want to filter rows or columns, you will need to use
\DTLforeach, described in section 5.4.
Example 1 (Displaying the Contents of a Database)
Suppose I have a file called t2g.csv that contains the following:
40,120,40
40,90,60
35,180,20
55,190,40
This represents time to growth data, where the first column is the
incubation temperature, the second column is the incubation time and the
third column is the time to growth. This file has no header row, so when
it is loaded, the noheaders option is required. Note that \DTLdisplaydb
only puts the data in a tabular environment, so \DTLdisplaydb needs to
be put in a table environment with a caption to make it a float.
First load the data base, setting the keys and headers:
\DTLloaddb[noheader,%
keys={Temperature,Time,T2G},%
headers={\shortstack{Incubation\\Temperature},%
\shortstack{Incubation\\Time},\shortstack{Time to\\Growth}}%
]{t2g}{t2g.csv}
43
Now display the data in a table:
\begin{table}[htbp]
\caption{Time to Growth Data}
\centering
\DTLdisplaydb{t2g}
\end{table}
The result is shown in Table 5.2.
Table 5.2: Time to Growth Data
Incubation
Temperature
40
40
35
55
Incubation
Time
120
90
180
190
Time to
Growth
40
60
20
40
Each column in the database has an associated data type which indicates
what type of data is in that column. This may be one of: string, integer,
real number or currency. If a column contains more than one type, the
data type is determined as follows:
• If the column contains at least one string, then the column data type
is string.
• If the column doesn’t contain a string, but contains at least one
currency, then the column data type is currency.
• If the column contains only real numbers and integers, the column
data type is real number.
• The column data type is integer if the column only contains
integers.
The column data type is updated whenever a new entry is added to the
database. Note that the column data type is not adjusted when an entry
is removed from the database.
The column alignments used by \DTLdisplaydb are given by:
\dtlstringalign
\dtlstringalign
The string alignment defaults to l (left aligned).
44
\dtlintalign
\dtlintalign
The integer alignment defaults to r (right aligned).
\dtlrealalign
\dtlrealalign
The alignment for real numbers defaults to r (right aligned).
\dtlcurrencyalign
\dtlcurrencyalign
The currency alignment defaults to r (right aligned).
You can redefine these to change the column alignments. For example, if
you want columns containing strings to have the alignment p{2in},
then you can redefine \dtlstringalign as follows:
\renewcommand{\dtlstringalign}{p{2in}}
You can’t use siunitx’s S column alignment with either \DTLdisplaydb
or \DTLdisplaylongdb.
Instead, you will need to use
\DTLforeach. The siunitx documentation provides an example.
\dtlbeforecols
\dtlbetweencols
\dtlaftercols
In addition to the \dtlhtypeialign commands above, you can also
modify the tabular column styles by redefining \dtlbeforecols,
\dtlbetweencols and \dtlaftercols. For example, to place a
vertical line before the start of the first column and after the last column,
do:
\renewcommand{\dtlbeforecols}{|}
\renewcommand{\dtlaftercols}{|}
If you additionally want vertical lines between columns, do:
\renewcommand{\dtlbetweencols}{|}
Limited modifications can be made to the way the data is displayed with
\DTLdisplaydb and \DTLdisplaylongdb. The commands
controlling the formatting are described below. If a more complicated
layout is required, you will need to use \DTLforeach described in
section 5.4.
\dtlheaderformat
\dtlheaderformat{hheaderi}
45
This indicates how to format a column header, where the header is given
by hheaderi. This defaults to
\null\hfil\textbf{hheaderi}\hfil\null.
\dtlstringformat
\dtlstringformat{htexti}
This specifies how to format each entry in the columns that contain
strings. This defaults to just displaying htexti.
\dtlintformat
\dtlintformat{htexti}
This specifies how to format each entry in the columns that contain only
integers. This defaults to just displaying htexti.
\dtlrealformat
\dtlrealformat{htexti}
This specifies how to format each entry in the columns that contain only
real numbers or a mixture of real numbers and integers. This defaults to
just displaying htexti.
\dtlcurrencyformat
\dtlcurrencyformat{htexti}
This specifies how to format each entry in the columns that contain only
currency or currency mixed with real numbers and/or integers. This
defaults to just displaying htexti.
\dtldisplaystarttab
\dtldisplaystarttab
This is a hook to add something at the beginning of the tabular
environment. This defaults to nothing.
\dtldisplayendtab
\dtldisplayendtab
This is a hook to add something at the end of the tabular environment.
This defaults to nothing.
\dtldisplayafterhead
\dtldisplayafterhead
46
This is a hook to add something after the header row, before the first row
of data. This defaults to nothing.
\dtldisplaystartrow
\dtldisplaystartrow
This is a hook to add something at the start of each row, but not including
the header row or the first row of data. This defaults to nothing.
If you want to use the booktabs package, you can redefine the above three
commands to use \toprule, \midrule and \bottomrule:
\renewcommand{\dtldisplaystarttab}{\toprule}
\renewcommand{\dtldisplayafterhead}{\midrule}
\renewcommand{\dtldisplayendtab}{\\\bottomrule}
Example 2 (Balance Sheet)
Suppose you have a file called balance.csv that contains the following:
Description,In,Out,Balance
Travel expenses,,230,-230
Conference fees,,400,-630
Grant,700,,70
Train fare,,70,0
The data can be loaded using:
\DTLloaddb[headers={Description,In (\pounds),Out (\pounds),Balance
(\pounds)}]{balance}{balance.csv}
Suppose I want negative numbers to be displayed in red. I can do this by
redefining \dtlrealformat to check if the entry is negative. For
example:
\begin{table}[htbp]
\caption{Balance Sheet}
\renewcommand*{\dtlrealformat}[1]{\DTLiflt{#1}{0}{\color{red}}{}#1}
\centering
\DTLdisplaydb{balance}
\end{table}
This produces Table 5.3.
47
Table 5.3: Balance Sheet
Description
Travel expenses
Conference fees
Grant
Train Fare
In (£)
Out (£)
230.00
400.00
700.00
70.00
Balance (£)
-230.00
-630.00
70.00
0.00
5.4 Iterating Through a Database
Once you have created a database, either loading it from an external file,
as described in section 5.2, or using the commands described in
section 5.1, you can then iterate through each row of the database and
access elements in that row.
\DTLforeach
\DTLforeach[hconditioni]{hdb namei}{hassign listi}{htexti}
\DTLforeach*
\DTLforeach*[hconditioni]{hdb namei}{hassign listi}{htexti}
This will iterate through each row of the database called hdb namei,
applying htexti to each row of the database where hconditioni is met. The
argument hassign listi is a comma separated list of hcmdi=hkeyi pairs. At
the start of each row, each command hcmdi in hassign listi will be set to
the value of the entry given by hkeyi. These commands may then be used
in htexti.
Note that this assignment is done globally to ensure that
\DLTforeach works correctly in a tabular environment. Since you
may want to use the same set of commands in a later \DTLforeach,
the commands are not checked to determine if they already exist. It
is therefore important that you check you are not using an existing
command whose value should not be changed.
The optional argument hconditioni is a condition in the form allowed by
\ifthenelse. This includes the commands provided by the ifthen
package (such as \not, \and, \or), as well as the commands described
in section 2.2. The default value of hconditioni is \boolean{true}.
The starred version \DTLforeach* is a read-only version. If you want to
modify the database using any of the commands described in section 5.6,
you must use the unstarred version. The starred version is faster.
48
As is generally the case with command arguments, verbatim (for example, using \verb or the verbatim environment) can’t be used in any
of the arguments of \DTLforeach, specifically verbatim can’t be used
in htexti.
There are also environment alternatives:
DTLenvforeach
\begin{DTLenvforeach}[hconditioni]{hdb namei}{hassign listi}
DTLenvforeach*
\begin{DTLenvforeach*}[hconditioni]{hdb namei}{hassign listi}
However, note that since these environments gather the contents of their
body, they also suffer from the above limitation.
Verbatim can’t be used in the body of DTLenvforeach or DTLenvforeach*.
Example 3 (Student scores)
Suppose you have a data file called studentscores.csv that contains
the following:
FirstName,Surname,StudentNo,Score
John,"Smith, Jr",102689,68
Jane,Brown,102647,75
Andy,Brown,103569,42
Z\"oe,Adams,105987,52
Roger,Brady,106872,58
Clare,Verdon,104356,45
and you load the data into a database called scores using:
\DTLloaddb{scores}{studentscores.csv}
you can then display the database in a table as follows:
\begin{table}[htbp]
\caption{Student scores}
\centering
\begin{tabular}{llr}
\bfseries First Name &
\bfseries Surname &
\bfseries Score (\%)%
\DTLforeach{scores}{%
\firstname=FirstName,\surname=Surname,\score=Score}{%
49
\\
\firstname & \surname & \score}
\end{tabular}
\end{table}
This produces Table 5.4. (Note that since I didn’t need the student
registration number, I didn’t bother to assign a command to the key
StudentNo.)
Table 5.4: Student scores
First Name
John
Jane
Andy
Zöe
Roger
Clare
DTLrowi
DTLrowii
DTLrowiii
Surname
Smith, Jr
Brown
Brown
Adams
Brady
Verdon
Score (%)
68
75
42
52
58
45
The macro \DTLforeach may be nested up to three times. Each level
uses the corresponding counters: DTLrowi, DTLrowiiand DTLrowiiiwhich
keep track of the current row.
Note that these counters are only incremented when hconditioni is satisfied, therefore they will not have the correct value in hconditioni. These
counters are incremented using \refstepcounter before the start
of htexti, so they may be referenced using \label, however remember that \label references the last counter to be incremented using
\refstepcounter in the current scope. The \label should therefore
be the first command in htexti to ensure that it references the current
row counter.
\DTLcurrentindex
\DTLcurrentindex
At the start of each iteration in \DTLforeach, \DTLcurrentindex is
set to the arabic value of the current row counter. Note that this is only
set after the condition is tested, so it should only be used in the body of
\DTLforeach not in the condition. It is also only set locally, so if you use
it in a tabular environment, it can only be used before the first instance of
\\ or & in the current iteration.
Within the body of \DTLforeach (i.e. within htexti) the following
conditionals may be used:
50
\DTLiffirstrow
\DTLiffirstrow{htrue parti}{hfalse parti}
If the current row is the first row, then do htrue parti, otherwise do hfalse
parti.
\DTLifoddrow
\DTLifoddrow{htrue parti}{hfalse parti}
If the current row number is an odd number, then do htrue parti,
otherwise do hfalse parti.
\DTLsavelastrowcount
\DTLsavelastrowcount{hcmdi}
This command will store the value of the row counter used in the last
occurrence of \DTLforeach in the control sequence hcmdi.
\DTLforeachkeyinrow
\DTLforeachkeyinrow{hcmdi}{htexti}
This iterates through each key in the current row, (globally) assigns hcmdi
to the value of that key, and does htexti (hcmdi must be a control sequence
and may be used in htexti). This command may only be used in the body
of \DTLforeach. At each iteration, \DTLforeachkeyinrow sets
\dtlkey to the current key, \dtlcol to the current column index,
\dtltype to the data type for the current column, and \dtlheader to
the header for the current column. Note that \dtltype corresponds to
the column type but if the entries in the column have mixed types, it may
not correspond to the type of the current entry.
\dtlbreak
\dtlbreak
You can break out of most of the loops provided by datatool using
\dtlbreak. Note, however, that it doesn’t break the loop until the end
of the current iteration. There is no provision for a next or continue
style command.
Additional loop commands provided by datatool are described in the
documented code (datatool.pdf).
Example 4 (Student Scores—Labelling)
In the previous example, the student scores, stored in the database
51
scores were placed in a table. In this example the table will be modified
slightly to number each student according to the row. Suppose I also
want to identify which row Jane Brown is in, and reference it in the text.
The easiest way to do this is to construct a label on each row which
uniquely identifies that student. The label can’t simply be constructed
from the surname, as there are two students with the same surname. In
order to create a unique label, I can either construct a label from both the
surname and the first name, or I can use the student’s registration
number, or I can use the student’s score, since all the scores are unique.
The former method will cause a problem since one of the names (Zöe)
contains an accent command. Although the registration numbers are all
unique, they are not particularly memorable, so I shall instead use the
scores.
\begin{table}[htbp]
\caption{Student scores}
\centering
\begin{tabular}{cllc}
\bfseries Row &
\bfseries First Name &
\bfseries Surname &
\bfseries Score (\%)%
\DTLforeach*{scores}{%
\firstname=FirstName,\surname=Surname,\score=Score}{%
\label{row:\score}\\\theDTLrowi &
\firstname & \surname & \score}%
\end{tabular}
\end{table}
Jane Brown scored the highest (75\%), her score can be seen on
row~\ref{row:75}.
This produces Table 5.5 and the following text: Jane Brown scored the
highest (75%), her score can be seen on row 2.
Notes:
• the \label command is placed before \\ to ensure that it is in the
same scope as the command \refstepcounter{DTLrowi}.
• To avoid unwanted spaces the end of line characters are
commented out with the percent (%) symbol.
Example 5 (Filtering Rows)
As mentioned earlier, the optional argument hconditioni of \DTLforeach
provides a means to exclude certain rows. This example uses the
52
Table 5.5: Student scores
Row
1
2
3
4
5
6
First Name
John
Jane
Andy
Zöe
Roger
Clare
Surname
Smith, Jr
Brown
Brown
Adams
Brady
Verdon
Score (%)
68
75
42
52
58
45
database defined in example 3, but only displays the information for
students whose marks are above 60. At the end of the table,
\DTLsavelastrowcount is used to store the number of rows in the
table. (Note that \DTLsavelastrowcount is outside of \DTLforeach.)
\begin{table}[htbp]
\caption{Top student scores}
\centering
\begin{tabular}{llr}
\bfseries First Name &
\bfseries Surname &
\bfseries Score (\%)%
\DTLforeach*[\DTLisgt{\score}{60}]{scores}{%
\firstname=FirstName,\surname=Surname,\score=Score}{%
\\
\firstname & \surname & \score}
\end{tabular}
\DTLsavelastrowcount{\n}%
\n\ students scored above 60\%.
\end{table}
This produces Table 5.6. Note that in this example, I could have specified
the condition as \score>60 since all the scores are integers, however, as
it’s possible that an entry may feasibly have a decimal score I have used
\DTLisgt instead.
Table 5.6: Top student scores
First Name Surname Score (%)
John
Smith, Jr
68
Jane
Brown
75
2 students scored above 60%.
Suppose now, I only want to display the scores for students whose
surname begins with ‘B’. I can do this as follows:
53
\begin{table}[htbp]
\caption{Student scores (B)}
\centering
\begin{tabular}{llr}
\bfseries First Name &
\bfseries Surname &
\bfseries Score (\%)%
\DTLforeach*[\DTLisopenbetween{\surname}{B}{C}]{scores}{%
\firstname=FirstName,\surname=Surname,\score=Score}{%
\\
\firstname & \surname & \score}
\end{tabular}
\end{table}
This produces Table 5.7.
Table 5.7: Student scores (B)
First Name
Jane
Andy
Roger
Surname
Brown
Brown
Brady
Score (%)
75
42
58
Example 6 (Breaking Out of a Loop)
Suppose I only want to display the first three rows of a database. I could
do:2
\DTLforeach*[\value{DTLrowi}<3]{scores}%
{\firstname=FirstName,\surname=Surname,\score=Score}{%
\\\firstname & \surname & \score
}
However, this isn’t very efficient, as it still has to iterate through the
entire database, checking if the condition is met. If the database has over
100 entries, this will slow the time taken to create the table. It would
therefore be much more efficient to break out of the loop when row count
exceeds 3:
\begin{table}[htbp]
\caption{First Three Rows}
\centering
\begin{tabular}{llr}
2 Recall
that DTLrowi is incremented after the condition is tested, so it will be out by 1
when the condition is tested which is why <3 is used instead of <4.
54
\bfseries First Name & \bfseries Surname & \bfseries Score (\%)%
\DTLforeach*{scores}%
{\firstname=FirstName,\surname=Surname,\score=Score}{%
\ifthenelse{\DTLcurrentindex=3}{\dtlbreak}{}%
\\\firstname & \surname & \score
}%
\end{tabular}
\end{table}
This produces Table 5.8. Note that the loop is not broken until the end of
the current iteration, so even though \dtlbreak occurs at the start of
the third row, the loop isn’t finished until the third row is completed.
(Recall that \DTLcurrentindex must be used before the first instance
of \\ or &.) Alternatively, you can use DTLrowi instead:
\DTLforeach{scores}%
{\firstname=FirstName,\surname=Surname,\score=Score}{%
\\\firstname & \surname & \score
\ifthenelse{\value{DTLrowi}=3}{\dtlbreak}{}%
}%
Table 5.8: First Three Rows
First Name
John
Jane
Andy
Surname
Smith, Jr
Brown
Brown
Score (%)
68
75
42
Example 7 (Stripy Tables)
This example uses the same database as in the previous examples. It
requires the colortbl package, which provides the command \rowcolor.
The command \DTLifoddrow is used to produce a striped table.
\begin{table}[htbp]
\caption{A stripy table}\label{tab:stripy}
\centering
\begin{tabular}{llc}
\bfseries First Name &
\bfseries Surname &
\bfseries Score (\%)%
\DTLforeach*{scores}{%
\firstname=FirstName,\surname=Surname,\score=Score}{%
\\\DTLifoddrow{\rowcolor{blue}}{\rowcolor{green}}%
55
\firstname & \surname & \score}%
\end{tabular}
\end{table}
This produces Table 5.9.
Table 5.9: A stripy table
First Name
John
Jane
Andy
Zöe
Roger
Clare
Surname
Smith, Jr
Brown
Brown
Adams
Brady
Verdon
Score (%)
68
75
42
52
58
45
Example 8 (Two Database Rows per Tabular Row)
In order to save space, you may want two database rows per tabular row,
when displaying a database in a tabular environment. This can be
accomplished using \DTLifoddrow. For example
\begin{table}[htbp]
\caption{Two database rows per tabular row}
\centering
\begin{tabular}{llcllc}
\bfseries First Name &
\bfseries Surname &
\bfseries Score (\%) &
\bfseries First Name &
\bfseries Surname &
\bfseries Score (\%)%
\DTLforeach*{scores}{\firstname=FirstName,\surname=Surname,\score=Score}{%
\DTLifoddrow{\\}{&}%
\firstname & \surname & \score}%
\end{tabular}
\end{table}
produces Table 5.10
(To order column-wise, instead of row-wise, see example 18.)
56
Table 5.10: Two database rows per tabular row
First Name
John
Andy
Roger
Surname
Smith, Jr
Brown
Brady
Score (%)
68
42
58
First Name
Jane
Zöe
Clare
Surname
Brown
Adams
Verdon
Score (%)
75
52
45
Example 9 (Iterating Through Keys in a Row)
Suppose you have lots of columns in your database, and you want to
display them all without having to set a variable for each column. You
can leave the assignment list in \DTLforeach blank, and iterate through
the keys using \DTLforeachkeyinrow. For example:
\begin{table}[htbp]
\caption{Student Scores (Iterating Through Keys)}
\centering
\begin{tabular}{llll}
\bfseries First Name & \bfseries Surname &
\bfseries Registration No. &
\bfseries Score (\%)%
\DTLforeach*{scores}{}{%
\\\gdef\doamp{\gdef\doamp{&}}%
\DTLforeachkeyinrow{\thisValue}{\doamp\thisValue}}%
\end{tabular}
\end{table}
This produces Table 5.11.
Table 5.11: Student Scores (Iterating Through Keys)
First Name
John
Jane
Andy
Zöe
Roger
Clare
Surname
Smith, Jr
Brown
Brown
Adams
Brady
Verdon
Registration No.
102689
102647
103569
105987
106872
104356
Score (%)
68
75
42
52
58
45
Note that the & must be between columns, so I have defined a command
called \doamp that on first use redefines itself to do &. So, for each row, at
the start of the key iteration, \doamp does nothing, and on subsequent
iterations it does &. This ensures that the correct number of &s are used.
Since each cell in the tabular environment is scoped, \gdef is needed
instead of \def.
In the above, I needed to know how many columns are in the database,
and the order that the headings should appear. If you are unsure, you can
57
use \dtlforeachkey to determine the number of columns and to
display the header row. For example:
\begin{table}[htbp]
\caption{Student Scores}
\centering
% Work out the column alignments.
\def\colalign{}%
\dtlforeachkey(\theKey,\theCol,\theType,\theHead)\in{scores}\do
{\edef\colalign{\colalign l}}%
% Begin the tabular environment.
\edef\dobegintabular{\noexpand\begin{tabular}{\colalign}}%
\dobegintabular
% Do the header row.
\gdef\doamp{\gdef\doamp{&}}%
\dtlforeachkey(\theKey,\theCol,\theType,\theHead)\in{scores}\do
{\doamp\bfseries \theHead}%
% Iterate through the data.
\DTLforeach*{scores}{}{%
\\\gdef\doamp{\gdef\doamp{&}}%
\DTLforeachkeyinrow{\thisValue}{\doamp\thisValue}}%
\end{tabular}
\end{table}
Table 5.12: Student
Scores
(Using
\DTLforeachkeyinrow)
FirstName
John
Jane
Andy
Zöe
Roger
Clare
Surname
Smith, Jr
Brown
Brown
Adams
Brady
Verdon
\dtlforeachkey
StudentNo
102689
102647
103569
105987
106872
104356
and
Score
68
75
42
52
58
45
Notes:
• In order to determine the column alignment for the tabular
environment, I first define \colalign to nothing, and then I
iterate through the keys appending l to \colalign. Since
\colalign only contains alphabetical characters, I can just use
\edef for this. I could modify this to check the data type and, say,
use l (left alignment) for columns containing strings and c
(centred) for the other columns:
\dtlforeachkey(\theKey,\theCol,\theType,\theHead)\in{scores}\do
{\ifnum\theType=0\relax
58
\edef\colalign{\colalign l}% column contains strings
\else
\edef\colalign{\colalign c}% column contains numerical values
\fi
}%
• To ensure \colalign gets correct expanded when passed to the
tabular environment I temporarily define \dobegintabular to the
code required to start the tabular environment:
\edef\dobegintabular{\noexpand\begin{tabular}{\colalign}}%
This sets \dobegintabular to \begin{tabular}{llll}. After
defining \dobegintabular, I then need to use it.
• As before, I use \doamp to put the ampersands between columns.
• Recall that I can set the headers using \DTLsetheader or using
the headers key when loading the data from an external file. For
example:
\DTLsetheaders{scores}{FirstName}{First Name}
\DTLsetheaders{scores}{Score}{Score (\%)}
Recall that \DTLforeachkeyinrow sets \dtlkey to the current key.
This can be used to filter out columns. Alternatively, if you know the
column index, you can test \dtlcol instead. The following code
modifies the above example so that it filters out the column whose key is
StudentNo:
\begin{table}[htbp]
\caption{Student Scores (Filtering Out a Column)}
\centering
\def\colalign{}%
\dtlforeachkey(\theKey,\theCol,\theType,\theHead)\in{scores}\do
{\DTLifeq{\theKey}{StudentNo}{}{\edef\colalign{\colalign l}}}%
\edef\dobegintabular{\noexpand\begin{tabular}{\colalign}}%
\dobegintabular
\gdef\doamp{\gdef\doamp{&}}%
\dtlforeachkey(\theKey,\theCol,\theType,\theHead)\in{scores}\do
{\DTLifeq{\theKey}{StudentNo}{}{\doamp\bfseries \theHead}}%
\DTLforeach*{scores}{}{%
\\\gdef\doamp{\gdef\doamp{&}}%
\DTLforeachkeyinrow{\thisValue}{%
\DTLifeq{\dtlkey}{StudentNo}{}{\doamp\thisValue}}}%
\end{tabular}
\end{table}
The result is shown in Table 5.13.
59
Table 5.13: Student Scores (Filtering Out a Column)
FirstName
John
Jane
Andy
Zöe
Roger
Clare
Surname
Smith, Jr
Brown
Brown
Adams
Brady
Verdon
Score
68
75
42
52
58
45
Example 10 (Nested \DTLforeach)
In this example I have a CSV file called index.csv which contains:
File,Temperature,NaCl,pH
exp25a.csv,25,4.7,0.5
exp25b.csv,25,4.8,1.5
exp30a.csv,30,5.12,4.5
The first column of this file contains the name of another CSV file which
has the results of a time to growth experiment performed at the given
incubation temperature, salt concentration and pH. The file exp25a.csv
contains the following:
Time,Log Count
0,3.75
23,3.9
45,4.0
The file exp25b.csv contains the following:
Time,Log Count
0,3.6
60,3.8
120,4.0
The file exp30a.csv contains the following:
Time,Log Count
0,3.73
23,3.67
60,4.9
Suppose I now want to iterate through index.csv, load the given file,
and create a table for that data. I can do this using nested \DTLforeach
as follows:
60
% load index data file
\DTLloaddb{index}{index.csv}
% iterate through index database
\DTLforeach{index}{\theFile=File,\theTemp=Temperature,%
\theNaCl=NaCl,\thepH=pH}{%
% load results file into database of the same name
\DTLloaddb{\theFile}{\theFile}%
% Create a table
\begin{table}[htbp]
\caption{Temperature = \theTemp, NaCl = \theNaCl,
pH = \thepH}\label{tab:\theFile}
\centering
\begin{tabular}{rl}
\bfseries Time & \bfseries Log Count
\DTLforeach{\theFile}{\theTime=Time,\theLogCount=Log Count}{%
\\\theTime & \theLogCount}%
\end{tabular}
\end{table}
}
This creates Table 5.14 to Table 5.16. (Note that each table is given a label
that is based on the database name, to ensure that it is unique.)
Table 5.14: Temperature = 25, NaCl = 4.7, pH = 0.5
Time
0
23
45
Log Count
3.75
3.9
4.0
Table 5.15: Temperature = 25, NaCl = 4.8, pH = 1.5
Time
0
60
120
Log Count
3.6
3.8
4.0
Table 5.16: Temperature = 30, NaCl = 5.12, pH = 4.5
Time
0
23
60
Log Count
3.73
3.67
4.9
61
Example 11 (Dynamically Allocating Field Name)
(This example was suggested by Bill Hobbs.) Suppose you have a
directory containing members of multiple clubs. The CSV file (say,
clubs.csv) may look something like:
First Name,Surname,Rockin,Single
John,"Smith, Jr",member,
Jane,Brown,,friend
Andy,Brown,friend,member
Z\"oe,Adams,member,member
Roger,Brady,friend,friend
Clare,Verdon,member,
(Blank entries indicate that the person is not a member of that club.) The
data can be loaded as follows:
\DTLloaddb{clubs}{clubs.csv}
Suppose at the beginning of your document you have specified which
club you are interested in (Rockin or Single) and store it in \DIdent:
\newcommand{\DIdent}{Rockin}
You can now display the members for this particular club as follows:
\begin{table}[htbp]
\caption{Club Membership}
\centering
\begin{tabular}{lll}
\bfseries First Name & \bfseries Surname & \bfseries Status
\DTLforeach*[\not\DTLiseq{\status}{}]{clubs}
{\firstname=First Name,\surname=Surname,\status=\DIdent}{%
\\\firstname & \surname & \status
}%
\end{tabular}
\end{table}
The result is shown in Table 5.17.
Table 5.17: Club Membership
First Name
John
Andy
Zöe
Roger
Clare
Surname
Smith, Jr
Brown
Adams
Brady
Verdon
62
Status
member
friend
member
friend
member
5.5 Null Values
If a database is created using \DTLnewdb, \DTLnewrow and
\DTLnewdbentry (rather than loading it from an ASCII file), it is
possible for some of the entries to have null values when a value is not
assigned to a given key for a given row. (Note that a null value is not the
same as an empty value. Empty values can be tested using etoolbox’s
\ifdefempty or similar.)
When you iterate through the database using \DTLforeach (described
in section 5.4), if an entry is missing for a given row, the associated
command given in the hvaluesi argument will be set to a null value. This
value depends on the data type associated with the given key.
\DTLstringnull
\DTLstringnull
This is the null value for a string.
\DTLnumbernull
\DTLnumbernull
This is the null value for a number.
\DTLifnull
\DTLifnull{hcmdi}{htrue parti}{hfalse parti}
This checks if hcmdi is null where hcmdi is a command name, if it is, then
htrue parti is done, otherwise hfalse parti is done. This macro is illustrated
in example 12 below.
Example 12 (Null Values)
Consider the following (which creates a database called emailDB):
\DTLnewdb{emailDB}
\DTLnewrow{emailDB}
\DTLnewdbentry{emailDB}{Surname}{Jones}
\DTLnewdbentry{emailDB}{FirstName}{Mary}
\DTLnewdbentry{emailDB}{Email1}{[email protected]}
\DTLnewdbentry{emailDB}{Email2}{[email protected]}
\DTLnewrow{emailDB}
\DTLnewdbentry{emailDB}{Surname}{Smith}
\DTLnewdbentry{emailDB}{FirstName}{Adam}
\DTLnewdbentry{emailDB}{Email1}{[email protected]}
\DTLnewdbentry{emailDB}{RegNum}{12345}
63
In the above example, the first row of the database contains an entry with
the key Email2, but the second row doesn’t. Whereas the second row
contains an entry with the key RegNum, but the first row doesn’t.
The following code puts the information in a tabular environment:
\begin{tabular}{lllll}
\bfseries First Name &
\bfseries Surname &
\bfseries Email 1 &
\bfseries Email 2 &
\bfseries Reg Num%
\DTLforeach{emailDB}{\firstname=FirstName,\surname=Surname,%
\emailI=Email1,\emailII=Email2,\regnum=RegNum}{%
\\\firstname & \surname & \emailI & \emailII & \regnum}%
\end{tabular}
This produces the following:
First Name
Mary
Adam
Surname
Jones
Smith
Email 1
[email protected]
[email protected]
Email 2
[email protected]
NULL
Reg Num
0
12345
Note that on the first row of data, the registration number appears as 0,
while on the next row, the second email address appears as NULL. The
datatool package has identified the key RegNum for this database as a
numerical key, since all elements in the database with that key are
numerical, whereas it has identified the key Email2 as a string, since
there is at least one element in this database with that key that is a string.
Null numerical values are set to \DTLnumbernull (0), and null strings
are set to \DTLstringnull (NULL).
The following code checks each value to determine whether it is null
using \DTLifnull. If it is, the text Missing is inserted, otherwise the
value itself is used:
\begin{tabular}{lllll}
\bfseries First Name &
\bfseries Surname &
\bfseries Email 1 &
\bfseries Email 2 &
\bfseries Reg Num%
\DTLforeach{emailDB}{\firstname=FirstName,\surname=Surname,%
\emailI=Email1,\emailII=Email2,\regnum=RegNum}{%
\\\DTLifnull{\firstname}{\emph{Missing}}{\firstname} &
\DTLifnull{\surname}{\emph{Missing}}{\surname} &
\DTLifnull{\emailI}{\emph{Missing}}{\emailI} &
\DTLifnull{\emailII}{\emph{Missing}}{\emailII} &
\DTLifnull{\regnum}{\emph{Missing}}{\regnum}}%
\end{tabular}
64
This produces the following:
First Name
Mary
Adam
Surname
Jones
Smith
Email 1
[email protected]
[email protected]
Email 2
[email protected]
Missing
Reg Num
Missing
12345
If you want to do this, you may find it easier to define a convenience
command that will display some appropriate text if an entry is missing,
for example:
\newcommand*{\checkmissing}[1]{\DTLifnull{#1}{---}{#1}}
Then instead of typing, say,
\DTLifnull{\regnum}{---}{\regnum}
you can instead type:
\checkmissing{\regnum}
Now suppose that instead of defining the database using \DTLnewdb,
\DTLnewrow and \DTLnewdbentry, you have a file with the contents:
Surname,FirstName,RegNum,Email1,Email2
Jones,Mary,,[email protected],[email protected]
Smith,Adam,12345,[email protected],
and you load the data from this file using \DTLloaddb (defined in
section 5.2). Now the database has no null values, but has an empty
value for the key RegNum on the first row of the database, and an empty
value for the key Email2 on the second row of the database. Now, the
following code
\begin{tabular}{lllll}
\bfseries First Name &
\bfseries Surname &
\bfseries Email 1 &
\bfseries Email 2 &
\bfseries Reg Number%
\DTLforeach{emailDB}{\firstname=FirstName,\surname=Surname,%
\emailI=Email1,\emailII=Email2,\regnum=RegNum}{%
\\\DTLifnull{\firstname}{\emph{Missing}}{\firstname} &
\DTLifnull{\surname}{\emph{Missing}}{\surname} &
\DTLifnull{\emailI}{\emph{Missing}}{\emailI} &
\DTLifnull{\emailII}{\emph{Missing}}{\emailII} &
\DTLifnull{\regnum}{\emph{Missing}}{\regnum}}%
\end{tabular}
65
produces:
First Name
Mary
Adam
Surname
Jones
Smith
Email 1
[email protected]
[email protected]
Email 2
[email protected]
Reg Number
12345
5.6 Editing Database Rows
A row can be removed from a data base using:
\DTLremoverow
\DTLremoverow{hdb namei}{hrow indexi}
where hrow indexi is the index of the unwanted row. For example:
\DTLremoverow{scores}{2}
will delete the second row in the database labelled “scores”. There is also
a starred version that doesn’t check for the existence of the database.
The following commands may be used in the body of the \DTLforeach
loop,3 to edit the current row of the loop. (See also subsection 5.11.1.)
\DTLappendtorow
\DTLappendtorow{hkeyi}{hvaluei}
This appends a new entry with the given hkeyi and hvaluei to the current
row. (hvaluei is expanded.)
\DTLreplaceentryforrow
\DTLreplaceentryforrow{hkeyi}{hvaluei}
This replaces the entry for hkeyi with hvaluei. (hvaluei is expanded.)
\DTLremoveentryfromrow
\DTLremoveentryfromrow{hkeyi}
This removes the entry for hkeyi from the current row.
\DTLremovecurrentrow
\DTLremovecurrentrow
This removes the current row from the database.
3 Only
the unstarred version of \DTLforeach; the starred version is read-only.
66
Example 13 (Editing Database Rows)
In this example I have a CSV file called marks.csv that contains student
marks for three assignments:
Surname,FirstName,StudentNo,Assignment 1,Assignment
2,Assignment 3
"Smith, Jr",John,102689,68,57,72
"Brown",Jane,102647,75,84,80
"Brown",Andy,103569,42,52,54
"Adams",Z\"oe,105987,52,48,57
"Brady",Roger,106872,58,60,62
"Verdon",Clare,104356,45,50,48
First load this into a database called marks:
\DTLloaddb{marks}{marks.csv}
Suppose now I want to compute the average mark for each student, and
append this to the database. I can do this as follows:
\DTLforeach{marks}{%
\assignI=Assignment 1,%
\assignII=Assignment 2,%
\assignIII=Assignment 3}{%
\DTLmeanforall{\theMean}{\assignI,\assignII,\assignIII}%
\DTLappendtorow{Average}{\theMean}}
For each row in the marks database, I now have an extra key called
Average that contains the average mark over all three assignments for a
given student. I can now put this data into a table:
\begin{table}[htbp]
\caption{Student marks}
\centering
\begin{tabular}{llcccc}
\bfseries Surname & \bfseries First Name &
\bfseries Assign 1 &
\bfseries Assign 2 &
\bfseries Assign 3 &
\bfseries Average Mark%
\DTLforeach{marks}{\surname=Surname,\firstname=FirstName,\average
=Average,\assignI=Assignment 1,\assignII=Assignment 2,\assignIII
=Assignment 3}{\\\surname
& \firstname & \assignI & \assignII & \assignIII &
\DTLround{\average}{\average}{2}\DTLclip{\average}\average}\relax
\end{tabular}
\end{table}
This produces Table 5.18.
67
Note that if I only wanted the averages for the table and nothing else, I
could simply have computed the average in each row of the table and
displayed it without adding the information to the database, however I
am going to reuse this information in example 33, so adding it to the
database means that I don’t need to recompute the mean.
Table 5.18: Student marks
Surname
Smith, Jr
Brown
Brown
Adams
Brady
Verdon
First Name
John
Jane
Andy
Zöe
Roger
Clare
Assign 1
68
75
42
52
58
45
Assign 2
57
84
52
48
60
50
Assign 3
72
80
54
57
62
48
Average Mark
5.7 Arithmetical Computations on Database Entries
The commands used in chapter 3 can be used on database entries. You
can, of course, directly use the commands provided by the fp package if
you know that the values are in the correct format (i.e. no currency
symbols, no number group separators and a full stop as the decimal
point) but if this is not the case, then you should use the commands
described in chapter 3. If you want to use a command provided by the fp
package, that does not have a wrapper function in datatool, then you will
need to convert the value using \DTLconverttodecimal, and convert
it back using either \DTLdecimaltolocale or
\DTLdecimaltocurrency.
Example 14 (Arithmetical Computations)
In this example, I am going to produce a table similar to Table 5.4, except
that I want to add an extra row at the end which contains the average
score.
\begin{table}[htbp]
\caption{Student scores}\label{tab:mean}
\centering
\def\total{0}%
\begin{tabular}{llr}
\bfseries First Name &
\bfseries Surname &
\bfseries Score (\%)%
68
\DTLforeach{scores}{%
\firstname=FirstName,\surname=Surname,\score=Score}{%
\\
\firstname & \surname &
\DTLgadd{\total}{\score}{\total}%
\score
}\\
\multicolumn{2}{l}{\bfseries Average Score} &
\DTLsavelastrowcount{\n}%
\DTLdiv{\average}{\total}{\n}%
\DTLround{\average}{\average}{2}%
\average
\end{tabular}
\end{table}
This produces Table 5.19. Notes:
• I had to use \DTLgadd rather than \DTLadd since it occurs within
a tabular environment which puts each entry in a local scope.
• I used \DTLsavelastrowcount to store the number of rows
produced by \DTLforeach in the control sequence \n.
• I used \DTLround to round the average score to 2 decimal places.
Table 5.19: Student scores
First Name Surname
John
Smith, Jr
Jane
Brown
Andy
Brown
Zöe
Adams
Roger
Brady
Clare
Verdon
Average Score
Score (%)
68
75
42
52
58
45
56.67
\DTLsumforkeys
\DTLsumforkeys[hconditioni][hassign listi]{hdb listi}{hkey
listi}{hcmdi}
This command sums all the entries over all the databases listed in the
comma separated list of database names hdb listi for each key in hkey listi
where the condition given by hconditioni is true. The second optional
69
argument hassign listi is the same as the assignment list used by
\DTLforeach, so that you can use the information in hconditioni. The
result is stored in hcmdi which must be a control sequence. For example:
\DTLsumforkeys{scores}{Score}{\total}
sets \total to the sum of all the scores in the database called scores.
\DTLsumcolumn
\DTLsumcolumn{hdbi}{hkeyi}{hcmdi}
This is a faster version of \DTLsumforkeys that only sums the entries in
a single column (specified by hkeyi) for a single database (specified by
hdbi) and doesn’t provide any filtering. The result is stored in hcmdi
which must be a control sequence.
\DTLmeanforkeys
\DTLmeanforkeys[hconditioni][hassign listi]{hdb listi}{hkey
listi}{hcmdi}
This command computes the arithmetic mean of all the entries over all
the databases listed in hdb listi for all keys in hkey listi where the
condition given by hconditioni is true. The second optional argument
hassign listi is the same as the assignment list used by \DTLforeach, so
that you can use the information in hconditioni. The result is stored in
hcmdi which must be a control sequence. For example:
\DTLmeanforkeys{scores}{Score}{\average}
sets \average to the mean of all the scores in the database called
scores.
\DTLmeanforcolumn
\DTLmeanforcolumn{hdbi}{hkeyi}{hcmdi}
This is a faster version of \DTLmeanforkeys that only computes the
mean for a single column (specified by hkeyi) for a single database
(specified by hdbi) and doesn’t provide any filtering. The result is stored
in hcmdi which must be a control sequence.
\DTLvarianceforkeys
\DTLvarianceforkeys[hconditioni][hassign listi]{hdb listi}{hkey
listi}{hcmdi}
This command computes the variance of all the entries over all the
databases listed in hdb listi for all keys in hkey listi where the condition
70
given by hconditioni is true. The second optional argument hassign listi is
the same as the assignment list used by \DTLforeach, so that you can
use the information in hconditioni. The result is stored in hcmdi which
must be a control sequence.
\DTLvarianceforcolumn
\DTLvarianceforcolumn{hdbi}{hkeyi}{hcmdi}
This is a faster version of \DTLvarianceforkeys that only computes
the variance for a single column (specified by hkeyi) for a single database
(specified by hdbi) and doesn’t provide any filtering. The result is stored
in hcmdi which must be a control sequence.
\DTLsdforkeys
\DTLsdforkeys[hconditioni][hassign listi]{hdb listi}{hkey
listi}{hcmdi}
This command computes the standard deviation of all the entries over all
the databases listed in hdb listi for all keys in hkey listi where the
condition given by hconditioni is true. The second optional argument
hassign listi is the same as the assignment list used by \DTLforeach, so
that you can use the information in hconditioni. The result is stored in
hcmdi which must be a control sequence.
\DTLsdforcolumn
\DTLsdforcolumn{hdbi}{hkeyi}{hcmdi}
This is a faster version of \DTLsdforkeys that only computes the
standard deviation for a single column (specified by hkeyi) for a single
database (specified by hdbi) and doesn’t provide any filtering. The result
is stored in hcmdi which must be a control sequence.
\DTLminforkeys
\DTLminforkeys[hconditioni][hassign listi]{hdb listi}{hkey
listi}{hcmdi}
This command determines the minimum value over all entries for all
keys in hkey listi over all the databases listed in hdb listi where hconditioni
is true. The second optional argument hassign listi is the same as the
assignment list used by \DTLforeach, so that you can use the
information in hconditioni. The result is stored in hcmdi, which must be a
control sequence. For example
\DTLminforkeys{scores}{Score}{\theMin}
71
sets \theMin to the minimum score in the database.
\DTLminforcolumn
\DTLminforcolumn{hdbi}{hkeyi}{hcmdi}
This is a faster version of \DTLminforkeys that only computes the
minimum for a single column (specified by hkeyi) for a single database
(specified by hdbi) and doesn’t provide any filtering. The result is stored
in hcmdi which must be a control sequence.
\DTLmaxforkeys
\DTLmaxforkeys[hconditioni][hassign listi]{hdb listi}{hkey
listi}{hcmdi}
This command determines the maximum value over all entries for all
keys in hkey listi over all the databases listed in hdb listi where hconditioni
is true. The second optional argument hassign listi is the same as the
assignment list used by \DTLforeach, so that you can use the
information in hconditioni. The result is stored in hcmdi, which must be a
control sequence. For example
\DTLminforkeys{scores}{Score}{\theMax}
sets \theMax to the minimum score in the database.
\DTLmaxforcolumn
\DTLmaxforcolumn{hdbi}{hkeyi}{hcmdi}
This is a faster version of \DTLmaxforkeys that only computes the
maximum for a single column (specified by hkeyi) for a single database
(specified by hdbi) and doesn’t provide any filtering. The result is stored
in hcmdi which must be a control sequence.
\DTLcomputebounds
\DTLcomputebounds{hdb listi}{hx keyi}{hy keyi}{hminX
cmdi}{hminY cmdi}{hmaxX cmdi}{hmaxY cmdi}
Computes the maximum and minimum x and y values over all the
databases listed in hdb listi where the x value is given by hx keyi and the y
value is given by hy keyi. The results are stored in hminX cmdi, hminY
cmdi, hmaxX cmdi and hmaxY cmdi.
Example 15 (Mail Merging)
This example uses the database given in example 3 and uses
\DTLmeanforkeys to determine the average score. A letter is then
72
created for each student to inform them of their score and the class
average.
\documentclass{letter}
\usepackage{datatool}
\begin{document}
% load database
\DTLloaddb{scores}{studentscores.csv}
% compute arithmetic mean for key ‘Score’
\DTLmeanforkeys{scores}{Score}{\average}
% Round the average to 2 decimal places
\DTLround{\average}{\average}{2}
% Save the highest score in \maxscore
\DTLmaxforkeys{scores}{Score}{\maxscore}
\DTLforeach{scores}{\firstname=FirstName,\surname=Surname,%
\score=Score}{%
\begin{letter}{}
\opening{Dear \firstname\ \surname}
\DTLifnumgt{\score}{60}{Congratulations you}{You} achieved a score
of \score\% which was \DTLifnumgt{\score}{\average}{above}{below}
the average of \average\%. \DTLifnumeq{\score}{\maxscore}{You
achieved the highest score}{The top score was \maxscore}.
\closing{Yours Sincerely}
\end{letter}
}
\end{document}
To determine a person’s gender when mail merging, see chapter 10.
5.8 Sorting a Database
\DTLsort
\DTLsort[hreplacement key listi]{hsort criteriai}{hdb namei}
\DTLsort*
\DTLsort*[hreplacement key listi]{hsort criteriai}{hdb namei}
This will sort the database called hdb namei according to the criteria given
by hsort criteriai, which must be a comma separated list of keys and
73
optionally =horderi, where horderi is either ascending or descending.
If the order is omitted, ascending is assumed. The database keeps track
of the data type for a given key, and uses this to determine whether an
alphabetical or numerical sort is required. (String comparisons are made
using the command \dtlcompare or \dtlicompare described in
subsection 1.6.1.)
The optional argument hreplacement key listi is a list of keys to use if the
current key given in hsort criteriai is null for a given entry. Null keys are
unlikely to occur if you have loaded the database from an external ASCII
file, but may occur if the database is created using \DTLnewdb,
\DTLnewrow and \DTLnewdbentry. For example:
\DTLsort[Editor,Organization]{Author}{mydata}
will sort according to the Author key, but if that key is missing for a
given row of the database, the Editor key will be used, and if the
Editor key is missing, it will use the Organization key. Note that this
is not the same as:
\DTLsort{Author,Editor,Organization}{mydata}
which will first compare the Author keys, but if the author names are
the same, it will then compare the Editor keys, and if the editor names
are also the same, it will then compare the Organization keys.
The unstarred version uses a case sensitive comparison for strings,
whereas the starred version ignores the case when comparing strings.
Note that the case sensitive comparison orders uppercase characters
before lowercase characters, so the letter B is considered to be lower than
the letter a.
Example 16 (Sorting a Database)
This example uses the database called scores defined in example 3.
First, I am going to sort the database according to the student scores in
descending order (highest to lowest) and display the database in a table
\begin{table}[htbp]
\caption{Student scores (sorted by score)}
\centering
\DTLsort{Score=descending}{scores}%
\begin{tabular}{llr}
\bfseries First Name &
\bfseries Surname &
\bfseries Score (\%)%
\DTLforeach{scores}{%
\firstname=FirstName,\surname=Surname,\score=Score}{%
\\
\firstname & \surname & \score}
74
\end{tabular}
\end{table}
This produces Table 5.20.
Table 5.20: Student scores (sorted by score)
First Name
Jane
John
Roger
Zöe
Clare
Andy
Surname
Brown
Smith, Jr
Brady
Adams
Verdon
Brown
Score (%)
75
68
58
52
45
42
Now I am going to sort the database according to surname and then first
name, and display it in a table. Note that since I want to sort in ascending
order, I can omit the =ascending part of the sort criteria. I have also
decided to reverse the first and second columns, so that the surname is in
the first column.
\begin{table}[htbp]
\caption{Student scores (sorted by name)}
\centering
\DTLsort{Surname,FirstName}{scores}%
\begin{tabular}{llr}
\bfseries Surname &
\bfseries First Name &
\bfseries Score (\%)%
\DTLforeach{scores}{%
\firstname=FirstName,\surname=Surname,\score=Score}{%
\\
\surname & \firstname & \score}
\end{tabular}
\end{table}
This produces Table 5.21.
Table 5.21: Student scores (sorted by name)
Surname
Adams
Brady
Brown
Brown
Smith, Jr
Verdon
First Name
Zöe
Roger
Andy
Jane
John
Clare
75
Score (%)
52
58
42
75
68
45
Now suppose I add two new students to the database:
\DTLnewrow{scores}%
\DTLnewdbentry{scores}{Surname}{van der Mere}%
\DTLnewdbentry{scores}{FirstName}{Henk}%
\DTLnewdbentry{scores}{Score}{71}%
\DTLnewrow{scores}%
\DTLnewdbentry{scores}{Surname}{de la Mere}%
\DTLnewdbentry{scores}{FirstName}{Jos}%
\DTLnewdbentry{scores}{Score}{58}%
and again I try sorting the database, and displaying the contents as a
table:
\begin{table}[htbp]
\caption{Student scores (case sensitive sort)}
\centering
\DTLsort{Surname,FirstName}{scores}%
\begin{tabular}{llr}
\bfseries Surname &
\bfseries First Name &
\bfseries Score (\%)%
\DTLforeach{scores}{%
\firstname=FirstName,\surname=Surname,\score=Score}{%
\\
\surname & \firstname & \score}
\end{tabular}
\end{table}
This produces Table 5.22. Notice that the surnames aren’t correctly
ordered. This is because a case-sensitive sort was used. Changing
\DTLsort to \DTLsort* in the above code produces Table 5.23.
Table 5.22: Student scores (case sensitive sort)
Surname
Adams
Brady
Brown
Brown
Smith, Jr
Verdon
de la Mere
van der Mere
First Name
Zöe
Roger
Andy
Jane
John
Clare
Jos
Henk
76
Score (%)
52
58
42
75
68
45
58
71
Table 5.23: Student scores (case ignored when sorting)
Surname
Adams
Brady
Brown
Brown
de la Mere
Smith, Jr
van der Mere
Verdon
First Name
Zöe
Roger
Andy
Jane
Jos
John
Henk
Clare
Score (%)
52
58
42
75
58
68
71
45
Example 17 (Influencing the sort order)
Consider the data displayed in Table 5.23, suppose that you want the
names “van der Mere” and “de la Mere” sorted according to the actual
surname “Mere” rather than by the “von part”. There are two ways you
can do this: firstly, you could store the von part in a separate field, and
then sort by surname, then von part, then first name, or you could define
a command called, say, \switchargs, as follows:
\newcommand*{\switchargs}[2]{#2#1}
then store the data as:
FirstName,Surname,StudentNo,Score
John,"Smith, Jr",102689,68
Jane,Brown,102647,75
Andy,Brown,103569,42
Z\"oe,Adams,105987,52
Roger,Brady,106872,58
Clare,Verdon,104356,45
Henk,\switchargs{Mere}{van der },106789,71
Jos,\switchargs{Mere}{de la },104256,58
Now sort the data, and put it in table (this is the same code as in the
previous example:
\begin{table}[htbp]
\caption{Student scores (influencing the sort order)}
\centering
\DTLsort*{Surname,FirstName}{scores}%
\begin{tabular}{llr}
\bfseries Surname &
\bfseries First Name &
\bfseries Score (\%)%
\DTLforeach{scores}{%
\firstname=FirstName,\surname=Surname,\score=Score}{%
77
\\
\surname & \firstname & \score}
\end{tabular}
\end{table}
This produces Table 5.24.
Table 5.24: Student scores (influencing the sort order)
Surname
Adams
Brady
Brown
Brown
de la Mere
van der Mere
Smith, Jr
Verdon
First Name
Zöe
Roger
Andy
Jane
Jos
Henk
John
Clare
Score (%)
52
58
42
75
58
71
68
45
5.9 Saving a Database to an External File
\DTLsavedb
\DTLsavedb{hdb namei}{hfilenamei}
This writes the database called hdb namei to a file called hfilenamei. The
separator and delimiter characters used are as given by
\DTLsetseparator (or \DTLsettabseparator) and
\DTLsetdelimiter. For example:
\DTLsettabdelimiter
\DTLsavedb{scores}{scores.txt}
will create a file called scores.txt and will save the data in a tab
separated format. (The delimiters will only be used if a given entry
contains the separator character.)
\DTLsavetexdb
\DTLsavetexdb{hdb namei}{hfilenamei}
This writes the database called hdb namei to a LATEX file called hfilenamei,
where the database is stored as a combination of \DTLnewdb,
\DTLnewrow and \DTLnewdbentry commands.
78
5.10 Deleting or Clearing a Database
A database can be cleared or deleted when its contents are no longer
required.
\DTLcleardb
\DTLcleardb{hdb namei}
Clears the database given by hdb namei. The database is emptied but
remains defined.
\DTLdeletedb
\DTLdeletedb{hdb namei}
Deletes (undefines) the database given by hdb namei.
5.11 Advanced Database Commands
This section describes more advanced commands. Further details can be
found in the documented code (datatool.pdf).
\DTLgetdatatype
\DTLgetdatatype{hcsi}{hdbi}{hkeyi}
Gets the data type for the given key hkeyi for the database given by hdbi.
The data type is stored in hcsi which must be a command name. The type
will be one of:
\DTLunsettype
• \DTLunsettype (not set),
\DTLstringtype
• \DTLstringtype (string),
\DTLinttype
\DTLrealtype
\DTLcurrencytype
• \DTLinttype (integer),
• \DTLrealtype (real number) or
• \DTLcurrenttype (currency).
\dtlforeachkey
\dtlforeachkey(hkey csi,hcol csi,htype csi,hheader
csi)\in{hdbi}\do{hbodyi}
This iterates through all the keys in the database given by hdbi. In each
iteration, hkey csi is set to the key, hcol csi is set to the column index, htype
79
csi is set to the data type (as for \DTLgetdatatype), hheader csi is set to
the header for that column, and then hbodyi is done. Note that hkey csi,
hcol csi, htype csi and hheader csi must all be control sequences. No check
is performed to determine if that control sequence already exists, and the
control sequences are defined globally (since it’s likely that
\dtlforeachkey may be used within a tabular environment), so you
need to make sure you don’t override an existing command of the same
name.
\dtlforcolumn
\dtlforcolumn{hcsi}{hdbi}{hkeyi}{hbodyi}
This iterates through the column given by hkeyi in the database given by
hdbi and applies hbodyi. In each iteration, hcsi (which must be a control
sequence) is set to the current element in the column and may be used in
hbodyi. Alternatively, if you want to identify the column by its index
rather than its key, use:
\dtlforcolumnindex
\dtlforcolumnindex{hcsi}{hdbi}{hcol indexi}{hbodyi}
\DTLifdbexists
\DTLifdbexists{hdb namei}{htrue parti}{hfalse parti}
Determines if the database given by hdb namei exists.
\DTLifhaskey
\DTLifhaskey{hdb namei}{hkeyi}{htrue parti}{hfalse parti}
This determines if the database given by hdb namei has any entries with
the key given by hkeyi. If so, it does htrue parti otherwise it does hfalse
parti.
Each key has an associated column index. This can be obtained using:
\DTLgetcolumnindex
\DTLgetcolumnindex{hcsi}{hdbi}{hkeyi}
where hcsi is a command name, hdbi is the database label and hkeyi is the
key. The column index is stored in hcsi.
You can also do the reverse and find the key associated with a given
column index:
\DTLgetkeyforcolumn
80
\DTLgetkeyforcolumn{hkey csi}{hdbi}{hcolumn indexi}
The key is stored in hkey csi (which must be a command name).
There is also a full expandable way of obtaining the column index, but
note that no check is performed to determine if the database exists, or if it
contains the given key:
\dtlcolumnindex
\dtlcolumnindex{hdb namei}{hkeyi}
\DTLgetkeydata
\DTLgetkeydata{hkeyi}{hdbi}{hcol csi}{htype csi}{hheader csi}
Gets data for given key in database hdbi: the column index is stored in
hcol csi (as \DTLgetcolumnindex), the type is stored in htype csi (as
\DTLgetdatatype) and the header is stored in hheader csi.
\DTLgetvalue
\DTLgetvalue{hcsi}{hdbi}{hri}{hci}
This gets the value for row given by index hri and column given by hci
for the database hdbi and stores it in hcsi which must be a command
name. If you want to get the value by key rather than column index you
can use \dtlcolumnindex. For example, the following gets the value
for row 3 with key Surname from the database data and stores in
\myval:
\DTLgetvalue{\myval}{data}{3}{\dtlcolumnindex{data}{Surname}}
\DTLgetlocation
\DTLgetlocation{hrow csi}{hcolumn csi}{hdatabasei}{hvaluei}
Assigns hrow csi and hcolumn csi to the indices of the first entry in
hdatabasei that matches hvaluei.
\DTLgetvalueforkey
\DTLgetvalueforkey{hcmdi}{hkeyi}{hdb namei}{href keyi}{href
valuei}
This (globally) sets hcmdi (a control sequence) to the value of the key
specified by hkeyi in the first row of the database called hdb namei which
contains the key href keyi which has the value hvaluei.
81
\DTLassign
\DTLassign{hdb namei}{hrow idxi}{hassign listi}
This (globally) assigns the list of commands in hassign listi for row hrow
idxi in database hdb namei, where hassign listi has the same format as in
\DTLforeach.
Two rows can be swapped using:
\DTLswaprows
\DTLswaprows{hdb namei}{hrow1 indexi}{hrow2 indexi}
where hrow1 indexi and hrow2 indexi are the indices of the rows to be
swapped. For example:
\DTLswaprows{scores}{3}{5}
will swap the third and fifth rows.
\DTLifinlist
\DTLifinlist{helementi}{hlisti}{htrue parti}{hfalse parti}
If helementi is contained in the comma-separated list given by hlisti, then
do htrue parti otherwise do false part. (Does a one level expansion on
hlisti, but no expansion on helementi.)
\DTLnumitemsinlist
\DTLnumitemsinlist{hlisti}{hcmdi}
Counts the number of non-empty elements in hlisti and stores result in
hcmdi, which must be a control sequence.
Example 18 (Two Database Rows Per Tabular Row
(Column-Wise))
This example adapts example 8 so that the list is ordered vertically rather
than horizontally.
\begin{table}[htbp]
\caption{Two database rows per tabular row (column-wise)}
\centering
% store half number of rows
\edef\maxrows{\DTLrowcount{scores}}%
\DTLdiv{\halfrowidx}{\maxrows}{2}
\begin{tabular}{llcllc}
\bfseries First Name &
\bfseries Surname &
82
\bfseries Score (\%) &
\bfseries First Name &
\bfseries Surname &
\bfseries Score (\%)%
\DTLforeach*[\value{DTLrowi}<\halfrowidx]{scores}%
{\firstname=FirstName,\surname=Surname,\score=Score}%
{%
\\%
\firstname & \surname & \score
&
\edef\currentrowidx{\arabic{DTLrowi}}%
\DTLadd{\rowidxII}{\halfrowidx}{\currentrowidx}%
\DTLassign{scores}{\rowidxII}%
{\firstnameII=FirstName,\surnameII=Surname,\scoreII=Score}%
\firstnameII & \surnameII & \scoreII
}%
\end{tabular}
\end{table}
This produces Table 5.25.
Table 5.25: Two database rows per tabular row (column-wise)
First Name
Zöe
Roger
Andy
Jane
Surname
Adams
Brady
Brown
Brown
Score (%)
52
58
42
75
First Name
Jos
John
Henk
Clare
Surname
de la Mere
Smith, Jr
van der Mere
Verdon
Score (%)
58
68
71
45
5.11.1 Operating on Current Row
If you want to select from or edit a particular row in a database without
having to iterate through the database using \DTLforeach, you can use
the commands described in this section.
\dtlgetrow
\dtlgetrow{hdb namei}{hrow idxi}
Gets the row with index hrow idxi from the database hdb namei. The
required row is stored in the token register
\dtlcurrentrow
\dtlcurrentrow
83
the preceding rows are stored in the token register
\dtlbeforerow
\dtlbeforerow
the following rows are stored in the token register
\dtlafterrow
\dtlafterrow
the row index, hrow idxi, is stored in the register
\dtlrownum
\dtlrownum
and the database name is stored in the control sequence
\dtldbname
\dtldbname
No check is made in \dtlgetrow to see if the database exists or if the
row index is valid. You will probably get a “Missing { inserted” error
if you misspell the database name and a “Runaway argument” error if
you specify a row index that is out of range.
You can use the commands below to access or edit \dtlcurrentrow,
but they won’t change the database. Instead, once you’ve finished
editing \dtlcurrentrow, you need to reconstruct the database token
by recombining \dtlbeforerow, \dtlcurrentrow and
\dtlafterrow using:
\dtlrecombine
\dtlrecombine
Alternatively, to recombine omitting the current row:
\dtlrecombineomitcurrent
\dtlrecombineomitcurrent
(This removes the current row from the database, shifting the row indices
in \dtlafterrow.) Note that these recombining commands assume that
you haven’t altered \dtlrownum, \dtldbname, \dtlbeforerow and
\dtlafterrow.
84
\dtlcurrentrow stores the row information using datatool’s internal
row syntax, described in the documented code (datatool.pdf). Don’t
explicitly modify \dtlcurrentrow unless you have a good understanding of the syntax.
\dtlgetentryfromcurrentrow
\dtlgetentryfromcurrentrow{hcsi}{hcol idxi}
Gets the value from \dtlcurrentrow for the column given by hcol idxi
(an integer) and stores in hcsi, which must be a control sequence.
\dtlreplaceentryincurrentrow
\dtlreplaceentryincurrentrowhnew valuei{hcol idxi}
Replaces the value in \dtlcurrentrow for the column given by hcol
idxi (an integer) with hnew valuei.
The new value doesn’t get expanded.
\dtlremoveentryincurrentrow
\dtlremoveentryincurrentrow{hcol idxi}
Removes the value in \dtlcurrentrow for the column given by hcol
idxi.
\dtlswapentriesincurrentrow
\dtlswapentriesincurrentrow{hcol1 idxi}{hcol2 idxi}
Swaps entries in columns hcol1 idxi and hcol2 idxi in \dtlcurrentrow
(where hcol1 idxi and hcol2 idxi are the column indices).
\dtlappendentrytocurrentrow
\dtlappendentrytocurrentrow{hkeyi}{hvaluei}
Appends hvaluei to the current row for column given by hkeyi. (Note this
is the only command in this section to reference by key rather than by
index.)
85
6 Pie Charts (datapie package)
The datapie package is not loaded by the datatool package, so you need to
explicitly load datapie if you want to use any of the commands defined in
this section. You will also need to have the pgf/tikz packages installed.
The datapie package may be given the following options:
color=datapie Colour option (default).
gray=datapie Grey scale option.
rotateinner=datapie Rotate inner labels so that they are aligned with the
pie chart radial axis.
norotateinner=datapie Don’t rotate inner labels (default).
rotateouter=datapie Rotate outer labels so that they are aligned with the
pie chart radial axis.
norotateouter=datapie Don’t rotate outer labels (default).
Numerical information contained in a database created by the datatool
package can be converted into a pie chart using
\DTLpiechart
\DTLpiechart[hconditioni]{hsettings listi}{hdb namei}{hvaluesi}
where hdb namei is the name of the database, and hconditioni has the same
form as the optional argument to \DTLforeach described in section 5.4.
If hconditioni is false, that information is omitted from the construction of
the pie chart. The argument hvaluesi is a comma separated list of
hcmdi=hkeyi pairs, the same as that required by the penultimate
argument of \DTLforeach. The hsettings listi is a comma separated list
of hsettingi=hvaluei pairs, where hsettingi can be any of the following:
variable This specifies the control sequence to use that contains the value
used to construct the pie chart. The control sequence must be one of
the control sequences to appear in the assignment list hvaluesi. This
setting is required.
start This is the starting angle of the first segment. The value is 0 by
default.
86
radius This is the radius of the pie chart. The default value is 2cm.
innerratio The distance from the centre of the pie chart to the point where
the inner labels are placed is given by this value multiplied by the
ratio. The default value is 0.5.
outerratio The distance from the centre of the pie chart to the point where
the outer labels are placed is given by this value multiplied by the
ratio. The default value is 1.25.
cutawayratio The distance from the centre of the pie chart to the point of
cutaway segments is given by this value multiplied by the ratio.
The default value is 0.2.
inneroffset This is the absolute distance from the centre of the pie chart to
the point where the inner labels are placed. You should use only
one or other of innerratio and inneroffset, not both. If you also want to
specify the radius, you must use ratio before inneroffset. If omitted,
the inner offset is obtained from the ratio multiplied by the innerratio
value.
outeroffset This is the absolute distance from the centre of the pie chart to
the point where the outer labels are placed. You should use only
one or other of outerratio and outeroffset, not both. If you also want to
specify the radius, you must use ratio before outeroffset. If omitted,
the outer offset is obtained from the ratio multiplied by the outerratio
value.
cutawayoffset This is the absolute distance from the centre of the pie
chart to the point of the cutaway segments. You should use only
one or other of cutawayratio and cutawayoffset, not both. If you also
want to specify the radius, you must use ratio before cutawayoffset. If
omitted, the cutaway offset is obtained from the ratio multiplied by
the cutawayratio value.
cutaway This is a list of cutaway segments. This should be a comma
separated list of individual numbers, or number ranges (separated
by a dash). For example cutaway={1,3} will separate the first
and third segments from the rest of the pie chart, offset by the value
of the cutawayoffset setting, whereas cutaway={1-3} will separate
the first three segments from the rest of the pie chart. If omitted, the
pie chart will be whole.
innerlabel The value of this is positioned in the middle of each segment
at a distance of inneroffset from the centre of the pie chart. The
default is the same as the value of variable.
87
outerlabel The value of this is positioned at a distance of outeroffset from
the centre of the pie chart. The default is empty.
rotateinner This is a boolean setting, so it can only take the values true
and false. If the value is omitted true is assumed. If true, the
inner labels are rotated along the spokes of the pie chart, otherwise
the inner labels are not rotated. There are analogous package
options rotateinner=datapie and norotateinner=datapie.
rotateouter This is a boolean setting, so it can only take the values true
and false. If the value is omitted true is assumed. If true, the
outer labels are rotated along the spokes of the pie chart, otherwise
the outer labels are not rotated. There are analogous package
options rotateouter=datapie and norotateouter=datapie.
Example 19 (A Pie Chart)
This example loads data from a file called fruit.csv which contains
the following:
Name,Quantity
"Apples",30
"Pears",25
"Lemons,Limes",40.5
"Peaches",34.5
"Cherries",20
First load the data:
\DTLloaddb{fruit}{fruit.csv}
Now create a pie chart in a figure:
\begin{figure}[htbp]
\centering
\DTLpiechart{variable=\quantity}{fruit}{\name=Name,\quantity=Quantity}
\caption{A pie chart}
\end{figure}
This creates Figure 6.1.
There are no outer labels by default, but they can be set using the
outerlabel setting. The following sets the outer label to the value of the
Name key:
\begin{figure}[htbp]
\centering
\DTLpiechart{variable=\quantity,outerlabel=\name}{fruit}{%
\name=Name,\quantity=Quantity}
\caption{A pie chart (outer labels set)}
\end{figure}
88
25
30
40.5
20
34.5
Figure 6.1: A pie chart
Pears
Apples
25
30
Lemons,Limes
40.5
20
34.5
Cherries
Peaches
Figure 6.2: A pie chart (outer labels set)
89
This creates Figure 6.2.
You may prefer the labels to be rotated. The following switches on the
rotation for the inner and outer labels:
\begin{figure}[htbp]
\centering
\DTLpiechart{variable=\quantity,outerlabel=\name,%
rotateinner,rotateouter}{fruit}{%
\name=Name,\quantity=Quantity}
\caption{A pie chart (rotation enabled)}
\end{figure}
This creates Figure 6.3.
Pears
les
25
p
Ap
30
Lemons,Limes
40.5
20
34.5
Ch
err
ies
Peaches
Figure 6.3: A pie chart (rotation enabled)
Example 20 (Separating Segments from the Pie Chart)
You may want to separate one or more segments from the pie chart,
perhaps to emphasize them. You can do this using the cutaway setting.
The following separates the first and third segments from the pie chart:
\begin{figure}[htbp]
\centering
\DTLpiechart{variable=\quantity,outerlabel=\name,%
cutaway={1,3}}{fruit}{%
90
\name=Name,\quantity=Quantity}
\caption{A pie chart with cutaway segments}
\end{figure}
This produces Figure 6.4.
Pears
Apples
25
Lemons,Limes
30
40.5
20
34.5
Cherries
Peaches
Figure 6.4: A pie chart with cutaway segments
Alternatively I can specify a range of segments. The following separates
the first two segments:
\begin{figure}[htbp]
\centering
\DTLpiechart{variable=\quantity,outerlabel=\name,%
cutaway={1-2}}{fruit}{%
\name=Name,\quantity=Quantity}
\caption{A pie chart with cutaway segments (\texttt{cutaway=\{1-2\}})}
\end{figure}
This produces Figure 6.5.
Notice the difference between Figure 6.5 and Figure 6.6 which was
produced using:
\begin{figure}[htbp]
\centering
\DTLpiechart{variable=\quantity,outerlabel=\name,%
cutaway={1,2}}{fruit}{%
\name=Name,\quantity=Quantity}
\caption{A pie chart with cutaway segments (\texttt{cutaway=\{1,2\}})}
\end{figure}
91
Pears
Apples
25
30
Lemons,Limes
40.5
20
34.5
Cherries
Peaches
Figure 6.5: A pie chart with cutaway segments (cutaway={1-2})
Pears
Apples
25
30
Lemons,Limes
40.5
20
34.5
Cherries
Peaches
Figure 6.6: A pie chart with cutaway segments (cutaway={1,2})
92
6.1 Pie Chart Variables
\DTLpievariable
\DTLpievariable
This command is set to the variable given by the variable setting in the
hsettings listi argument of \DTLpiechart. The innerlabel is set to
\DTLpievariable by default.
\DTLpiepercent
\DTLpiepercent
DTLpieroundvar
This command is set to the percentage value of \DTLpievariable. The
percentage value is rounded to hni digits, where hni is the value of the
LATEX counter DTLpieroundvar.
Example 21 (Changing the Inner and Outer Labels)
This example uses the database defined in example 19. The inner label is
now set to the percentage value, rather than the actual value, and the
outer label is set to the name with the actual value in parentheses.
\begin{figure}[htbp]
\centering
\DTLpiechart{variable=\quantity,%
innerlabel={\DTLpiepercent\%},%
outerlabel={\name\ (\DTLpievariable)}}{fruit}{%
\name=Name,\quantity=Quantity}
\caption{A pie chart (changing the labels)}
\end{figure}
This produces Figure 6.7.
6.2 Pie Chart Label Formatting
\DTLdisplayinnerlabel
\DTLdisplayinnerlabel{htexti}
This governs how the inner label is formatted, where htexti is the text of
the inner label. The default is to just do htexti.
\DTLdisplayouterlabel
93
Pears (25)
Apples (30)
16.7%
20.0%
Lemons,Limes (40.5)
27.0%
13.3%
23.0%
Cherries (20)
Peaches (34.5)
Figure 6.7: A pie chart (changing the labels)
\DTLdisplayouterlabel{htexti}
This governs how the outer label is formatted, where htexti is the text of
the outer label. The default is to just do htexti.
Example 22 (Changing the Inner and Outer Label Format)
This example extends example 21. The inner and outer labels are now
both typeset in a sans-serif font:
\begin{figure}[htbp]
\centering
\renewcommand*{\DTLdisplayinnerlabel}[1]{\textsf{#1}}
\renewcommand*{\DTLdisplayouterlabel}[1]{\textsf{#1}}
\DTLpiechart{variable=\quantity,%
innerlabel={\DTLpiepercent\%},%
outerlabel={\name\ (\DTLpievariable)}}{fruit}{%
\name=Name,\quantity=Quantity}
\caption{A pie chart (changing the label format)}
\end{figure}
This produces Figure 6.8.
6.3 Pie Chart Colours
The datapie package predefines colours for the first eight segments of the
pie chart. If you require more than eight segments or if you want to
change the default colours, you will need to use
94
Pears (25)
Apples (30)
16.7%
20.0%
Lemons,Limes (40.5)
27.0%
13.3%
23.0%
Cherries (20)
Peaches (34.5)
Figure 6.8: A pie chart (changing the label format)
\DTLsetpiesegmentcolor
\DTLsetpiesegmentcolor{hni}{hcolori}
The first argument hni is the segment index (starting from 1), and the
second argument hcolori is a colour specifier as used in commands such
as \color.
It is a good idea to set the colours so that each segment colour is
somehow relevant to whatever the segment represents. For example, in
the previous examples of pie charts depicting fruit, some of default
colours were inappropriate. Whilst red is appropriate for apples and
green is appropriate for pears, blue doesn’t really correspond to lemons
or limes.
\DTLdopiesegmentcolor
\DTLdopiesegmentcolorhni
This sets the current text colour to that of the hnith segment.
\DTLdocurrentpiesegmentcolor
\DTLdocurrentpiesegmentcolor
This sets the current text colour to that of the current pie segment. This
command may only be used within a pie chart, or within the body of
\DTLforeach.
\DTLpieoutlinecolor
\DTLpieoutlinecolor
95
This sets the outline colour for the pie chart. The default is black.
\DTLpieoutlinewidth
\DTLpieoutlinewidth
This is a length that governs the line width of the outline. The default
value is 0pt, but can be changed using \setlength. The outline is only
drawn if \DTLpieoutlinewidth is greater than 0pt.
Example 23 (Pie Segment Colours)
This example extends example 22. It sets the outline thickness to 2pt, and
the outer label is now set in the same colour as the fill colour of the
segment to which it belongs. The third segment (lemons and limes) is set
to yellow and the fourth segment (peaches) is set to pink. In addition, a
legend is created using \DTLforeach.
\begin{figure}[htbp]
\centering
\setlength{\DTLpieoutlinewidth}{2pt}
\DTLsetpiesegmentcolor{3}{yellow}
\DTLsetpiesegmentcolor{4}{pink}
\renewcommand*{\DTLdisplayinnerlabel}[1]{\textsf{#1}}
\renewcommand*{\DTLdisplayouterlabel}[1]{%
\DTLdocurrentpiesegmentcolor
\textsf{\shortstack{#1}}}
\DTLpiechart{variable=\quantity,%
innerlabel={\DTLpiepercent\%},%
outerlabel={\name\\(\DTLpievariable)}}{fruit}{%
\name=Name,\quantity=Quantity}
\begin{tabular}[b]{ll}
\DTLforeach{fruit}{\name=Name}{\DTLiffirstrow{}{\\}%
\DTLdocurrentpiesegmentcolor\rule{10pt}{10pt} &
\name
}
\end{tabular}
\caption{A pie chart (using segment colours and outline)}
\end{figure}
This produces Figure 6.9. (The format of the outer label has been changed
to use \shortstack to prevent the outer labels from taking up so much
horizontal space. The outerlabel setting has also been modified to use \\
after the name to move the percentage value onto the next row.)
96
Pears
(25)
Apples
(30)
16.7%
20.0%
Lemons,Limes
(40.5)
27.0%
13.3%
23.0%
Cherries
(20)
Peaches
(34.5)
Apples
Pears
Lemons,Limes
Peaches
Cherries
Figure 6.9: A pie chart (using segment colours and outline)
6.4 Adding Extra Commands Before and After the Pie
Chart
The pie charts created using \DTLpiechart are placed inside a tikzpicture
environment (defined by the tikz package).
\DTLpieatbegintikz
\DTLpieatbegintikz
The macro \DTLpieatbegintikz is called at the start of the tikzpicture
environment, allowing you to change the tikzpicture settings. By default
\DTLpieatbegintikz does nothing, but you can redefine it to, say,
scale the pie chart (but be careful not to distort the chart).
\DTLpieatendtikz
\DTLpieatendtikz
The macro \DTLpieatendtikz is called at the end of the tikzpicture
environment, allowing you add additional graphics to the pie chart. This
does nothing by default.
97
Example 24 (Adding Information to the Pie Chart)
This example modifies example 19. It redefines \DTLpieatendtikz to
add an annotated arrow.
\begin{figure}[htbp]
\centering
\renewcommand*{\DTLpieatendtikz}{%
\draw[<-] (45:1.5cm) -- (40:2.5cm)node[right]{Apples};}
\DTLpiechart{variable=\quantity}{fruit}{%
\name=Name,\quantity=Quantity}
\caption{An annotated pie chart}
\end{figure}
This produces Figure 6.10. (Note that the centre of the pie chart is the
origin of the TikZ picture.)
Apples
25
30
40.5
20
34.5
Figure 6.10: An annotated pie chart
98
7 Scatter and Line Plots (dataplot
package)
The dataplot package provides commands for creating scatter or line plots
from databases. It uses the pgf/TikZ plot handler library to create the
plots. See the pgf manual for more detail on pgf streams and plot handles.
The dataplot package is not loaded by datatool so if you want to use it you
need to load it explicitly using \usepackage{dataplot}.
\DTLplot
\DTLplot[hconditioni]{hdb listi}{hsettingsi}
This command creates a plot (inside a tikzpicture environment) of all the
data given in the databases listed in hdb listi, which should be a comma
separated list of database names. The optional argument hconditioni is the
same as that for \DTLforeach. The hsettingsi argument is a comma
separated list of hsettingi=hvaluei pairs. There are two settings that must
be specified x and y. The other settings are optional. Note that any value
that contains a comma, must be enclosed in braces. For example
colors={red,cyan,blue}. Note where any setting requires a
number, or list of numbers (such as bounds) the number must be supplied
in standard decimal notation (i.e. no currency, no number groups, and a
full stop as the decimal point). Available settings are as follows:
x The database key that specifies the x co-ordinates. This setting is
required.
y The database key that specifies the y co-ordinates. This setting is
required.
markcolors A comma separated list of colour names for the markers. An
empty value will use the current colour.
linecolors A comma separated list of colour names for the plot lines. An
empty value will use the current colour.
colors A comma separated list of colour names for the lines and markers.
marks A comma separated list of code to generate plot marks. (This
should typically be a list of \pgfuseplotmark commands, see the
99
pgf manual for further details.) You may use \relax as an element
of the list to suppress markers for the corresponding plot. For
example: marks={\pgfuseplotmark{o},\relax} will use an
open circle marker for the first database, and no markers for the
second database listed in hdb listi.
lines A comma separated list of line style settings. (This should typically
be a list of \pgfsetdash commands, see the pgf manual for further
details on how to set the line style.) An empty value will use the
current line style. You may use \relax as an element of the list to
suppress line for the corresponding plot. For example:
lines={\relax,\pgfsetdash{}{0pt}} will have no lines for
the first database, and a solid line for the second database listed in
hdb listi.
width The width of the plot. This must be a length. The plot width does
not include outer tick marks or labels.
height The height of the plot. This must be a length. The plot height does
not include outer tick marks or labels.
style This setting governs whether to use lines or markers in the plot,
and may take one of the following values: both (lines and
markers), lines (only lines) or markers (only markers). The
default is markers.
axes This setting governs whether to display the axes, and may take one
of the following values: both, x, y or none. If no value is specified,
both is assumed.
box This setting governs whether or not to surround the plot in a box. It
is a boolean setting, taking only the values true and false. If no
value is specified, true is assumed.
xtics This setting governs whether or not to display the x tick marks. It is
a boolean setting, taking only the values true and false. If no
value is specified true is assumed. If the axes setting is set to both
or x, this value will automatically be set to true, otherwise it will
be set to false.
ytics This setting governs whether or not to display the y ticks. It is a
boolean setting, taking only the values true and false. If no
value is specified true is assumed. If the axes setting is set to both
or y, this value will automatically be set to true, otherwise it will
be set to false.
100
xminortics This setting governs whether or not to display the x minor
tick marks. It is a boolean setting, taking only the values true and
false. If no value is specified true is assumed. This setting also
sets the x major tick marks on if the value is true.
yminortics This setting governs whether or not to display the y minor
tick marks. It is a boolean setting, taking only the values true and
false. If no value is specified true is assumed. This setting also
sets the y major tick marks on if the value is true.
xticdir This sets the x tick direction, and may only take the values in or
out.
yticdir This sets the y tick direction, and may only take the values in or
out.
ticdir This sets the x and y tick direction, and may only take the values
in or out.
bounds The value must be in the form hmin xi,hmin yi,hmax xi,hmax yi.
This sets the graph bounds to the given values. If omitted the
bounds are computed from the maximum and minimum values of
the data. For example
\DTLplot{data1,data2}{x=Height,y=Weight,bounds={0,0,10,20}}
Note that the bounds setting overrides the minx, maxx, miny and maxy
settings.
minx The value is the minimum value of the x axis.
miny The value is the minimum value of the y axis.
maxx The value is the maximum value of the x axis.
maxy The value is the maximum value of the y axis.
xticpoints The value must be a comma separated list of decimal numbers
indicating where to put the x tick marks. If omitted, the x tick
marks are placed at equal intervals along the x axis such that each
interval is not less than the length given by \DTLmintickgap.
This setting overrides xticgap.
xticgap This value specifies the gap between the x tick marks.
yticpoints The value must be a comma separated list of decimal numbers
indicating where to put the y tick marks. If omitted, the y tick
marks are placed at equal intervals along the y axis such that each
interval is not less than the length given by \DTLmintickgap.
This setting overrides yticgap.
101
yticgap This value specifies the gap between the y tick marks.
grid This is a boolean value that specifies whether or not to display the
grid. If no value is given, true is assumed. The minor grid lines
are only displayed if the minor tick marks are set.
xticlabels The value must be a comma separated list of labels for each x
tick mark. If omitted, the labels are the value of the x tick position,
rounded hni digits after the decimal point, where hni is given by
the value of the counter DTLplotroundXvar.
yticlabels The value must be a comma separated list of labels for each y
tick mark. If omitted, the labels are the value of the y tick position,
rounded hni digits after the decimal point, where hni is given by
the value of the counter DTLplotroundYvar.
xlabel The value is the label for the x axis. If omitted, the axis has no
label.
ylabel The value is the label for the y axis. If omitted, the axis has no
label.
legend This setting governs whether or not to display the legend, and
where it should be displayed. It may take one of the following
values none (don’t display the legend), north, northeast, east,
southeast, south, southwest, west or northwest. If the
value is omitted, northeast is assumed.
legendlabels The value must be a comma separated list of labels for the
legend. If omitted, the database names are used.
Example 25 (A Basic Graph)
Suppose you have a file called groupa.csv that contains the following:
Height,Weight
1.55,45.4
1.54,48.0
1.56,58.0
1.56,50.2
1.57,46.0
1.58,48.3
1.59,56.5
1.59,58.1
1.60,60.9
1.62,56.3
102
First load this into a database called groupa:
\DTLloaddb{groupa}{groupa.csv}
The data can now be converted into a scatter plot as follows:
\begin{figure}[htbp]
\centering
\DTLplot{groupa}{x=Height,y=Weight}
\caption{A scatter plot}
\end{figure}
This produces Figure 7.1.
60.90
59.35
57.80
56.25
54.70
53.15
51.60
50.05
48.50
46.95
45.40
1.54 1.55 1.56 1.56 1.57 1.58 1.59 1.60 1.60 1.61 1.62
Figure 7.1: A scatter plot
Alternatively, you can use the style setting to change it into a line plot:
\begin{figure}[htbp]
\centering
\DTLplot{groupa}{x=Height,y=Weight,style=lines}
\caption{A line plot}
\end{figure}
This produces Figure 7.2.
103
60.90
59.35
57.80
56.25
54.70
53.15
51.60
50.05
48.50
46.95
45.40
1.54 1.55 1.56 1.56 1.57 1.58 1.59 1.60 1.60 1.61 1.62
Figure 7.2: A line plot
104
Example 26 (Plotting Multiple Data Sets)
In this example, I shall use the database called groupa defined in
example 25, and another database called groupb which is loaded from
the file groupb.csv which contains the following:
Height,Weight
1.54,48.4
1.54,42.0
1.55,64.0
1.56,58.2
1.56,49.0
1.57,40.3
1.58,51.5
1.58,63.1
1.59,74.9
1.59,59.3
First load this into a database called groupb:
\DTLloaddb{groupb}{groupb.csv}
I can now plot both groups in the same graph, but I want a smaller graph
than Figure 7.1 and Figure 7.2, so I am going to set the plot width and
height to 3in:
\begin{figure}[htbp]
\centering
\DTLplot{groupa,groupb}{x=Height,y=Weight,width=3in,height=3in}
\caption{A scatter plot}
\end{figure}
This produces Figure 7.3.
Now let’s add a legend using the legend setting, with the legend labels
Group A and Group B, and set the x tick intervals using xticpoints
setting. I am also going to set the x axis label to Height (m) and the y
axis label to Weight (kg), and place a box around the plot.
\begin{figure}[htbp]
\centering
\DTLplot{groupa,groupb}{x=Height,y=Weight,
width=3in,height=3in,legend,legendlabels={Group A,Group B},
xlabel={Height (m)},ylabel={Weight (kg)},box,
xticpoints={1.54,1.55,1.56,1.57,1.58,1.59,1.60,1.61,1.62}}
\caption{A scatter plot}
\end{figure}
This produces Figure 7.4.
105
74.90
71.44
67.98
64.52
61.06
57.60
54.14
50.68
47.22
43.76
40.30
1.54 1.55 1.56 1.56 1.57 1.58 1.59 1.60 1.60 1.61 1.62
Figure 7.3: A scatter plot
74.90
Group A
Group B
71.44
67.98
Weight (kg)
64.52
61.06
57.60
54.14
50.68
47.22
43.76
40.30
1.54 1.55 1.56 1.57 1.58 1.59 1.60 1.61 1.62
Height (m)
Figure 7.4: A scatter plot
106
7.1 Adding Information to the Plot
The datatool package provides two hooks used at the beginning and end
of the tikzpicture environment:
\DTLplotatbegintikz
\DTLplotatbegintikz
and
\DTLplotatendtikz
\DTLplotatendtikz
They are both defined to do nothing by default, but can be redefined to
add commands to the image. The unit vectors are set prior to using these
hooks, so you can use the same co-ordinates as those in the data sets.
\DTLaddtoplotlegend
\DTLaddtoplotlegend{hmarkeri}{hline stylei}{htexti}
This adds a new row to the plot legend where hmarkeri is code to produce
the marker, hline stylei is code to set the line style and htexti is a textual
label. You can use \relax to suppress the marker or line. For example:
\DTLaddtoplotlegend{\pgfuseplotmark{x}}{\relax}{Some Data}
Note that the legend is plotted before \DTLplotatendtikz, so if you
want to add information to the legend you will need to do the in
\DTLplotatstarttikz.
Example 27 (Adding Information to a Plot)
Returning to the plots created in example 26, suppose I now want to
annotate the plot, say I want to draw your notice to a particular point,
say the point (1.58,48.3), then I can redefine \DTLplotatendtikz to
draw an annotated arrow to that point:
\renewcommand*{\DTLplotatendtikz}{%
\draw[<-,line width=1pt] (1.58,48.3) -- (1.6,43)
node[below]{interesting point};
}
So Figure 7.4 now looks like Figure 7.5. (Obviously,
\DTLplotatendtikz needs to be redefined before using \DTLplot.)
107
74.90
Group A
Group B
71.44
67.98
Weight (kg)
64.52
61.06
57.60
54.14
50.68
47.22
43.76
interesting point
40.30
1.54 1.55 1.56 1.57 1.58 1.59 1.60 1.61 1.62
Height (m)
Figure 7.5: A scatter plot
7.2 Global Plot Settings
7.2.1 Lengths
This section describes the lengths that govern the appearance of the plot
created using \DTLplot. These lengths can be changed using
\setlength.
\DTLplotwidth
\DTLplotwidth
This length governs the length of the x axis. Note that the plot width
does not include any outer tick marks or labels. The default value is 4in.
\DTLplotheight
\DTLplotheight
This length governs the length of the y axis. Note that the plot height
does not include any outer tick marks or labels. The default value is 4in
\DTLticklength
\DTLticklength
108
This governs the length of the tick marks. The default value is 5pt.
\DTLminorticklength
\DTLminorticklength
This governs the length of the minor tick marks. The default value is 2pt.
\DTLticklabeloffset
\DTLticklabeloffset
This governs the distance from the axis to the tick labels. The default
value is 8pt.
\DTLmintickgap
\DTLmintickgap
This is the minimum distance allowed between tick marks. If the plot
width or height is less than this distance there will only be tick marks at
either end of the axis. The default value is 20pt.
\DTLlegendxoffset
\DTLlegendxoffset
This is the horizontal distance from the border of the plot to the outer
border of the legend. The default value is 10pt.
\DTLlegendyoffset
\DTLlegendyoffset
This is the vertical distance from the border of the plot to the outer border
of the legend. The default value is 10pt.
7.2.2 Counters
These counters govern the appearance of plots created using \DTLplot.
The value of the counters can be changed using \setcounter.
DTLplotroundXvar
DTLplotroundXvar
Unless you specify your own tick labels, the x tick labels will be given by
the tick points rounded to hni digits after the decimal point, where hni is
the value of the counter DTLplotroundXvar.
DTLplotroundYvar
109
DTLplotroundYvar
Unless you specify your own tick labels, the y tick labels will be given by
the tick points rounded to hni digits after the decimal point, where hni is
the value of the counter DTLplotroundYvar.
7.2.3 Macros
These macros govern the appearance of plots created using \DTLplot.
They can be changed using \renewcommand.
\DTLplotmarks
\DTLplotmarks
This must be a comma separated list of pgf code to create the plot marks.
\DTLplot cycles through this list for each database listed. The pgf
package provides convenient commands for generating plots using
\pgfuseplotmark. See the pgf manual for more details.
\DTLplotmarkcolors
\DTLplotmarkcolors
This must be a comma separated list of defined colours to apply to the
plot marks. \DTLplot cycles through this list for each database listed. If
this macro is set to empty, the current colour will be used instead.
\DTLplotlines
\DTLplotlines
This must be a comma separated list of pgf code to set the style of the plot
lines. \DTLplot cycles through this list for each database listed. Dash
patterns can be set using \pgfsetdash, see the pgf manual for more
details. If \DTLplotlines is set to empty the current line style will be
used instead.
\DTLplotlinecolors
\DTLplotlinecolors
This must be a comma separated list of defined colours to apply to the
plot lines. \DTLplot cycles through this list for each database listed. If
this macro is set to empty, the current colour will be used instead. The
default is the same as \DTLplotmarkcolors.
\DTLXAxisStyle
\DTLXAxisStyle
110
This governs the style of the x axis. It is passed as the optional argument
to the TikZ \draw command. By default it is just - which is a solid line
style with no start or end arrows. The x axis line starts from the bottom
left corner of the plot and extends to the bottom right corner of the plot.
So if you want the x axis to have an arrow head at the right end, you can
do:
\renewcommand*{\DTLXAxisStyle}{->}
\DTLYAxisStyle
\DTLYAxisStyle
This governs the style of the y axis. It is analogous to \DTLXAxisStyle
described above.
\DTLmajorgridstyle
\DTLmajorgridstyle
This specifies the format of the major grid lines. It may be set to any TikZ
setting that you can pass to the optional argument of \draw. The default
value is color=gray,- which indicates a grey solid line.
\DTLminorgridstyle
\DTLminorgridstyle
This specifies the format of the minor grid lines. It may be set to any TikZ
setting that you can pass to the optional argument of \draw. The default
value is color=gray,loosely dotted which indicates a grey dotted
line.
\DTLformatlegend
\DTLformatlegend{hlegendi}
This formats the entire legend, which is passed as the argument. The
default is to set the legend with a white background, a black frame.
7.3 Adding to a Plot Stream
\DTLplotstream
\DTLplotstream[hconditioni]{hdb namei}{hx keyi}{hy keyi}
This adds points to a stream from the database called hdb namei where
the x co-ordinates are given by the key hx keyi and the y co-ordinates are
111
given by the key hy keyi. (\DTLconverttodecimal is used to convert
locale dependent values to a standard decimal that is recognised by the
pgf package.) The optional argument hconditioni is the same as that for
\DTLforeach.
Example 28 (Adding to a Plot Stream)
Suppose you have a CSV file called data.csv containing the following:
x,y
0,0
1,1
2,0.5
1.5,0.3
First load the file into a database called data:
\DTLloaddb{data}{data.csv}
Now create a figure containing this data:
\begin{figure}[tbhp]
\centering
\begin{tikzpicture}
\pgfplothandlermark{\pgfuseplotmark{o}}
\pgfplotstreamstart
\DTLplotstream{data}{x}{y}%
\pgfplotstreamend
\pgfusepath{stroke}
\end{tikzpicture}
\caption{Adding to a plot stream}
\end{figure}
This produces Figure 7.6.
Figure 7.6: Adding to a plot stream
Example 29 (Plotting Multiple Keys in the Same Database)
Suppose I have conducted two time to growth experiments. For each
experiment, I have recorded the log count at set times, and I have
recorded this information in the same data file called, say, growth.csv
which contains the following:
112
Time,Experiment 1,Experiment 2
0,3.73,3.6
23,3.67,3.7
60,4.9,3.8
I can load the data into a database using:
\DTLloaddb{growth}{growth.csv}
However, I’d like to plot both results on the same graph. Since they are
contained in the same database, I can’t use the method I used in
example 26. Instead I can use a combination of \DTLplot and
\DTLplotstream:
\begin{figure}[tbhp]
\centering
% computer bounds
\DTLminforkeys{growth}{Time}{\minX}
\DTLminforkeys{growth}{Experiment 1,Experiment 2}{\minY}
\DTLmaxforkeys{growth}{Time}{\maxX}
\DTLmaxforkeys{growth}{Experiment 1,Experiment 2}{\maxY}
% round x tick labels
\setcounter{DTLplotroundXvar}{0}
% redefine \DTLplotatbegintikz to plot the data for Experiment 1
\renewcommand*{\DTLplotatbegintikz}{%
% set plot mark
\pgfplothandlermark{\color{green}\pgfuseplotmark{x}}
% start plot stream
\pgfplotstreamstart
% add data from Experiment 1 to plot stream
\DTLplotstream{growth}{Time}{Experiment 1}%
% end plot stream
\pgfplotstreamend
% stroke path
\pgfusepath{stroke}
% add information to legend (no line is require so use \relax)
\DTLaddtoplotlegend{\color{green}%
\pgfuseplotmark{x}}{\relax}{Experiment 1}
}
% now plot the data for Experiment 2
\DTLplot{growth}{x=Time,y=Experiment 2,legend,
width=3in,height=3in,bounds={\minX,\minY,\maxX,\maxY},
xlabel={Time},ylabel={Log Count},
legendlabels={Experiment 2}}
\caption{Time to growth data}
\end{figure}
This produces Figure 7.7. Notes:
• I redefined \DTLplotatbegintikz in order to add the new plot
to the legend, since \DTLplotatendtikz is used after the legend
113
is plotted. The x and y unit vectors are set before
\DTLplotatbegintikz so I don’t need to worry about the
co-ordinates.
• I set the counter DTLplotroundXvar to zero otherwise the x axis would
have looked too cluttered.
• I have used \DTLminforkeys and \DTLmaxforkeys to
determine the bounds since \DTLplot won’t take the data for
Experiment 1 into account when computing the bounds.
4.90
Experiment 1
Experiment 2
Log Count
4.41
3.92
3.43
2.94
2.45
1.96
1.47
0.00
0.98
0.49
0
6
12 18 24 30 36 42 48 54 60
Time
Figure 7.7: Time to growth data
114
8 Bar Charts (databar package)
The databar package provides commands for creating bar charts. It is not
loaded by the datatool package, so if you want to use it you will need to
load it explicitly using \usepackage{databar}. You must also have
the pgf package installed.
Bar charts can either be vertical or horizontal, the default is vertical. In
this section the x axis refers to the horizontal axis when plotting a vertical
bar chart and to the vertical axis when plotting a horizontal bar chart.
The x axis units are in increments of one bar. The y axis refers to the
vertical axis when plotting a vertical bar chart and to the horizontal axis
when plotting a horizontal bar chart. The y axis uses the same
co-ordinates as the data. The bars may have an upper and lower label. In
a vertical bar chart, the lower label is placed below the x axis and the
upper label is placed above the top of the bar. In a horizontal bar chart,
the lower label is placed to the left of the x axis and the upper label is
placed to the right of the end of the bar. (This is actually a misnomer as it
is possible for the “upper” label to be below the “lower” label if a bar has
a negative value, however the bars are considered to be anchored on the
x axis, and the other end of the bar is considered to be the “upper” end,
regardless of its direction.)
The databar package options are as follows:
color=databar Created coloured bar charts (default).
gray=databar Created grey scale bar charts.
vertical=databar Created vertical bar charts (default).
horizontal=databar Created horizontal bar charts.
\DTLbarchart
\DTLbarchart[hconditioni]{hdb namei}{hsettingsi}{hvaluesi}
\DTLmultibarchart
\DTLmultibarchart[hconditioni]{hdb namei}{hsettingsi}{hvaluesi}
These commands both create a bar chart from the information in the
database hdb namei, where hconditioni is the same as the optional
115
argument for \DTLforeach described in section 5.4, and hvaluesi is the
same as the penultimate argument of \DTLforeach. The hsettingsi
argument is a hsettingi=hvaluei list of settings. The first command,
\DLTbarchart, will draw a bar chart for a given column of data in the
database, whereas the second command, \DTLmultibarchart, will
draw a bar chart that is divided into groups of bars where each bar
within a group represents data from several columns of a given row in
the database.
The variable setting is required for \DTLbarchart and the variables, the
other settings are optional (though some may only be used for one of
\DTLbarchart and \DLTmultibarchart), and are as follows:
variable This specifies the control sequence to use that contains the value
used to construct the bar chart. The control sequence must be one
of the control sequences to appear in the assignment list hvaluesi.
This setting is required for \DTLbarchart, and is unavailable for
\DTLmultibarchart.
variables This specifies a list of control sequences to use which contain
the values used to construct the bar chart. Each control sequence
must be one of the control sequences to appear in the assignment
list hvaluesi. This setting is required for \DTLmultibarchart, and
is unavailable for \DTLbarchart.
max This specifies the maximum value on the y axis. (This should be a
standard decimal value.)
length This specifies the overall length of the y axis, and must be a
dimension.
maxdepth This must be a zero or negative number. It specifies the
maximum depth of the y axis. (This should be a standard decimal
value.)
axes This setting specifies which axes to display. This may take one of
the following values: both, x, y or none.
barlabel This setting specifies the lower bar label. When used with
\DTLmultibarchart it indicates the group label.
multibarlabels This setting should contain a comma separated list of
labels for each bar within a group for \DTLmultibarchart. This
setting is not available for \DTLbarchart.
upperbarlabel This setting specifies the upper bar label. This setting is not
available for \DTLmultibarchart.
116
uppermultibarlabels This setting must be a comma separated list of upper
bar labels for each bar within a group. This setting is not available
for \DTLbarchart.
yticpoints This must be a comma separated list of tick locations for the y
axis. (These should be standard decimal values.) This setting
overrides yticgap.
yticgap This specifies the gap between the y tick marks. (This should be a
standard decimal value.)
yticlabels This must be a comma separated list of tick labels for the y axis.
ylabel This specifies the label for the y axis.
groupgap This specifies the gap between groups when using
\DTLmultibarchart. This value is given as a multiple of the bar
width. The default value is 1, which indicates a gap of one bar
width. This setting is not available for \DTLbarchart.
verticalbars This is a boolean setting, so it can only take the values true
(do a vertical bar chart) or false (do a horizontal bar chart). If the
value is omitted, true is assumed.
Example 30 (A Basic Bar Chart)
Recall example 19 defined a database called fruit. This example will be
using that database to plot a bar chart. The following plots a basic
vertical bar chart:
\begin{figure}[htbp]
\centering
\DTLbarchart{variable=\theQuantity}{fruit}{\theQuantity=Quantity}
\caption{A basic bar chart}
\end{figure}
This produces Figure 8.1.
8.1 Changing the Appearance of a Bar Chart
\DTLbarchartlength
\DTLbarchartlength
117
Figure 8.1: A basic bar chart
This specifies the total length of the y axis. You must use \setlength to
change this value. The default value is 3in.
\DTLbarwidth
\DTLbarwidth
This specifies the width of each bar. You must use \setlength to
change this value. The default value is 1cm.
\DTLbarlabeloffset
\DTLbarlabeloffset
This specifies the distance from the x axis to the lower bar label. You
must use \setlength to change this value. The default value is 10pt.
DTLbarroundvar
DTLbarroundvar
The y tick labels are rounded to hni digits after the decimal point, where
hni is given by the value of the counter DTLbarroundvar. You must use
\setcounter to change this value.
\DTLsetbarcolor
118
\DTLsetbarcolor{hni}{hcolori}
This sets the hnith bar colour to hcolori. Only the first eight bars have a
colour defined by default. If you need more than eight bars, you will
need to define more bar colours. It is recommended that you set the
colour of each bar to correspond with whatever the bar represents.
\DTLdobarcolor
\DTLdobarcolor{hni}
This sets the current colour to the colour of the hnith bar.
\DTLbaroutlinecolor
\DTLbaroutlinecolor
This macro contains the colour of the bar outlines. This defaults to
black.
\DTLbaroutlinewidth
\DTLbaroutlinewidth
This length specifies the line width for the bar outlines. If it is 0pt, the
outline is not drawn. The default value is 0pt.
\DTLbaratbegintikz
\DTLbaratbegintikz
This specifies any additional commands to add to the start of the plot. It
defaults to nothing, and is called after the unit vectors are set.
\DTLbaratendtikz
\DTLbaratendtikz
This specifies any additional commands to add to the end of the plot. It
defaults to nothing.
\DTLeverybarhook
\DTLeverybarhook
\DTLstartpt
\DTLmidpt
\DTLendpt
The specifies code to apply at every bar. Within the definition of
\DTLeverybarhook you can use the commands \DTLstartpt (the
start of the bar), \DTLmidpt (the mid point of the bar) and \DTLendpt
(the end of the bar). For example (using the earlier fruit database):
\renewcommand*{\DTLeverybarhook}{%
119
\pgftext[at=\DTLmidpt]{\insertName\space(\insertValue)}%
}
\DTLbarchart{variable=\insertValue,axes=both,
ylabel=Quantity,max=50,verticalbars=false
}%
{fruit}{\insertValue=Value,\insertName=Name}
This puts the name followed by the quantity in brackets in the middle of
the bar.
\ifDTLverticalbars
\ifDTLverticalbars
This conditional governs whether the chart uses vertical or horizontal
bars.
\DTLbarXlabelalign
\DTLbarXlabelalign
This specifies the text alignment of the lower bar labels. This defaults to
left,rotate=-90 if you use the vertical=databar package option or the
verticalbars setting, and defaults to right if you use the horizontal=databar
package option or the verticalbars=false setting.
\DTLbarYticklabelalign
\DTLbarYlabelalign
This specifies the text alignment of the y axis labels. This defaults to
right for vertical bar charts and center for horizontal bar charts.
\DTLbardisplayYticklabel
\DTLbardisplayYticklabel{htexti}
This specifies how to display the y tick label. The argument is the tick
label.
\DTLdisplaylowerbarlabel
\DTLdisplaylowerbarlabel{htexti}
This specifies how to display the lower bar label for \DTLbarchart and
the lower bar group label for \DTLmultibarchart. The argument is
the label.
\DTLdisplaylowermultibarlabel
\DTLdisplaylowermultibarlabel{htexti}
120
This specifies how to display the lower bar label for
\DTLmultibarchart. The argument is the label. This command is
ignored by \DTLbarchart.
\DTLdisplayupperbarlabel
\DTLdisplayupperbarlabel{htexti}
This specifies how to display the upper bar label for \DTLbarchart and
the upper bar group label for \DTLmultibarchart. The argument is
the label.
\DTLdisplayuppermultibarlabel
\DTLdisplayuppermultibarlabel{htexti}
This specifies how to display the upper bar label for
\DTLmultibarchart. The argument is the label. This command is
ignored by \DTLbarchart.
Example 31 (A Labelled Bar Chart)
This example extends example 30 so that the chart is a bit more
informative (which is after all the whole point of a chart). This chart now
has a label below each bar, as well as a label above the bar. The lower
label uses the value of the Name key, and the upper label uses the
quantity. I have also set the outline width so each bar has a border.
\begin{figure}[htbp]
\setlength{\DTLbaroutlinewidth}{1pt}
\centering
\DTLbarchart{variable=\theQuantity,barlabel=\theName,%
upperbarlabel=\theQuantity}{fruit}{%
\theQuantity=Quantity,\theName=Name}
\caption{A bar chart}
\end{figure}
This produces Figure 8.2.
Example 32 (Profit/Loss Bar Chart)
Suppose I have a file called profits.csv that looks like:
Year,Profit
2000,\pounds2,535
2001,\pounds3,752
2002,-\pounds1,520
2003,\pounds1,270
121
40.5
34.5
30
25
20
Cherries
Peaches
Lemons,Limes
Pears
Apples
Figure 8.2: A bar chart
122
First I can load this file into a database called profits:
\DTLloaddb{profits}{profits.csv}
Now I can plot the data as a bar chart:
\begin{figure}[htbp]
\centering
% Set the width of each bar to 10pt
\setlength{\DTLbarwidth}{10pt}
% Set the outline width to 1pt
\setlength{\DTLbaroutlinewidth}{1pt}
% Round the $y$ tick labels to integers
\setcounter{DTLbarroundvar}{0}
% Adjust the tick label offset
\setlength{\DTLticklabeloffset}{20pt}
% Change the y tick label alignment
\renewcommand*{\DTLbarYticklabelalign}{left}
% Rotate the y tick labels
\renewcommand*{\DTLbardisplayYticklabel}[1]{\rotatebox{-45}{#1}}
% Set the bar colours depending on the value of \theProfit
\DTLforeach{profits}{\theProfit=Profit}{%
\ifthenelse{\DTLislt{\theProfit}{0}}
{\DTLsetbarcolor{\DTLcurrentindex}{red}}
{\DTLsetbarcolor{\DTLcurrentindex}{blue}}}
% Do the bar chart
\DTLbarchart{variable=\theProfit,upperbarlabel=\theYear,
ylabel={Profit/Loss (\pounds)},verticalbars=false,
maxdepth=-2000,max=4000}{profits}
{\theProfit=Profit,\theYear=Year}
\caption{Profits for 2000--2003}
\end{figure}
This produces Figure 8.3. Notes:
1. This example uses \rotatebox, so the graphics or graphicx package
is required.
2. The y tick labels are too wide to fit horizontally so they have been
rotated to avoid overlapping with their neighbour.
3. Rotating the y tick labels puts them too close to the y axis, so
\DTLticklabeloffset is made larger to compensate.
4. Remember not to use \year as an assignment command as this
command already exists!
5. Before the bar chart is created I have iterated through the database,
setting the bar colour to red or blue depending on the value of
\theProfit.
123
Both \DTLbarchart and \DTLmultibarchart set the following
macros, which may be used in \DTLbaratbegintikz and
\DTLbaratendtikz:
\DTLbarchartwidth
\DTLbarchartwidth
This is the overall width of the bar chart. In the case of \DTLbarchart
this is just the number of bars. In the case of \DTLmultibarchart it is
computed as:
m × n + ( m − 1) × g
where m is the number of bar groups (i.e. the number of rows of data), n
is the number of bars within a group (i.e. the number of commands listed
in the variables) setting and g is the group gap (as specified by the
groupgap setting).
\DTLnegextent
\DTLnegextent
This is set to the negative extent of the bar chart. (This value may either
be zero or negative, and corresponds to the maxdepth setting.)
\DTLbarmax
\DTLbarmax
This is set to the maximum extent of the bar chart. (This value
corresponds to the max setting.)
2003
2002
2000
2001
Profit/Loss (£)
Figure 8.3: Profits for 2000–2003
Example 33 (A Multi-Bar Chart)
This example uses the marks database described in example 13. Recall
that this database stores student marks for three assignments. The keys
for the assignment marks are Assignment 1, Assignment 2 and
Assignment 3, respectively. I can convert this data into a bar chart
using the following:
124
\begin{figure}[htbp]
\centering
\DTLmultibarchart{variables={\assignI,\assignII,\assignIII},
barwidth=10pt,uppermultibarlabels={\assignI,\assignII,\assignIII},
barlabel={\firstname\ \surname}}{marks}{%
\surname=Surname,\firstname=FirstName,\assignI=Assignment 1,%
\assignII=Assignment 2,\assignIII=Assignment 3}
\caption{Student marks}
\end{figure}
This produces Figure 8.4. Notes:
1. I used variables={\assignI,\assignII,\assignIII} to
set the variable to use for each bar within a group. This means that
there will be three bars in each group.
2. I have set the bar width to 10pt, otherwise the chart will be too
wide.
3. I used
uppermultibarlabels={\assignI,\assignII,\assignIII}
to set the upper labels for each bar within a group. This will print
the assignment mark above the relevant bar.
4. I used barlabel={\firstname\ \surname} to place the
student’s name below the group corresponding to that student.
Recall that example 13 computed the average score over for each student,
and saved it with the key Average. This information can be added to the
bar chart. It might also be useful to compute the average over all students
and add this information to the chart. This is done as follows:
\begin{figure}[htbp]
\centering
% compute the overall mean
\DTLmeanforkeys{marks}{Average}{\overallmean}
% round it to 2 decimal places
\DTLround{\overallmean}{\overallmean}{2}
% draw a grey dotted line indicating the overall mean
% covering the entire width of the bar chart
\renewcommand*{\DTLbaratendtikz}{%
\draw[lightgray,loosely dotted] (0,\overallmean) -(\DTLbarchartwidth,\overallmean)
node[right,black]{Average (\overallmean)};}
% Set the lower bar labels to draw a brace across the current
% group, along with the student’s name and average score
\renewcommand*{\DTLdisplaylowerbarlabel}[1]{%
\tikz[baseline=(current bounding box.center)]{
\draw[snake=brace,rotate=-90](0,0) -- (\DTLbargroupwidth,0);}
125
68
72
84
80
75
6062
57 58
57
5254 52
48
42
5048
45
126
Clare Verdon
Roger Brady
Zöe Adams
Andy Brown
Jane Brown
John Smith, Jr
Figure 8.4: Student marks
\DTLround{\theMean}{\theMean}{2}%
\shortstack{#1\\(Average: \theMean)}}
% draw the bar chart
\DTLmultibarchart{variables={\assignI,\assignII,\assignIII},
barwidth=10pt,uppermultibarlabels={\assignI,\assignII,\assignIII},
barlabel={\firstname\ \surname}}{marks}
{\surname=Surname,\firstname=FirstName,\assignI=Assignment 1,%
\assignII=Assignment 2,\assignIII=Assignment 3,\theMean=Average}
\caption{Student marks}
\end{figure}
which produces Figure 8.5. Notes:
1. I’ve used the TikZ snake library to create a brace, so I need to put
\usetikzlibrary{snakes}
in the preamble. See the pgf manual for more details on how to use
this library.
2. I used \DTLbargroupwidth to indicate the width of each bar
group.
3. I used \DTLbarchartwidth to indicate the width of the entire bar
chart
127
68
72
84
80
75
5048
45
5254 52
48
42
57
Clare Verdon
(Average: 47.67)
Roger Brady
(Average: 60)
Zöe Adams
(Average: 52.33)
Andy Brown
(Average: 49.33)
Jane Brown
(Average: 79.67)
John Smith, Jr
(Average: 65.67)
128
Average (59.11)
6062
58
57
Figure 8.5: Student marks
9 Converting a BIBTEX database into a
datatool database (databib package)
The databib package provides the means of converting a BIBTEX database
into a datatool database. The database can then be sorted using
\DTLsort, described in section 5.8. For example, you may want to sort
the bibliography in reverse chronological order. Once you have sorted
the bibliography, you can display it using \DTLbibliography,
described in section 9.3, or you can iterate through the database using
\DTLforeachbib, described in section 9.5.
Note that the databib package is not automatically loaded by datatool, so if
you want to use it, you must load it using \usepackage{databib}.
The purpose of this package is to provide a means for authors to format their own bibliography style where there is no bibliography style
file available that produces the desired results. The \DTLsort macro
uses a much less efficient sorting algorithm than BIBTEX, and loading
the bibliography as a datatool database is much slower than loading a
standard bbl file. If you have a large database, and you are worried
that LATEX may have become stuck, try using the verbose option to datatool or use the command \dtlverbosetrue. This will print informative messages to the console and transcript file, to let you know what’s
going on.
9.1 BIBTEX: An Overview
This document assumes that you have at least some passing familiarity
with BIBTEX, but here follows a brief refresher.
BIBTEX is an external application used in conjunction with LATEX. When
you run BIBTEX, you need to specify the name of the document’s auxiliary
file (without the aux extension). BIBTEX then reads this file and looks for
the commands \bibstyle (which indicates which bibliography style
(bst) file to load), \bibdata (which indicates which bibliography
database (bib) files to load) and \citation (produced by \cite and
\nocite, which indicates which entries should be included in the
bibliography). BIBTEX then creates a file with the extension bbl which
129
contains the bibliography, formatted according to the layout defined in
the bibliography style file.
In general, given a document called, say, mydoc.tex, you will have to
perform the following steps to ensure that the bibliography and all
citations are up-to-date:
1. latex mydoc
This writes the citation information to the auxiliary file. The
bibliography currently doesn’t exists, so it isn’t displayed. Citations
will appear in the document as ?? since the internal cross-references
don’t exist yet.
2. bibtex mydoc
This reads the auxiliary file, and creates a file with the extension
bbl which typically contains the typeset bibliography.
3. latex mydoc
Now that the bbl file exists, the bibliography can be input into the
document. The internal cross-referencing information for the
bibliography can now be written to the auxiliary file.
4. latex mydoc
The cross-referencing information can be read from the auxiliary
file.
9.1.1 BIBTEX database
The bibliographic data required by BIBTEX must be stored in a file with
the extension bib, where each entry is stored in the form:
@hentry_typei{hcite_keyi,
hfield_namei = "hvaluei",
..
.
hfield_namei = "hvaluei"
}
Note that curly braces { and } may be used instead of " and ".
The entry type, given by hentry_typei above, indicates the type of
document. This may be one of: article, book, booklet, inbook,
incollection, inproceedings1 , manual, mastersthesis, misc,
phdthesis, proceedings,
techreport or unpublished.
1 Note
that conference is a synonym for inproceedings.
130
The hcite_keyi above is a unique label identifying this entry, and is the
label used in the argument of \cite or \nocite. The available fields
depends on the entry type, for example, the field journal is required for
the article entry type, but is ignored for the inproceedings entry
type. The standard fields are: address, author, booktitle, chapter,
edition, editor, howpublished, institution, journal, key,
month, note, number, organization, pages, publisher, school,
series, title, type, volume and year.
Author and editor names must be entered in one of the following ways:
1. hFirst namesi hvon parti hSurnamei, hJr parti
The hvon parti is optional and is identified by the name(s) starting
with lowercase letters. The final comma followed by hJr parti is also
optional. Examples:
author = "Henry James de Vere"
In the above, the first names are Henry James, the “von part” is de
and the surname is Vere. There is no “junior part”.
author = "Mary-Jane Brown, Jr"
In the above, the first name is Mary-Jane, there is no von part, the
surname is Brown and the junior part is Jr.
author = "Peter {Murphy Allen}"
In the above, the first name is Peter, and the surname is Murphy
Allen. Note that in this case, the surname must be grouped,
otherwise Murphy would be considered part of the forename.
author = "Maria Eliza {\uppercase{d}e La} Cruz"
In the above, the first name is Maria Eliza, the von part is De La,
and the surname is Cruz. In this case, the von part starts with an
uppercase letter, but specifying
author = "Maria Eliza De La Cruz"
would make BIBTEX incorrectly classify “Maria Eliza De La” as the
first names, and the von part would be empty. Since BIBTEX doesn’t
understand LATEX commands, using {\uppercase{d}e La} will
trick BIBTEX into thinking that it starts with a lower case letter.
131
2. hvon parti hSurnamei, hForenamesi
Again the hvon parti is optional, and is determined by the case of
the first letter. For example:
author = "de Vere, Henry James"
Multiple authors or editors should be separated by the key word and, for
example:
author = "Michel Goossens and Frank Mittlebach and Alexander Samarin"
Below is an example of a book entry:
@book{latexcomp,
title
= "The \LaTeX\ Companion",
author
= "Michel Goossens and Frank Mittlebach and
Alexander Samarin",
publisher = "Addison-Wesley",
year
= 1994
}
Note that numbers may be entered without delimiters, as in
year = 1994. There are also some predefined strings, including those
for the month names. You should always use these strings instead of the
actual month name, as the way the month name is displayed depends on
the bibliography style. For example:
@article{Cawley2007b,
author = "Gavin C. Cawley and Nicola L. C. Talbot",
title = "Preventing over-fitting in model selection via {B}ayesian
regularisation of the hyper-parameters",
journal = "Journal of Machine Learning Research",
volume = 8,
pages
= "841--861",
month
= APR,
year
= 2007
}
You can concatenate strings using the # character, for example:
month
= JUL # "~31~--~" # AUG # "~4",
Depending on the bibliography style, this may be displayed as:
July 31 – August 4, or it may be displayed as: Jul 31 – Aug 4. For further
information, see [1].
132
9.2 Loading a databib database
The databib package always requires the databib.bst bibliography
style file (which is supplied with this bundle). You need to use \cite or
\nocite as usual. If you want to add all entries in the bib file to the
datatool database, you can use \nocite{*}.
\DTLloadbbl
\DTLloadbbl[hbbl namei]{hdb namei}{hbib listi}
This command performs several functions:
1. it writes the following line in the auxiliary file:
\bibstyle{databib}
which tells BIBTEX to use the databib.bst BIBTEX style file,
2. it writes \bibdata{hbib listi} to the auxiliary file, which tells
BIBTEX which bib files to use,
3. it creates a datatool database called hdb namei,
4. it loads the file hbbl namei if it exists. (The value defaults to
\jobname.bbl, which is the usual name for a bbl file.) If the bbl
file doesn’t exist, the database hdb namei will remain empty.
You then need to run your document through LATEX (or PDFLATEX) and
then run BIBTEX on the auxiliary file, as described in section 9.1. This will
create a bbl file which contains all the commands required to add the
bibliography information to the datatool database called hdb namei. The
next time you LATEX your document, this file will be read, and the
information will be added to hdb namei.
Note that \DTLloadbbl doesn’t generate any text.
Once you
have loaded the data, you can display the bibliography uses
\DTLbibliography (described below) or you can iterate through it
using \DTLforeachbibentry described in section 9.5.
Note that the databib.bst BIBTEX style file provides the following
additional fields: isbn, doi, pubmed, url and abstract. However
these fields are ignored by the three predefined databib styles (plain,
abbrv and alpha). If you want these fields to be displayed in the
bibliography you will need to modify the bibliography style (see
subsection 9.4.1).
133
9.3 Displaying a databib database
A databib database which has been loaded using \DTLloadbbl
(described in section 9.2) can be displayed using:
\DTLbibliography
\DTLbibliography[hconditionsi]{hdb namei}
where hdb namei is the name of the database.
Within the optional argument hconditioni, you may use any of the
commands that may be used within the optional argument of
\DTLforeach In addition, you may use the following commands:
\DTLbibfieldexists
\DTLbibfieldexists{hfield labeli}
This tests whether the field with the given label exists for the current
entry. The field label may be one of: Address, Author, BookTitle,
Chapter, Edition, Editor, HowPublished, Institution,
Journal, Key, Month, Note, Number, Organization, Pages,
Publisher, School, Series, Title, Type, Volume, Year, ISBN, DOI,
PubMed, Abstract, Url or Eprints.
For example, suppose you have loaded a databib database called mybib
using \DTLloadbbl (described in section 9.2) then the following
bibliography will only include those entries which have a Year field:
\DTLbibliography[\DTLbibfieldexists{Year}]{mybib}
\DTLbibfieldiseq
\DTLbibfieldiseq{hfield labeli}{hvaluei}
This tests whether the value of the field given by hfield labeli equals
hvaluei. If the field doesn’t exist for the current entry, this evaluates to
false. For example, the following will produce a bibliography which only
contains entries which have the Year field set to 2004:
\DTLbibliography[\DTLbibfieldiseq{Year}{2004}]{mybib}
\DTLbibfieldcontains
\DTLbibfieldcontains{hfield labeli}{hsub stringi}
This tests whether the value of the field given by hfield labeli contains hsub
stringi. For example, the following will produce a bibliography which
only contains entries where the author field contains the name Knuth:
134
\DTLbibliography[\DTLbibfieldcontains{Author}{Knuth}]{mybib}
\DTLbibfieldislt
\DTLbibfieldislt{hfield labeli}{hvaluei}
This tests whether the value of the field given by hfield labeli is less than
hvaluei. If the field doesn’t exist for the current entry, this evaluates to
false. For example, the following will produce a bibliography which only
contains entries whose Year field is less than 1983:
\DTLbibliography[\DTLbibfieldislt{Year}{1983}]{mybib}
\DTLbibfieldisle
\DTLbibfieldisle{hfield labeli}{hvaluei}
This tests whether the value of the field given by hfield labeli is less than
or equal to hvaluei. If the field doesn’t exist for the current entry, this
evaluates to false. For example, the following will produce a
bibliography which only contains entries whose Year field is less than or
equal to 1983:
\DTLbibliography[\DTLbibfieldisle{Year}{1983}]{mybib}
\DTLbibfieldisgt
\DTLbibfieldisgt{hfield labeli}{hvaluei}
This tests whether the value of the field given by hfield labeli is greater
than hvaluei. If the field doesn’t exist for the current entry, this evaluates
to false. For example, the following will produce a bibliography which
only contains entries whose Year field is greater than 1983:
\DTLbibliography[\DTLbibfieldisgt{Year}{1983}]{mybib}
\DTLbibfieldisge
\DTLbibfieldisge{hfield labeli}{hvaluei}
This tests whether the value of the field given by hfield labeli is greater
than or equal to hvaluei. If the field doesn’t exist for the current entry, this
evaluates to false. For example, the following will produce a
bibliography which only contains entries whose Year field is greater
than or equal to 1983:
\DTLbibliography[\DTLbibfieldisge{Year}{1983}]{mybib}
135
Note that \DTLbibliography uses \DTLforeachbibentry
(described in section 9.5) so you may also use test the value of the
counter DTLbibrow within hconditionsi. You may also use the boolean
commands defined by the ifthen package, such as \not.
Example 34 (Creating a list of publications since a given year)
Suppose my boss has asked me to produce a list of my publications in
reverse chronological order, but doesn’t want any publications published
prior to the year 2000. I have a file called nlct.bib which contains all
my publications which I keep in the directory
$HOME/texmf/bibtex/bib/. I could look through this file, work out
the labels for all the publications whose year field is greater or equal to
2000, and create a file with a \nocite command containing all those
labels in a comma separated list in reverse chronological order, but I
really can’t be bothered to do that. Instead, I can create the following
document:
\documentclass{article}
\usepackage{databib}
\begin{document}
\nocite{*}
\DTLloadbbl{mybib}{nlct}
\DTLsort{Year=descending,Month=descending}{mybib}
\DTLbibliography[\DTLbibfieldisge{Year}{2000}]{mybib}
\end{document}
Suppose I save this file as mypubs.tex, then I need to do:
latex mypubs
bibtex mypubs
latex mypubs
Notes:
1. \nocite{*} is used to add all the citations in the bibliography file
(nlct.bib in this case) to the databib database.
2. \DTLloadbbl{mybib}{nlct} does the following:
a) writes the line
\bibstyle{databib}
to the auxiliary file. This tells BIBTEX to use databib.bst
(which is supplied with this package). You therefore shouldn’t
use \bibliographystyle.
b) writes the line
\bibdata{nlct}
136
to the auxiliary file. This tells BIBTEX that the bibliography data
is stored in the file nlct.bib. Since I have placed this file in
TEX’s search path, BIBTEX will be able to find it.
c) creates a datatool database called mybib.
d) if the bbl file (mypubs.bbl in this example) exists, it loads
this file (which adds the bibliography data to the database),
otherwise it does nothing further.
3. In my BIBTEX database (nlct.bib in this example), I have
remembered to use the BIBTEX month macros: jan, feb etc. This
means that the months are stored in the database in the form
\DTLmonthname{hnni}, where hnni is a two digit number from 01
to 12. \DTLsort ignores command names when it compares
strings, which means I can not only sort by year, but also by
month2 .
4. Once I have loaded and sorted my database, I can then display it
using \DTLbibliography. This uses the style given by the databib
style=databib package option, or the \DTLbibliographystyle
command, both of which are described in section 9.4.
5. I have filtered the bibliography using the optional argument
[\DTLbibfieldisge{Year}{2000}], which checks if the year
field of the current entry is greater than or equal to 2000. (Note that
if an entry has no year field, the condition evaluates to false, and
the entry will be omitted from the bibliography.)
6. If the bibliography database is large, sorting and creating the
bibliography may take a while. Using databib is much slower than
using a standard BIBTEX style file.
Example 35 (Creating a list of my 10 most recent publications)
Suppose now my boss has asked me to produce a list of my ten most
recent publications (in reverse chronological order). As in the previous
example, I have a file called nlct.bib which contains all my
publications. I can create the required document as follows:
\documentclass{article}
\usepackage{databib}
\begin{document}
2 as
long as I haven’t put anything before the month name in the bibliography file, e.g.
month = 2 # apr will sort by 2 03, instead of 03
137
\nocite{*}
\DTLloadbbl{mybib}{nlct}
\DTLsort{Year=descending,Month=descending}{mybib}
\DTLbibliography[\value{DTLbibrow}<10]{mybib}
\end{document}
9.4 Changing the bibliography style
The style of the bibliography produced using \DTLbibliography
depends on the style=databib package option, or can be set using
\DTLbibliographystyle
\DTLbibliographystyle{hstylei}
Note that this is not the same as \bibliographystyle, as the databib
package uses its custom databib.bst bibliography style file.
Example:
\usepackage[style=plain]{databib}
This sets the plain bibliography style. This is, in fact, the default style, so
it need not be specified.
Available styles are: plain, abbrv and alpha. These are similar to the
standard BIBTEX styles of the same name, but are by no means identical.
The most notable difference is that these styles do not sort the
bibliography. It is up to you to sort the bibliography using \DTLsort
(described in section 5.8).
9.4.1 Modifying an existing style
This section describes some of the commands which are used to format
the bibliography. You can choose whichever predefined style best fits
your required style, and then modify the commands described in this
section. A description of the remaining commands not listed in this
section can be found in section 5.4, section 5.5 and section 5.6.
\DTLformatauthor
\DTLformatauthor{hvon parti}{hsurnamei}{hjr parti}{hforenamesi}
\DTLformateditor
\DTLformateditor{hvon parti}{hsurnamei}{hjr parti}{hforenamesi}
138
These commands are used to format an author/editor’s name,
respectively. The list of authors and editors are stored in the databib
database as a comma separated list of {hvon parti}{hsurnamei}{hjr
parti}{hforenamesi} data. This ensures that when you sort on the Author
or Editor field, the names will be sorted by the first author or editor’s
surname.
Within \DTLformatauthor and \DTLformateditor, you may use the
following commands:
\DTLformatforenames
\DTLformatforenames{hforenamesi}
This is used by the plain style to display the author’s forenames3 .
\DTLformatabbrvforenames
\DTLformatabbrvforenames{hforenamesi}
This is used by the abbrv style to display the author’s initials (which are
determined from hforenamesi). Note that if any of the authors has a name
starting with an accent, the accented letter must be grouped in order for
this command to work. For example:
author = "{\’E}lise {\"E}awyn Edwards",
The initials are formed using \DTLstoreinitials described in
chapter 4, so if you want to change the way the initials are displayed (e.g.
put a space between them) you will need to redefine the commands used
by \DTLstoreinitials (such as \DTLbetweeninitials).
\DTLformatsurname
\DTLformatsurname{hsurnamei}
This displays its argument by default4 .
\DTLformatvon
\DTLformatvon{hvon parti}
If the hvon parti is empty, this command does nothing, otherwise it
displays its argument followed by a non-breakable space.
\DTLformatjr
3 It
also checks whether hforenamesi ends with a full stop using \DTLcheckendsperiod
to prevent a sentence ending full stop from following an abbreviation full stop
4 It
also checks whether the surname ends with a full stop using
\DTLcheckendsperiod
139
\DTLformatjr{hjr parti}
If the hjr parti is empty, this command displays nothing, otherwise it
displays a comma followed by its argument5 .
For example, suppose you want the author’s surname to appear first in
small capitals, followed by a comma and the forenames. This can be
achieved by redefining \DTLformatauthor as follows:
\renewcommand*{\DTLformatauthor}[4]{%
\textsc{\DTLformatvon{#1}%
\DTLformatsurname{#2}\DTLformatjr{#3}},
\DTLformatforenames{#4}%
}
DTLmaxauthors
DTLmaxauthors
The counter DTLmaxauthors is used to determine the maximum number of
authors to display for a given entry. If the entry’s author list contains
more than that number of authors, \etalname is used, the definition of
which is given in section 5.4. The default value of DTLmaxauthors is 10.
DTLmaxeditors
DTLmaxeditors
\DTLandlast
\DTLandnotlast
\DTLtwoand
\DTLendbibitem
The DTLmaxeditors counter is analogous to the DTLmaxauthors counter. It is
used to determine the maximum number of editor names to display. The
default value of DTLmaxeditors is 10.
Within a list of author or editor names, \DTLandlast is used between
the last two names, otherwise \DTLandnotlast is used between names.
However, if there are only two author or editor names, \DTLtwoand is
used instead of \DTLandlast.
The command \DTLendbibitem is a hook provided to add additional
information at the end of each bibliography item. This does nothing by
default, but if you want to display the additional fields provided by the
databib.bst style file, you can redefine \DTLendbibitem so that it
displays a particular field, if it is defined. Within this command, you may
use the commands \DTLbibfield, \DTLifbibfieldexist and
\DTLifanybibfieldexist, which are described in section 9.5. For
example, if you have used the abstract field in any of your entries, you
can display the abstract as follows:
\renewcommand{\DTLendbibitem}{%
5 again,
it also checks hjr parti to determine if it ends with a full stop
140
\DTLifbibfieldexists{Abstract}{\DTLpar\textbf{Abstract}
\begin{quote}\DTLbibfield{Abstract}\end{quote}}{}}
(Note that \DTLpar needs to be used instead of \par.)
Example 36 (Compact bibliography)
Suppose I don’t have much space in my document, and I need to produce
a compact bibliography. Firstly, I can use the bibliography style abbrv,
either through the package option:
\usepackage[style=abbrv]{databib}
or using:
\DTLbibliographystyle{abbrv}
Once I have set the style, I can further modify it thus:
\renewcommand*{\andname}{\&}
\renewcommand*{\editorname}{ed.}
\renewcommand*{\editorsname}{eds.}
\renewcommand*{\pagesname}{pp.}
\renewcommand*{\pagename}{p.}
\renewcommand*{\volumename}{vol.}
\renewcommand*{\numbername}{no.}
\renewcommand*{\editionname}{ed.}
\renewcommand*{\techreportname}{T.R.}
\renewcommand*{\mscthesisname}{MSc thesis}
Now I can load6 and display the bibliography:
% create a database called mybib from the information given
% in mybib1.bib and mybib2.bib
\DTLloadbbl{mybib}{mybib1,mybib2}
% display the bibliography
\DTLbibliography{mybib}
Example 37 (Highlighting a given author)
Suppose my boss wants me to produce a list of all my publications
(which I have stored in the file nlct.bib, as in example 34). Most of my
publications have multiple co-authors, but suppose my boss would like
me to highlight my name so that when he skims through the document,
he can easily see my name in the list of co-authors. I can do this by
6I
can load the bibliography earlier, but obviously the bibliography should only be displayed after the bibliography styles have been set, otherwise they will have no effect
141
redefining \DTLformatauthor so that it checks if the given surname
matches mine. (This assumes that none of the other co-author’s share my
surname.)
\renewcommand*{\DTLformatauthor}[4]{%
{\DTLifstringeq{#2}{Talbot}{\bfseries }{}%
\DTLformatforenames{#4}
\DTLformatvon{#1}%
\DTLformatsurname{#2}%
\DTLformatjr{#3}}}
Notes:
1. I have used \DTLifstringeq (described in section 2.1) to perform
the string comparison.
2. If one or more of my co-authors shared the same surname as me, I
would also have had to check the first name, however there is
regrettably a lack of consistency in my bib file when it comes to my
forenames. Sometimes my name is given as Nicola L. C.
Talbot, sometimes the middle initials are omitted, Nicola
Talbot, or sometimes, just initials are used, N. L. C. Talbot.
This can cause problems when checking the forenames, but as long
as the other authors who share the same surname as me, don’t also
share the same first initial, I can use \DTLifStartsWith or
\DTLisPrefix, which are described in section 2.1 and section 2.2,
respectively. Using the first approach I can do:
\renewcommand*{\DTLformatauthor}[4]{%
{\DTLifstringeq{#2}{Talbot}{\DTLifStartsWith{#4}{N}{\bfseries }{}}{}%
\DTLformatforenames{#4}
\DTLformatvon{#1}%
\DTLformatsurname{#2}%
\DTLformatjr{#3}}}
Using the second approach I can do:
\renewcommand*{\DTLformatauthor}[4]{%
{\ifthenelse{\DTLiseq{#2}{Talbot}\and
\DTLisPrefix{#4}{N}}{\bfseries }{}%
\DTLformatforenames{#4}
\DTLformatvon{#1}%
\DTLformatsurname{#2}%
\DTLformatjr{#3}}}
3. I have used a group to localise the effect of \bfseries.
142
9.5 Iterating through a databib database
\DTLbibliography (described in section 9.3) may still not meet your
needs. For example, you may be required to list journal papers and
conference proceedings in separate sections. In which case, you may find
it easier to iterate through the bibliography using:
\DTLforeachbib
\DTLforeachbib[hconditioni]{hdb namei}{htexti}
\DTLforeachbib*
\DTLforeachbib*[hconditioni]{hdb namei}{htexti}
This iterates through the databib database called hdb namei and does htexti
if hconditioni is met. As with \DTLforeach, the starred version is
read-only.
For each row of the database, the following commands are set:
\DBIBcitekey
\DBIBentrytype
• \DBIBcitekey This is the unique label which identifies the
current entry (as used in the argument of \cite and \nocite).
• \DBIBentrytype This is the current entry type, and will be one
of: article, book, booklet, inbook, incollection,
inproceedings, manual, mastersthesis, misc, phdthesis,
proceedings, techreport or unpublished. (Note that even if
you used the entry type conference in your bib file, its entry
type will be set to inproceedings).
The remaining fields may be accessed using:
\DTLbibfield
\DTLbibfield{hfield labeli}
where hfield labeli may be one of: Address, Author, BookTitle,
Chapter, Edition, Editor, HowPublished, Institution,
Journal, Key, Month, Note, Number, Organization, Pages,
Publisher, School, Series, Title, Type, Volume, Year, ISBN, DOI,
PubMed, Abstract or Url.
You can determine if a field exists for a given entry using
\DTLifbibfieldexists
\DTLifbibfieldexists{hfield labeli}{htrue parti}{hfalse parti}
If the field given by hfield labeli exists for the current bibliography entry, it
does htrue parti, otherwise it does hfalse parti.
143
\DTLifbibanyfieldexists
\DTLifanybibfieldexists{hfield label listi}{htrue parti}{hfalse
parti}
This is similar to \DTLifbibfieldexists except that the first
argument is a list of field names. If one or more of the fields given in hfield
label listi exists for the current bibliography item, this does htrue parti,
otherwise it does hfalse parti.
\DTLformatbibentry
\DTLformatbibentry
This formats the bibliography entry for the current row. It checks for the
existence of the command \DTLformathentry typei, where hentry typei is
given by \DBIBentrytype. These commands are defined by the
bibliography style.
\DTLcomputewidestbibentry
\DTLcomputewidestbibentry{hconditionsi}{hdb namei}{hbib
labeli}{hcmdi}
DTLbibrow
This computes the widest bibliography entry over all entries satisfying
hconditionsi in the database hdb namei, where the label is given by hbib
labeli, and the result is stored in hcmdi, which may then be used in the
argument of the thebibliography environment.
The counter DTLbibrowkeeps track of the current bibliography entry. This
is reset at the start of each \DTLforeachbib and is incremented if
hconditionsi is met.
Within the optional argument hconditioni, you may use any of the
commands that may be used within the optional argument of
\DTLbibliography, described in section 9.3.
Example 38 (Separate List of Journals and Conference Papers)
Suppose now my boss has decided that I need to produce a list of all my
publications, but they need to be separated so that all the journal papers
appear in one section, and all the conference papers appear in another
section. The journal papers need to be labelled [J1], [J2] and so on, while
the conference papers need to be labelled [C1], [C2] and so on. (My boss
isn’t interested in any of my other publications!) Again, all my
publications are stored in the BIBTEX database nlct.bib. The following
creates the required document:
\documentclass{article}
\usepackage{databib}
144
\begin{document}
\nocite{*}
\DTLloadbbl{mybib}{nlct}
\renewcommand*{\refname}{Journal Papers}
\DTLcomputewidestbibentry{\equal{\DBIBentrytype}{article}}
{mybib}{J\theDTLbibrow}{\widest}
\begin{thebibliography}{\widest}
\DTLforeachbibentry[\equal{\DBIBentrytype}{article}]{mybib}{%
\bibitem[J\theDTLbibrow]{\DBIBcitekey} \DTLformatbibentry}
\end{thebibliography}
\renewcommand*{\refname}{Conference Papers}
\DTLcomputewidestbibentry{\equal{\DBIBentrytype}{inproceedings}}
{mybib}{C\theDTLbibrow}{\widest}
\begin{thebibliography}{\widest}
\DTLforeachbibentry[\equal{\DBIBentrytype}{inproceedings}]{mybib}{%
\bibitem[C\theDTLbibrow]{\DBIBcitekey} \DTLformatbibentry}
\end{thebibliography}
\end{document}
9.6 Multiple Bibliographies
It is possible to have more than one bibliography in a document, but it
then becomes necessary to have a separate auxiliary file for each
bibliography, and each auxiliary file must then be passed to BIBTEX. In
order to do this, you need to use
\DTLmultibibs
\DTLmultibibs{hname listi}
where hname listi is a comma separated list of names, hnamei. For each
hnamei, this command creates an auxiliary file called hnamei.aux (note
that this command may only be used in the preamble).
When you want to cite an entry for a given bibliography named in
\DTLmultibibs, you must use:
\DTLcite
\DTLcite[htexti]{hmbibi}{hcite key listi}
This is analogous to \cite[htexti]{hcite key listi}, but writes the
145
\citation command to hmbibi.aux instead of to the document’s main
auxiliary file. It also ensures that the cross-referencing labels are based on
hmbibi, to allow you to have the same reference in more than one
bibliography without incurring a “multiply defined” warning message.
Note that you can still use \cite to add citation information to the main
auxiliary file.
If you want to add an entry to the bibliography without producing any
text, you can use
\DTLnocite
\DTLnocite{hmbibi}{hcite key listi}
which is analogous to \nocite{hcite key listi}, where again the citation
information is written to hmbibi.aux instead of the document’s main
auxiliary file.
Note that for both \DTLcite and \DTLnocite the hmbibi part must be
one of the names listed in \DTLmultibibs.
\DTLloadmbbl
\DTLloadmbbl{hmbibi}{hdb namei}{hbib listi}
This is analogous to \DTLloadbbl{hdb namei}{hbib listi} described in
section 9.2. (Again hmbibi must be one of the names listed in
\DTLmultibibs.) This creates a new datatool database called hdb namei
and loads the bibliography information from hmbibi.bbl (if it exists).
\DTLmbibliography
\DTLmbibliography[hconditioni]{hmbibi}{hdb namei}
This is analogous to \DTLbibliography[hconditioni]{hdb namei}, but
is required when displaying a bibliography in which elements have been
cited using \DTLcite and \DTLnocite.
Example 39 (Multiple Bibliographies)
Suppose I need to create a document which contains a section listing all
my publications, but I also need to have separate sections covering each
of my research topics, with a mini-bibliography at the end of each
section. As in the earlier examples, all my publications are stored in the
file nlct.bib which is somewhere on TEX’s path. Note that there will be
some duplication as the references in the mini-bibliographies will also
appear in the main bibliography at the end of the document, but using
\DTLcite and \DTLmbibliography ensures that all the
146
cross-referencing labels (and hyperlinks if they are enabled) are unique.
\documentclass{article}
\usepackage{databib}
\DTLmultibibs{kernel,food}
\begin{document}
\section{Kernel methods}
In this section I’m going to describe some research work into
kernel methods, and in the process I’m going to cite some related
papers \DTLcite{kernel}{Cawley2007a,Cawley2006a}.
\DTLloadmbbl{kernel}{kernelDB}{nlct}
\DTLmbibliography{kernel}{kernelDB}
\section{Food research}
In this section I’m going to describe some research work
in the area of food safety, and in the process, I’m going
to cite some related papers \DTLcite{food}{Peck1999,Barker1999a}
\DTLloadmbbl{food}{foodDB}{nlct}
\DTLmbibliography{food}{foodDB}
\cite{*}
\renewcommand{\refname}{Complete List of Publications}
\DTLloadbbl{fullDB}{nlct}
\DTLbibliography{fullDB}
\end{document}
Notes:
1. This will create the files kernel.aux and food.aux. These will
have to be passed to BIBTEX, in addition to the documents main
auxiliary file. So, if my document is called researchwork.tex,
then I need to do:
latex researchwork
bibtex researchwork
bibtex kernel
bibtex food
latex researchwork
latex researchwork
2. \cite{*} is used to add all the entries in the bib file to the main
bibliography database. As before, \DTLloadbbl and
\DTLbibliography are used to load and display the main
bibliography.
147
Don’t try to directly input the .bbl file using \input (or \include)
instead of using \DTLloadbbl or \DTLloadmbbl as these commands
store the name of the required database and initialise the database before loading the .bbl file. Similarly, don’t just copy the contents of the
.bbl file into your document without first defining the database using
\DTLnewdb and setting \DTLBIBdbname to the name of the database.
148
10 Referencing People (person package)
Sometimes when mail-merging, it may be necessary to reference a person
by their pronoun which can lead to the cumbersome and impersonal
“he/she” construct. The person package allows you to define a person by
their full name, familiar name and gender. You can then use the
commands described in section 10.2 to produce the appropriate pronoun.
This can also be useful for other types of documents, such as an order of
service for a baptism or funeral. Since the document is much the same
from one person to the next, documents of this nature are frequently
simply copied and a search and replace edit is used to change the relevant
text. However this can lead to errors (especially if the previous person’s
name was Mary!) With the person package, you need only change the
definition of the person by modifying the arguments of \newperson.
10.1 Defining and Undefining People
A person is defined (globally) using the command:
\newperson
\newperson[hlabeli]{hfull namei}{hfamiliar namei}{hgenderi}
The optional argument is a unique label identifying this person, in the
event that there is more than one person. If hlabeli is omitted anon is
used. (This is also the case for subsequent commands that take an
optional label.) The gender may be any of those given by
\malelabels
\malelabels
or
\femalelabels
\femalelabels
The default definition of \malelabels is male,Male,MALE,M,m and
the default definition of \femalelabels is
female,Female,FEMALE,F,f. You can add extra identifiers using
149
\addmalelabel
\addmalelabel{hidentifieri}
or
\addfemalelabel
\addfemalelabel{hidentifieri}
For example:
\addmalelabel{boy}
\addfemalelabel{girl}
The total number of defined people is given by:
\thepeople
\thepeople
A person can be undefined using:
\removeperson
\removeperson[hlabeli]
where the person is given by hlabeli.
If more than one person has been defined, they can all be removed using:
\removeallpeople
\removeallpeople
or you can remove a subset using:
\removepeople
\removepeople{hlisti}
where hlisti is a comma-separated list of labels.
10.2 Displaying Information
Once a person has been defined, you can display their name using:
\personfullname
\personfullname[hlabeli]
where hlabeli is the unique label used in the optional argument to
\newperson. The person’s familiar name is displayed using:
150
\personname
\personname[hlabeli]
The person’s pronoun (“he” or “she”) is displayed using:
\personpronoun
\personpronoun[hlabeli]
The objective pronoun (“him” or “her”) is displayed using:
\personobjpronoun
\personobjpronoun[hlabeli]
The possessive adjective (“his” or “her”) is displayed using:
\personpossadj
\personpossadj[hlabeli]
The possessive pronoun “his” or “hers” is displayed using:
\personposspronoun
\personposspronoun[hlabeli]
The person’s relationship to their parent (“son” or “daughter”) is
displayed using:
\personchild
\personchild[hlabeli]
The person’s relationship to their child (“mother” or “father”) is
displayed using:
\personparent
\personparent[hlabeli]
The person’s relationship to their sibling (“brother” or “sister”) is
displayed using:
\personsibling
\personsibling[hlabeli]
If the word occurs at the start of a sentence, you will need one of the
following commands, which are as the above, except the first letter is
converted to upper case:
151
\Personpronoun
\Personpronoun[hlabeli]
\Personobjpronoun
\Personobjpronoun[hlabeli]
\Personpossadj
\Personpossadj[hlabeli]
\Personposspronoun
\Personposspronoun[hlabeli]
\Personchild
\Personchild[hlabeli]
\Personparent
\Personparent[hlabeli]
\Personsibling
\Personsibling[hlabeli]
Example 40 (Order of Service (Memorial))
This example is for a memorial order of service.
\documentclass{article}
\usepackage{person}
\newperson{Jane Doe}{Jane}{female}
\begin{document}
\begin{center}
\Large
In Memory of \personfullname
\end{center}
We are gathered here to remember our \personsibling\ \personname.
\Personpronoun\ will be much missed, and \personpossadj\
family are in our prayers.
\end{document}
152
In Memory of Jane Doe
We are gathered here to remember our sister Jane. She will be much
missed, and her family are in our prayers.
If there is more than one person, you will need to use the optional
argument hlabeli to \newperson to uniquely identify each person. You
can then list all of the people’s full or familiar names using:
\peoplefullname
\peoplefullname
\peoplename
\peoplename
Note that if there is only one person defined, these commands behave the
same as \personfullname[hlabeli] and \personname[hlabeli].
Similarly for the pronouns:
\peoplepronoun
\peoplepronoun
\Peoplepronoun
\Peoplepronoun
\peopleobjpronoun
\peopleobjpronoun
\Peopleobjpronoun
\Peopleobjpronoun
\peoplepossadj
\peoplepossadj
\Peoplepossadj
\Peoplepossadj
\peopleposspronoun
153
\peopleposspronoun
\Peopleposspronoun
\Peopleposspronoun
where, again, if only one person has been defined, each of these
commands is equivalent to \person. . . [hlabeli] or \Person. . . [hlabeli].
If more than one person has been defined, these commands will display
they/them/their/theirs or They/Them/Their/Theirs, as appropriate.
Likewise for relationship commands:
\peoplechild
\peoplechild
\Peoplechild
\Peoplechild
\peopleparent
\peopleparent
\Peopleparent
\Peopleparent
\peoplesibling
\peoplesibling
\Peoplesibling
\Peoplesibling
Example 41 (Order of Service (Baptism))
In this example two people are defined.
\documentclass{article}
\usepackage{person}
\newperson[john]{John Joseph}{John}{male}
\newperson[jane]{Jane Mary}{Jane}{female}
\begin{document}
154
\begin{center}
\Large
Baptism of \peoplefullname.
\end{center}
Today we welcome \peoplename\ into God’s family, may He guide
and protect \peopleobjpronoun.
\end{document}
This is produces the following text:
Baptism of John Joseph and Jane Mary.
Today we welcome John and Jane into God’s family, may He guide and
protect them.
Example 42 (Mail Merging Using Appropriate Gender)
In this example I have a CSV file called students.csv containing the
following:
FirstName,Surname,Gender,Parent,Address
John,"Smith, Jr",M,Mr and Mrs Smith,1 The Street\\Newtown
Jane,Brown,F,Ms Brown,2 The Avenue\\Oldtown
Andy,Brown,male,Mr Brown and Miss Sepia,3 The Road\\Newtown
Z\"oe,Adams,f,Mr and Mrs Adams,5 The Street\\Newtown
Roger,Brady,m,Mrs Brady,6 The Avenue\\Oldtowm
Clare,Vernon,female,Mr Vernon,7 The Close\\Anytown
Suppose I have to write to each student’s parents regarding their child. I
can load the information using \DTLloaddb (described in section 5.2). I
can then iterate through the database and define the student as a person
and use the commands defined in the person package to display the
correct gender related text. I could give each person a unique label based
on the row count (\DTLcurrentindex), but since I don’t need to reuse
the information, I can use the default anon label and undefine the person
when no longer required.
Note that in the CSV file, the gender label isn’t consistent. For some
students the gender is identified by a single letter (“m” or “f”) and for
others the gender is identified by a complete word (“male” or “female”).
There’s also no regard for case. This doesn’t matter to \newperson as all
the identifiers used are listed in \malelabels and \femalelabels.
The following is an example letter sent to all parents:
\documentclass{letter}
155
\usepackage{person}
load student information from file "students.csv"
\DTLloaddb{students}{students.csv}
\begin{document}
Iterate through the student database:
\DTLforeach{students}{\FirstName=FirstName,\Surname=Surname,%
\Gender=Gender,\Parent=Parent,\Address=Address}{%
Define "anon":
\newperson{\FirstName\space\Surname}{\FirstName}{\Gender}%
Do the letter:
\begin{letter}{\Parent\\\Address}
\opening{Dear \Parent}
Your \personchild\ \personname\ has been awarded a
place. We look forward to seeing \personobjpronoun\
on \personpossadj\ arrival.
\closing{Yours Sincerely}
\end{letter}
Undefine "anon":
\removeperson
}
\end{document}
The body of the first letter appears as follows:
Your son John has been awarded a place. We look forward to seeing him
on his arrival.
Whereas the body of the second letter appears as follows:
Your daughter Jane has been awarded a place. We look forward to seeing
her on her arrival.
10.3 Advanced Commands
This section describes additional commands provided by the person
package. More detail can be found in the documented code
(datatool.pdf).
10.3.1 Conditionals
\ifpersonexists
\ifpersonexists{hlabeli}{htrue parti}{hfalse parti}
156
Tests if the person identified by hlabeli has been defined. If true, do htrue
parti otherwise do hfalse parti.
\ifmale
\ifmale{hlabeli}{htrue parti}{hfalse parti}
Test if the person identified by hlabeli is male. If true, do htrue parti
otherwise do hfalse parti.
\iffemale
\iffemale{hlabeli}{htrue parti}{hfalse parti}
Test if the person identified by hlabeli is female. If true, do htrue parti
otherwise do hfalse parti.
\ifallmale
\ifallmale[hlabel listi]{htrue parti}{hfalse parti}
Tests if all the people listed in hlabel listi are male. If true, do htrue parti
otherwise do hfalse parti. If hlabel listi is omitted, applied to all defined
people.
\ifallfemale
\ifallfemale[hlabel listi]{htrue parti}{hfalse parti}
Likewise to test if all the people tested are female.
To determine if a string is an allowed male label:
\ifmalelabel
\ifmalelabel{hidentifieri}{htrue parti}{hfalse parti}
where hidentifieri is the string to be tested. If true, do htrue parti otherwise
do hfalse parti. For example:
\def\gender{M}
\ifmalelabel{\gender}{male}{not male}
Similarly to for an allowed female label:
\iffemalelabel
\iffemalelabel{hidentifieri}{htrue parti}{hfalse parti}
For example:
\ifmalelabel{\gender}{Male}{%
157
\iffemalelabel{\gender}{Female}%
{Undefined Gender}%
}
10.3.2 Iterating Through Defined People
You can iterate through all defined people using:
\foreachperson
\foreachperson(hname csi,hfull name csi,hgender csi,hlabel
csi)\do{hbodyi}
\malename
\femalename
At each iteration, hname csi, hfull name csi, hgender csi and hlabel csi are set
to the current person’s name, full name, gender and label, respectively.
(These arguments must all be command names.) Note that the gender is
set to the definition of \malename or \femalename, as appropriate.1
Once these commands are set, hbodyi is applied.
If you only want to iterate through a subset of defined people, you can
use:
\foreachperson(hname csi,hfull name csi,hgender csi,hlabel
csi)\in{hlisti}\do{hbodyi}
where hlisti is a comma-separated list of labels.
10.3.3 Accessing Individual Information
\getpersongender
\getpersongender{hcsi}{hlabeli}
Gets the gender of the person identified by hlabeli and stores in hcsi
(which must be a command name). This sets hcsi to the definition of
\malename or \femalename as appropriate.
\getpersonname
\getpersonname{hcsi}{hlabeli}
Gets the name of the person identified by hlabeli and stores in hcsi (which
must be a command name).
1 Predefined names provided by the person package are described in the documented code
(datatool.pdf).
158
\getpersonfullname
\getpersonfullname{hcsi}{hlabeli}
Gets the full name of the person identified by hlabeli and stores in hcsi
(which must be a command name).
159
Bibliography
[1] Michel Goossens, Frank Mittelbach, and Alexander Samarin. The
LATEX Companion. Addison-Wesley, 1994.
160
Acknowledgements
Many thanks to Morten Høgholm for suggesting a much more efficient
way of storing the information in databases which has significantly
improved the time it takes to LATEX documents containing large databases.
161
Index
A
\addfemalelabel . . . . . . . . . 150
\addmalelabel . . . . . . . . . . . 150
B
booktabs package . . . . . . . . . . . . . 47
\bottomrule . . . . . . . . . . . . . . 47
C
colortbl package . . . . . . . . . . . . . . 55
counters:
DTLbarroundvar . .
DTLbibrow . . . . . . .
DTLmaxauthors . . .
DTLmaxeditors . . .
DTLpieroundvar . .
DTLplotroundXvar
DTLplotroundYvar
DTLrowi . . . . . . . . .
DTLrowii . . . . . . . .
DTLrowiii . . . . . . .
.
.
.
.
.
.
.
.
.
.
.
.
.
.
.
.
.
.
.
.
.
.
.
.
.
.
.
.
.
.
.
.
.
.
.
.
.
.
.
.
.
.
.
.
.
.
.
.
.
.
.
.
.
.
.
.
.
.
.
.
.
.
.
.
118
144
140
140
93
109
109
50
50
50
D
databar package . . . . . . . . . i, 2, 3, 115
databib package . . . . . . . . . . . . i,
2, 3, 129, 133, 134, 136–139, 143
datapie package . . . . . . . i, 2, 3, 86, 94
dataplot package . . . . . . . . . i, 2, 3, 99
datatool package . i, 2, 3, 24, 25, 27,
32, 35, 37, 42, 51, 64, 68, 85,
86, 99, 107, 115, 129, 133, 137, 146
datatool-base package . i, 2, 4, 5, 22, 23
datatool-fp package . . . . . . . . . . i, 2, 3
datatool-pgfmath package . . . . . . i, 2, 3
\DBIBcitekey . . . . . . . . . . . . 143
\DBIBentrytype . . . . . . . . . . 143
\DTLabs . . . . . . . . . . . . . . . . . . 26
\DTLadd . . . . . . . . . . . . . . . . 23, 69
\DTLaddall . . . . . . . . . . . . . . . 24
\DTLaddentryforrow . . . . . . . 37
\DTLaddtoplotlegend . . . . . 107
\dtlaftercols . . . . . . . . . . . . 45
\DTLafterinitialbeforehyphen
. . . . . . . . . . . . . . . . . . . . . 34
\DTLafterinitials . . . . . . . . 34
\dtlafterrow . . . . . . . . . . . . . 84
\DTLandlast . . . . . . . . . . . . . 140
\DTLandnotlast . . . . . . . . . . 140
\dtlappendentrytocurrentrow
. . . . . . . . . . . . . . . . . . . . . 85
\DTLappendtorow . . . . . . . . . . 66
\DTLassign . . . . . . . . . . . . . . . 82
\DTLbaratbegintikz . . . . . . 119
\DTLbaratendtikz . . . . . . . . 119
\DTLbarchart . . . . . . . . . . . . 115
\DTLbarchart options
axes . . . . . . . . . . . . . . . . . . . 116
barlabel . . . . . . . . . . . . . . . . 116
length . . . . . . . . . . . . . . . . . . 116
max . . . . . . . . . . . . . . . . 116, 124
maxdepth . . . . . . . . . . . . 116, 124
upperbarlabel . . . . . . . . . . . . . 116
variable . . . . . . . . . . . . . . . . 116
verticalbars . . . . . . . . . . . 117, 120
ylabel . . . . . . . . . . . . . . . . . . 117
yticgap . . . . . . . . . . . . . . . . . 117
yticlabels . . . . . . . . . . . . . . . . 117
yticpoints . . . . . . . . . . . . . . . 117
\DTLbarchartlength . . . . . . 117
\DTLbarchartwidth . . . . 124, 127
\DTLbardisplayYticklabel 120
\DTLbargroupwidth . . . . . . . 127
\DTLbarlabeloffset . . . . . . 118
\DTLbarmax . . . . . . . . . . . . . . 124
\DTLbaroutlinecolor . . . . . 119
\DTLbaroutlinewidth . . . . . 119
DTLbarroundvar (counter) . . . 118
\DTLbarwidth . . . . . . . . . . . . 118
\DTLbarXlabelalign . . . . . . 120
\DTLbarYticklabelalign . . 120
\dtlbeforecols . . . . . . . . . . . 45
162
\dtlbeforerow . . . . . . . . . . . . 84
\dtlbetweencols . . . . . . . . . . 45
\DTLbetweeninitials . . . . . . 34
\DTLBIBdbname . . . . . . . . . . . 148
\DTLbibfield . . . . . . . . . . . . 143
\DTLbibfieldcontains . . . . 134
\DTLbibfieldexists . . . . . . 134
\DTLbibfieldiseq . . . . . . . . 134
\DTLbibfieldisge . . . . . . . . 135
\DTLbibfieldisgt . . . . . . . . 135
\DTLbibfieldisle . . . . . . . . 135
\DTLbibfieldislt . . . . . . . . 135
\DTLbibliography . . . . . . . . 134
\DTLbibliographystyle . . . 138
DTLbibrow (counter) . . . . . . . . 144
DTLbibrow counter . . . . . . . . . . . 136
\dtlbreak . . . . . . . . . . . . . . . . 51
\DTLcite . . . . . . . . . . . . . . . . 145
\DTLcleardb . . . . . . . . . . . . . . 79
\DTLclip . . . . . . . . . . . . . . . . . 31
\DTLcolumncount . . . . . . . . . . 36
\dtlcolumnindex . . . . . . . . . . 81
\DTLcomputebounds . . . . . . . . 72
\DTLcomputewidestbibentry 144
\DTLconverttodecimal 22, 68, 112
\dtlcurrencyalign . . . . . . . . 45
\dtlcurrencyformat . . . . . . . 46
\DTLcurrencytype . . . . . . . . . 79
\DTLcurrentindex . . . . . . 50, 155
\dtlcurrentrow . . . . . . . . . . . 83
\dtldbname . . . . . . . . . . . . . . . 84
\DTLdecimaltocurrency . . 23, 68
\DTLdecimaltolocale . . . . 22, 68
\dtldefaultkey . . . . . . . . . . . 39
\DTLdeletedb . . . . . . . . . . . . . 79
\dtldisplayafterhead . . . . . 46
\DTLdisplaydb . . . . . . . . . . . . 42
\dtldisplayendtab . . . . . . . . 46
\DTLdisplayinnerlabel . . . . 93
\DTLdisplaylongdb . . . . . . . . 42
\DTLdisplaylowerbarlabel 120
\DTLdisplaylowermultibarlabel
. . . . . . . . . . . . . . . . . . . . 120
\DTLdisplayouterlabel . . . . 93
\dtldisplaystartrow . . . . . . 47
\dtldisplaystarttab . . . . . . 46
\DTLdisplayupperbarlabel 121
\DTLdisplayuppermultibarlabel
. . . . . . . . . . . . . . . . . . . . 121
\DTLdiv . . . . . . . . . . . . . . . . . . 26
\DTLdobarcolor . . . . . . . . . . 119
\DTLdocurrentpiesegmentcolor
. . . . . . . . . . . . . . . . . . . . . 95
\DTLdopiesegmentcolor . . . . 95
\DTLendbibitem . . . . . . . . . . 140
\DTLendpt . . . . . . . . . . . . . . . 119
DTLenvforeach (environment) .
. . . . . . . . . . . . . . . . . . . 49, 49
DTLenvforeach* (environment)
. . . . . . . . . . . . . . . . . . . 49, 49
\DTLeverybarhook . . . . . . . . 119
\dtlexpandnewvalue . . . . . . . 37
\dtlforcolumn . . . . . . . . . . . . 80
\dtlforcolumnindex . . . . . . . 80
\DTLforeach . 48, 50–53, 60, 66,
69–72, 82, 86, 95, 96, 99, 112, 116
\DTLforeach* . . . . . . . . . . . . . 48
\DTLforeachbib . . . . . . . . . . 143
\DTLforeachbib* . . . . . . . . . 143
\dtlforeachkey . . . . . . . . . . . 79
\DTLforeachkeyinrow . . . . . . 51
\DTLformatabbrvforenames 139
\DTLformatauthor . . . . . . . . 138
\DTLformatbibentry . . . . . . 144
\DTLformateditor . . . . . . . . 138
\DTLformatforenames . . . . . 139
\DTLformatjr . . . . . . . . . . . . 139
\DTLformatlegend . . . . . . . . 111
\DTLformatsurname . . . . . . . 139
\DTLformatvon . . . . . . . . . . . 139
\DTLgabs . . . . . . . . . . . . . . . . . 26
\DTLgadd . . . . . . . . . . . . . . . 24, 69
\DTLgaddall . . . . . . . . . . . . . . 24
\DTLgclip . . . . . . . . . . . . . . . . 31
\DTLgdiv . . . . . . . . . . . . . . . . . 26
\DTLgetcolumnindex . . . . . . . 80
\DTLgetdatatype . . . . . . . . . . 79
\dtlgetentryfromcurrentrow
. . . . . . . . . . . . . . . . . . . . . 85
\DTLgetkeydata . . . . . . . . . . . 81
\DTLgetkeyforcolumn . . . . . . 80
\DTLgetlocation . . . . . . . . . . 81
\dtlgetrow . . . . . . . . . . . . . . . 83
\DTLgetvalue . . . . . . . . . . . . . 81
\DTLgetvalueforkey . . . . . . . 81
\DTLgmax . . . . . . . . . . . . . . . . . 28
\DTLgmaxall . . . . . . . . . . . . . . 28
\DTLgmeanall . . . . . . . . . . . . . 29
163
\DTLgmin . . . . . . . . . . . . . . .
\DTLgminall . . . . . . . . . . . .
\DTLgmul . . . . . . . . . . . . . . .
\DTLgneg . . . . . . . . . . . . . . .
\DTLground . . . . . . . . . . . . .
\DTLgsdforall . . . . . . . . . .
\DTLgsqrt . . . . . . . . . . . . . .
\DTLgsub . . . . . . . . . . . . . . .
\DTLgtrunc . . . . . . . . . . . . .
\DTLgvarianceforall . . . .
\dtlheaderformat . . . . . . .
\DTLifAllLowerCase . . . . .
\DTLifAllUpperCase . . . . .
\DTLifbibanyfieldexists
\DTLifbibfieldexists . . .
\DTLifcasedatatype . . . . .
\DTLifclosedbetween . . . .
\DTLifclosedbetween* . . .
\DTLifcurrency . . . . . . . . .
\DTLifcurrencyunit . . . . .
\DTLifdbempty . . . . . . . . . .
\DTLifdbexists . . . . . . . . .
\DTLifeq . . . . . . . . . . . . . . .
\DTLifeq* . . . . . . . . . . . . . .
\DTLiffirstrow . . . . . . . . .
\DTLifFPclosedbetween . .
\DTLifFPopenbetween . . . .
\DTLifgt . . . . . . . . . . . . . . .
\DTLifgt* . . . . . . . . . . . . . .
\DTLifhaskey . . . . . . . . . . .
\DTLifinlist . . . . . . . . . . .
\DTLifint . . . . . . . . . . . . . .
\DTLiflt . . . . . . . . . . . . . . .
\DTLiflt* . . . . . . . . . . . . . .
\DTLifnull . . . . . . . . . . . . .
\DTLifnumclosedbetween .
\DTLifnumeq . . . . . . . . . . . .
\dtlifnumeq . . . . . . . . . . . .
\DTLifnumerical . . . . . . . .
\DTLifnumgt . . . . . . . . . . . .
\DTLifnumlt . . . . . . . . . . . .
\dtlifnumlt . . . . . . . . . . . .
\DTLifnumopenbetween . . .
\DTLifoddrow . . . . . . . . . . .
\DTLifopenbetween . . . . . .
\DTLifopenbetween* . . . . .
\DTLifreal . . . . . . . . . . . . .
\DTLifStartsWith . . . . . . .
\DTLifstring . . . . . . . . . . .
. . 27
. . 28
. . 25
. . 26
. . 30
. . 30
. . 27
. . 25
. . 30
. . 29
. . 45
. . 15
. . 14
. 144
. 143
... 8
. . 13
. . 13
... 6
... 7
. . 35
. . 80
... 9
... 9
. . 51
. . 14
. . 14
. . 12
. . 12
. . 80
. . 82
... 5
. . 11
. . 11
. . 63
. . 12
... 8
... 8
... 7
. . 11
. . 10
. . 10
. . 13
51, 56
. . 14
. . 14
... 5
. . 16
... 8
\DTLifstringclosedbetween 12
\DTLifstringclosedbetween*
. . . . . . . . . . . . . . . . . . . . . 12
\DTLifstringeq . . . . . . . . . . . . 9
\DTLifstringeq* . . . . . . . . . . . 9
\DTLifstringgt . . . . . . . . . . . 11
\DTLifstringgt* . . . . . . . . . . 11
\DTLifstringlt . . . . . . . . . . . 10
\DTLifstringlt* . . . . . . . . . . 10
\DTLifstringopenbetween . . 13
\DTLifstringopenbetween* . 13
\DTLifSubString . . . . . . . . . . 15
\DTLinitialhyphen . . . . . . . . 34
\DTLinitials . . . . . . . . . . . . . 33
\dtlintalign . . . . . . . . . . . . . 45
\dtlintformat . . . . . . . . . . . . 46
\DTLinttype . . . . . . . . . . . . . . 79
\DTLisclosedbetween . . . . . . 19
\DTLiscurrency . . . . . . . . . . . 17
\DTLiscurrencyunit . . . . . . . 17
\DTLiseq . . . . . . . . . . . . . . . . . 19
\DTLisFPclosedbetween . . . . 21
\DTLisFPeq . . . . . . . . . . . . . . . 21
\DTLisFPgt . . . . . . . . . . . . . . . 20
\DTLisFPgteq . . . . . . . . . . . . . 20
\DTLisFPlt . . . . . . . . . . . . . . . 20
\DTLisFPlteq . . . . . . . . . . . . . 20
\DTLisFPopenbetween . . . . . . 21
\DTLisgt . . . . . . . . . . . . . . . 18, 53
\DTLisiclosedbetween . . . . . 19
\DTLisieq . . . . . . . . . . . . . . . . 19
\DTLisigt . . . . . . . . . . . . . . . . 19
\DTLisilt . . . . . . . . . . . . . . . . 18
\DTLisint . . . . . . . . . . . . . . . . 18
\DTLisiopenbetween . . . . . . . 20
\DTLislt . . . . . . . . . . . . . . . . . 18
\DTLisnumerical . . . . . . . . . . 17
\DTLisopenbetween . . . . . . . . 20
\DTLisPrefix . . . . . . . . . . . . . 21
\DTLisreal . . . . . . . . . . . . . . . 18
\DTLisstring . . . . . . . . . . . . . 16
\DTLisSubString . . . . . . . . . . 21
\DTLlegendxoffset . . . . . . . 109
\DTLlegendyoffset . . . . . . . 109
\DTLloadbbl . . . . . . . . . . . . . 133
\DTLloaddb . . . . . . . . . 38, 40, 155
\DTLloaddb options
headers . . . . . . . . . . . . . . . 39, 59
keys . . . . . . . . . . . . . . . . . . . . 38
164
noheader . . . . . . . . . . . . . . . . 38
noheaders . . . . . . . . . . . . . . . . 43
omitlines . . . . . . . . . . . . . . . . . 39
\DTLloadmbbl . . . . . . . . . . . . 146
\DTLloadrawdb . . . . . . . . . . . . 40
\DTLmajorgridstyle . . . . . . 111
\DTLmax . . . . . . . . . . . . . . . . . . 28
\DTLmaxall . . . . . . . . . . . . . . . 28
DTLmaxauthors (counter) . . . . 140
DTLmaxeditors (counter) . . . . 140
\DTLmaxforcolumn . . . . . . . . . 72
\DTLmaxforkeys . . . . . . . . 72, 114
\DTLmbibliography . . . . . . . 146
\DTLmeanforall . . . . . . . . . . . 29
\DTLmeanforcolumn . . . . . . . . 70
\DTLmeanforkeys . . . . . . . . 70, 72
\DTLmidpt . . . . . . . . . . . . . . . 119
\DTLmin . . . . . . . . . . . . . . . . . . 27
\DTLminall . . . . . . . . . . . . . . . 28
\DTLminforcolumn . . . . . . . . . 72
\DTLminforkeys . . . . . . . . 71, 114
\DTLminorgridstyle . . . . . . 111
\DTLminorticklength . . . . . 109
\DTLmintickgap . . . . . . . 101, 109
\DTLmul . . . . . . . . . . . . . . . . . . 25
\DTLmultibarchart . . . . . . . 115
\DTLmultibarchart options
axes . . . . . . . . . . . . . . . . . . . 116
barlabel . . . . . . . . . . . . . . . . 116
groupgap . . . . . . . . . . . . 117, 124
length . . . . . . . . . . . . . . . . . . 116
max . . . . . . . . . . . . . . . . 116, 124
maxdepth . . . . . . . . . . . . 116, 124
multibarlabels . . . . . . . . . . . . . 116
uppermultibarlabels . . . . . . . . . 117
variables . . . . . . . . . . . . . 116, 124
verticalbars . . . . . . . . . . . . . . 117
ylabel . . . . . . . . . . . . . . . . . . 117
yticgap . . . . . . . . . . . . . . . . . 117
yticlabels . . . . . . . . . . . . . . . . 117
yticpoints . . . . . . . . . . . . . . . 117
\DTLmultibibs . . . . . . . . . . . 145
\DTLneg . . . . . . . . . . . . . . . . . . 26
\DTLnegextent . . . . . . . . . . . 124
\DTLnewcurrencysymbol . . . 4, 7
\DTLnewdb . . . . . . . . . . 35, 78, 148
\DTLnewdbentry . . . . . . 36, 38, 78
\DTLnewrow . . . . . . . . . . . . . 36, 78
\DTLnocite . . . . . . . . . . . . . . 146
\dtlnoexpandnewvalue . . . . . 37
\DTLnumbernull . . . . . . . . . . . 63
\DTLnumitemsinlist . . . . . . . 82
\DTLpar . . . . . . . . . . . . . . . . 37, 42
\DTLpieatbegintikz . . . . . . . 97
\DTLpieatendtikz . . . . . . . . . 97
\DTLpiechart . . . . . . . . . . . 86, 97
\DTLpiechart options
cutaway . . . . . . . . . . . . . . . 87, 90
cutawayoffset . . . . . . . . . . . . . . 87
cutawayratio . . . . . . . . . . . . . . 87
innerlabel . . . . . . . . . . . . . . 87, 93
inneroffset . . . . . . . . . . . . . . . . 87
innerratio . . . . . . . . . . . . . . . . 87
outerlabel . . . . . . . . . . . . . . 88, 96
outeroffset . . . . . . . . . . . . . . 87, 88
outerratio . . . . . . . . . . . . . . . . 87
radius . . . . . . . . . . . . . . . . . . . 87
ratio . . . . . . . . . . . . . . . . . . . . 87
rotateinner . . . . . . . . . . . . . . . . 88
rotateouter . . . . . . . . . . . . . . . 88
start . . . . . . . . . . . . . . . . . . . . 86
variable . . . . . . . . . . . . 86, 87, 93
\DTLpieoutlinecolor . . . . . . 95
\DTLpieoutlinewidth . . . . . . 96
\DTLpiepercent . . . . . . . . . . . 93
DTLpieroundvar (counter) . . . . 93
\DTLpievariable . . . . . . . . . . 93
\DTLplot . . . . 99, 108–110, 113, 114
\DTLplot options
axes . . . . . . . . . . . . . . . . . . . 100
bounds . . . . . . . . . . . . . . . 99, 101
box . . . . . . . . . . . . . . . . . . . 100
colors . . . . . . . . . . . . . . . . . . . 99
grid . . . . . . . . . . . . . . . . . . . 102
height . . . . . . . . . . . . . . . . . . 100
legend . . . . . . . . . . . . . . 102, 105
legendlabels . . . . . . . . . . . . . 102
linecolors . . . . . . . . . . . . . . . . 99
lines . . . . . . . . . . . . . . . . . . . 100
markcolors . . . . . . . . . . . . . . . 99
marks . . . . . . . . . . . . . . . . . . . 99
maxx . . . . . . . . . . . . . . . . . . 101
maxy . . . . . . . . . . . . . . . . . . 101
minx . . . . . . . . . . . . . . . . . . 101
miny . . . . . . . . . . . . . . . . . . . 101
style . . . . . . . . . . . . . . . . 100, 103
ticdir . . . . . . . . . . . . . . . . . . 101
width . . . . . . . . . . . . . . . . . . 100
165
x ......
xlabel . . .
xminortics
xticdir . . .
xticgap . .
xticlabels .
xticpoints
xtics . . . .
y ......
ylabel . . .
yminortics
yticdir . . .
yticgap . .
yticlabels .
yticpoints
ytics . . . .
. . . . . . . . . . . . . . . . 99
. . . . . . . . . . . . . . . 102
. . . . . . . . . . . . . . . 101
. . . . . . . . . . . . . . . 101
. . . . . . . . . . . . . . . 101
. . . . . . . . . . . . . . . 102
. . . . . . . . . . . . 101, 105
. . . . . . . . . . . . . . . 100
. . . . . . . . . . . . . . . . 99
. . . . . . . . . . . . . . . 102
. . . . . . . . . . . . . . . 101
. . . . . . . . . . . . . . . 101
. . . . . . . . . . . . 101, 102
. . . . . . . . . . . . . . . 102
. . . . . . . . . . . . . . . 101
. . . . . . . . . . . . . . . 100
\DTLplotatbegintikz 107, 113, 114
\DTLplotatendtikz . . . . 107, 113
\DTLplotheight . . . . . . . . . . 108
\DTLplotlinecolors . . . . . . 110
\DTLplotlines . . . . . . . . . . . 110
\DTLplotmarkcolors . . . . . . 110
\DTLplotmarks . . . . . . . . . . . 110
DTLplotroundXvar (counter) . 109
DTLplotroundXvar counter . . . 102, 114
DTLplotroundYvar (counter) . 109
DTLplotroundYvar counter . . . . . . 102
\DTLplotstream . . . . . . . 111, 113
\DTLplotwidth . . . . . . . . . . . 108
\DTLrawmap . . . . . . . . . . . . . . . 41
\dtlrealalign . . . . . . . . . . . . 45
\dtlrealformat . . . . . . . . . . . 46
\DTLrealtype . . . . . . . . . . . . . 79
\dtlrecombine . . . . . . . . . . . . 84
\dtlrecombineomitcurrent . 84
\DTLremovecurrentrow . . . . . 66
\DTLremoveentryfromrow . . . 66
\dtlremoveentryincurrentrow
. . . . . . . . . . . . . . . . . . . . . 85
\DTLremoverow . . . . . . . . . . . . 66
\DTLreplaceentryforrow . . . 66
\dtlreplaceentryincurrentrow
. . . . . . . . . . . . . . . . . . . . . 85
\DTLround . . . . . . . . . . . . . . 30, 69
\DTLrowcount . . . . . . . . . . . . . 36
DTLrowi (counter) . . . . . . . . . . . 50
DTLrowi counter . . . . . . . . . . . . 54, 55
DTLrowii (counter) . . . . . . . . . . 50
DTLrowiii (counter) . . . . . . . . . 50
\dtlrownum . . . . . . . . . . . . . . . 84
\DTLsavedb . . . . . . . . . . . . . . . 78
\DTLsavelastrowcount . . . 51, 69
\DTLsavetexdb . . . . . . . . . . . . 78
\DTLsdforall . . . . . . . . . . . . . 29
\DTLsdforcolumn . . . . . . . . . . 71
\DTLsdforkeys . . . . . . . . . . . . 71
\DTLsetbarcolor . . . . . . . . . 118
\DTLsetdefaultcurrency . . . 23
\DTLsetdelimiter . . . . . . . 39, 78
\DTLsetheader . . . . . . . . . . . . 38
\DTLsetnumberchars . . . . . . . . 4
\DTLsetpiesegmentcolor . . . 95
\DTLsetseparator . . . . . . . 39, 78
\DTLsettabseparator . . . . 39, 78
\DTLsort . . . . . . . . . . . . . . . . . 73
\DTLsort* . . . . . . . . . . . . . . . . 73
\DTLsplitstring . . . . . . . . . . 32
\DTLsqrt . . . . . . . . . . . . . . . . . 27
\DTLstartpt . . . . . . . . . . . . . 119
\DTLstoreinitials . . . . . . . . 33
\dtlstringalign . . . . . . . . . . 44
\dtlstringformat . . . . . . . . . 46
\DTLstringnull . . . . . . . . . . . 63
\DTLstringtype . . . . . . . . . . . 79
\DTLsub . . . . . . . . . . . . . . . . . . 25
\DTLsubstitute . . . . . . . . . . . 32
\DTLsubstituteall . . . . . . . . 32
\DTLsumcolumn . . . . . . . . . . . . 70
\DTLsumforkeys . . . . . . . . . . . 69
\dtlswapentriesincurrentrow
. . . . . . . . . . . . . . . . . . . . . 85
\DTLswaprows . . . . . . . . . . . . . 82
\DTLticklabeloffset . . 109, 123
\DTLticklength . . . . . . . . . . 108
\DTLtrunc . . . . . . . . . . . . . . . . 30
\DTLtwoand . . . . . . . . . . . . . . 140
\DTLunsettype . . . . . . . . . . . . 79
\DTLvarianceforall . . . . . . . 29
\DTLvarianceforcolumn . . . . 71
\DTLvarianceforkeys . . . . . . 70
\DTLXAxisStyle . . . . . . . . . . 110
\DTLYAxisStyle . . . . . . . . . . 111
E
environments:
DTLenvforeach . . . . . . . . 49, 49
DTLenvforeach* . . . . . . . 49, 49
longtable . . . . . . . . . . . . 42, 43
166
table . . . . . . . . . . . .
tabular . . . . . . . . . .
45, 46, 48, 56–59,
thebibliography . .
tikzpicture . . . . . .
verbatim . . . . . . . . .
etoolbox package . . . . . . .
. . . . . . 43
package options:
. 42, 43,
64, 69, 80
color
databar . . .
. . . . . 144
datapie . . .
97, 99, 107
delimiter
....
. . . . . . 49
gray
. . . . . . 63
databar . . .
F
datapie . . .
\femalelabels . . . . . . . . 149, 155
horizontal
\femalename . . . . . . . . . . 158, 158
databar . . .
file types
math . . . . . .
aux . . . . . . . . . . . . . . . . . . . 129
fp . . . . . . .
bbl . . . . . . . . . 129, 130, 133, 137
pgfmath . . .
bib . . . . . . 129, 130, 133, 142, 143
norotateinner
bst . . . . . . . . . . . . . . . . . . . 129
datapie . . .
\foreachperson . . . . . . . . . . 158
norotateouter
fp package . . . . . . . i, ii, 2, 22, 23, 68
datapie . . .
G
\getpersonfullname
\getpersongender . .
\getpersonname . . . .
graphics package . . . . . .
graphicx package . . . . . .
.
.
.
.
.
.
.
.
.
.
.
.
.
.
.
I
\ifallfemale . . . . . .
\ifallmale . . . . . . . .
\ifdefempty . . . . . . .
\ifDTLverticalbars
\iffemale . . . . . . . . .
\iffemalelabel . . . .
\ifmale . . . . . . . . . . .
\ifmalelabel . . . . . .
\ifpersonexists . . .
ifthen package . . . . . . . .
.
.
.
.
.
.
.
.
.
.
.
.
.
.
.
.
.
.
.
. . . . 157
. . . . 157
. . . . . 63
. . . . 120
. . . . 157
. . . . 157
. . . . 157
. . . . 157
. . . . 156
16, 48, 136
.
.
.
.
.
.
.
.
.
.
.
.
.
.
.
159
158
158
123
123
rotateinner
datapie
rotateouter
datapie
separator
style
databib
verbose .
true . .
vertical
databar
P
. . . . . . . . . . . . 115
. . . . . . . . . . . . . 86
.............. 2
. . . . . . . . . . . . 115
. . . . . . . . . . . . . 86
.
.
.
.
.
.
.
.
.
.
.
.
.
.
.
.
.
.
.
.
.
.
.
.
.
.
.
.
.
.
.
.
.
.
.
.
115, 120
. . . 2, 3
. . . 2, 3
. . . 2, 3
. . . . . . . . . . . 86, 88
. . . . . . . . . . . 86, 88
. . . . . . . . . . . . . . 86, 88
. . . . . . . . . . . . . . 86, 88
................. 2
. . . . . . . . . . . . 137, 138
. . . . . . . . . . . . 2, 3, 129
. . . . . . . . . . . . . . . 2, 3
. . . . . . . . . . . . 115, 120
\Peoplechild . . . . . . . . . . . . 154
\peoplechild . . . . . . . . . . . . 154
\peoplefullname . . . . . . . . . 153
\peoplename . . . . . . . . . . . . . 153
\Peopleobjpronoun . . . . . . . 153
\peopleobjpronoun . . . . . . . 153
\Peopleparent . . . . . . . . . . . 154
\peopleparent . . . . . . . . . . . 154
\Peoplepossadj . . . . . . . . . . 153
L
longtable (environment) . . . 42, 43 \peoplepossadj . . . . . . . . . . 153
longtable package . . . . . . . . . . . 42, 43 \Peopleposspronoun . . . . . . 154
\peopleposspronoun . . . . . . 153
\Peoplepronoun . . . . . . . . . . 153
M
\malelabels . . . . . . . . . . 149, 155 \peoplepronoun . . . . . . . . . . 153
\malename . . . . . . . . . . . . 158, 158 \Peoplesibling . . . . . . . . . . 154
\midrule . . . . . . . . . . . . . . . . . 47 \peoplesibling . . . . . . . . . . 154
person package . . i, 149, 155, 156, 158
N
\Personchild . . . . . . . . . . . . 152
\newperson . . . . . . . . . . . 149, 155 \personchild . . . . . . . . . . . . 151
\not . . . . . . . . . . . . . . . . . . . . 136 \personfullname . . . . . . . . . 150
167
\personname . . . . . . . . . . . . . 151
\Personobjpronoun . . . . . . . 152
\personobjpronoun . . . . . . . 151
\Personparent . . . . . . . . . . . 152
\personparent . . . . . . . . . . . 151
\Personpossadj . . . . . . . . . . 152
\personpossadj . . . . . . . . . . 151
\Personposspronoun . . . . . . 152
\personposspronoun . . . . . . 151
\Personpronoun . . . . . . . . . . 152
\personpronoun . . . . . . . . . . 151
\Personsibling . . . . . . . . . . 152
\personsibling . . . . . . . . . . 151
pgf package . . . . . . . . . . . . . . . 3,
86, 99, 100, 110, 112, 115, 127
pgfmath package . . . . . . i, ii, 2, 22, 23
R
\removeallpeople . . . . . . . . 150
\removepeople . . . . . . . . . . . 150
\removeperson . . . . . . . . . . . 150
S
siunitx package . . . . . . . . . . . . . . 45
substr package . . . . . . . . . . . . . . . 32
T
table (environment) . . . . . . . . . 43
tabular (environment) . . 42, 43,
45, 46, 48, 56–59, 64, 69, 80
textcase package . . . . . . . . . . . . . 15
textcomp package . . . . . . . . . . . . . . 6
thebibliography (environment)
. . . . . . . . . . . . . . . . . . . . 144
\thepeople . . . . . . . . . . . . . . 150
tikz package . . . . . . . . . . . . . . 86, 97
tikzpicture (environment) . . .
. . . . . . . . . . . . . . . 97, 99, 107
\toprule . . . . . . . . . . . . . . . . . 47
V
verbatim (environment) . . . . . . 49
168