1
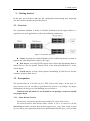
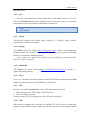
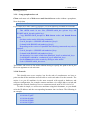
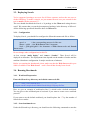
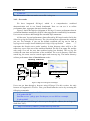
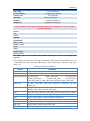
Search A benchmark for datacenter and Cloud computing USER’S MANUAL October 7th 2011 Revision Sheet Revision Sheet Release No. Rev. 1.0 Date 07/10/2011 Revision Description Search v1.0 first packaging i Memu USER’S MANUAL TABLE OF CONTENTS CONTENTS 1. Introduction ................................................................................. 1 1.1. Targeted Audience ........................................................................................... 1 1.2. Structure of the document ................................................................................ 1 1.3. Further Readings .............................................................................................. 1 2. Search ........................................................................................... 2 2.1. Quick introduction ........................................................................................... 2 2.2. Available implementations .............................................................................. 2 3. Getting started .............................................................................. 3 3.1. Overview .......................................................................................................... 3 3.2. Prerequisites ..................................................................................................... 3 3.2.1. Linux Kernel Version ................................................................................................ 3 3.2.2. perf ............................................................................................................................ 4 3.2.3. Python ....................................................................................................................... 4 3.2.4. Numpy....................................................................................................................... 4 3.2.5. Matplotlib .................................................................................................................. 4 3.2.6. JAVA ........................................................................................................................ 4 3.2.7. CPU ........................................................................................................................... 4 3.2.8. SSH ........................................................................................................................... 4 3.2.9. Setup passphraseless ssh ........................................................................................... 5 3.2.10. Network..................................................................................................................... 5 3.3. Deploying Search ............................................................................................. 6 3.3.1. 3.4. Configuration ............................................................................................................ 6 Running Benchmark ........................................................................................ 6 ii Memu 3.4.1. Workload Preparation ............................................................................................... 6 3.4.2. Start benchmark test .................................................................................................. 6 3.4.3. Get result ................................................................................................................... 7 4. Building your own Search......................................................... 10 4.1. CPU ................................................................................................................ 10 4.2. Make your search engine ............................................................................... 11 4.3. Creating your own workload ......................................................................... 11 Appendix A –Metrics collected by DCAngel .................................. 13 Appendix B – DCAngel database table structure........................... 15 Appendix C— The workload transforming function..................... 17 Appendix D— Request sequence and their definitions ................. 18 iii 1. Introduction 1. Introduction Search is a search engine model, which is used to evaluate datacenter and cloud computing systems. Search v1.0 brings some simplicity in terms of installation, deployment and monitoring. Within this version, we are offering Search with everything inside and ready to go. Search consists of a search engine, a workload generator, and a comprehensive workload characterization tool—DCAngel. 1.1. Targeted Audience This document is targeting two types of audiences: People who just want to use Search as a benchmark tool for evaluating their datacenter and cloud computing systems. This is for those who will directly use the provided Search benchmark directly to deploy it on their cluster. People who would like to modify the sources to fit their particular needs. You could use modified Search to do workloads characteristics analysis, add some functionality, or replace a component with another one. 1.2. Structure of the document This document goes on the following route: A detailed introduction will be given in Section 2, for people who have never used Search before. How to install Search version 1.0 is introduced in Section 3, for people who are not going to make any change to the provided Search. How to build an appliance on your own needs can be found in Section 4, for people who are going to modify some components of Search. 1.3. Further Readings The following links give more in-depth details about technologies used in Search v1.0. Nutch : Perf : Tomcat: http://nutch.apache.org https://perf.wiki.kernel.org/index.php/Main_Page http://tomcat.apache.org/ Sqlite3: http://www.sqlite.org/ 1 1. Introduction Numpy: http://numpy.scipy.org/ Matplotlib: http://matplotlib.sourceforge.net/ 2 2. Search 2. Search 2.1. Quick introduction Search is a search engine site benchmark that implements the core functionality of a search engine site: providing indices and snapshot for a query term. It does not implement complementary services like crawling and ranking. It only has one kind of session – user’s session, via which users can query terms. Search consists of three parts – a search engine, a workload generator and DCAngel. The search engine is based on nutch which is an open source web-search software project. For Search v1.0, we use nutch-1.1 as the search engine’s platform. The indices and snapshot we used in Search are generated by nutch-1.1 with SoGou Chinese corpus (http://www.sogou.com/labs/dl/t.html). We get a real world search engine’s trace from a user’s log of SoGou (http://www.sogou.com/labs/dl/q.html). The workload generator can transform the real trace by specifying the query rate variation and terms’ situation. The workload generator can also replay the real or synthetic traces. DCAngel is a comprehensive workload characterization tool. It can collect performance metrics and then write them into database for further analysis and visualization. We use perf to collect performance counters’ data. For further reading about Search, http://prof.ncic.ac.cn/DCBenchmarks . please look at the following site: 2.2. Available implementations You may find available information and descriptions about older Search versions at its home page (http://prof.ncic.ac.cn/DCBenchmarks). If newer version implemented, it will be appended. If you find some bugs, please contact us via [email protected]. If you successfully implement it on your own platform, please let us know. If you have some novel ideas, you might share with us. 2 3. Getting started 3. Getting started In this part, you will drive right into the configuration and running part, supposing you don’t want to modify the provided Search. 3.1. Overview Our experiment platform is based on Nutch’s distributed search engine which is a typical two-tier web application. It offers the following architecture: Figure 1 Architecture of Search Client: injecting the workload thanks to the workload generator (written in python) and collecting metric results by DCAngel. Web Server: receiving HTTP requests from clients and dispatching them to Search Servers. We use Apache Tomcat 6.0.26 as the front end and nutch-1.1 as the search engine. Search Server: serving client requests transmitting by Web Server and the return the results to Web Server 3.2. Prerequisites The provided Search v1.0 relies on perf, JDK, Python and Numpy. In this part, we focus on how you can use what is provided in the Search-v1.0 package, for deeper information you may go over the Building part in section 4. Tomcat 6.0.26 and nutch-1.1 are included in our package, so the user should not prepare them. 3.2.1. Linux Kernel Version For this step, you need to get the root privileges for your Linux servers. We need to build a linux kernel whose version is 2.6.31 or newer for all the Search Server nodes, because those kernels support perf_events port, which is used by perf. When you compare the kernel, you should make sure that perf_events is build 3 3. Getting started into your kernel. 3.2.2. perf For perf , users should get a linux kernel source code whose version is 2.6.31 or newer on all Search Server nodes and then enter the directory tools/perf. After that, users should execute the following commands to install perf: make make install 3.2.3. Python All the linux systems need Python whose version is 2.7. Older or newer versions haven’t been verified in our system. 3.2.4. Numpy The Client node needs Numpy (http://numpy.scipy.org/), which is the fundamental package needed for scientific computing with Python. You may need the following libraries or tools before installing Numpy: atlas, python-nose, lapack, blas, libgfortran, python-dateutil, python-matplotlib, python-tz, python-setuptools 3.2.5. Matplotlib The Client node needs matplotlib(http://matplotlib.sourceforge.net/), which is a python 2D plotting library. 3.2.6. JAVA Java 1.6.x, preferably from Sun, must be installed in all linux systems except Client node. You should also set JAVA_HOME to the ans42 user. 3.2.7. CPU For this version, the Search Server nodes’ CPU type must be as below: 1. Intel Xeon processor 3000, 3200, 5100, 5300 series 2. Intel Core 2 duo processor If you use other CPUs, you may go over the CPU part in section 4. 3.2.8. SSH SSH must be installed and sshd must be running. To run the Search scripts that manage remote daemons, please make sure that you can ssh on remote nodes without 4 3. Getting started entering password 3.2.9. Setup passphraseless ssh Client node must ssh to Web server and Search Server nodes without a passphrase, Now check that. $ ssh localhost If you cannot ssh to nodes without a passphrase, execute the following commands at Client node: $ ssh-keygen -t dsa -f $HOME/.ssh/id_dsa -P '' This should result in two files, $HOME/.ssh/id_dsa (private key) and $HOME/.ssh/id_dsa.pub (public key). Copy $HOME/.ssh/id_dsa.pub to Web Server nodes and Search Server nodes On those nodes run the following commands: $ cat id_dsa.pub >> $HOME/.ssh/authorized_keys2 $ chmod 0600 $HOME/.ssh/authorized_keys2 Depending on the version of OpenSSH the following commands may also be required: $ cat id_dsa.pub >> $HOME/.ssh/authorized_keys $ chmod 0600 $HOME/.ssh/authorized_keys An alternative is to create a link from authorized_keys2 to authorized_keys: $ cd $HOME/.ssh && ln -s authorized_keys2 authorized_keys On the Client node test the results by ssh'ing to other nodes: $ ssh -i $HOME/.ssh/id_dsa server This allows ssh access to the nodes without having to specify the path to the id_dsa file as an argument to ssh each time. 3.2.10. Network This should come as no surprise, but for the sake of completeness we have to point out that all the machines must be able to reach each other over the network. The easiest is to put all machines in the same network with regard to hardware and software configuration, for example connect machines via a single hub or switch and configure the network interfaces to use a common network such as 192.168.0.x/24. To make it simple, we will access machines using their hostname, so you should write the IP address and the corresponding hostname into /etc/hosts. The following is an example. #/etc/hosts 10.10.104.47 gd47 10.10.104.48 gd48 10.10.104.49 gd49 10.10.104.50 gd50 5 3. Getting started 3.3. Deploying Search You’re suggested creating a new user for all Linux systems, and use the new user to do the following. To make it simple, we just assume the new user you created for the tool is ans42 with the password ‘a’. The user should download the Search-v1.0 package to the Client node using the user ans42. We assume that you put the decompressed package in the directory of $Search. All the following operations should be done in Client node. 3.3.1. Configuration To deploy Search, you should first configure the $Search/common.mk file as follow. uname = ans42 # the user’s name for the benchmark upwd = a # the corresponding password of the user Master = gd88 # the Web Server node’s hostname Node = gd48,gd49,gd88 # the hostname of Web Server node and Search Server nodes Do not change other configurations in this file. At last, execute “make deploy” and “source ~/.bashrc”. Then Search will be deployed on all nodes. The deployment time depends on the number of nodes and the machine’s hardware configuration. It maybe needs tens of minutes. Before you running the benchmark, please make sure that the Web Server node's port 9090 is available or the Web Server node's firewall has already been closed. 3.4. Running Benchmark 3.4.1. Workload Preparation Enter the $Search/exp directory and edit the run-test.sh file. 11 #--------write your workload here--------------------------# 12 report search.example.head:100000-fixed:100@s?i2@reqs-SoGou Here, we give an example of workload at line 12, which is also a default workload. You can go over the workload part of session 4 if you want to create a new workload yourself. If you want to use the default workload, you should replace the “?” by the number of Search Server nodes. 3.4.2. Start benchmark test Under the $Search/exp/ directory you should run the following command to start the 6 3. Getting started benchmark test. $ make test The information of the test can be seen at file ./nohup.out 3.4.3. Get result We have integrated DCAngel, which is a comprehensive workload characterization tool in our Search benchmark. Now we can use it to collect performance date, aggregate data and visualize data. Figure.2 shows the high-level diagram of DCAngel. It stores performance data in a relational database managed by SQLite3 that supports the extended SQL statements. Users can access those data through the extended SQL statements. All the tests’ log and performance data collected by DCAngel can be find in the $Search/exp/log/($workload) directory. The ($workload) here represents the workload you use. For example, if you use the default workload, the log can be find at exp/log/search.example.head:100000-fixed:100@s?i2@reqs-SoGou where “?” represents the Search server nodes’ number. In that directory, there will be a file named exp-report if the test of the workload finished. The file is an empty file, and the only usage is to tell the user that workload replay has finished. The exp-log file records the start time and end time of the workload. The search directory collect the search log, the terms send to search engine and warm-up log. The hmon directory collects performance data of Search Server nodes. Query Server Log1 Log2 DataBase Extended SQL Log3 Figure 2 High Level Diagram of DCAngel Users can get data through a browser using DCAngel. For this version, the only browser we supported is FireFox. First, you should start the service by executing the following commands. Enter the directory python-lib/fsh/: $ cd python-lib/fsh Start the service: ./psh.py port. For the port, we use 8002 as a example. $./psh.py 8002 And then you can visit DCAngel’s browser port through the address (do not forget the slash after “fsh”): http://Client node ip address: port/$Search/exp/cmds/fsh/ 7 3. Getting started The $Search above is the location of Search-v1.0 package. Figure 3 snapshot of DCAngel’s GUI Figure 3 shows the snapshot of DCAngel’s GUI. The GUI can be divided into three parts. Part one is commands column. Each line in that column is a DCAngel command. Users can execute the command by ctrl+ left mouse button click. Users can edit those commands to meet your requirement. Part two is command input column; you can input your command here and execute it by pressing Enter. Part three is a display column, which displays the result of the command. Now we will show you the DCAngel command’s grammar, so that you can writer your own commands. A DCAngel command has two parts—a fixed part and a SQL like part. Let us look at the following command as an example. self.py exps2 ‘select reqs,comment, netbytes from _all where app="search" ’ The fixed part is self.py exps2 and the SQL like part is 'select reqs,comment, netbytes from _all where app="search" '. For the SQL like part, users can write any statement that meets the sqlite3’s syntax. DCAngel’s feedback may take a few seconds if it is your first time to execute a DCAngel command after a test. That is because DCAngel needs time to write metrics data it collected into database. DCAngel also defines many extend SQL functions. Those functions usage are shown as below. std(arg1) : standard deviation of arg1 corrcoef( arg1, arg2) : correlation coefficient between arg1 and arg2 correlate(arg1,arg2) : cross correlation of arg1 and arg2 wavg(arg1,arg2): weighted average of arg1, and arg2 is weight xplot(arg1, arg2, arg3, arg4) : draw the scatter figure of arg4. The x-axis of this figure is time and the y-axis is arg4’s average value. arg1 and arg2 should be “path” and “host” respective. arg3 is degree of data aggregation. If arg3 equals 100, each 8 3. Getting started point in the figure represents the average value of 100 arg4. xhist(arg1, arg2, arg3, arg4) : draw the histogram of arg4’s occurrence times. The x-axis of this figure is occurrence times and the y-axis is arg4’s average value. arg1 and arg2 should be “path” and “host” respective. arg3 is degree of data aggregation. If arg3 equals 100, each value on the x-axis represents the average value of 100 arg4. xscatter(arg1,arg2,arg3,arg4,arg5) : draw bi-dimensional histogram of arg4 and arg5. arg1 and arg2 should be “path” and “host” respective. arg3 is degree of data aggregation. If arg3 equals 100, each value on x-axis and y-axis represents the average value of 100 arg4 and arg5. xcorr(arg1,arg2,arg3,arg4,arg5) : plot the cross correlation between arg4 and arg5. arg1 and arg2 should be “path” and “host” respective. arg3 is degree of data aggregation. If you want to use xplot you must make sure that the following read color words are not changed: self.py exps2 'select reqs,comment,host, xplot(path, host, 1, $metric) from exps natural join all_events self.py exps2 'select reqs,comment,host, xhist(path, host, 1, $metric) from exps natural join all_events self.py exps2 'select reqs,comment,host, xscatter(path, host, 1, $metric,$metic) from exps natural join all_events self.py exps2 'select reqs,comment,host, xcorr(path, host, 1, $metric,$metric) from exps natural join all_events For $metric it can be any $metircs can be any field in Appendix B We list the table structure of DCAngel’s database in Appendix A. Users can look up Appendix A and write your own DCAngel command 9 Appendix B 4. Building your own Search If you want to build your own Search, this part will give some advices. If following introductions do not suffice for your approach, you may contact us via [email protected]. 4.1. CPU If your Search Server nodes do not own a CPU whose type is one of the types we mentioned in section 3.2.6, you should modify line 167 to line 201 of file $Search/hmon/hmon.py. 167 kperf_events_map = ''' 168 CPU_CLK_UNHALTED.CORE 3c # cpu_cycles 169 CPU_CLK_UNHALTED.BUS 13c # bus cycles 170 INST_RETIRED.ANY c0 # insets 171 ITLB_MISS_RETIRED c9 # itlb_misses 172 DTLB_MISSES.ANY 108 # dtlb_misses 173 L1I_MISSES 81 # icache_misses 174 L1D_REPL f45 # dcache_misses 175 L2_LINES_IN.ANY f024 # l2cache_misses 176 177 PAGE_WALKS.CYCLES 20c # page_walks 178 CYCLES_L1I_MEM_STALLED 86 # icache_stalls 179 180 BR_INST_RETIRED.ANY c4 # br_insts 181 BR_INST_RETIRED.MISPRED c5 # br_misses 182 183 INST_RETIRED.LOADS 1c0 # load_insts 184 INST_RETIRED.STORES 2c0 # store_insts 185 INST_RETIRED.OTHER 4c0 # other_insts 186 SIMD_INST_RETIRED.ANY 1fc7 # simd_insts 187 FP_COMP_OPS_EXE 10 # fp_insts 188 189 RESOURCE_STALLS.ANY 1fdc # res_stalls 190 RESOURCE_STALLS.ROB_FULL 1dc # rob_stalls 191RESOURCE_STALLS.RS_FULL 2dc # rs_stalls 192 RESOURCE_STALLS.LD_ST 4dc # ldst_stalls 193 RESOURCE_STALLS.FPCW 8dc # fpcw_stalls 194 RESOURCE_STALLS.BR_MISS_CLEAR 10dc # br_miss_stalls 195 196 BUS_TRANS_ANY e070 # bus_trans 10 Appendix B 197 BUS_DRDY_CLOCKS 2062 198 BUS_BNR_DRV 2061 199 BUS_TRANS_BRD e065 200 BUS_TRANS_RFO e066 201 ''' # bus_drdy # bus_bnr # bus_trans_brd # bus_trans_rfo You should go over your CPU’s software design manual and change hexadecimal number above to the corresponding CPU event number. 4.2. Make your search engine For default Search, we just supply a SoGou corpus’s snapshot and indices and all the Search Server nodes have the same indices and snapshot (it also called segments in nutch). Your can use your corpus’s snapshot and indices. With your snapshot and indices, you can separate the snapshot and index them by using the nutch command – merge and index. You should put each part of snapshot and index into Search Server nodes’ /home/ans42/crawl/combinations directory. The default Search gives you an example of the indices and snapshot’s layout in each Search Server node’s directory: /home/ans42/crawl/combinations. After that, you should modify the configuration file s?i2.cfg in Cline node’s $Search/nutch where ‘?’ represents the number of Search Server nodes. The content of that configuration file is as follows: 1 server-list=gd87 gd88 gd89 gd90 2 gd87-crawl-dir=01 3 gd88-crawl-dir=23 4 gd89-crawl-dir=45 5 gd90-crawl-dir=67 The first line represents the Search Servers’ hostnames. From the second line, each defines the directory name of corresponding Search Server node’s snapshot and index. 4.3. Creating your own workload Section 3.4.1 mentions you can create your own workload, and this section will explains how to create a workload. Now we will show how to create a workload by show the syntax and explaining a given workload’s meaning. The given workload is as follows: Syntax: search.#anno.function1(:args)-function2(:args)@configfile@reqfile An example: search. instance.head:10000−poisson:20@s8i2@reqs−sogou 11 Appendix B “search” means that a search engine is under evaluation. We use dot(.) to link different parts. “#anno” is the annotation of this workload; in the example we use “instance” to indicate that this workload is an instance. “function1(:args)-function2(:args)” indicates the functions we use to the real request sequence. “function1” and “function2” is transforming function’s name. The function can be found at Appendix C. “args” is the function’s parameters. we use “-” to link transforming functions. In the example “head:10000” means that we use head function in Appendix C, head function’s parameter is “10000”. “poisson:20” means that we use poisson function in Appendix C and its parameter is “20” “@configfile” indicates the configuration file we used for Search Server. The configuration file is in Client node’s $Search/nutch directory.. In the example "@s8i2 " means that we use s8i2.cfg as Search Server nodes’ configuration file where s8i2.cfg is in Client node’s $Search/nutch directory. “@reqfile” indicates the original request sequence we use. The request sequence file is in Client node’s $Search/search-engine/data directory. Appendix D lists the request sequence we have provided, and users can use one of them or a new one. In the example, “@reqs-sogou” means that we use sogou request and the request file is $Search/search-engine/data/reqs-sogou. You can use all the function in Appendix C to create your own workload, and adopt your own Search Server nodes’ configuration file and request. For how to configure Search Server nodes you can consult section 4.2 12 Appendix B Appendix A –Metrics collected by DCAngel variable Definition Metrics from performance counters Core cycles when core is not halted cpu_cycles Bus cycles when core is not halted bus_cycles Retired instructions insts Retired instructions that missed the ITLB itlb_misses Memory accesses that missed the DTLB dtlb_misses icache_misses Instruction Fetch Unit misses dcache_misses L1 data cache misses Duration of page-walks in core cycles page_walks Cycles during which instruction fetches stalled icache_stalls Retired branch instructions br_insts Retired mispredicted branch instructions. br_misses Instructions retired, which contain a load load_insts Instructions retired, which contain a store store_insts Instructions retired, which no load or store operation other_insts Retired Streaming SIMD instructions simd_insts Floating point computational micro-ops executed fp_insts Resource related stalls res_stalls Cycles during which the reorder buffer full rob_stalls Cycles during which the reserve station full rs_stalls Cycles during which the pipeline has exceeded load or store limit or ldst_stalls waiting to commit all stores Cycles stalled due to floating-point unit control word writes fpcw_stalls br_miss_stalls Cycles stalled due to branch misprediction All bus transactions bus_trans Bus cycles when data is sent on the bus bus_drdy Number of Bus Not Ready signals asserted bus_bnr bus_trans_brd Burst read bus transactions bus_trans_rfo Read For Ownership bus transactions Metrics from /proc filesystem User mode CPU time usr The CPU time of processes whose nice value is negative nice Kernel mode CPU time sys Idle time idle Iowait time iowait Hard interrupt time irq Soft interrupt time softirq The times of interrupt happened intr Context switch times ctx Process number procs 13 Appendix B running blocked mem_total free buffers cached swap_cached active inactive swap_total swap_free pgin pgout pgfault pgmajfault active_conn passive_conn rbytes rpackets rerrs rdrop sbytes spackets serrs sdrop read read_merged read_sectors read_time write write_merged write_sectors write_time The number of processes that is running The number of processes that is blocked Total memory Memory that is not used Size memory in buffer cache Memory that cache used Memory that once was swapped out, but still in the swapfile Memory that has been used more recently Memory that is not active Total amount of physical swap memory Total amount of free swap memory The number of pages that paged in from disk The number of pages that paged out to disk The number of page fault The number of major page faults TCP active connection TCP passive connection Received bytes Received packets Received error packets number Number of packets dropped by native network adapter Bytes sent Packets sent Number of error packets sent Number of packets dropped by remote network adapter Times of disk reads Times of disk merged reads Times of sectors read The total time disk read Times of disk writes Times of merged disk writes Times of sectors write The total time of disk write DCAngel collects those metrics per second and writes those values into exp/log/. 14 Appendix B Appendix B – DCAngel database table structure For the meaning of all following table’s abbreviations, users can go over Appendix A. Table exps field Definition The test performance data’s path under exp/ directory path User used application’s name app The comment when user used to specify a comment Request name reqs The test’s duration duration Node’s host name host Table _all Field path host insts cpi br_miss_ratio br_stall_ratio icache_stall_ratio tlb_stall_ratio dcaceh_stall_ratio l2cache_stall_ratio res_stall_ratio rob_stall_ratio rs_stall_ratio ldst_stall_ratio fpcw_stall_ratio br_mix load_mix store_mix ldst_mix simd_mix fp_mix other_mix bus_util bus_d_util bus_bnr_ratio bus_brd_ratio bus_rfo_ratio Definition The test performance data’s path under exp/ directory Node’s host name The mean value of instruction number Cycles per instruction Branch miss ratio Branch stall ratio Icache stall ratio TLB stall ratio Dcache stall ratio L2 Cache stall ratio Resource related stall ratio Reorder buffer stall ratio Reserve station stall ratio Load and store stall ratio Float point unit stall ratio Branch instruction ratio Load instruction ratio Store instruction ratio Load and store instruction ratio SIMD instruction ratio Float point instruction ratio Instructions that except load and store ratio Bus utilization bus_drdy ratio(users can find bus_drdy and all the following abbreviations’ meaning in Appendix A) bus_bnr ratio bus_brd ratio bus_rfo_ratio 15 Appendix B cpu_usage search_latency search_start duration netbytes netpackets CPU utilization Average query latency Test start time The test’s duration rnetbytes+snetbytes rnetpacket+snetpacket The meaning of following field is the same as it in Appendix A. So we will not explain them here. iowait ctx active pgfault pgmajfault active_conn passive_conn read write read_sectors write_sectors For table _all, we also define some macro which you can use to simplify your inputting. Fro example you can write a DCAngel command self.py exps2 'select $prim from _all ', which has the same function with self.py exps2 'select app, comment, reqs, host from _all’ Macros and their definitions macros definition $prim app, comment, reqs, host $hpc_basic insts, cpi, br_miss_ratio $stall_breakdown br_stall_ratio, icache_stall_ratio, tlb_stall_ratio, dcache_stall_ratio, l2cache_stall_ratio, res_stall_ratio, rob_stall_ratio, rs_stall_ratio, ldst_stall_ratio, fpcw_stall_ratio $inst_mix br_mix, load_mix, store_mix, ldst_mix, simd_mix, fp_mix, other_mix $cache itlb_miss_ratio, dtlb_miss_ratio, icache_miss_ratio, dcache_miss_ratio, l2cache_miss_ratio $bus bus_util, bus_d_util, bus_bnr_ratio, bus_brd_ratio, bus_rfo_ratio $proc_basic cpu_usage, iowait, ctx, active, pgfault, pgmajfault $net active_conn, passive_conn, netbytes, netpackets, $disk read, write, read_sectors, write_sectors $proc_selected cpu_usage,iowait,ctx,active,pgmajfault,read_sectors $hpc_all $hpc_basic, $cache, $bus, $inst_mix $proc_all $proc_basic,$net,$disk 16 Appendix C Appendix C— The workload transforming function In the following table, we use qs and ts represent query sequence and time sequence respectively. Function parameters Definition name $Total: $start Get qs and ts from the sequence number of head $start, and the total entry number of qs and ts is $Total, e.g. search.#anno.head:100:0@cf@req If $start is 0 then is can be leaved out, e.g. search,#anno,head:100@cf@req NULL Get the unique query terms out of qs e.g. uniq search.#anno.uniq@cf@req $Total Randomly get query terms from qs and the random total number of queried terms is $Total,e.g. search.#anno.random:1000@cf@req NULL Shuffle the terms in qs, e.g. shuffle search.#anno.shuffle@cf@req NULL Sort the qs according to the frequency of hot terms’ occurrence, e.g. search.#anno.hot@cf@req NULL Sort the qs according to terms’ length. lens $Blocksize:$repeatCount Repeat every $Blocksize terms in qs blockreq $RepeatCount times. e.g. search.#anno.blockreq:10:2@cf@req $Rate Generate ts and set the query rate to be fixed $Rate queries per second. e.g. search.#anno.fixed:20@cf@req $Rate:$K Generate ts and let ts be i*$K*$K/$Rate, burst where i=1…len(qs) e.g. search.#anno.burst:20:2@cf@req $Rate Compress or amplify original ts by setting scale the query rate to be $Rate queries per second. e.g. search.#anno.scale:20@cf@req $Rate Generate ts and make the query rate poisson variation fit poisson distribution, and set the average rate to be $Rate queries per second, e.g. search.#anno.poisson:40@cf@req $Init:$step:$K Generate ts and set the initial query rate to ratestep be $Init. The rate will increase for ($K-1) times. Each time it will increase the value of 17 Appendix C $step. Finally ,it will be stable at the rate of “$Init + $step * ($K-1)” e.g. search.#anno.ratestep:20:5:20@cf@req Appendix D— Request sequence and their definitions Request sequence name warmup.reqs reqs-SoGou reqs-Abc reqs-Xyz reqs-by-freqs-SoGou Definition A warmup request sequence for benchmark ramp-up A real world request sequence from SoGou search engine A real world request sequence A real world request sequence Sorting reqs-SoGou according to request term’s query frequency. reqs-by-freqs-Abc Sorting reqs-Abc according to request term’s query frequency. reqs-by-freqs-Xyz Sorting reqs-Xyz according to request term’s query frequency. reqs-by-lens-SoGou Sorting reqs-SoGou according to request term’s length. reqs-by-lens-Abc Sorting reqs-Abc according to request term’s length. reqs-by-lens-Xyz Sorting reqs-Xyz according to request term’s length. All the request sequence file above can be found in $Search/search-engine/data/ directory. 18