1
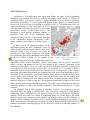
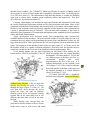
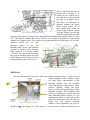
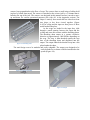
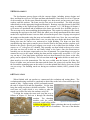
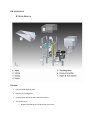
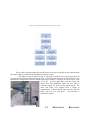
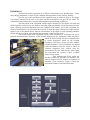
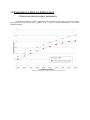
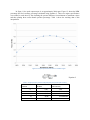
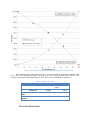
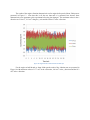
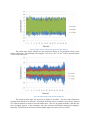
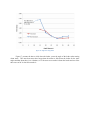
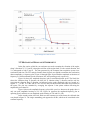
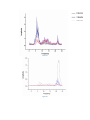
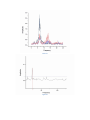
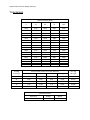
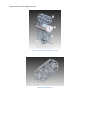
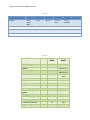
Community-Scale Thresher Design Summary Report Ohio University Mechanical Engineering Team Captain Plant It June 2010 1.0 INTRODUCTION Appalachia is a 205,000-square-mile region that follows the spine of the Appalachian Mountains from southern New York to northern Mississippi, which includes 33 counties in southeastern Ohio. The region’s economy is highly dependent on heavy industry, agriculture and mining. According to a recent Appalachian Region Income Report; per capita personal income was 20% lower than in the nation as a whole in 2007 (1). In Southeastern Ohio, per capita market income in 2002 was $18,037, or 26.3% lower than that of the total state, and 31.7% lower than the national average. In this region, 42% of the population is rural and the sustaining economy is agriculture. Over 50% of the southeastern Ohio counties are ranked “at risk” or “distressed” according to the Appalachian Region Commission’s (ARC) county economic status report in 2010(See Figure 1.1 (2)). In order to solve the economic problems in the Appalachian region, the ARC conducted a series of studies. Results indicated that the farmer’s share in the traditional market is only 22 cents to every dollar of the total price of the product, and the rest of the shares go to marketing, processing, distribution and retailing, Figure 1.1: Map of Distressed Counties in in which no value is added (2). In response to the Appalachia (2). distressing situation in the Ohio Appalachian region, The Appalachian Staple Food Collaborative (ASFC) was founded with the goal of increasing farmer’s income, and pushing the idea of, and catering to, the “locavore” movement in the southeastern Ohio region. “Locavore” is the movement to eat healthy foods that are both grown and produced in close proximity to where they are consumed. It is a method to build a sustainable local food system that will make farmers become an integral part of the complete food value chain rather than isolated in a production-only role on the food marketing cycle (3). The ASFC is lead by Michelle Ajamian and Brandon Jaeger who have introduced staple foods such as millet, spelt, amaranth, meal corn, bean and buckwheat back into the Athens food market. They are working with local farmers and the local community gardens, which all have relatively small plots of land to plant on. The equipment commercially available in the United States currently caters to large farming cooperatives. The ASFC’s goal is to bring a cost effective processing solution to small scale farming cooperatives that cannot afford to hire in large combines. The Shagbark Seed & Mill Company, a subsidiary to AFSC, was created to solve the equipment issues the region is suffering from. Ohio University’s Department of Mechanical Engineering Senior Design offered two teams to begin the task in solving this engineering problem. These two teams were tasked in completing phase one of this project; the initial prototype design and construction of the thresher and de-huller. Phase two, the validation of designs, will be continued as graduate work by Joseph Schultheis beginning in the summer of 2010. Development of the cleaning mechanisms for both the thresher and the de-huller may be continued by another senior design group for the 2010-2011 school year under the guidance of Mr. Schultheis. T T 2.0 CUSTOMER NEED STATEMENT The need is for an appropriately sized machine to thresh and clean multiple grains such as: spelt, amaranth, buckwheat, millet, beans and corn crops. Some of these crops will then need to be de-hulled and re-cleaned. These crops are comprised of primarily buckwheat and spelt. Two teams worked together on the development of this equipment. Team Captain Plant It had the responsibility for the threshing and initial cleaning process and the other team, the Plainsmen, dealt with the de-hulling and final cleaning phases. This machine had to be portable and user friendly in order to be used by multiple persons at multiple locations in the community. Challenges were expected to arise due to the integration of the four phases and the management of two teams. This machine must be flexible enough to be easily converted from doing all four operations to doing the first two (threshing and cleaning). It must also be easily convertible between the different crops. The challenge for the teams is to produce a machine that is practical, cost effective and have a phase one prototype completed by the end of spring quarter of 2010. T 3.0 RATIONAL The customer needs were organized and grouped into five major categories. These groups are portability, weather resistance in operation and storage, Table 3.1 flexibility, user friendliness and finally maintainability. These groups were weighted by importance as a consensus group process. The weighting and the particular needs are presented in Table 3.1. Both portability and flexibility were determined to be the two most important needs because they are essential to delivering a product to solve the problem. The goal of these efforts for phase one is to produce a threshing machine that is portable and economically viable. The machine is for practical use to process crops grown on small plots of land ranging from ½ an acre to 10 acres. This threshing machine will be placed on a trailer for mobility and shall be stationary while in operation. The crops this machine shall be capable of processing are: millet, amaranth, beans, spelt, and buckwheat. Currently, a pull behind thresher/cleaner combine that is not portable is being used. With this system, the crops must be harvested and then transported to an offsite location to be processed. Currently, commercially available thresher/cleaner combines are capable of processing more than one type of crop. These machines use a drum and a concave surface to thresh and are capable of processing multiple crops by changing the distance between the drum and the concave and increasing or decreasing threshing drum speed. The cleaner is fitted with variable screen sizes for different crops, i.e. coarse for corn and fine for amaranth; this comprises phase two of the project. Commercially available products that suit the need are produced internationally and are not economically viable for the Appalachian region. Basant Products India currently builds multigrain thresher/cleaner combines for small farmers in India. Figure 3.1: 5HP VIDHATA These are production level machines that can range in cost from ten Thresher (4) to fifteen thousand dollars. Figure 2.1 shows a 5Hp 14” X 27” drum thresher/cleaner combine. The “VIDHATA” Multi-crop Thresher is capable of running with an electric motor as well as a Diesel engine and is compatible with tractors from 2 to 40 horsepower via a PTO drive shaft (4). The manufacturer states that this thresher is suitable for threshing crops such as: wheat, maize, sorghum, grains, sunflower, millets, and mustard (4). They have 99% efficiency for clean grain output (4). Customer requirements were translated to target specifications and constraints by both using the Quality Functional Deployment method and by group discussion and debate. Many of the constraints are bounded by functionality and customer needs. For example, this machine must be flexible in crop acceptance, and must be easily adaptable to other processes. Other constraints are a result of standards that must be followed. These include road worthiness of the trailer as defined by Ohio Department of Transportation and machine safety standards by the Occupational Safety and Health Administration. Target specifications were developed mainly from benchmarking other commercially available thresher/cleaner machines. The power needed and the clean grain output percent were estimations that rely mainly on the benchmarked systems (Note: benchmarked systems are still larger than this project). Other specifications like size and weight are practical estimations by the group. The propulsion of the thresher/cleaner need to be in the range of 1 to 5 horse power, but the machine needs to be capable of human propulsion. That being said, the machine must be completely operable by the lower end of the propulsion criteria (approximately 1Hp). A few notable patents came up when researching for this project. Most notably are US Patent number 4,209,024 and number 5,794,423. These two patents show two similar threshing mechanisms. US Patent number 5,794,423 has two different types of threshers; the first is a conventional thresher that works perpendicular to the flow of the crop. It is mounted horizontally on the combine (item 156 in Figure 3.2 (5)). The second is a thresher that works parallel to the flow of the crops into the thresher mounted in a vertical direction (Item 136 in Figure 3.3 (5)). US Patent 4,209,024 has a completely different setup altogether. Instead of having a Figure 3.2: Horizontal thresher (5) standard rotary thresher, it has an auger-like thresher that threshes the grain as it moves through the auger (Figure 3.4, Item 15). The seed then falls down through the screen around the auger and onto an elaborate cleaning system. It has two separate cleaning systems that do the same thing, but in two different directions that end up in the same location. While dealing with concept ideas the group had to decide whether to have a cleaner in the team’s scope of work or not, and mostly Figure 3.3: Parallel thresher (5) due to complexity and time we decided not to include it. A cleaner may be worked on by the team later if the materials and time are available, but it will likely be addressed by graduate students and future senior design teams. All of these patents have shown the group many different design Figure 3.4: Auger‐like threshing drum (7) concepts. What is best for this particular application given the customer requirements is going to be the perpendicular threshing drum concept (Figure 3.2, item 156). The customer allowed the team to view this exact design in operation on a pull behind combine the company owns. The combine the group modeled the final design on is an AllisChalmers Model “66“ All Crop Harvester (Figure 3.5 (6)). The threshing drum in the Allis-Chalmers combine is similar to the threshing drum found in U.S. Patent number 5,794,423. The team decided to model this projects threshing drum off of the Allis-Chalmers style because of ease of manufacturability and ease of access. Threshing Drum Figure 3.5: Allis‐Chalmers Model “66” All Crop Harvester (6) 4.0 DESIGN The team designed the frame to be sturdy and vibration resistant using 1.5” angle iron and rubber dampeners in key locations. There are eight major subassemblies to the threshing machine, they are: threshing drum, transmission, output, motor, frame, concave assembly, ceiling, and input. Figure 4.1 shows the general layout of the threshing machine. The threshing drum consists of eight pieces of angle iron and three aluminum wheels (Figure 4.2). The transmission utilizes a v-belt and an idler pulley (the idler pulley is the teal object in Figure 4.1). The concave assembly Figure 4.1: Thresher components consists of two components, the concave, and the scizzor jack (Figure 4.3). The concave is a curved piece of sheet metal that has two concave bars perpendicular to the flow of crops. The concave bars ar small strips of rubber held in place by bolted sheet metal. The concave is attached to the scizzor jack by a U-channel that is bolted to the top of the jack. The concave was designed in this manner because it needs to move up and down for various operational purposes (See video 8.1 in the Appendix section). The output is entirely sheet metal that has either been bent into shape or has been rivoted together (Figure 4.4).The ceiling and the input are bent pieces of sheet metal boolted into place. As the crops are loaded in the input they slide through a small opening between the input and the ceiling and come into contact with the threshing drum. The threshing drum rotates in a counter clockwise direction at approximately 1000 RPMs depending on the crop. The crop is then threshed against the rasp bars of the threshing drum and dispensed into the output. The output funnels the threshed crop into a bin Figure 4.2: Threshing drum placed under the chute. The total design was to be modular and easily adaptable. The output was designed to be easily detached so a cleaner could be introduced to the system (Figure 4.4). Figure 4.3: Concave assembly Figure 4.4: Output 5.0 DEVELOPMENT The development process began with the concept design, including picture designs and ideas, and then moved on to CAD parts and then subassemblies. Once there was 90 to 95 percent of the assembly on file the team ordered the angle iron, sheet metal, and necessary nuts, bolts, washers, and lock washers. The frame was the first part to be assembled. The shaft was then ordered and cut to the appropriate length and diameters. Bearings were then chosen for the RPM range according to the required specifications of the customer. A 3.5 HP Briggs & Straton 4 cycle motor was purchased and an addition to the frame was needed for a desirable spot for it. The next step was to start assembling the threshing drum. This required a redesign of the wheels connecting the rasp bars to the shaft. While the wheels were being manufactured the sheet metal needed to be replaced because it was too thick to bend in the press. Once 16 gauge was acquired the output was then made using the press and assembled with rivets. Next, the cover and input, made of the same 16 gauge sheet metal, were cut using the press brake and then bent to size. During this time the concave was outsourced to Logan Bending. The drum was then fully assembled using shear pins to transfer power from the shaft to the drum and the rasp bars were bolted to the wheels. Special steel supports were made to be welded from the bottom of the concave to a 2” wide piece of U-channel. This assembly was then bolted to the top of a scissor jack that was then all leveled out and finally bolted to the frame. Once the drum/concave assembly was set, the input, output, and cover were all mounted. Two piano hinges were used to connect the cover to the output, making the drum and the engine easily accessible. A 3/8” slot was cut into a 2 foot long square metal tube and was then mounted to the frame so the idler pulley can be adjusted if necessary. The belt was then made taunt and a shield was made out of sheet metal to cover the transmission. The feet were welded onto the bottom of all the legs. Pieces of rubber were put between the motor and the frame, the scissor-jack and the frame, and the feet and the mounting spots on the trailer. It was then painted black and a clear coat of paint was put on top. The finishing touch was having our customers initials (ASFC) painted on the cover. 6.0 EVALUATION When finished with our product we commenced the evaluation and testing phase. The evaluation and testing could not be completed as desired due to the lack of harvested crops in the month of May. Further testing will be performed towards the end of August 2010 and into September. For the time being the testing was done with bird seed millet. The bird seed came on a stalk which is very similar to what the reaped crop will be like in the late summer, early Fall. To begin the testing the team took crop that was as follows in Figure 6.1 and ran it through the threshing machine. The threshing machine took the millet, Figure 6.1: Un‐threshed millet processed it and left the millet as follows in Figure 6.2. Other evaluations that can be conducted are cost, weight, and user friendliness. The cost of the thresher Figure 6.2: Threshed millet is laid out in the following Table 8.1. This is an accurate estimate of the final cost of the thresher including manufacturing time and overhead. This meets our specifications because other threshing mechanisms in other countries cost upwards of $15,000 not including shipping to the U.S. The final weight of the system is around 250 lbs, which far exceeds our expectations and specifications of the mechanism weighing less than 400 lbs. In addition, the system is also user friendly in many ways. An original specification was for the threshing drum to be accessible for maintenance through the concave being dropped down. Not only has this been achieved but there was a second access point added by the raising of the output. Video 8.2 in the appendix section shows the threshing machine in action. Only a small amount of crop was available for early testing, so the team will not know if the prototype was an absolute success until late August. 7.0 CONCLUSION The project objectives originally was to build a thresher and cleaner using engineering principals to process multiple crops consisting of spelt, amaranth, buckwheat, beans and millet. This design was to be modular (flexible enough to add on to it later), energy source flexible and reproducible. In winter quarter we decided that to engineer and produce both a thresher and cleaner was too ambitious and that it was time to limit our scope. We decide to only build the thresher put make sure that this basic structure could be built off in the future to add a cleaner. Limiting the scope enable us to catch up and limit the cost of our project. We might have been able to come close in material cost to our projected values but would have been way off in the schedule if we had elected to continue with both machines. Table 8.2 presents our specifications table from fall quarter with our prototype values filled in to show how our final design stacks up. Overall the project was a success because the team was able to complete a testable prototype for the graduate school to work from. After seeing the machine in action, original concerns have been justified and need to be considered in the future. The gap between the ceiling and the concave should be as small as possible and the crop should be fed to the thresher vertically are some examples. 8.0 APPENDICES 8.1 USER MANUAL FEATURES Fully enclosed threshing area Guards over moving parts Flexible frame and construction with bolt on parts Two access points o Output that folds up to provide access to the drum o Concave that lowers to provide access to itself and the drum. Variable pitch pulleys and various pulley combinations that allow for a wide range of crop capability. 4‐Stroke Internal combustion gasoline engine for power in ultimate location flexibility. Painted surfaces to discourage the formation of rust. SAFETY Warning: Captain Plant It thresher contains an Internal Combustion Gasoline engine. This engine contains hazardous chemicals, toxic fumes and hot surfaces that could cause harm or even death. The engine also contain flammable chemical that could result in a fire or even an explosion. For the complete overview of all warnings and risks please consult the engine manual. Warning: The Captain Plant It thresher contains moving parts that could cause serious harm or even death if anything is caught in the moving drum or in the belt system. While in operation: All guards should be in place and all adjustment bolts should be tightened down. The output should always be in the down position. There is NO reason why it should be in the upright position. While loading, the loader’s hand should never come close to the opening at the end of the input. If the crop gets stuck on the input or output turn off the thresher and only proceed when it is completely stopped. It is recommended that anyone with long hair working on or with the thresher put up their hair or where a hat in order to reduce that risk of their hair being caught in the belt or on the drum. This could result in very serious injuries. U In adjustment or maintenance mode: Ensure that the motor throttle in set in its off position and it is recommended that the spark plug wire be disconnected and kept away from the spark plug. Be careful around the motor it may be hot. It is recommended that anyone with long hair working on or with the thresher put up their hair or where a hat in order to reduce that risk of their hair being caught in the belt or on the drum. It is recommended that the user not use gloves when adjusting the thresher as they could get caught and that could result in an injury. Warning: Never start the machine if anything is inside of the threshing area. This could result in injury or damage to the thresher. Caution: Various parts of the Captain Plant It thresher may get hot during operation. Caution is recommended after prolonged usage. Caution: Do not over lift the concave. This could result in the drum hitting the concave and broken parts. There is a chance of flying parts that could result serious injury. One should always spin the drum by hand before operation to insure that the drum will not hit the concave and all concave adjustment points should be tight. Caution: When the output is in the upright position it could easily fall and cause injury to any one below it. It should be tied down to make sure this does not occur. Caution: When working on or with thresher beware of any pinch points or sharp edges as one could get hurt. OPERATION Starting and Running the Thresher 1) Ensure that all the security knobs on the concave are tightened down and the concave is snug. 2) Rotate the threshing drum by hand to make sure that there are no restrictions to rotation. 3) Slide the idler pulley up on the slide to tension the belt (remember to only tension the slack side of the belt) and make sure that the belt is seated properly in all pulleys and is not rubbing on anything. All set screws on the pulley should be tightened and the nuts on the idler should be wrench tightened. Table 1: Recommended V‐Belt Tensioning (from Bando USA) V‐belt A Small Sheave Diameter (Inches) < 3.0 Initial instillation 3.6 lbs Re‐tensioning Maximum 3.1 lbs Re‐tensioning Minimum 2.4 lbs 4) Replace the belt cover and ensure that the output is in the down right position. 5) Set the engine throttle to the desired speed, set the chock if needed and pull start the engine. For further instructions for starting the engine please consult the engine manual. Notice: Ensure that the engine is filled with oil before you start the engine, instructions to do so can be found in the engines user manual. Running the motor without oil can result in damage to the engine. 6) Load reaped crop in to the input and allow it to slide down the ramp. Never reach your hand in to the threshing area or attempt to throw crop into the threshing area. Notice: The inside surfaces are not painted and are unprotected, they may develop rust. Threshing wet or moist crop is not recommended. 7) Collect threshed grain in container at the end of the output. Adjusting and Changing Thresher Settings to Change Crops 1) Make sure that the engine is completely off, the throttle in all the way in the off position. One could remove the spark plug wire just to be safe. 2) Guarantee that all the concave security knobs are loose before cranking down the jack and raise or lower the concave to the desired level. 3) When the thresher is off the output can be raised or lower at anytime to gain access to the threshing area. If working under the output then it should be tied down to make sure it doesn’t fall. 4) When adjusting pulley system the engine must be off. The drum pulley can be removed and replaced with different sized pulleys by and the engine variable pitch pulley can be adjusted by loosening the set screw and spinning half of the pulley. Ensure that all set screws are tight before starting the thresher and make sure to tighten the belt with the idler and tightened the nuts. Table 2: Recommended Threshing Settings for Given Crops RPMs* Crop Min 1375 2150 # 2150 550 550 2150 Buckwheat Spelt Amaranth Millet Black eye beans Azuki beans Oats Max 1850 2475 # 2475 1225 1225 2475 Concave Distances^ 3/8’’‐5/8’’ 3/8’’‐5/8’’ ¼’’‐½’’ ¼’’‐½’’ 3/8’’‐5/8’’ # 3/8’’‐5/8’’ *RPM are approximate and were converted from the Allis‐Chambers All Crop Model 66 where the d all crop is 15 crop chart using the equation inches, d cp thresher is 9.75 inches and RPM all crop is found from the chart in the Allis Chambers manual R R R R R R #These values are yet to be determined by testing by Joseph Schultheis ^The concave distances are from the Allis‐Chambers All Crop Model 66 manual MAINTENANCE Scheduled Maintenance 1) Motor (Check engine manual for detailed instructions) a. Daily i. Check Engine oil ii. Clean area around muffler, controls and finger guard b. Every 25 hours i. Clean air filter ii. Clean pre‐cleaner c. Annually i. Change engine oil ii. Check muffler and spark arrester iii. Replace air filter iv. Replace spark plug v. Clean air cooling system Note: Fuel can become stale when stored over 30 days. It is recommend that one add fuel stabilizer or empty the tank. 2) Belts a. Weekly i. Inspect belt for wear. If wear is excessive then it should be replaced. ii. Clean belt. Keep dust and chemicals off of belt. Never clean the belt with oils or chemicals unless they are approved by the belt manufacturer 3) Bearings a. Daily/Weekly i. Inspect bearings, make sure they are not making excessive noise and the drum spins freely with the belt is not attached. Note: Bearings are self contained and do not need lubricated. 4) Paint condition/Rust a. Weekly/Monthly i. Inspect all painted surfaces inside and out. Surface rust can be removed and repainted. If rust is on the inside of the concave, the drum or any working surfaces, then remove the rust and apply rust resistant clear coat. Troubleshooting I. Problem: Excessive vibration Solution Check security knobs on the concave and ensure that they are all tightened. If not stop engine if you have not already and tighten the knobs. Ensure that thresher is bolted down tightly with rubber mounts. Check vibration rubber mounts under engine and scissor jack. Check all bolts and tighten them with the engine off. Check pulleys and belt system. Check drum and bearings. II. Problem: Under threshing crop or over threshing crop Solution If under‐threshed (not removing seed) speed up drum and/or decrease distance between drum and concave. For over threshing (breaking shell or seed or pulverizing seed) slow down threshing drum. III. Could also add rubber to rasp bars or remove up to four rasp bars. Note: Only remove rasp bars in even number increments to maintain balance. Problem: Hot Bearings Solution Drive under tensioned and belts are slipping causing heat build‐up then re‐tension belt. The drive is over tensioned with belts bottoming out then the pulleys are worn and should be replaced. Bad bearings because of poor maintenance or under‐design. Replace bearings and evaluate maintenance or bearing might need redesigned. Pulleys too far out on shaft pull them in as far as possible. IV. Problem: Belt deterioration or breaking prematurely (Check belt or pulley manufacture’s catalog for full detailed list.) Solution Check for foreign objects in the drive, make sure that the guard is installed or make sure that the belt drive is protected. Check for oil or grease on belts. Clean belts and sheaves with a degreasing agent or detergent and water and remove the source of oil or grease Excessive slippage, re‐tension belt. Check sheave or pulley grooves for wear of damage, replace pulley if needed. IV. Problem: Threshing drum is not spinning or rotating correctly. Solution Check belt drive and ensure that the belt is correctly tensioned and not slipping. Check the drum and make sure that the shear pins are not broken (they are located in the two collars on both outside aluminum spoked wheels). Check that all the pulleys are tightly connected to the shafts and the keys are not broken. Check the engine and ensure that is not broken and is transmitting power. How to: HOW TO REPLACE SHEAR PINS 1) Locate collars on the two outside aluminum wheels on the drum. 2) Remove both set screws in the collars. 3) Using a punch remove parts of the shear pin in the shaft and the collar. 4) Replace the shear pin. One should not have to force the new shear pin in. 5) Replace both set screws. 6) Repeat in other side. Note: Both shear pins should always be replace together whether or not both are broken. HOW TO TENSION BELTS 1) To tension belts, adjust the idler pulley until the belts appear fairly taut. When struck with the hand, belts will bounce back with a springy motion. 2) Run the drive for about 15 minutes to seat the belts, and apply full load. If the belts slip or squeal, apply more tension. When the drive is in motion, a slight sag on the slack side is normal. 3) An alternate method of tensioning is to use the simplified force/deflection method, as follows(as described by belt manufacture Bando USA): a. Measure the span length, L of the belt drive. b. At the center of the span, apply a force perpendicular to the belt. Measure the force required to deflect the belt 1/64” per inch of span length. For example, for a 100” span, the deflection would be 100/64, or approximately 1 1/2” inches. c. Tighten or loosen the belt to bring it into the correct range. d. When you install new belts, tighten them to “initial tension” forces shown in the tables. This tension will drop during the run‐in period. HOW TO INSTALL NEW BELTS AND ADJUST THE SLACK 1) Always shorten the center distance of the drive by adjusting the idler pulley, until the belts can be laid over the sheaves. 2) Never pry or force a belt on the drive with a pry bar or by cranking. This will almost certainly damage the tensile cord and although the injury may not be visible, belt life will be drastically reduced. 3) Work the belts by hand to move slack so it is on the same side — top or bottom — or all belts. This assures all belts start under equal strain. 4) Re‐tension the idler until the belt is seated in the grooves and the slack is taken up. Replacement Part Charts and Details Table 3: Belt system parts and RPM ranges Detail Outer diameter Nylon V‐belt, A belt type, 3’’OD, 3/8’’ wide, 3/8’’ bore Cast iron variable pitch V‐belt pulley, Engine pulley A belt type, ¾ bore, 3.15’’OD, Pitch dia. 1.9’’‐2.9’’ Zinc die cast V‐belt pulley, A belt Drum pulley type, 3’’OD, 5/8’’ bore, Pitch Dia. 2.75’’ Zinc die cast V‐belt pulley, A belt Drum pulley type, 4’’OD, 5/8’’ bore, Pitch Dia. 3.75’’ Zinc die cast V‐belt pulley, A belt Drum pulley type, 6’’OD, 5/8’’ bore, Pitch Dia. 5.75’’ Zinc die cast V‐belt pulley, A belt Drum pulley type, 9’’OD, 5/8’’ bore, Pitch Dia. 8.75’’ Belt Cogged rubber V‐belt, A section belt Idler pulley RPM Range 3’’ ‐ 3.15’’ ‐ 3’’ 1658‐2351 4’’ 1216‐1856 6’’ 793‐1210 9’’ 521‐795 TBD ‐ Table 4: Replacement Parts Size Details Bolts Bolts Bolts Bolts Collar screws ¼’’‐20, 1.5’’ long zinc plated 3/8’’‐16, 1.5’’ long zinc plated #6‐32, 1.5’’ long zinc plated 5/16’’‐24, 1.5’’ long zinc plated Flat 82˚ Phillips head zinc‐plated ¼’’‐20, 1 ½’’ long 416 Stainless Steel 5/32’’ diameter, 1 1/4 ’’ long Sheet metal bolts Frame Bolts Rasp Bar bolts Bearing mount bolts To connect the collars to Shear pins Set screws Rubber ¼’’‐28 ¼’’ long with 1/8’’ hex head 70A durometer Neoprene Spring rubber 3/8’’ thick 70A durometer Ultra Strength Neoprene rubber 3/8’’ thick Base mount ball bearing steel, 5/8’’ diameter, center height 7/8’’ Rubber Bearings Collars for shear pins Vibration mounts Concave bars Thresher Drum bearings 8.2 FMEA High Priority On: 1. Threshing drum Hit the concave Solution: Mechanical stop Breaks seeds, low efficiency Solution: Add rubber to leading edge Throughput too low Solution: ?? 2. Frame Bolts vibrate loose or apart or beams vibrate apart Solution: Lock washers on bolts Average Priority 3. Motor Not enough power or torque Rotational speed too fast for application Difficult to start These occurrences are acceptable to the customer. Setup: 1. Motor No oil so the motor seizes Forget gas Storage: 1. Motor Piston seizes Potential Failure Mode: Threshing drum breaking or smashing seeds (low efficiency) Initial After Action Define Actions and include comments on Evaluation Evaluation ratings. Actions should specify required analysis & testing for the design. 5 5 This would be a failure because we would fail to meet Potential Effect of our customer requirements. Failure (Severity, SEV) 3 1 We don't have a great feel for the likelihood of failure Likelihood of failure for this but plan on putting rubber strips on the rasp (Probability of bars and concave bars. We plan to test which occurrence, OCC) durometer is best in Me 488. Probability that impending failure will NOT be detected and prevented before it occurs, DET) 3 3 The output could be tested when the threshing process begins to see if it is smashing seed and that can be rectified. Risk Priority Number (RPN=SEV*OCC*DET) 45 15 Potential Failure Mode: Threshing drum hitting concave Initial After Action Evaluation Evaluation Potential Effect of Failure (Severity, SEV) 5 Likelihood of failure (Probability of occurrence, OCC) 3 1 The probability of this failure occurring can be severely reduced with the instillation of a mechanical stop to prevent the concave from being raised into the path of the threshing drum. Probability that impending failure will NOT be detected and prevented before it occurs, DET) 5 5 The only warning of this failure occurring would be the sound of metal bending and the machine crashing and burning. Risk Priority Number (RPN=SEV*OCC*DET) 75 25 5 Define Actions and include comments on ratings. Actions should specify required analysis & testing for the design. The failure would be catastrophic and could be dangerous and potentially deadly Potential Failure Mode: Bolts in the frame vibrate loose (or apart) Initial After Action Define Actions and include comments on Evaluation Evaluation ratings. Actions should specify required analysis & testing for the design. 5 1 The failure could be catastrophic and could be Potential Effect of dangerous. Failure (Severity, SEV) 1 1 Lock washers could be installed to prevent this failure. Likelihood of failure (Probability of occurrence, OCC) 3 3 When the bolts come loose the frame should vibrate Probability that more and a visual/ tightening check could be impending failure will implemented to make sure the bolts were tight before NOT be detected and operation. prevented before it occurs, DET) 15 3 Risk Priority Number (RPN=SEV*OCC*DET) Potential Failure Mode: Threshing drum throughput too low Initial After Action Evaluation Evaluation Potential Effect of Failure (Severity, SEV) 5 Likelihood of failure (Probability of occurrence, OCC) 3 1 We need to make sure the inputs and outputs are not too small and the threshing drum length is appropriately sized. Probability that impending failure will NOT be detected and prevented before it occurs, DET) 3 3 Not sure this would have to be tested while the system is in normal operation. Risk Priority Number (RPN=SEV*OCC*DET) 45 15 5 Define Actions and include comments on ratings. Actions should specify required analysis & testing for the design. This would be a failure because we would fail to meet our customer requirements. 8.3 ME451/488 REPORTS ABSTRACT U The purpose of these experiments was to help us understand and improve the design of our prototype. There were three main experiments that were performed. The first experiment performed was the shaft speed and efficiency experiment. In the shaft speed and efficiency experiment there were two main parts. The first was the determination of the speed in rpm with varying percent of throttle in the on position and the second was the determination of efficiency in gallons per minute versus varying percent of throttle in the on position. This data was then used to determine an optimum position for throttle to be run at and also at what speed the shaft spins at that position of the throttle. This result of 2597.16 rpm shows the point at which the motor runs most efficiently. The next experiment was the Vibration and Loader experiment. The purpose of this experiment was to study the vibrational characteristics of the motor and the frame of the threshing system and to use this data to determine and design a useful loader for the threshing system. The motor was attached to an accelerometer to determine its vibrational characteristics. For the loader portion of the experiment, the motor was attached to the frame and the input was temporarily attached to the frame. The motor was turned on and straw was timed being input down the sheet metal input. The useful loader angle was determined to be 30 degrees from the horizontal plane. The third and final experiment was the mechanical resonance test. In this experiment the frame was built and hit with a hammer. With an accelerometer attached the resonant frequency was determined to be about 20 Hz, while the operating frequencies were determined to be around 7-14 Hz thus meaning that the frame will not resonate during normal operating conditions. T 1.0 INTRODUCTION U The following experiments were conducted to optimize three components of a thresher design. A thresher is a machine used in agriculture to separate seeds from the chaff of a crop. The aforementioned design is a simple horizontal rotating drum powered by a 3.5 HP Briggs and Stratton motor through a yet to be determined pulley system design. The drum consists of three high strength aluminum wheel connected radially with eight pieces of 1” angle iron of 19” in length. The frame is all 1.5” angle iron held together by 3/8” bolts and lock washers. The input of the system is 16 Ga bent sheet metal that acts as a chute for the crop to fall between the rotating drum and an adjustable concave. The concave is 12 Ga sheet metal bent to fit the outer radius of the drum. The concave is then attached to the frame through a scissor‐jack which allows for the clearance between the drum and the concave to be varied. While the drum is rotating at 500‐1600 RPM the crop is put through the input where it follows between the concave and the drum where it is beaten to the point when the seeds are released from the crop. The resulting mixture of crop and seed is then shot out the back of the drum to the output, consisting of a box made of bent 16 Ga sheet metal. The bottom of the output is angled towards a hole where the resulting mixture then goes on to the next agricultural process of cleaning which will not be covered or designed for in this report. The engine efficiency experiment was used to determine which operating speed the motor should be at to maximize motor efficiency. If it is set too low the throughput of the crop will be too slow. This throughput will be proportional to the distance travelled by the outer diameter of the threshing drum. This is then proportional to the rotational speed of the motor, or shaft speed (RPM). If the motor speed is set too high then the gas used by the motor will be costly to the customer. In essence this experiment is designed to find the throttle point of the motor which maximizes throughput without sacrificing the cost of gas, which is ever rising. The loader experiment was designed to also maximize throughput of the threshing system. This was a test to find at which angle sheet metal allowed the target crops of millet, spelt and amaranth to fall down the incline of the sheet metal. Due to this the design of both the input and output were both affected by the results of this test. If the angle of incline is too low then the crops will not fall through the machine and will back up the system, slowing production and losing the customer money. If the angle of incline is too high then the input will be too high for the customer to easily place the crops onto it and the output will run into the motor due to geometric constraints. The goal of this experiment is to find the lowest angle of incline that allows for constant throughput of crops. The mechanical resonance experiment was performed to ensure that once the motor is in operation its natural frequency will not be close to the resonant frequency of the whole threshing system. Were this to happen, the energy of the motor would be transferred to the frame instead of the desired target, being the shaft. This phenomenon, known as resonance disaster would cause the frame to shake violently, loosen bolts, and potentially harm bystanders. To avoid this, the natural frequency of the system must be found to ensure that the frequency at which it oscillates, caused by the motor, will not come close to the natural frequency. If they are too close then the system must be redesigned to change the mass and geometry which in turn change the natural frequency of the system. 1.1 SHAFT-SPEED & EFFICIENCY EXPERIMENT This is a review of a machine invented by Perc C. Sorenson to determine the efficiency of an internal combustion engine. The two main functions of the machine are to instantaneously determine the revolutions per gallon and revolutions per minute. This differs from other efficiency determining methods because they involve continuous readings of multiple meters, which leads to inaccuracy especially during fluctuating operating conditions. The apparatus has two electrolytic cells that give electrical energy input that is proportional to the engine speed and to the fuel consumption. The electrical energy output is representative of the ratio of engine speed and engine fuel consumption to give efficiency in revolutions per gallon. Sorenson uses a flow‐rate meter he designed himself to find the fuel consumption per time. A predetermined time is used for the first cycle of this process and then the second cycle is averaged to give the average engine speed and average engine efficiency. The following experiment could not measure the instantaneous flow rate of the fuel. Instead, a predetermined amount of fuel was put into an empty engine and the time it took to run empty was recorded. A photo‐tachometer was used to take several readings to find an average engine speed. Figure 2: schematic of 4 stroke IC engine piston The purpose of this experiment is to test a Briggs and cycle Stratton 3.5HP ¾” shaft 4-stroke internal combustion (IC) engine. All internal combustion engines are energy converters. They convert chemical energy stored in the fuel to mechanical energy. There are two basic types of IC engines, spark ignition and compression ignition engines. A spark ignition engine will be utilized for the threshing machine and for use in this experiment. All IC engines operate on a thermodynamic cycle: The introduction of fuel or an air/fuel mixture called the charge, the compression of the induced charge, the combustion of the fuel in air towards the end of compression and during the beginning of expansion as seen in Figure 1, the expansion of the products of combustion, and the exhaust of the products of combustion. This cycle is then repeated for constant operation. IC engines operate on one of two cycles, 2-stroke or 4-stroke. In a 2-stroke engine, the thermodynamic process is completed in 2 strokes; likewise for the 4 stroke process. A 2 stroke IC engine is typically found in lawn mowers because they run at lower RPM’s. Four stroke IC engines are found in machines that require higher torque and operate at higher speeds. Figure 1 shows a schematic of a 4-stroke IC engine piston. The 4 stroke IC engine will be tested for three different data points. The first is the optimal output shaft speed for use with the power transmission. The engine will need to be running at approximately 2000 RPM’s for appropriate use with a single belt driven power transmission. Any higher shaft speed will need to utilize a gearing system to obtain an appropriate range of threshing drum speeds. The second is at what throttle position the engine is most efficient at. The third will find the output shaft speed at max throttle. All three data points will be collected under no-load conditions. The engine manufacturer provided the senior design group with torque-speed and power-speed curves. This experiment will inform the operator where to set the throttle for the best operating conditions by graphical interpretation. The speed of the threshing drum can then be changed for different crops by utilizing a step pulley, an idler pulley, a variable diameter pulley, and possibly a gearing system. This experiment will also inform the customer to not surpass a certain throttle speed for safe operation. 1.2 LOADER EXPERIMENT A relevant journal article is “Slip-stick Frictional Behavior of Wheat on Galvanized Steel” which conducts a study on the frictional characteristics between sheet metal and Wheat. The authors took sheet metal and pulled it through Wheat at a constant speed and different pressures of Wheat being pushed on the sheet metal. They found that Wheat on sheet metal exhibits a “slip-stick” behavior. This means that as the frictional force is overcome and begins motion the Wheat exhibits a tendency to slip a little bit and then stick again. This helps us because it shows that the thickness or style of sheet metal we chose does not affect the frictional characteristics of our machine. This affirms our thoughts that it is more important to worry about how vibration and angle affects the motion of the grain as opposed to worrying about the frictional characteristics. The objective of this experiment is to obtain an Figure 3: 3.5 HP Briggs & Stratton IC engine optimum angle for the loader to guarantee that the crop mounted to threshing frame effectively slides into the thresher drum, while keeping the loader height as low as possible. This is important in order to ensure the loading process is not strenuous on those manually loading the reaped crop. To run this experiment properly the vibration of the thresher, engine and belt drive is critical in finding a minimum angle. The vibration helps the reaped crop slide down to the thresher, so it follows that the more vibration, the smaller the angle needed. The complete system and prototype was not available originally so it was determined that the engine vibration, of a Briggs and Stratton 3.5Hp engine, could be measured to find its characteristic and then multiplying by a constant to simulate the system vibration which would include vibrations from the belts, thresher drum, and pulleys as well as the engine. The vibration could then be simulated with a DC motor in the larger angle test. In the interest of time a new plan was developed where the input could be clamped to the prototype frame, which was manufactured, and with the gasoline engine attached, a test could be run in which an optimal angle could be found. It is understood that the vibration will be less than would be present in normal operation of the prototype but this will produce a target angle to shoot for. It is expected that the more vibration would just help the seed and plant matter along. The engine vibration characteristic test was run before the new plan was found and therefore the results are available below. Uncertainty was expected in the data due to the human operation of a stop watch and from the human release of the wheat straw and millet that were tested. 1.3 MECHANICAL RESONANCE EXPERIMENT The experiment reviewed here was one that studied the effects of drive frequency on the high order parametric resonant oscillation of nanowire. Parametric resonance is a resonance phenomenon that arises because some parameter of the system is varying periodically in time. The nanowires studied here were carbon and BN nanotubes, B and Si nanowires, and nanowire and nanoribbon. The nanowires were set in a four probe nanomanipulation tool with 12 degrees of freedom that was put inside a field emission scanning electron microscope (SEM). A DC and DC voltage source were then connected in a circuit with the nanowire. The cantilevered wires were set into oscillation by tuning an AC signal connected to the nanowires to a driving frequency equal to the mechanical resonance frequency of the nanowire. The equation of motion for a freely suspended cantilevered beam is + = 0 Equation 1 The amplitude versus frequency response curve was created by setting the SEM line scan across the cantilevered nanowire and observing the size of the plateau. A narrow plateau is when the nanowire is essentially stationary and a broader plateau correlating to the size of the amplitude for the oscillation. The electric field Coulomb force and the Mathieu equation for a single DOF parametric resonance of a mechanical system were accounted for to make the final equation of motion and were solved for the amplitude. Drive frequencies of /n for n from 1 to 4 and being the natural resonance frequency of the system, were then tested. The SEM scan method was used to graph the drive frequency versus the amplitude and it was found that the nanowire oscillated constantly near , the fundamental frequency, with the drive of 0.453 MHz, 0.674MHz, and 1.386MHz. This is a characteristic of a parametric resonance system. This is much more complicated than the following test but it is similar in the fact that the maximum amplitude is achieved when the natural and driving frequencies are the same. Instead of a very intricate SEM and nanomanipulation system for measuring the amplitude this experiment will use an accelerometer to measure the acceleration of the structure and a hammer will be used in place of a honed AC/DC signal to induce mechanical vibration. Mechanical vibration is of great concern in buildings, bridges and machine design because mechanical systems tend to absorb more energy when the frequency of its oscillations matches the system's natural frequency of vibration (resonant frequency). Resonant failure has caused many catastrophic accidents in history. One of the most famous example is the Angers Bridge, also known as the Basse--Chaîne Bridge, was a suspension bridge over the Main River. It collapsed on April 16, 1850, when 478 French soldiers marched across it in lockstep. There was a thunderstorm that day. However, the engineering report indicated that the collapse was due to the soldiers and the corruption of the bridge rather than the storm. It may be hard to image that 478 soldiers can fracture a steel bridge, but this disaster proved that the mechanical vibration is powerful and can’t be ignored during the design process. Nowadays, various techniques to avoid resonance disasters have been developed, such as a countermeasure, shock mounts, T T pendulum as a tuned mass damper etc. Other designs attempted to make the structure resonate at a frequency that rarely occurs. The same problem applies to the thresher design since the threshing drum is driven by an internal combustion engine at about 1600 rpm. The engine and transmission system are factors that will certainly cause vibrations. Therefore, a vibration test for the frame and the engine is required to ensure the design safety. The objective of the experiment is to find out the resonance frequency of the thresher frame, hence ensure the engine vibration doesn’t fracture the thresher. An accelerometer was used to collect data and yield results as acceleration of engine/frame along X, Y, Z axis as a function of time. Later on, a fast Fourier transform (FFT) was required to convert the data into amplitude as a function of frequency. The result can be discovered by comparing the frequencies at which the vibration has the largest amplitude. T T 2.0 EXPERIMENTAL APPARATUS & PROCEDURE U 2.1 SHAFT-SPEED & EFFICIENCY EXPERIMENT The materials for this experiment are as follows: 3.5HP 4 stroke IC engine, a tachometer, tachometer paint, testing rig to mount the engine, a graduated cylinder, 1 Gallon of gasoline, SAE engine oil, and 1 stop watch. Figure 3 shows the experiments materials. Mount the engine on a secure surface before operation. Fill the engine with SAE 30 engine oil per the engine manual. Make sure the engine has been thoroughly run before testing (10 – 15 minutes). This is because the engine needs time to warm up to effective operating conditions. This experiment will provide an ideal point to run the engine at for transmission design. Run the engine dry before attempting the efficiency test. Mark five evenly spaced points on the engine throttle to test. Three points should be reserved for low, middle, and high throttle. Fill the engine with 50mL of gasoline using a graduated cylinder. Run the engine until dry at each of the five throttle points and record the time it took for the engine to stop, repeat three times for each throttle position and average the values. There will be a small amount of fuel remaining in the tank after each run; this will not affect the results because the same amount of fuel will remain in the tank after each run. Using a tachometer, record 15 shaft speed readings at all five throttle positions (refer to the tachometer user manual for operating procedures). Figure 4 shows the experimental flow chart. Figure 4: Materials 2.2 LOADER EXPERIMENT To find the engine vibration characteristics of the Briggs and Stratton 3.5 Hp internal combustion gasoline engine the engine was filled with its necessary fluids as directed by the manufacture’s recommendations and it was allowed to run for 20 minutes to allow for some engine break in. The engine was attached to brackets and weight was placed on those brackets to limit the motion of the motor. The accelerometer was secured, with tape, to the top of the engine and plugged in to its data acquisition module as shown in Figure 5. The x axis of the accelerometer was in the direction of the shaft, the y axis 90 degrees off of that and z axis was up. The vibration was recorded at three different engine shaft speeds, 2000 RPM (idle), 2400 RPM (the middle by distance) and Figure 5: Shaft speed and efficiency experiment flow 3200 RPM (maximum), for 30 seconds. As was noted chart above this data was to be used to simulate the system vibration in the test to find the best angle but the engine was just used instead. These results were used in the mechanical resonance test as well. Figure 6: Engine vibration characteristics apparatus setup Figure 7: Angle experiment setup The raw data is presented under this section because it was done originally for this experiment but the analyzed data is presented in the Mechanical resonance section. The angle test setup is found in Figure 6. The angle is made from a two foot square piece of 16 gauge steel sheet metal with walls bent up at 90. It will become the loader in the final prototype. The sheet metal is clamped to the frame so that the angle can be changed. The angle was set at every 5° from 15° to 40°. At every angle there were three trials with wheat straw then unthreshed millet and also with no vibration (engine off), then with the engine started. The straw and millet were dropped from a height of approximately 12 inches and the time was taken for how long it takes for it to slide down. The procedure is presented in Figure 7. Figure 8: Angle experiment flow chart 2.3 MECHANICAL RESONANCE EXPERIMENT The materials for this experiment are as follows: accelerometer, tape, thresher frame – engine setup, Briggs and Stratton 3.5 hp IC engine, computer data acquisition system, gasoline, hammer. The first step of the experiment was the equipment setup as shown in figure 8. The engine was securely mounted on the base of the frame and the accelerometer was taped on the frame. The accelerometer was connected to a computer data acquisition system through a USB port. The first section of the experiment was the engine vibration test. The engine was filled with 50ml of gasoline, and a test run was made to ensure the engine performance. From experiment 1 the idle speed, operating speed and maximum speed were marked on the throttle, and in this experiment, the vibration characteristics were test at these three speeds. To begin the engine vibration test, simply start the engine at one of the throttle speeds. Start the accelerometer as the engine is under operating condition. Record data for 30 seconds, and repeat the same procedure 3 times for each speed The second section of the experiment was the frame resonance test. A hammer was used to strike the frame and cause vibrations. As the vibration dampens out, the amplitudes at other frequencies would die down, leaving only one or multiple peaks at certain frequencies, which are the resonant frequencies. Note that a system can have multiple resonant frequencies. The accelerometer was started before the hammer struck the frame to ensure no vibration frequencies were missed. Stop the accelerometer after the frame become stable again. The experiment was repeated 6 times to obtain stable, average results. After finishing both of the engine test and the resonant test, the data were carried to the software Origin 8 for FFT analysis to yield plots of amplitude versus frequency. Figure 9 shows the mechanical resonance experiment flow chart. Figure 10: Mechanical resonance experimental setup Figure 9: Mechanical resonance experiment flow chart 3.0 EXPERIMENTAL RESULTS & DISCUSSION U 3.1 SHAFT-SPEED & EFFICIENCY EXPERIMENT From the manufacturer of the IC engine used in the experiments, the group was able to obtain the power-speed and torque-speed curves. Figures 10 & 11 show the engine characteristics curves from Briggs & Stratton. Figure 11: Power‐Speed characteristics of a 3.5HP IC engine In figure 11 the peak output torque is at approximately 2800 rpms. Figure 12 shows the RPM percentage and fuel economy percentage calculated using Equation 2. These two engine specifications were related to each other by first obtaining the percent difference from minimum to maximum values and then plotting them versus throttle position percentage. Table 1 shows the resulting data of this interpolation. Figure 12: Torque‐Speed characteristics of a 3.5HP IC engine Equation 2 Table 5: Throttle position, percent of throttle speed, and percent fuel economy Throttle Position 0 25 50 75 100 Percent of RPM 0.00 13.28 27.79 56.96 100.00 Percent Fuel Economy of 100 77.75226757 60.51303855 35.26360544 0 Figure 13: Fuel economy percentage and shaft speed percentage versus throttle position The intersection point of the graph in Figure 12 can be calculated by equating the equations of the best fit lines. The resultant percentages can be seen in Table 2 along with the actual values of fuel economy, throttle speed, and throttle position. These values were all calculated by Equation 2. Table 6: Intersection point data Intersection Point Parameter Percentage Actual Value Percent FE 44.80% 525.5 Percent 44.80% 2597.16 Throttle 64.30% 64.30% RPM Position 3.2 LOADER EXPERIMENT The results of the engine vibration characteristic test for engine shaft speed of about 3200 rpm are presented in Figure 13. Note that this is all the raw data and it is presented here because these characteristics were important to this experiment before the plan changed. The maximum values in the x direction are 32.4 m/s2, 39.3 m/s2 along the y axis and the 28.8 m/s2 in the z direction. P P P P P P Figure 14: Engine vibration characteristics at 3200 rpm For the engine at half throttle or about 2400 rpm the result of the vibration test are presented in Figure 14 with maximum values of 17.7 m/s2 in the x direction, 18.0 m/s2 in the y direction and the 18.3 m/s2 in the z direction. P P P P P P Figure 15: Engine vibration characteristics at approximately 2400 rpm The results of the engine vibration test are presented in Figure 15 for an angular velocity of the engine of 2000 rpm. The maximum value along the x axis is 12.1 m/s2, 6.7 m/s2 in the y direction and the 3.9 m/s2 in the z direction. P P P P P P Figure 16: Engine vibration characteristics at 2000 rpm The results from the angle test are shown in Figure 16 for millet. The cases with vibration are typically faster that those no vibration. It should be noted that for one of the three cases for no vibration at 15° that the millet never made it down the loader input. After 30° the graph essentially is flat and only goes up slightly because of the uncertainty and error associated with human starting and stopping a stopwatch. The differences are in time for those higher angle is less that a 0.25 of a second. Figure 17: Angle test using millet Figure 17 presents the time to slide down the loader versus the angle of the loader when testing wheat straw. Take note that straw takes longer than the millet to slide down the loader for the same angles and that when there is no vibration, at 15° the straw never makes it down the loader and one of the three cases at 20° it also fails to make it. Figure 18: Angle test results for straw 3.3 MECHANICAL RESONANCE EXPERIMENT In the first section of this lab, an accelerator was used to monitor the vibration of the engine along 3 directions X, Y, Z, and X is along the axial line of the engine shaft, Z is the vertical direction, and Y is orthogonal to both X and Z. The data generated by the computer data acquisition system were acceleration and time. The FFT analysis function from Origin 8 was applied to transform the acceleration data to amplitude vs. frequency plots. Figure 18 through figure 20 presented the amplitude as functions of frequency at 3 different throttle speeds: maximum, idle, and operating speed, respectively. Figure 18 shows the amplitude-frequency plot at maximum throttle speed. The black line shows the vibration along X direction, the blue line is vibration along Y direction, and the red line represents the vibration along Z direction. As indicated on the graph, amplitude peaks are located at 3 regions: 5 – 7.25 Hz, 12-15 Hz, and 22.5 Hz. The raw data was much noisier than what was presented in the report. The plot was smoothed by averaging the adjacent 3 data points without decreasing the amplitude by more than 5%. Figure 19 shows the amplitude-frequency plot at idle speed. As shown on the graph, there is only one peak amplitude locating at 22.5 Hz. Figure 20 represent the amplitude-frequency plot at operating speed, and there are two amplitude peaks locating at 7 Hz and 12-14 Hz. In the second section of the lab, which was the resonance test of the frame, the collected data was plotted in figure 21. The single outstanding peak appeared at 20 Hz, which can be considered as the resonant frequency. Figure 19 Figure 20 Figure 21 Figure 22 4.0 CONCLUSIONS U 4.1 SHAFT-SPEED & EFFICIENCY EXPERIMENT The optimal throttle position to run the engine for the threshing transmission was found to be the intersection point of Figure 12. The throttle should be set to 64.3% open which correlates to 2597.16 rpm. The Torque-Speed curve of the engine backs up this experimental result because the peak torque is at approximately 2800 rpm. This intersection point allows the operator to still have a high amount of torque and still have a reasonable amount of fuel efficiency. 4.2 LOADER EXPERIMENT The best angle to set the loader was determined to be at 30° from the horizontal. At that angle it is steep enough so that crops will not get stuck on the loader even in a no vibration condition. There is little advantage to going steeper than this angle, the time it takes for the crop to slide down the input is a minimal difference though. 4.3 MECHANICAL RESONANCE EXPERIMENT Table 1 is the frequency comparison of all the vibration graphs. The resonance frequency is 20 Hz, which doesn’t overlap with the peak frequencies in the operation speed (7 Hz and 12-14 Hz). It indicates that, so far, the frame is safe during operation. However, the resonance frequency is very close to the highest peak frequencies at idle speed and the maximum speed of the engine. Precautions need to be taken at these speeds even though the engine will not be operating at such throttle position. Moreover, future tests are required to complete the thresher design since the frame geometry is going to change after adding the drum, loader, concave and the output. The natural frequency of the system is going to change accordingly, so another comparison is very crucial. These tests will be performed in spring quarter before the thresher can be delivered to the customer. Table 3 shows all of the frequency values found for ease of comparison of numbers. Table 3: Frequency Values Resonance Frequency Operating Speed Idle Speed Max. Speed Peak 1 20 Peak Frequency (Hz) Peak 2 - Peak 3 - 7 12-14 - 22.5 22.5 12-15 5-7.25 5.0 STATISTICAL ANALYSIS U 5.1 SHAFT-SPEED & EFFICIENCY EXPERIMENT In order to verify the results of the engine test, engine efficiency must be defined. For this experiment, and as in industry, engine efficiency is defined as revolutions per gallon. The data taken was revolutions per minute and seconds per gallon. Including the fact that 1 minute equals 60 seconds, Equation 3 will be found. x x = Equation 3 Since revolutions per minute (RPM) and fuel consumption (F) are both functions of the throttle position(x), it can be said that the efficiency (E) is a function of throttle position. = Equation 4 Using the equations found from extrapolating the data in Excel the equations for RPM and fuel consumption are as follows. + + 1.4687 Equation 5 Equation 6 The maximum efficiency can be found by find which throttle position it wakes to make the derivative of equation 4 equal to zero. Substituting equations 5 and 6 into equation 4, and then setting its derivative to zero gives Equation 7. Equation 7 Solving for gives , which is what was found in our analysis. 5.2 LOADER EXPERIMENT In the input loader experiment there were a few causes for error. The first cause was the few trials that either took a very long time, or stopped on the loader. These few data points were thrown out for a few reason. First they happened on angles that were not near the final chosen angle and second there are statistical outliers. It is important to note that from 30° to over 30° the difference in times is down to a fraction of a second. It is probable that there is error in this data because these differences in times are reliant on human reaction because a stop watched was used. This is especially evident in the millet results where at the steeper angles the times seem to get a little longer. 5.3 MECHANICAL RESONANCE EXPERIMENT In the mechanical resonance test two tests were performed. The first found the operating frequency of the motor at several different throttle positions and the second found the resonance frequency of the frame with motor. In both tests the accelerometer is mounted with masking tape, to the engine, in the first test, and to the frame in the second test. During the vibration it is likely that the accelerometer could have moved, even slightly. During the test the apparatus was not bolted down, rather they were just placed on the ground. The tests were consistent however some uncertainty could be attributed to this set up. The accelerometer used in the experiment was a Vernier 3-axis accelerometer model 3D-BTA. The accelerometer is rated to an accuracy of +/-0.5 m/s2 or +/- 0.05g. While there may be some uncertainly is associated with the measuring device and it is recognized that it is not completely accurate this uncertainty is very small. 6.0 REFERENCES U Works Cited 0B 1. Mechanical Engineering Systems Laboratory. Performance Characteristics of an Internal Combustion Engine. [Online] Middle East Technical University. [Cited: March 3, 2010.] www.me.metu.edu.tr/courses/me410/exp4/Me410_Exp4.pdf. 2. Slip‐Stick Frictional Behavior of Wheat on Galvanized Steel. Bucklin, R A, et al. 2, s.l. : ASABE, 1996, Vol. 39. 3. Sorenson, Perc C. Engine Efficiency Determining Apparatus. 3812711 Milwaukee, Wisconsin, May 28, 1974. 4. High Order Parametric Resonance & Nonlinear Mechanics of Nanowires. Yu, Min‐Feng and Wagner, Gregory J. Urbana : NSTI, 2003, Vol. 3. 0‐9728422‐2‐5. Captain Plant It! Senior Design Summary 7.0 APPENDIX U Throttle Position (RPM) 0 25 50 75 100 2105 2215 2432 2737 3224 2095 2267 2371 2793 3207 2075 2090 2123 2037 2023 2076 1990 1992 1991 1956 1991 1996 2064 2206 2118 2260 2143 2245 2140 2119 2117 2312 2234 2235 2285 2185 2441 2419 2318 2341 2332 2510 2330 2365 2348 2360 2380 2452 2387 2525 2824 2793 2594 2770 2771 2832 2796 2746 2700 2837 2790 2716 3236 3285 3264 3288 3276 3279 3234 3300 3315 3298 3369 3364 3311 2040.27 2205.40 2385.73 2748.27 3283.33 Time for 50mL of fuel to run out (Minutes) Throttle Positon(%) 1 2 3 Avg Eff = t/g (Min/gal) 0 25 10.57 8.10 8.42 8.83 9.55 8.50 9.51 8.48 720.24 641.75 50 7.37 9.55 6.10 7.67 580.93 75 5.37 6.40 7.72 6.50 491.85 100 5.45 4.08 5.03 4.85 367.44 Intersection Point Percent FE Percent RPM 64.30% 44.80% 594.29 2597.16 Captain Plant It! Senior Design Summary WHO DID WHAT? Tianjiao 1.3: Mechanical Resonance Experiment 2.3: Mechanical Resonance Experiment 3.3: Mechanical Resonance Experiment 4.3: Mechanical Resonance Experiment engine efficiency and mechaincal resonance experiments Bryan: Section Section Section Section Help run Section 1.1: Shaft Speed & Efficiency Experiment Section 2.1: Shaft Speed & Efficiency Experiment Section 3.1: Shaft Speed & Efficiency Experiment Section 4.1: Shaft Speed & Efficiency Experiment Compliled Rough Draft and Final Report Helped run loader and efficiency experiments Evan: Section 1.2: Loader Experiment Section 2.2: Loader Experiment Section 3.2: Loader Experiment Section 4.2: Loader Experiment Section 5.2: Statisical analysis for the loader experiment (2nd half) P P Section 5.3: Statisical analysis for the Mechanical Resonance experiment Helped run loader and efficiency experiments Who did what Mike: Introductio n Captain Plant It! Senior Design Summary Literary reviews for engine and mechanical resonace test Section 5.1: Statistical analysis for engine experiment Help run loader, engine efficiency and mechaincal resonance experiments Built experiemental apperatus Steve: Astract Literary review for loader Built experimental apperatus Final Proof read and compilation of report Helped run loader experiment Section 5.2: Statisical analysis for the loader experiment (1st half) P Got report page numbers to be correct 8.4 FIGURES, TABLES & VIDEO P Captain Plant It! Senior Design Summary Figure 8.1: Concave Threshing Drum Assembly Figure 8.2: Threshing Drum Captain Plant It! Senior Design Summary Figure 8.3: Collar‐Shear Pin Figure 8.4: Engineering Drawing of the Shaft Figure 8.5: Engineering Drawing of the Wheel Captain Plant It! Senior Design Summary Figure 8.6: Frame Figure 8.7: Captain Plant It Thresher Captain Plant It! Senior Design Summary Table 8.1 Section 1 Section 2 Section 3 Section 4 Section 5 Total Process Frame Concave Thresher Drum Overall Assembly ‐ Total Time Sheet Metal Work 10 Hrs 8 Hrs 7 Hrs 14.5 Hrs 7 Hrs 39.5 Hrs Materials Cost $50 $73.55 $305.16 $67.26 $258.55 $754.52 Total Cost $369.50 $348.05 $537.69 $583.26 $468.55 $2307.05 Table 8.2 Metric Units Design Value Prototype Value Portability - - - Off-road-ability (used in fields) Road worthy - Yes - Legal Size ft 3w x 4l x 4h Weather Resistance - - Depends on trailer it is on Depends on trailer it is on 2.04w x 4.42l x 3.46h √ Weight lb 400 ~200 Clean Grain output % 95 TBD Flexible - - - - Yes √ Process change capable Energy Source - Yes √ - Yes √ User Friendly - - - Auto Loading - Yes NO Continuous process - Yes TBD Bu/hr 25 TBD Muilti -crop capable Suggested Output Captain Plant It! Senior Design Summary Maintainable - Yes √ Reliable - Yes TBD Power hp 1-5 3.5 Material Cost $ <2500 2307.05 Video 8.1: Concave animation (double click to activate) Captain Plant It! Senior Design Summary Video 8.2: Thresher Video (double click to activate) Captain Plant It! Senior Design Summary Bibliography 1B 1. Appalachian Region . Appalacian Regional Commission. [Online] http://www.arc.gov/index.do?nodeId=2. 2. County Economic Status in Appalachia, Fiscal Year 2010. Appalachian Regional Commission. [Online] October 2009. http://www.arc.gov/index.do?nodeId=3358. 3. Bosserman, Steve. Economics of a Local Food System. Local Food Systems. [Online] August 5, 2009. http://localfoodsystems.org/economics‐local‐food‐system. 4. [Online] Basant Products India. [Cited: May 25, 2010.] http://www.vidhataindia.com/. 5. McLeod. Patent Number 5,794,423 United States of America, 1998. 6. Allis‐Chalmers Mfg. Co.Tractor Division. Operating instructions and repair parts illustrations "66" All Crop Harvester "B" Series. Milwaukee, Wisconsin : s.n. Serial B‐30601 and up. 7. Powell. Patent Number 4,209,024 United States of America, 1980.


![DGID Software [EN]](http://vs1.manualzilla.com/store/data/005717670_1-65b44a14cec330296683d17d94da3fca-150x150.png)