1
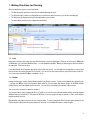
NIELSEN OUTDOOR PLANNER
USER MANUAL
TABLE OF CONTENTS
Making Selections for Planning
Page 2
Plans: Types, Opening, Removing fro Recent List
Page 2
Markets: Selecting, Removing
Page 2
Targets: Selecting, Removing
Page 3
Formats/Vendors: Selecting, Removing, Setting Defaults
Page 3
Selections Grid
Page 3
Variable Definitions
Page 3
Sorting, Grouping Information
Page 3
Including/Excluding, Reordering Variables
Page 3
Printing/Exporting Selections Information
Page 3
Planning
Page 4
Preferences
Page 4
Planning Grid
Page 4
Allocation Rules
Page 4
Market Summary View
Page 4-5
Entering or Overriding Plan Information
Page 4
Seeing Results for Different Targets
Page 4
Seeing Results for Different Base Populations
Page 5
Inventory Detail View
Page 5
Entering or Overriding Plan Information
Page 5
Seeing Results for Different Targets
Page 5
Seeing Results for Different Base Populations
Page 5
Planning on Different Targets
Page 5
Spill
Page 5
Printing, Exporting to Excel or Nielsen Mediamix
Page 6
Saving Plan Files
Page 6
Performance View
Page 6
Populations View
Page 6
Export to Mediamix
Page 6-7
Help
Page 7
1
1. Making Selections for Planning
When the application opens you see 4 main areas:
•
The Resources pane provides access to lists of available planning resources
•
The Selections pane is where you drag and drop your selections from the Resources (you can also them drag off)
•
The Selections grid displays some basic information about your selections
•
The menu ribbon provides access to application functionality.
1.1. Plans
Before any selections can be made you must start a new plan or open an existing plan. Plans can be of two types: DMA plans
or CBSA plans (i.e. Core-Based Statistical Area – i.e. metropolitan/micropolitan). Markets of different types cannot be mixed in
the same plan. Click your selection.
If you have already saved any plans they will be listed in this area as well. You can right-click existing plans to remove them
from the list and even delete the plan files if you wish. You can click on any of these plans to open them directly from the list.,
or you can use the standard File/Open commands to do so.
1.2. Markets
Having selected a type of plan, click the Markets header in the Resources pane. You will see that markets are grouped in sets
– e.g. New York DMA is listed in the Population Rank under Top 10, in the North East Census Region, in the Middle Atlantic
Census Division, and in the Alphabetical set under N. You can select your market(s) through any of these groups.
You can click on a set name to expand or collapse it.
You can select whole sets by dragging its title (e.g, Top10) or you can select any individual markets within a set using standard
Windows multi-select methods (i.e. hold down the Shift key to select a contiguous range of markets, or Ctrl to select multiple
markets anywhere in the list.
Drag and drop your market selections onto the Selections pane. To remove, drag them off the Selections pane and back to the
Resources pane. When finished selecting markets for your plan, click the Markets header to collapse it again.
2
1.3. Targets
Targets are grouped in sets as well. E.g. click Age groups to see the targets that are available in this set. Click on any of the
age-groups and you will see that it opens to provide separate access to Males and Females. Drag your selections to the
Selections pane. To remove targets, drag them off the Selections pane and back to the Resources pane. You cannot remove
the 18+ target. When finished selecting targets for your plan, click the Targets header to collapse it again.
1.4. Formats and Vendors
The functionality for selecting formats and vendors for a plan is different from markets and targets. All formats and vendors that
are available in the markets you select are automatically listed in the Selections pane, so you don’t need to make any detailed
format/vendor selections if you don’t wish to. However, to work with fewer ‘candidate’ inventories, expand the Formats/Vendors
lists in the Selections pane and do one of the following:
•
Drag items off the Selections pane
•
Multi-select the ones to be removed, right-click to get the pop-up menu, and click Remove
•
Multi-select the ones to be kept, right-click to get the pop-up menu, and click Remove all except highlighted
•
Define a default list of Format and Vendors (see Preferences section) – i.e. if you want to see only a sub-set of formats
and/or vendors listed in the Resources and Selections panes, you can define them as Preferences.
1.5. Selections Grid
Format/vendor selections as detailed above don’t necessarily have to flow through into your plan. You can also click off the
checkboxes beside them in the Selections grid.
An ‘inventory’ is a particular format available from a particular vendor in a market. The Selections grid provides some basic
information about inventories available in your selected markets:
•
Audience Share is calculated by multiplying each inventory’s average weekly impressions by its actual inventory (i.e.
number of panels) to get its maximum potential weekly audience delivery. Those results are then summed for all
inventories for that market in the Selections pane, and each individual total is divided into that total for a percent share.
•
Inventory Share is calculated by dividing the number of panels in each inventory into the sum of total panels across all
inventories in the Selections pane for that market
•
Average Weekly Impressions is the Eyes-On audience delivered by the average panel in an inventory
•
In-Market is the percentage of audience that lives in the market where the inventory is located
•
Spill is the percentage of audience that lives outside the market where the inventory is located.
You can sort inventories on any one or more columns. Click once on a column header to sort ascending. Click again to sort
descending. Click a third time to revert to original order.
To sort on more than one column at the same time, sort on the most important column first – then hold down the Shift key while
sorting on the next column.
Entries in the Selections grid also can be grouped and sub-grouped. By default the grid is grouped by Market, but you can drag
other column headers (e.g. Vendor, Format) to the grouping area. Click the X in its header to remove a group.
The columns that are visible in the Selections grid can be changed by right-clicking any column header to get the Column
Chooser. Check or uncheck the variables that you want or don’t want.
You can drag columns into a different order.
The Selections grid can be printed or exported – see the Print and Export buttons in the menu ribbon.
3
2. Planning
2.1. Preferences
Click the Preferences button on the menu ribbon if you wish to set preferences. This will affect what happens when you launch
Nielsen Outdoor Planner, as follows:
•
Vendors that you select here will be the only vendors shown in the Resources and Selections panes; if you do not make
any selections here then all vendors will be shown (accordingly, clicking preferences off restores all vendors)
•
Formats that you select here will be the only formats shown
•
Weekly GRP is the default planning goal; when you move from the Selections grid to the Planning grid, a plan will be
generated automatically with this GRP weight in every market you selected
•
Weeks is the default planning duration
•
Effective Frequency defines the minimum frequency needed for a plan to be considered effective, and is reflected in the
Effective Reach column of the Planning grid
•
Decimal Places allow you to specify how many decimal places should be displayed in % results.
2.2. Planning Grid
Click the Planning tab to move to the Planning grid. The Planning tab sits between the Selections and Performance tabs.
When you go to the Planning grid, Nielsen Outdoor Planner automatically generates a plan based on the default Weekly GRP
and also the default Allocation rule.
2.3. Allocation Rules
The built-in default allocation rule is Proportional to Audience. Panels will be allocated to different inventories in such a way
that their shares of GRP are as close as possible to their Audience Shares in the market (defined under Selections Grid).
Alternative allocation rules can be used by clicking the Allocation Rules button and changing it for the current analysis.
•
Equal Allocations means the same GRP will be allocated to each selected inventory
•
Largest Audience means all GRP’s will be allocated to the inventory with the largest Audience Share
•
Largest Inventory means all GRP’s will be allocated to the inventory with the greatest number of panels
•
Proportional to Audience (default)
•
Proportional to Inventory means that panels are allocated in proportion to panels potentially available.
2.4. Market Summary View
The Planning grid provides a number of different views of the data. Market Summary view presents results for each market o
its own line, and an overall average on the summary row at the bottom of the grid.
You can edit cells in columns that do not have a gray background; i.e., change the number of Panels, Weeks, Weekly Target
GRP, Total Target GRP or Reach, and Nielsen Outdoor Planner will adjust all other results accordingly.
If you enter a value in one cell and click Apply to all, the same value will be applied to all other cells in the same column.
If you have selected multiple targets, the results currently displayed are for the target selected in the Target drop-down list in
the menu ribbon. Click this drop-down to switch to a different target that you selected.
4
Percentages displayed in the Planning grid can be on different bases. This is controlled by the % Base options in the menu
ribbon which provides the following options:
•
Home Market means that the results for each market are based on the target population of that market
•
Sum of Markets means that all percentages are based on the sum of the target populations across selected markets
•
National means percentages are based on the national target population.
With the default Home Market option, the summary row at the bottom of the grid shows the average market. These are
weighted averages – i.e. a market that is twice the size of another has twice the influence upon the average.
2.5. Inventory Detail View
Inventory Detail view provides access to a market in greater detail – i.e. allocations to individual inventories you selected for
possible use in that market. The currently selected market is shown in the Market drop-down list in the menu ribbon.
The summary row at the bottom of the grid corresponds with the results you see for that market in Market Summary view.
Changes to the plan can be made in any of the editable fields, such as Panels, Weeks, Weekly Target GRP, Total Target GRP
or Reach. Unlike Market Summary view, Inventory Detail view makes Estimated Cost an editable field – i.e. you can over-ride
the system’s cost estimate for any inventory.
When you select a market in Inventory Detail view, sometimes you will see details of inventories located in other markets. This
happens when there is ‘spill’.
If you have selected multiple targets, the results currently displayed are for the target selected in the Target drop-down list in
the menu ribbon. Click this drop-down to switch to a different target that you selected.
2.6. Planning on Different Targets
An initial plan is automatically generated on the default 18+ target when you switch from the Selections tab to the Planning
tab, based on the Weekly GRP Goal set in your Preferences tab. If you wish to plan on a target other than 18+, you must first
switch to the desired planning target via the drop-down box in the Planning tab. Once that is done you can either:
•
Enter your input manually for each market based on this planning target (e.g., enter your Weekly GRP’s for P18-49)
•
Click on the Allocation Rules ribbon item, set your Weekly GRP Goal in this screen if it is different than what is
already displayed, then click OK. At this point a new plan will be calculated for all markets, based on your new
planning target and the Weekly GRP Goal.
You can plan on any selected target at either the Market Summary or the Inventory Detail level. It is the user’s responsibility
to know which target was used as the primary planning target.
2.7. Spill
Spill is audience that is reached in a market outside of an inventory’s home market. E.g. if some panels located in the New
York DMA are seen by people who live in Philadelphia then when you select Philadelphia as the market to be displayed you will
see some New York inventories included.
The Inventory Detail view displays the “spill” market names, as well as the number and type of panels that represent that “spill”.
It will display the cost associated with the “spill” panels, but they are for information purposes only. They are grayed out to
indicate that they are not part of the home market’s cost.
All plan results include “spill” contribution. The more markets selected that have “spill” into your home market, the greater the
impact on your home market results.
5
2.8. Printing/Exporting
The results displayed in any view can be printed or exported to Excel. The results displayed in either the Market Summary or
Inventory Detail view can also be exported to Nielsen Media Mix.
2.9. Saving Plan Files
To save a plan, go to Save on the menu ribbon, click the down arrow, and select Save As. Plan files contain all your selections
and entries. Reach/frequency calculations are re-run when you next open a saved plan.
A place-holder file name of Plan 1, Plan 2, etc. will appear at the top of your plan, but is not saved with the plan upon exiting.
The system will prompt you to save before exiting.
3. Performance View
This view is selected by clicking the Performance tab. It is available only when you are in the Market Summary planning view,
as it is intended primarily for market-by-market performance comparison. It displays results for the metric you select from the
Plot drop-down list in the menu ribbon.
The % Base and Target that you select in Market Summary view affects the % values displayed.
4. Populations View
The purpose of the Populations view is to enable you to see latest population estimates for your selected targets and markets.
5. Export to Mediamix
Your plan results can be exported for use in Nielsen Mediamix, directly from the Planning tab. This enables you to mix your
Outdoor plan results with other media results in the same geography to create a total campaign result.
Before creating a Mediamix file, make sure that your onscreen display reflects the target and % of Base result that you wish to
export.
To create an export file for Mediamix, click on the Export ribbon drop-down menu, and select Mediamix. Files are saved with a
*.MIX file extension.
If you export from the Home Market % of Base, it will save one *.MIX file for each of your planned markets. These marketbased files can be mixed with any other media files from the same geography. That is, if Chicago is one of your exported
Outdoor files, you should mix that file with other Chicago based media results.
If you export from the Sum of Markets % of Base, it will save one *.MIX file, which represents the results for the total
geography across all selected markets (e.g., Midwest). This file should be mixed with other media results that were run on
the same geography.
If you export from the National % of Base, it will save one *.MIX file, which represents the nationalize results across your
planned markets. This file should be mixed with other media results that were run on the Total U.S. (national).
If you have not saved your Outdoor plan to a file name or location, you can browse to the location you wish to save your *.MIX
files to. The naming convention for the *.MIX files will be Plan#, Market Name, Date, and Time (e.g., Plan 1_New York,
NY_2011-02-03_11-30-53.MIX).
6
If you have saved your Outdoor plan to a file name and location, your *.MIX files will be saved to the same location. The
naming convention for the *.MIX files will be Plan File Name, Market Name, Date, and Time (e.g., Brand A Q3_Los Angeles,
CA_2011-02-03_09-24-48.MIX).
To import these saved Mediamix market files, go to Mediamix and click File/Import Schedules – then browse for the market
save file you need.
6. Help
The down arrow under Help provides access to Nielsen Outdoor Planner Help and About Nielsen Outdoor Planner. Nielsen
Outdoor Planner Help provides access to a number of downloadable user guides. About Nielsen Outdoor Planner shows the
application version number.
7