1
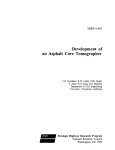
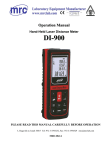
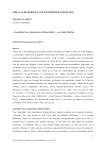
980 Bird et al.: Journal of AOAC International Vol. 98, No. 4, 2015
MICROBIOLOGICAL METHODS
Evaluation of 3M™ Molecular Detection Assay (MDA)
Listeria monocytogenes for the Detection of Listeria
monocytogenes in Selected Foods and Environmental
Surfaces: Collaborative Study, First Action 2014.07
Patrick Bird, Jonathan Flannery, Erin Crowley, James Agin, and David Goins
Q Laboratories, Inc., 1400 Harrison Ave, Cincinnati, OH 45214
Lisa Monteroso1 and DeAnn Benesh
3M Food Safety Department, 3M Center – Bldg 260-6B-01, St. Paul, MN 55144
Collaborators: B. Bastin, J. Blumfield, B. Brahmanda, A. Brandt, R. Brooks, R. Brooks, L. Cerda, C. Chavarria, Y. Chen,
N. Cuthbert, R. Dermer, P. Fatemi, A. Hankins, L. Hardrath, B. Kupski, A. Laasri, C. Lopez, B. Mailloux, A. Morris, J. Picket,
K. Powers, J. Schoeni, N. Shipley, S. Spencer, A. Sweet, A. Thielen, L. Thompson, J. Williams, D. Wood
The 3M™ Molecular Detection Assay (MDA)
Listeria monocytogenes combines isothermal
amplification and bioluminescence to detect
Listeria monocytogenes with high specificity
and efficiency in select foods and environmental
samples. The 3M MDA Listeria monocytogenes
method was evaluated using an unpaired
study design in a multilaboratory collaborative
study to the U.S. Department of Agriculture,
Food Safety and Inspection Service Microbiology
Laboratory Guidebook 8.09 (2011) Isolation and
Identification of Listeria monocytogenes from Red
Meat, Poultry, and Egg Products and Environmental
Samples for deli turkey, and the AOAC Official
Method of AnalysisSM 993.12 Listeria monocytogenes
in Milk and Dairy Products for full-fat (4% milk
fat) cottage cheese following the current AOAC
guidelines. A total of 16 laboratories located in the
continental United States and Canada participated
in this collaborative study. For deli turkey, 125 g
test portions were evaluated using heat-stressed
cells by each method. For full-fat cottage cheese,
25 g test portions were evaluated using nonheatstressed cells. Each matrix had three inoculation
levels: an uninoculated control level (0 CFU/test
portion), and two levels artificially contaminated
with L. monocytogenes, a low inoculum
level (0.2–2 CFU/test portion) and a high inoculum
level (2–5 CFU/test portion). In total, 1584 unpaired
Received February 2, 2015.
The method was approved by the Expert Review Panel for
Microbiology for Food and Environmental Surfaces.
The Expert Review Panel for Microbiology for Food and
Environmental Surfaces invites method users to provide feedback on
the First Action methods. Feedback from method users will help verify
that the methods are fit for purpose and are critical to gaining global
recognition and acceptance of the methods. Comments can be sent
directly to the corresponding author or [email protected].
Supplemental Tables and Figures are available on the J. AOAC Int.
website, http://aoac.publisher.ingentaconnect.com/content/aoac/jaoac
1
Corresponding author’s e-mail: [email protected]
DOI: 10.5740/jaoacint.15-031
replicate samples were analyzed. Statistical analysis
was conducted according to the probability of
detection (POD) model. Results obtained for the
low inoculum level full-fat cottage cheese test
portions produced a difference in cross-laboratory
POD (dLPOD) value of –0.08 with a 95% confidence
interval (CI) of (–0.20, 0.05). For the low-level deli
turkey test portions, a dLPOD value of –0.02 with a
95% CI of (–0.14, 0.11) was obtained.
L
isteria monocytogenes, a Gram-positive rod shaped
facultative bacterium, infects roughly 1600 persons
annually (1, 2). On average, infections caused by
L. monocytogenes result in 255 deaths in the United States
annually, producing one of the highest mortality rates for a
foodborne pathogen (2). With its ability to survive and grow
in various harsh environments, including propagation at
temperatures lower than 1°C, L. monocytogenes continues to be
a nuisance to the food industry (2).
The 3M™ Molecular Detection Assay (MDA) Listeria
monocytogenes method allows for the rapid and specific
detection of L. monocytogenes in food and environmental
samples after 24 h of enrichment using prewarmed (37 ± 1°C)
Demi-Fraser (DF) broth base [without ferric ammonium citrate
(FAC)]. After enrichment, samples are evaluated using the 3M
MDA Listeria monocytogenes on the 3M Molecular Detection
System. Presumptive positive results are reported in real-time,
while negative results are displayed after completion of the
assay (75 min).
Prior to the collaborative study, the 3M MDA Listeria
monocytogenes method was certified as an AOAC Performance
Tested MethodSM (PTM) following the AOAC guidelines for
harmonized PTM studies (3). The goal of the PTM study was
to demonstrate that the 3M MDA Listeria monocytogenes
method could detect L. monocytogenes in selected foods and
environmental surfaces as claimed by the manufacturer. For the
3M MDA Listeria monocytogenes evaluation, there were eight
food matrixes and two environmental surfaces analyzed: beef
hot dogs (25 g and 125 g), deli turkey (25 g and 125 g), cold
smoked salmon (25 g), full-fat cottage cheese (25 g), chocolate
Bird et al.: Journal of AOAC International Vol. 98, No. 4, 2015 981
milk (25 g), bagged raw spinach (25 g), romaine lettuce (25 g),
cantaloupe (whole melon), sealed concrete (sponge in 100 mL
and 225 mL), and stainless steel (sponge in 225 mL) using DF
broth base without FAC and, where applicable, a secondary
enrichment in Fraser broth (FB) base without FAC. All other
PTM parameters (inclusivity, exclusivity, ruggedness, stability,
and lot-to-lot variability) tested in the PTM studies satisfied the
performance requirements for PTM approval. The method was
awarded PTM certification No. 051401 on May 23, 2014.
The aim of this collaborative study was to compare the
reproducibility of the 3M MDA Listeria monocytogenes
method to the U.S. Department of Agriculture (USDA)-Food
Safety and Inspection Service (FSIS) Microbiology Laboratory
Guidebook (MLG) 8.09 Isolation and Identification of Listeria
monocytogenes from Red Meat, Poultry, and Egg Products and
Environmental Samples (4) for deli turkey and the AOAC Official
Method of Analysis (OMA) 993.12 Listeria monocytogenes in
Milk and Dairy Products (5) reference method for full-fat (4%
milk fat) cottage cheese.
Collaborative Study
Study Design
In this collaborative study, two matrixes, deli turkey (125 g)
and full-fat cottage cheese (25 g), were evaluated. The matrixes
were obtained from a local retailer and screened for the absence
of L. monocytogenes by the appropriate reference methods prior
to analysis. The deli turkey was artificially contaminated with
heat stressed cells of L. monocytogenes American Type Culture
Collection (ATCC, Manassas, VA) 13932 and the full-fat
cottage cheese with nonheat-stressed cells of L. monocytogenes
ATCC 19114. There were two inoculation levels for each matrix:
a high inoculation level of approximately 2–5 CFU/test portion
and a low inoculation level of approximately 0.2–2 CFU/test
portion. A set of uninoculated control test portions was also
included for each matrix at 0 CFU/test portion for a total of
three contamination levels per method.
Twelve replicate samples from each of the three contamination
levels were analyzed. Two sets of samples (72 total) were
sent to each laboratory for analysis by 3M MDA Listeria
monocytogenes and either the USDA/FSIS MLG (deli turkey) or
AOAC 993.12 (full-fat cottage cheese) reference method due to
different sample enrichment procedures between the candidate
method and the reference methods. Additionally, collaborators
were sent a 30 g test portion and instructed to conduct a total
aerobic plate count using 3M™ Petrifilm Aerobic Count Plate
(AOAC OMA 990.12; 6) on the day samples were received for
the purpose of determining the total aerobic microbial load.
A detailed collaborative study packet outlining all necessary
information related to the study, including media preparation,
test portion preparation, and documentation of results, was
sent to each collaborating laboratory prior to the initiation
of the study. A conference call was conducted to discuss the
collaborative study packet and answer any questions from the
participating laboratories.
Preparation of Inocula and Test Portions
The L. monocytogenes cultures used in this evaluation
were propagated in 10 mL of Brain Heart Infusion broth from
a Q Laboratories frozen stock culture held at –70°C. Each
organism was incubated for 18 ± 0.5 h at 35 ± 1°C. Prior to
inoculation, the culture suspension for the deli turkey was
heat-stressed at 50 ± 1°C in a water bath for 10 ± 0.5 min to
obtain a percent injury of 50–80% as determined by plating
onto selective modified Oxford agar (MOX) and nonselective
Tryptic Soy Agar with yeast extract (TSA/ye). The degree of
injury was estimated as:
n select
(1 −
) x100
n nonselect
where nselect = number of colonies on selective agar and
nnonselect = number of colonies on nonselective agar. Appropriate
dilutions of each culture were prepared in Butterfields’
Phosphate Diluent based on previously established growth
curves for both low and high inoculation levels. Bulk portions
of each matrix were inoculated with the diluted liquid inoculum
and hand-mixed thoroughly to ensure an even distribution
of microorganisms. The inoculated full-fat cottage cheese
was divided into separate 30 g portions packaged in sterile
Whirl-pak® bags and shipped to the collaborators. For the
analysis of the deli turkey, 25 g of inoculated test product was
mixed with 100 g of uninoculated test product to prepare 125 g
test portions which were packaged in sterile Whirl-pak bags.
To determine the level of L. monocytogenes in the matrixes,
a five-tube most probable number (MPN) was conducted by the
coordinating laboratory on the day of initiation of analysis using
the USDA/FSIS MLG 8.09 reference method for deli turkey
or the AOAC 993.12 for the full-fat cottage cheese. For deli
turkey, the MPN of the high and low inoculated levels was
determined by analyzing 5 × 250 g test portions, the reference
method test portions from the collaborating laboratories, and
5 × 60 g test portions by the USDA/FSIS MLG 8.09 reference
method. For the full-fat cottage cheese, the MPN of the high
and low inoculated levels was determined by analyzing
5 × 50 g test portions, the reference method test portions from
the collaborating laboratories, and 5 × 10 g test portions by the
AOAC 993.12 reference method. Each test portion was enriched
at a 1:10 dilution and evaluated following the appropriate
reference method. The MPN and 95% confidence intervals
were calculated using the LCF MPN Calculator, Version 1.6,
provided by AOAC Research Institute (7). Confirmation of the
samples was conducted according to the USDA/FSIS MLG
8.09 or the AOAC 993.12 reference method, depending on the
matrix.
Test Portion Distribution
All samples were labeled with a randomized, blind-coded
three-digit number affixed to the sample container. Test portions
were shipped on a Thursday via overnight delivery according
to the Category B Dangerous Goods shipment regulations set
forth by the International Air Transportation Association. Upon
receipt, samples were held by the collaborating laboratory at
refrigeration temperature (3–5°C) until the following Monday
when analysis was initiated a total of 96 h post-inoculation. All
samples were packed with cold packs to target a temperature of
<7°C during shipment. In addition to each of the test portions
and the total plate count sample, collaborators also received a
test portion for each matrix labeled as “temperature control.”
Participants were instructed to obtain the temperature of this
982 Bird et al.: Journal of AOAC International Vol. 98, No. 4, 2015
Table 1. Participation of each collaborating laboratorya
Lab
Full-fat cottage cheese
Deli turkey
1
Y
Y
2
Y
Y
3
Y
Y
4
Yb
Y
5
Yb
Yb
6
Yc
Y
7
Y
Y
8
Y
Yc
9
Y
N
10
Y
Yc
11
Y
Y
12
Y
N
13
Yc
Y
14
Y
Y
15
Y
Y
16
N
Y
a
Y = Collaborator analyzed the food type; N = collaborator did not
analyze the food type.
b
Results were not submitted to the coordinating laboratory.
c
Results were not used in statistical analysis due to laboratory error.
portion upon receipt of the package, document results on the
Sample Receipt Confirmation form provided, and fax to the
study director. The shipment and hold times (through 120 h) of
the inoculated test material had been verified as a QC measure
prior to study initiation.
Test Portion Analysis
Each collaborator received 72 test portions (12 high
inoculum, 12 low inoculum, and 12 uninoculated controls
for each method) of each matrix. Collaborators followed the
appropriate preparation and analysis protocol according to the
method specified for the matrix (Table 1).
For the analysis of the deli turkey test portions by the 3M
MDA Listeria monocytogenes method, a 125 g portion was
enriched with 1125 mL of prewarmed (37 ± 1°C) DF broth base
without FAC, homogenized for 2 ± 0.5 min, and incubated for
26–30 h at 37 ± 1°C. For the full-fat cottage cheese test portions
analyzed by the 3M MDA Listeria monocytogenes method, a
25 g portion was enriched with 225 mL prewarmed (37 ± 1°C)
DF broth base without FAC, homogenized for 2 ± 0.5 min,
and incubated for 24–28 h at 37 ± 1°C. Following enrichment,
samples were assayed by the 3M MDA Listeria monocytogenes
method and confirmed following the standard reference method
specified for each matrix.
Following enrichment, full-fat cottage cheese samples
assayed by the 3M MDA Listeria monocytogenes method were
confirmed by streaking an aliquot of the primary enrichment
onto Oxford Agar (OXA). Presumptive positive samples were
streaked for isolation on TSA/ye, verified morphologically
by Gram stain, and biochemically confirmed by hemolysis
testing and by VITEK 2 GP Biochemical Identification method
(AOAC OMA 2012.02; 8) or API Listeria Identification System
biochemical test kits (bioMérieux, Lyon, France). Laboratories
utilizing API Listeria kits were also required to conduct catalase
and oxidase tests.
For samples analyzed using the AOAC 993.12 reference
method, 25 g test portions were enriched in prewarmed (45°C)
selective enrichment broth, homogenized for 2 ± 0.5 min, and
incubated at 30 ± 2°C for 48 h. Samples were streaked onto OXA,
and presumptive positive samples were streaked for isolation onto
TSA/ye. Colonies from TSA/ye were verified morphologically
by Gram stain and biochemically confirmed by evaluation of a
hemolytic reaction on sheep blood agar and by the VITEK 2 GP
Biochemical Identification method or API Listeria biochemical
test kits. Laboratories utilizing API Listeria kits were also
required to conduct catalase and oxidase tests.
Following enrichment, deli turkey samples assayed by the
3M MDA Listeria monocytogenes method were confirmed by
streaking an aliquot of the primary enrichment onto MOX and
transferring an aliquot into FB. Presumptive positive samples
were streaked for isolation on Horse Blood Overlay Agar (HL)
and confirmed by evaluation of a hemolytic reaction and by the
VITEK 2 GP Biochemical Identification method or API Listeria
Identification System. Laboratories utilizing API Listeria kits
were also required to conduct catalase and oxidase tests.
For samples analyzed using the USDA/FSIS MLG 8.09
reference method, 125 g test portions were enriched with
1125 ± 25 mL of modified University of Vermont broth (UVM),
homogenized for 2 ± 0.5 min, and incubated for 24 h at 30 ± 2°C.
After incubation, samples were confirmed by streaking an
aliquot of the primary enrichment onto MOX and transferring an
aliquot into FB. Presumptive positive samples were streaked for
isolation onto HL and confirmed by evaluation of a hemolytic
reaction and by the VITEK 2 GP Biochemical Identification
method or API Listeria Identification System biochemical test
kits. Laboratories utilizing API Listeria kits were also required
to conduct catalase and oxidase tests.
Statistical Analysis
Each collaborating laboratory recorded results for the reference
method and the 3M MDA Listeria monocytogenes method on
the data sheets provided. The data sheets were submitted to the
study director at the end of testing for analysis. The results of
each test portion for each sample were compiled by the study
director, and the 3M MDA Listeria monocytogenes results were
compared to the reference methods for statistical analysis. Data
for each test portion size were analyzed using the probability of
detection (POD) statistical model (9). The POD is the proportion
of positive analytical outcomes for a qualitative method for a
given matrix at a given analyte level or concentration. POD is
concentration dependent. The cross-laboratory POD (LPOD)
was calculated for the candidate presumptive results, LPODCP,
the candidate confirmatory results (including false-negative
results), LPODCC, the difference in the candidate presumptive
and confirmatory results, dLPODCP, presumptive candidate
results that confirmed positive (excluding false-negative results),
LPODC, the reference method, LPODR, and the difference in
the confirmed candidate and reference methods, dLPODC. A
dLPOD confidence interval not containing the point zero would
indicate a statistically significant difference between the 3M
MDA Listeria monocytogenes and the reference methods at
the 5% probability level. In addition to POD, the repeatability
Bird et al.: Journal of AOAC International Vol. 98, No. 4, 2015 983
Table 2014.07A. POD summary of full-fat cottage cheese results for the 3M MDA Listeria monocytogenes
Methoda
3M MDA Listeria monocytogenes
Inoculation level
Uninoculated
Low
High
0/132
66/132
129/132
Candidate presumptive POD (CP)
0.00 (0.00, 0.03)
0.50 (0.41, 0.59)
0.98 (0.94, 0.99)
srb
0.00 (0.00, 0.16)
0.51 (0.45, 0.52)
0.15 (0.13, 0.17)
sLc
0.00 (0.00, 0.16)
0.00 (0.00, 0.17)
0.03 (0.00, 0.08)
d
0.15 (0.13, 0.18)
Candidate presumptive positive/total no. of samples analyzed
sR
0.00 (0.00, 0.23)
0.51 (0.46, 0.52)
P-valuee
1.000
0.9123
0.9499
Candidate confirmed positive/total no. of samples analyzed
0/132
64/132
132/132
Candidate confirmed POD (CC)
0.00 (0.00, 0.03)
0.48 (0.40, 0.57)
1.00 (0.97, 1.00)
sr
0.00 (0.00, 0.16)
0.51 (0.45, 0.52)
0.00 (0.00, 0.16)
sL
0.00 (0.00, 0.16)
0.00 (0.00, 0.15)
0.00 (0.00, 0.16)
sR
0.00 (0.00, 0.23)
0.51 (0.46, 0.52)
0.00 (0.00, 0.23)
1.0000
0.8762
1.0000
P-value
Candidate confirmed positive/total no. of samples analyzed
0/132
63/132
129/132
Candidate confirmed POD (C)
0.00 (0.00, 0.03)
0.48 (0.39, 0.57)
0.98 (0.94, 0.99)
sr
0.00 (0.00, 0.16)
0.51 (0.45, 0.52)
0.15 (0.13, 0.17)
sL
0.00 (0.00, 0.16)
0.00 (0.00, 0.14)
0.03 (0.00, 0.08)
sR
0.00 (0.00, 0.23)
0.51 (0.46, 0.52)
0.15 (0.13, 0.18)
P-value
1.0000
0.9080
0.9499
Positive reference samples/total no. of samples analyzed
0/132
73/132
132/132
Reference POD
0.00 (0.00, 0.03)
0.55 (0.47, 0.64)
1.00 (0.97, 1.00)
sr
0.00 (0.00, 0.16)
0.50 (0.45, 0.52)
0.00 (0.00, 0.16)
sL
0.00 (0.00, 0.16)
0.00 (0.00, 0.18)
0.00 (0.00, 0.16)
sR
0.00 (0.00, 0.23)
0.50 (0.45, 0.52)
0.00 (0.00, 0.23)
1.0000
0.6678
1.0000
dLPOD (candidate vs reference)f
0.00 (-0.03, 0.03)
–0.08 (–0.20, 0.05)
–0.02 (–0.06, 0.01)
dLPOD (candidate presumptive vs candidate confirmed)f
0.00 (-0.03, 0.03)
0.02 (–0.11, 0.14)
–0.02 (–0.06, 0.01)
P-value
a
Results include 95% confidence intervals (CI).
b
sr = Repeatability SD.
c
sL = Among-laboratory SD.
d
sR = Reproducibility SD.
e
P-value = Homogeneity test of laboratory PODs.
f
A confidence interval for dLPOD that does not contain the value 0 indicates a statistically significant difference between the two methods.
SD (sr), the among-laboratory repeatability SD (sL), the
reproducibility SD (sR), and the PT value were calculated. The
sr provides the variance of data within one laboratory, the sL
provides the difference in SD between laboratories, and the sR
provides the variance in data between different laboratories.
The PT value provides information on the homogeneity test of
laboratory PODs (10).
AOAC Official Method 2014.07
Listeria monocytogenes in Selected Foods and
Environmental Surfaces
3M™ Molecular Detection Assay (MDA)
Listeria monocytogenes Method
First Action 2014
[Applicable to detection of Listeria monocytogenes in beef
hot dogs (25 and 125 g), deli turkey (25 and 125 g), cold
smoked salmon (25 g), full-fat cottage cheese (25 g), chocolate
milk (25 g), and two environmental surfaces: sealed concrete
(sponge in 100 mL and sponge in 225 mL) and stainless steel
(sponge in 225 mL).]
See Tables 2014.07A and 2014.07B for a summary of results
of the interlaboratory study supporting acceptance of the
method.
See Appendix available on the J. AOAC Int. website for
supplementary materials for detailed results of the interlaboratory
study (http://aoac.publisher.ingentaconnect.com/content/aoac/
jaoac).
A. Principle
The 3M MDA Listeria monocytogenes is intended for use
with the 3M Molecular Detection System for the rapid and
specific detection of Listeria monocytogenes in selected foods
984 Bird et al.: Journal of AOAC International Vol. 98, No. 4, 2015
Table 2014.07B. POD summary of deli turkey results for the 3M MDA Listeria monocytogenes
Methoda
3M MDA Listeria monocytogenes
Inoculation level
Uninoculated
Low
High
2/132
66/132
132/132
Candidate presumptive POD (CP)
0.02 (0.01, 0.05)
0.50 (0.41, 0.59)
1.00 (0.97, 1.00)
srb
0.12 (0.11, 0.16)
0.51 (0.45, 0.52)
0.00 (0.00, 0.16)
sLc
0.00 (0.00, 0.05)
0.00 (0.00, 0.17)
0.00 (0.00, 0.16)
d
0.00 (0.00, 0.23)
Candidate presumptive positive/total no. of samples analyzed
sR
0.12 (0.11, 0.14)
0.51 (0.46, 0.52)
P-valuee
0.5190
0.7565
1.000
Candidate confirmed positive/total no. of samples analyzed
1/132
67/132
132/132
Candidate confirmed POD (CC)
0.01 (0.00, 0.04)
0.51 (0.42, 0.60)
1.00 (0.97, 1.00)
sr
0.09 (0.08, 0.16)
0.51 (0.45, 0.52)
0.00 (0.00, 0.16)
sL
0.00 (0.00, 0.04)
0.00 (0.00, 0.17)
0.00 (0.00, 0.16)
sR
0.09 (0.08, 0.10)
0.51 (0.46, 0.52)
0.00 (0.00, 0.23)
0.4338
0.7891
1.0000
P-value
Candidate confirmed positive/total no. of samples analyzed
0/132
64/132
132/132
Candidate confirmed POD (C)
0.00 (0.00, 0.03)
0.48 (0.40, 0.57)
1.00 (0.97, 1.00)
sr
0.00 (0.00, 0.16)
0.51 (0.45, 0.52)
0.00 (0.00, 0.16)
sL
0.00 (0.00, 0.16)
0.00 (0.00, 0.16)
0.00 (0.00, 0.16)
sR
0.00 (0.00, 0.23)
0.51 (0.46, 0.52)
0.00 (0.00, 0.23)
P-value
1.0000
0.8249
1.000
Positive reference samples/total no. of samples analyzed
0/132
66/132
132/132
Reference POD
0.00 (0.00, 0.03)
0.50 (0.41, 0.59)
1.00 (0.97, 1.00)
sr
0.00 (0.00, 0.16)
0.51 (0.45, 0.52)
0.00 (0.00, 0.16)
sL
0.00 (0.00, 0.16)
0.00 (0.00, 0.17)
0.00 (0.00, 0.16)
sR
0.00 (0.00, 0.23)
0.51 (0.46, 0.52)
0.00 (0.00, 0.23)
1.0000
0.7565
1.0000
dLPOD (candidate vs reference)f
0.00 (-0.03, 0.03)
–0.02 (–0.14, 0.11)
0.00 (–0.03, 0.03)
dLPOD (candidate presumptive vs candidate confirmed)f
0.01 (-0.03, 0.05)
–0.01 (–0.13, 0.12)
0.00 (–0.03, 0.03)
P-value
a
Results include 95% confidence intervals (CIs).
b
sr = Repeatability SD.
c
sL = Among-laboratory SD.
d
sR = Reproducibility SD.
e
P-value = Homogeneity test of laboratory PODs.
f
A confidence interval for dLPOD that does not contain the value 0 indicates a statistically significant difference between the two methods.
and environmental surfaces. The 3M MDA uses loop-mediated
isothermal amplification to rapidly amplify nucleic acid
sequences with high specificity and sensitivity, combined
with bioluminescence to detect the amplification. Presumptive
positive results are reported in real time, while negative results
are displayed after the assay is completed. Samples are enriched
in prewarmed DF broth base, which does not contain FAC.
B. Apparatus and Reagents
Items (a) and (h)–(o) are available from 3M Food Safety (St.
Paul, MN). Items (b)–(g) are available as the 3M MDA Listeria
monocytogenes kit from 3M Food Safety.
(a) 3MTM Molecular Detection Instrument.
(b) 3M MDA Listeria monocytogenes reagent tubes.—
Twelve strips of eight tubes.
(c) Lysis solution (LS) tubes.—Twelve strips of eight tubes.
(d) Extra caps.—Twelve strips of eight caps.
(e) Negative control (NC).—One vial (2 mL).
(f) Reagent control (RC).—Two pouches. Each pouch
contains eight reagent tubes.
(g) Quick Start Guide.
(h) 3M Molecular Detection Speed Loader Tray.
(i) 3M Molecular Detection Chill Block Tray and Chill Block
Insert.
(j) 3M Molecular Detection Heat Block Insert.
(k) 3M Molecular Detection Cap/Decap Tool-Reagent (for
reagent tubes).
(l) 3M Molecular Detection Cap/Decap Tool-Lysis (for lysis
tubes).
(m) Empty lysis tube rack.
(n) Empty reagent tube rack.
Bird et al.: Journal of AOAC International Vol. 98, No. 4, 2015 985
Table 2014.07C. Enrichment protocols for the 3M MDA Listeria monocytogenes
Primary enrichment, DF broth (no FAC)
Sample matrix
Sample size
Enrichment broth volume, mL
Enrichment temperature (±1°C)
Enrichment time, h
Full-fat cottage cheese
25 g
225
37
24–28
Chocolate milk
25 g
225
37
24–28
Beef hot dogs
25 g
225
37
26–30
125 g
1125
37
26–30
25 g
225
37
26–30
125 g
1125
37
26–30
25 g
225
37
26–30
Food
Deli turkey
Cold smoked salmon
Environmental surfaces
Sealed concrete
1 Sponge
100
37
26–30
Sealed concrete, stainless steel
1 Sponge
225
37
26–30
(o) DF broth base.—Formulation equivalent to ISO 11290-1.
(p) Disposable pipet.—Capable of 20 µL.
(q) Multichannel (eight-channel) pipet.—Capable of 20 µL.
(r) Sterile filter tip pipet tips.—Capable of 20 µL.
(s) Filter Stomacher® bags.—Seward Ltd (West Sussex,
UK) or equivalent.
(t) Stomacher.—Seward or equivalent.
(u) Thermometer.—Calibrated range to include 100 ± 1°C.
(v) Dry double block heater unit or water bath.—Capable of
maintaining 100 ± 1°C.
(w) Incubators.—Capable of maintaining 37 ± 1°C.
(x) Freezer.—Capable of maintaining –10 to 20°C, for
storing the 3M Molecular Detection Chill Block Tray.
(y) Refrigerator.—Capable of maintaining 2–8°C, for storing
the 3M MDA.
(z) Computer.—Compatible with the 3M Molecular
Detection Instrument.
C. General Instructions
(a) Store the 3M MDA Listeria monocytogenes at 2–8°C.
Do not freeze. Keep kit away from light during storage. After
opening the kit, check that the foil pouch is undamaged. If the
pouch is damaged, do not use. After opening, unused reagent
tubes should always be stored in the resealable pouch with the
desiccant inside to maintain stability of the lyophilized reagents.
Store resealed pouches at 2–8°C for no longer than 1 month. Do
not use 3M MDA Listeria monocytogenes past the expiration
date.
(b) The 3M Molecular Detection Instrument is intended for
use with samples that have undergone heat treatment during
the assay lysis step, which is designed to destroy organisms
present in the sample. Samples that have not been properly heat
treated during the assay lysis step may be considered a potential
biohazard and should not be inserted into the 3M Molecular
Detection Instrument.
(c) Follow all instructions carefully. Failure to do so may
lead to inaccurate results.
D. Safety Precautions
After use, the enrichment medium and the 3M MDA Listeria
monocytogenes tubes can potentially contain pathogenic
materials. L. monocytogenes is of particular concern for
pregnant women, the aged, and the infirmed. It is recommended
that these groups of concern avoid handling this organism.
When testing is complete, follow current industry standards for
the disposal of contaminated waste. Consult the Material Safety
Data Sheet for additional information and local regulations for
disposal.
Periodically decontaminate laboratory benches and
equipment (pipets, cap/decap tools, etc.) with a 1–5% (v/v in
water) household bleach solution or DNA removal solution.
E. Sample Enrichment
(a) Prewarm DF broth base without FAC to 37 ± 1°C.
(b) Aseptically combine the enrichment medium and sample
following the procedures in Table 2014.07C. For all meat and
highly particulate samples, the use of filter bags is recommended.
Homogenize thoroughly for 2 ± 0.5 min. Incubate at 37 ± 1°C.
F. Preparation of the 3M Molecular Detection Speed
Loader Tray
(a) Wet a cloth or paper towel with a 1–5% (v/v in water)
household bleach solution and wipe the 3M Molecular Detection
Speed Loader Tray.
(b) Rinse the 3M Molecular Detection Speed Loader Tray
with water.
(c) Use a disposable towel to wipe the 3M Molecular
Detection Speed Loader Tray dry.
(d) Ensure that the 3M Molecular Detection Speed Loader
Tray is dry before use.
G. Preparation of the 3M Molecular Detection Chill
Block Insert
Before using the 3M Molecular Detection Chill Block Insert,
ensure that it has been stored on the 3M Molecular Detection
986 Bird et al.: Journal of AOAC International Vol. 98, No. 4, 2015
Figure 2014.07A. Transfer of enriched sample to lysis solution tube.
Chill Block Tray in the freezer (–10 to –20°C) for a minimum
of 2 h before use. When removing the 3M Molecular Detection
Chill Block Insert from the freezer for use, remove it and the
3M Molecular Detection Chill Block Tray together. Use the
3M Molecular Detection Chill Block Insert/3M Molecular
Detection Chill Block Tray within 20 min.
H. Preparation of the 3M Molecular Detection Heat
Block Insert
Place the 3M Molecular Detection Heat Block Insert in a dry
double block heater unit. Turn on the dry block heater unit and
set the temperature to allow the 3M Molecular Detection Heat
Block Insert to reach and maintain a temperature of 100 ± 1°C.
Note: Depending on the heater unit, allow approximately
30–50 min for the 3M Molecular Detection Heat Block Insert to
reach temperature. Using a calibrated thermometer, verify that
the 3M Molecular Detection Heat Block Insert is at 100 ± 1°C.
I. Preparation of the 3M Molecular Detection
Instrument
(a) Launch the 3M Molecular Detection Software and log in.
(b) Turn on the 3M Molecular Detection Instrument.
(c) Create or edit a run with data for each sample. Refer to
the 3M Molecular Detection System User Manual for details.
Note: The 3M Molecular Detection Instrument must reach
and maintain temperature of 60°C before inserting the 3M
Molecular Detection Speed Loader Tray with reaction tubes.
This heating step takes approximately 20 min and is indicated
by an orange light on the instrument’s status bar. When the
instrument is ready to start a run, the status bar will turn green.
J. Lysis
(a) Allow the LS tubes to warm up to room temperature
(20–25°C) by setting the rack on the laboratory bench for 2 h.
Alternatives to equilibrate the LS tubes to room temperature are
to incubate the LS tubes in a 37 ± 1°C incubator for 1 h or at
room temperature overnight (16–18 h).
(b) Remove the enrichment broth from the incubator and
gently agitate the contents.
Figure 2014.07B. Sample lysis.
(c) One LS tube is required for each sample and the NC
sample.
(1) LS tube strips can be cut to desired LS tube number.
Select the number of individual LS tubes or 8-tube strips
needed. Place the LS tubes in an empty rack.
(2) To avoid cross-contamination, decap one LS tube strip at
a time and use a new pipet tip for each transfer step.
(d) Transfer enriched sample to LS tubes as described below:
Note: Transfer each enriched sample into individual LS tubes
first. Transfer the NC last.
(1) Use the 3M Molecular Detection Cap/Decap Tool-Lysis
to decap one LS tube strip, one strip at a time. Set the tool with
cap attached aside on a clean surface.
(2) Transfer 20 µL of sample into an LS tube.
(3) Repeat step (d)(2) until each individual sample has been
added to a corresponding LS tube in the strip.
(4) Use the 3M Molecular Detection Cap/Decap Tool-Lysis
to recap the LS tube strip. Use the rounded side of the tool to
apply pressure in a back-and-forth motion ensuring that the cap
is tightly applied. See Figure 2014.07A.
(5) Repeat steps (d)(1)-(d)(4) as needed, for the number of
samples to be tested.
(6) When all samples have been transferred, then transfer
20 µL NC into an LS tube. Use the 3M Molecular Detection
Cap/Decap Tool-Lysis tool to recap the LS tube.
(7) Cover the rack of LS tubes with the rack lid and firmly
invert three to five times to mix. Suspension has to flow freely
inside the tube.
(e) Verify that the temperature of the 3M Molecular
Detection Heat Block Insert is at 100 ± 1°C. Place the rack of
LS tubes in the 3M Molecular Detection Heat Block Insert and
heat for 15 ± 1 min. An alternative to using dry heat for the lysis
step is to use a water bath at 100 ± 1°C. Ensure that sufficient
water is used to cover up to the liquid level in the LS tubes.
Place the rack of LS tubes in the water bath at 100 ± 1°C and
heat for 15 ± 1 min. Samples that have not been properly heat
treated during the assay lysis step may be considered a potential
biohazard and should not be inserted into the 3M Molecular
Detection Instrument.
(f) Remove the rack of LS tubes from the heating block and
allow to cool in the 3M Molecular Detection Chill Block Insert
for 10 ± 1 min. The LS solution may freeze when processing
Bird et al.: Journal of AOAC International Vol. 98, No. 4, 2015 987
Figure 2014.07C. Transfer of lysate.
fewer than 48 LS tubes. Freezing of the LS solution will not
affect the test. If freezing is observed, allow the LS tubes to
thaw for 5 min before mixing. Remove the rack lid during
incubation on the 3M Molecular Detection Chill Block Insert.
(g) Remove the rack of LS tubes from the 3M Molecular
Detection Chill Block Insert/3M Molecular Detection Chill
Block Tray system. Replace the lid on the rack of LS tubes and
firmly invert three to five times to mix. Suspension has to flow
freely inside the tube.
(h) Firmly tap the lysis tubes rack on the laboratory bench
three to five.
(i) Place the rack on the laboratory bench and let sit
undisturbed for 5–10 min to allow the resin to settle. Do
not mix or disturb the resin at the bottom of the tube. See
Figure 2014.07B.
K. Amplification
(a) One reagent tube is required for each sample and the NC.
(1) Reagent tube strips can be cut to desired tube number.
Select the number of individual reagent tubes or eight-tube
strips needed.
(2) Place reagent tubes in an empty rack.
(3) Avoid disturbing the reagent pellets from the bottom of
the tubes.
(b) Select one RC tube and place in rack.
(c) To avoid cross-contamination, decap one reagent tube
strip at a time and use a new pipet tip for each transfer step.
(d) Transfer lysate to reagent tubes and RC tube as described
below:
Note: Transfer each sample lysate into individual reagent
tubes first followed by the NC. Hydrate the RC tube last.
Warning: Care must be taken when pipetting LS, as carryover of the resin may interfere with amplification.
(1) Use the 3M Molecular Detection Cap/Decap ToolReagent to decap the reagent tubes, one reagent tube strip at a
time. Discard cap.
(2) Transfer 20 µL of sample lysate from the upper portion
of the fluid in the LS tube into corresponding reagent tube.
Dispense at an angle to avoid disturbing the pellets. Mix by
gently pipetting up and down five times.
(3) Repeat step (d)(2) until individual sample lysate has been
added to a corresponding reagent tube in the strip.
(4) Cover the reagent tubes with the provided extra cap and
use the rounded side of the 3M Molecular Detection Cap/Decap
Tool-Reagent to apply pressure in a back and forth motion
ensuring that the cap is tightly applied.
(5) Repeat steps (d)(1)–(d)(4) as needed, for the number of
samples to be tested.
(6) When all sample lysates have been transferred, repeat
steps (d)(1)–(d)(4) to transfer 20 µL NC lysate into a reagent
tube.
(7) Transfer 20 µL NC lysate into an RC tube. Dispense at
an angle to avoid disturbing the pellets. Mix by gently pipetting
up and down 5 times.
(e) Load capped tubes into a clean and decontaminated 3M
Molecular Detection Speed Loader Tray. Close and latch the 3M
Molecular Detection Speed Loader Tray lid (Figure 2014.07C).
(f) Review and confirm the configured run in the 3M
Molecular Detection Software.
(g) Click the Start button in the software and select instrument
for use. The selected instrument’s lid automatically opens.
(h) Place the 3M Molecular Detection Speed Loader Tray
into the 3M Molecular Detection Instrument and close the lid
to start the assay. Results are provided within 75 min, although
positives may be detected sooner.
(i) After the assay is complete, remove the 3M Molecular
Detection Speed Loader Tray from the 3M Molecular Detection
Instrument and dispose of the tubes by soaking in a 1–5% (v/v
in water) household bleach solution for 1 h and away from the
assay preparation area.
Notice: To minimize the risk of false positives due to crosscontamination, never open reagent tubes containing amplified
DNA. This includes RC, reagent, and Matrix Control tubes.
Always dispose of sealed reagent tubes by soaking in a 1–5%
(v/v in water) household bleach solution for 1 h and away from
the assay preparation area.
L. Results and Interpretation
An algorithm interprets the light output curve resulting
from the detection of the nucleic acid amplification.
Results are analyzed automatically by the software and
are color-coded based on the result. A Positive or Negative
result is determined by analysis of a number of unique curve
parameters. Presumptive positive results are reported in real
time while Negative and Inspect results will be displayed
after the run is completed. Presumptive positive results should
be confirmed using one’s preferred method or as specified
by the U.S. Food and Drug Administration Bacteriological
Analytical Manual, U.S. Department of Agriculture (USDA),
Food Safety and Inspection Service (FSIS) Microbiology
Laboratory Guidebook, AOAC Official MethodSM 993.12, or
ISO 11290 methods starting from the 3M primary enrichment,
followed by secondary enrichment or direct plating and
988 Bird et al.: Journal of AOAC International Vol. 98, No. 4, 2015
confirmation of isolates using appropriate biochemical and
serological methods.
Note: Even a negative sample will not give a zero reading as
the system and 3M Molecular Assay Listeria monocytogenes
amplification reagents have a “background” relative light unit.
In the rare event of any unusual light output, the algorithm
labels this as “Inspect.” 3M recommends the user to repeat
the assay for any Inspect samples. If the result continues to
be Inspect, proceed to confirmation test using one’s preferred
method or as specified by local regulations.
13 reported deviations in the protocol. Laboratory 6 incorrectly
incubated their MDA test portions at 30°C for 48 h instead of
the required 37°C for 24 h; Laboratory 13 confirmed all colony
growth regardless of supplementary test results (Gram stain,
catalase reaction) indicating that the organism would not be
classified as Listeria (Gram negative or Gram positive with
spores, catalase negative) and results from these laboratories
were excluded from the statistical analysis. The MPN levels
obtained for the inoculated samples, with 95% confidence
intervals (CIs), were 0.80 CFU/test portion (0.63, 1.00) for the
low level and 4.83 CFU/test portion (3.30, 7.70) for the high
level.
For the high level, 129 out of 132 test portions (LPODCP of
0.98) were reported as presumptive positive by the 3M MDA
Listeria monocytogenes method with all 132 test portions
(LPODCC of 1.00) confirming positive. Based on the valid data
submitted from each of the collaborating laboratories, three
false-negative results were obtained resulting in 129 confirmed
positives (LPODC of 0.98). Using the POD statistical analysis,
only presumptive positive samples that confirmed positive are
used to calculate LPODC. For the low level, 66 out of 132 test
portions (LPODCP of 0.50) were reported as presumptive
positive by the 3M MDA Listeria monocytogenes method with
64 test portions (LPODCC of 0.48) confirming positive. Based
on the valid data submitted from each of the collaborating
laboratories, three false-positive results and one false-negative
result were obtained, resulting in 63 confirmed positives
(LPODC of 0.47). For the uninoculated controls, 0 out of
132 samples produced a presumptive positive result by the 3M
MDA Listeria monocytogenes method with all test portions
confirming negative. For test portions analyzed by the AOAC
993.12 method, 132 out of 132 high-level test portions (LPODR
of 1.00) and 73 out of 132 low-level test portions (LPODR of
0.55) confirmed positive. For the uninoculated controls, 0 out of
132 test portions (LPODR of 0.00) confirmed positive.
For the low level, a dLPODC value of –0.08 with a 95% CI
of (–0.20, 0.05) was obtained between the 3M MDA Listeria
monocytogenes method and the AOAC 993.12 method. The
CI obtained for dLPODC indicated no significant difference
between the two methods. A dLPODCP value of 0.02 with a
95% CI of (–0.11, 0.14) was obtained between presumptive
and confirmed 3M MDA Listeria monocytogenes results. The
CI obtained for dLPODCP indicated no significant difference
between the presumptive and confirmed results.
For the high level, a dLPODC value of –0.02 with a 95% CI
of (–0.06, 0.01) was obtained between the 3M MDA Listeria
monocytogenes method and the AOAC 993.12 method. The
CI obtained for dLPODC indicated no significant difference
between the two methods. A dLPODCP value of –0.02 with a
95% CI of (–0.06, 0.01) was obtained between presumptive
and confirmed 3M MDA Listeria monocytogenes results. The
CI obtained for dLPODCP indicated no significant difference
Results of Collaborative Study
For this collaborative study, the 3M MDA Listeria
monocytogenes method was compared to the to the AOAC
993.12 reference method for full-fat cottage cheese and to the
USDA/FSIS MLG 8.09 for deli turkey. A total of 16 laboratories
throughout the United States and Canada participated in this
study, with 13 laboratories submitting data for the full-fat cottage
cheese and 11 laboratories submitting data for deli turkey (see
Table 1). Each laboratory analyzed 36 test portions for each
method: 12 inoculated with a high level of L. monocytogenes,
12 inoculated with a low level of L. monocytogenes, and
12 uninoculated controls. The 3M MDA Listeria monocytogenes
method produced 394 presumptive positive results with 392
confirming positive. There were 403 confirmed positives by the
reference method.
A background screen of the matrixes indicated an absence of
indigenous Listeria species, including L. monocytogenes. For
each matrix, the level of L. monocytogenes was determined by
MPN determination on the day of initiation of analysis by the
coordinating laboratory. The results of the heat stress injury
for the deli turkey inoculum are presented in Table 2. The
individual laboratory and sample results are presented in Tables
3 and 4. Tables A and B summarize the interlaboratory results
for all foods tested, including POD statistical analysis (10).
As per criteria outlined in Appendix J of the AOAC validation
guidelines, fractional positive results were obtained. Detailed
results for each laboratory are presented in Tables A and B and
Figures 1A–B and 2A–B of the supplementary materials. The
results for each collaborating laboratory’s 3M Petrifilm Aerobic
Count Plate (AOAC 990.12) are presented in Table C of the
supplementary materials.
Full-Fat Cottage Cheese Results (25 g Test Portions)
Full-fat cottage cheese test portions were inoculated at a low
and high level and were analyzed (Table 2) for the detection
of L. monocytogenes. Uninoculated controls were included in
each analysis. Fifteen laboratories participated in the evaluation
of the full-fat cottage cheese. Laboratories 4 and 5 did not
submit results to the coordinating laboratory. Laboratories 6 and
Table 2. Heat-stress injury results
Matrix
Deli turkey
Test organisma
CFU/MOX
(selective agar)
CFU/TSA/ye
(nonselective agar)
Degree injuryb, %
Listeria monocytogenes ATCC 13932
7.7 × 10⁸
3.2 × 10⁹
76.0
a
ATCC = American Type Culture Collection, Manassas, VA.
b
Cultures were heat-stressed for 10 min at 50°C in a circulating water bath.
+
NA
NA
+
+
+
+
+
+
+
3
4c
5c
6c
7
8
9
10
11
12
+
+
NA
NA
+
+
+
+
+
+
+
+
+
+
NA
2
3
4c
5c
6c
7
8
9
10
11
12
13c
14
15
16
NA
+
+
+
+
+
+
+
+
+
+
NA
NA
+
+
+
NA
+
+
+
+
+
+
+
+
+
+
NA
NA
+
+
+
NA
NA
+
+
+
+
+
+
+
+
+
+
NA
NA
+
+
+
NA
+
NA
+
+
+
+
+
+
+
+
+
+
NA
NA
+
+
+
NA
+
+
NA
+
+
+
+
+
+
+
+
+
–
NA
NA
+
+
+
NA
+
+
+
+
+
+
+
+
+
+
NA
NA
+
+
+
NA
+d
+d
NA
+
+
+
+
+
+
+
+
+
NA
NA
+
+
+
7
+
+
+
+
+
+
+
+
+
NA
NA
+
+
+
6
NA
+
+
+
+
+
+
+
+
+
–
NA
NA
+
+
+
NA
+
+
d
+
+
+
+
+
+
+
+
NA
NA
+
+
+
8
NA
+
+
+
+
+
+
+
+
+
–
NA
NA
+
+
+
NA
+
+
d
+
+
+
+
+
+
+
+
NA
NA
+
+
+
9
NA
+
+
+
+
+
+
+
+
+
+
NA
NA
+
+
+
NA
+
+
+
+
+
+
+
+
+
+
NA
NA
+
+
+
10
NA
+
+
+
+
+
+
+
+
+
–
NA
NA
+
+
+
NA
+
+
+
+
+
+
+
+
+
+
NA
NA
+
+
+
11
NA
+
+
+
+
+
+
+
+
+
–
NA
NA
+
+
+
NA
+
+
+
+
+
+
+
+
+
+
NA
NA
+
+
+
12
NA
–
+
–
–
–
+
–
+
–
–
NA
NA
–
+
–
NA
+
+
+
+
–
–
+
+
–
+d
NA
NA
+
+
+
+
–
–
–
–
+
–
NA
NA
+
+
–
NA
–
+
–
+
–
–
+
+
–
+d
NA
NA
–
–b
NA
–
+
–b
+
2
1
NA
–
–
+
–
–
–
+
+
+
–
NA
NA
+
+
–
NA
+
–
+
+
–
–
–
+
+
+d
NA
NA
–
–
+
3
5
6
7
8
Low-level test portions
NA
–
–
+
+
+
–
+
+
+
–
NA
NA
+
–
–
NA
+
–
d
+
+
+
–
–
+
–
+d
NA
NA
–
+
–
NA
+
+
d
+
–
+
–
+
+
–
+
NA
NA
+
+
+
NA
–
+
–
+
+
+
+
–
–
+
NA
NA
+
–
+
NA
–
–
–
–
–
+
–
+
+
–
NA
NA
–
+
+
NA
–
+
+
–
–
+
–
–
+
–
NA
NA
–
+
+
NA
+
+
–
+
–
+
+
–
+
+
NA
NA
–
+
–
AOAC OMA 993.12
NA
+
+
d
+
+
+
+
–
–
–
+
NA
NA
–
+
–
NA
+
+
+
–
+
+
+
+
+
+
NA
NA
+
–
+
NA
+
–
–
–
–
+
–
–
–
+
NA
NA
+
–
–
3M MDA Listeria monocytogenes
4
NA
+
–
+
–
+
+
+
–
+
–
NA
NA
+
–
–
NA
–
–
–
–
–
–
–
–
–
+
NA
NA
+
–
–
9
NA
–
–
+
+
–
+
+
+
–
–
NA
NA
+
–
+
NA
–
–
–
–
–
+
–
–
+
+d
NA
NA
+
+
–
10
NA
–
–
–
–
+
–
+
–
+
–
NA
NA
+
–
+
NA
+
–
+
–
+
+
–
+
+
+
NA
NA
+
+
+
11
NA
+
+
–
+
+
–
+
+
+
–
NA
NA
–
+
+
NA
–
+
+
–
+
+
NA
–
–
–
–
–
–
–
–
–
–
NA
NA
–
–
–
NA
–
–
–
–
–
–
–
–
–
–
+
+d
NA
NA
–
–
–
1
+d
+
NA
NA
+
+
–
12
NA
–
–
–
–
–
–
–
–
–
–
NA
NA
–
–
–
NA
–
–
–
–
–
–
–
–
–
+d
NA
NA
–
–
–
2
d
Sample was presumptive negative on 3M MDA Listeria monocytogenes but confirmed positive indicating a false-negative result.
Results were not used in statistical analysis due to laboratory error.
c
Sample was presumptive positive on 3M MDA Listeria monocytogenes but confirmed negative indicating a false-positive result.
+
1
NA
+
+
+
+
+
+
+
+
+
+
NA
NA
+
+
+
5
High-level test portions
+ = L. monocytogenes were detected in samples; – = L. monocytogenes were not detected in sample; NA = Laboratory did not participate in this matrix or results were not received.
NA
16
+
+
+
+
+d
+
+
+
+
+
+
+
NA
NA
+
+
+
4
+
+
+
+
+
+
NA
NA
+
+
+
3
b
+
15
+
+
+
+
+
+
+
+
+
NA
NA
+
+
+
2
a
+
14
+
+
2
c
+
1
13
1
Lab
Table 3. Individual collaborator results for full-fat cottage cheese (4% milk fat)a
NA
–
–
–
–
–
–
–
–
–
–
NA
NA
–
–
–
NA
–
–
–
–
–
–
–
–
–
+d
NA
NA
–
–
–
3
NA
–
–
–
–
–
–
–
–
–
–
NA
NA
–
–
–
NA
–
–
–
–
–
–
–
–
–
+d
NA
NA
–
–
–
4
NA
–
–
–
–
–
–
–
–
–
–
NA
NA
–
–
–
NA
–
–
–
–
–
–
–
–
–
+
NA
NA
–
–
–
5
NA
–
–
–
–
–
–
–
–
–
–
NA
NA
–
–
–
NA
–
–
–
–
–
–
–
–
–
+d
NA
NA
–
–
–
6
NA
–
–
–
–
–
–
–
–
–
–
NA
NA
–
–
–
NA
–
–
–
–
–
–
–
–
–
+d
NA
NA
–
–
–
7
NA
–
–
–
–
–
–
–
–
–
–
NA
NA
–
–
–
NA
–
–
–
–
–
–
–
–
–
+d
NA
NA
–
–
–
8
Uninoculated test portions
NA
–
–
–
–
–
–
–
–
–
–
NA
NA
–
–
–
NA
–
–
–
–
–
–
–
–
–
+d
NA
NA
–
–
–
9
NA
–
–
–
–
–
–
–
–
–
–
NA
NA
–
–
–
NA
–
–
–
–
–
–
–
–
–
+d
NA
NA
–
–
–
10
NA
–
–
–
–
–
–
–
–
–
–
NA
NA
–
–
–
NA
–
–
–
–
–
–
–
–
–
+d
NA
NA
–
–
–
11
NA
–
–
–
–
–
–
–
–
–
–
NA
NA
–
–
–
NA
–
–
–
–
–b
–
–
–
–
+d
NA
NA
–
–
–
12
Bird et al.: Journal of AOAC International Vol. 98, No. 4, 2015 989
990 Bird et al.: Journal of AOAC International Vol. 98, No. 4, 2015
Table 4. Individual collaborator results for deli turkeya
High-level test portions
Low-level test portions
Lab
1
2
3
4
5
6
7
8
9
10
11
12
1
2
3
4
5
6
7
8
1
+
+
+
+
+
+
+
+
+
+
+
+
–
–
–
–
+
–
–
+
2
+
+
+
+
+
+
+
+
+
+
+
+
+
+
+
+
–
+
–
–
3
+
+
+
+
+
+
+
+
+
+
+
+
+
+
–
+
+
+
+
+
4
+
+
+
+
+
+
+
+
+
+
+
+
+
+
+
+
+
+
+
+b
9
Uninoculated test portions
10
11
12
1
2
3
4
5
6
7
8
9
10
11
12
+
+
+
+
–
–
–
–
–
–
–
–
–
–
–
–
+b
–
–
–
–
–
–
–
–
–
–
–
–
–
–
–
+
–
–
–
–
–
–
–
–
–
–
–
–
–
–
–
–
–
+
–
–
–
–
–
–
–
–c
–
–
–
–
–
3M MDA Listeria monocytogenes
5
d
NA NA NA NA NA NA NA NA NA NA NA NA
NA NA NA NA NA NA NA NA NA NA NA NA
6
+
+
+
+
+
+
+
+
+
+
+
+
–
–
–c
–
7
+
+
+
+
+
+
+
+
+
+
+
+
+
+
+
8d
+
+
+
+
+
+
+
+
+
+
+
+
+
+
+
9
NA NA NA NA NA NA NA NA NA NA NA NA
10d
11
+
+
12d
+
+
+
+
+
+
+
+
+b
+
+
+
+
+
+
+
+
+
+
+
+
+
–
–
+
–
+
NA
–
+
+
–
–
–
–
–
–
–
+
–
NA
+
+
–
–
–
–
–
–
–
–
–
–
+
+
–
–
–
–
–
–
–
–c
+
NA NA NA NA NA NA NA NA NA NA NA NA
+
+
+
NA NA NA NA NA NA NA NA NA NA NA NA
+
+
+
–
–
–
–
–
+
–
+
+
–
+
–
+
NA NA NA NA NA NA NA NA NA NA NA NA
–
–
+
–
–
–
–c
–
–
–
–
–
–
–
–
–
+
NA NA NA
–
NA NA NA NA NA NA NA NA NA NA NA NA
+
–
+
+b
+
+
+
–
–
–
+b
+
–
–
–
b
–
–
–
–
–
–
–
–
–
–
–
–
+
NA NA NA NA NA NA NA NA NA NA NA NA
NA NA NA NA NA NA NA NA NA NA NA NA
13
+
+
+
+
+
+
+
+
+
+
+
+
+
+
+
–
–
–
–
–
–
+
–
+
–
–
–
–
–
–
–
–
–
–
–
–
14
+
+
+
+
+
+
+
+
+
+
+
+
+
+
+
+
–
+
+
+
–
–c
–
–
–
–
–
–
–
–
–
–
–
–
–
–
15
+
+
+
+
+
+
+
+
+
+
+
+
–
–
–
–
–
–
+
+
–
+
+
+
–
–
–
–
–
–
–
–
–
–
–
–
b
16
+
+
+
+
+
+
+
+
+
+
+
+
–
–
–
–
+
–
–
–
+
+
+
+
–
–
–
–
+
–
–
–
–
–
–
–
USDA/FSIS – MLG 8.09
1
+
+
+
+
+
+
+
+
+
+
+
+
–
+
+
+
+
+
+
–
–
–
–
–
–
–
–
–
–
–
–
–
–
–
–
–
2
+
+
+
+
+
+
+
+
+
+
+
+
–
–
+
+
+
+
+
–
–
–
–
+
–
–
–
–
–
–
–
–
–
–
–
–
3
+
+
+
+
+
+
+
+
+
+
+
+
+
–
+
+
+
–
+
+
+
–
–
–
–
–
–
–
–
–
–
–
–
–
–
–
4
+
+
+
+
+
+
+
+
+
+
+
+
+
+
+
+
–
–
–
–
–
–
+
+
–
–
–
–
–
–
–
–
–
–
–
–
5d
NA NA NA NA NA NA NA NA NA NA NA NA
NA NA NA NA NA NA NA NA NA NA NA NA
6
+
+
+
+
+
+
+
+
+
+
+
+
–
+
+
+
7
+
+
+
+
+
+
+
+
+
+
+
+
–
–
–
–
8d
+
+
+
+
+
+
+
+
+
+
+
+
–
+
+
–
9
NA NA NA NA NA NA NA NA NA NA NA NA
+
–
NA NA NA NA NA NA NA NA NA NA NA NA
–
–
–
–
+
+
+
–
–
–
–
–
–
–
–
–
–
–
–
+
+
+
–
+
–
+
–
–
–
–
–
–
–
–
–
–
–
–
–
+
–
–
+
+
+
–
–
–
–
–
–
–
–
–
–
–
–
NA NA NA NA NA NA NA NA NA NA NA NA
NA NA NA NA NA NA NA NA NA NA NA NA
10d
+
+
+
+
+
+
+
+
+
+
+
+
+
+
+
+
+
+
+
–
+
+
+
+
+
+
+
+
–
+
–
+
+
–
+
–
11
+
+
+
+
+
+
+
+
+
+
+
+
–
–
–
–
+
–
–
+
+
+
+
+
–
–
–
–
–
–
–
–
–
–
–
–
12d
NA NA NA NA NA NA NA NA NA NA NA NA
NA NA NA NA NA NA NA NA NA NA NA NA
NA NA NA NA NA NA NA NA NA NA NA NA
13
+
+
+
+
+
+
+
+
+
+
+
+
+
–
–
+
+
–
+
–
–
–
–
+
–
–
–
–
–
–
–
–
–
–
–
–
14
+
+
+
+
+
+
+
+
+
+
+
+
+
+
–
–
+
+
+
+
–
–
+
–
–
–
–
–
–
–
–
–
–
–
–
–
15
+
+
+
+
+
+
+
+
+
+
+
+
–
–
+
+
–
+
+
+
+
–
+
–
–
–
–
–
–
–
–
–
–
–
–
–
16
+
+
+
+
+
+
+
+
+
+
+
+
–
–
+
–
+
+
–
–
+
–
–
–
–
–
–
–
–
–
–
–
–
–
–
–
a
+ = L. monocytogenes were detected in samples; – = L. monocytogenes were not detected in sample; NA = laboratory did not participate in this matrix or results were not
received.
b
Sample was presumptive negative on 3M MDA Listeria monocytogenes but confirmed positive indicating a false-negative result.
c
Sample was presumptive positive on 3M MDA Listeria monocytogenes but confirmed negative indicating a false-positive result.
d
Results were not used in statistical analysis due to laboratory error.
between the presumptive and confirmed results. Detailed results
of the POD statistical analysis are presented in Table A and
Figures 1A and 1B of the supplementary materials.
Deli Turkey Results (125 g Test Portions)
Deli turkey test portions were inoculated at a low and
high level and were analyzed (Table 2) for the detection of
L. monocytogenes. Fourteen laboratories participated in the
analysis of the deli turkey. Uninoculated controls were included
in each analysis. Laboratory 5 did not submit results to the
coordinating laboratory. Laboratory 8 reported a deviation in
the protocol (enrichment of MDA test portions using UVM
broth) and Laboratory 10 reported the occurrence of crosscontamination (eight confirmed positive uninoculated reference
method samples and seven confirmed positive uninoculated
MDA method samples). Results from these laboratories were
excluded from the statistical analysis. The MPN levels obtained
for the inoculated samples, with 95% CIs, were 0.66 CFU/test
portion (0.51, 0.83) for the low level and 5.08 CFU/test portion
(3.39, 7.63) for the high level.
Bird et al.: Journal of AOAC International Vol. 98, No. 4, 2015 991
For the high level, 132 out of 132 test portions (LPODCP of
1.00) were reported as presumptive positive by the 3M MDA
Listeria monocytogenes method with all 132 test portions
(PODCC of 1.00) confirming positive. Based on the valid data
submitted from each of the collaborating laboratories, no falsenegative or false-positive results were obtained resulting in
132 confirmed positives (LPODC of 1.00). For the low level,
66 out of 132 test portions (LPODCP of 0.50) were reported as
presumptive positive by the 3M MDA Listeria monocytogenes
method with 67 test portions (LPODCC of 0.51) confirming
positive. Based on the valid data submitted from each of the
collaborating laboratories, three false-negative results and two
false-positive results were obtained resulting in 64 confirmed
positives (LPODC of 0.48). For the uninoculated controls, two
out of 132 samples (LPODCP of 0.02) produced a presumptive
positive result by the 3M MDA Listeria monocytogenes method
with one test portion (PODCC of 0.01) confirming positive. Each
discrepant result was produced by a different laboratory. Based
on the valid data submitted from each of the collaborating
laboratories, two false-negative results and one false-positive
result were obtained resulting in 64 confirmed positives (PODC
of 0.00). Laboratories 4 and 6 produced one false-positive result
and Laboratory 16 produced one false-negative result. For test
portions analyzed by the USDA/FSIS MLG method, 132 out
of 132 high inoculum (LPODR of 1.00) and 66 out of 132 low
inoculum test portions (LPODR of 0.50) confirmed positive. For
the uninoculated controls, 0 out of 132 test portions (LPODR of
0.00) confirmed positive.
For the low level, a dLPODC value of –0.02 with a 95% CI
of (–0.14, 0.11) was obtained between the 3M MDA Listeria
monocytogenes method and the USDA/FSIS MLG method. The
CI obtained for dLPODC indicated no significant difference
between the two methods. A dLPODCP value of –0.01 with a
95% CI of (–0.13, 0.12) was obtained between presumptive
and confirmed 3M MDA Listeria monocytogenes results. The
CI obtained for dLPODCP indicated no significant difference
between the presumptive and confirmed results using either
confirmation process.
For the high level, a dLPODC value of 0.00 with a 95% CI
of (–0.03, 0.03) was obtained between the 3M MDA Listeria
monocytogenes method and the USDA/FSIS MLG method. The
CI obtained for dLPODC indicated no significant difference
between the two methods. A dLPODCP value of 0.00 with
95% CIs of (–0.03, 0.03) was obtained between presumptive
and confirmed 3M MDA Listeria monocytogenes results. The
CI obtained for dLPODCP indicated no significant difference
between the presumptive and confirmed results. Detailed results
of the POD statistical analysis are presented in Table B and
Figures 2A and B of the supplementary materials.
Discussion
No negative feedback was provided by the collaborating
laboratories in regard to the performance of the 3M MDA
Listeria monocytogenes. Several laboratories reported difficulty
in isolating and identifying Listeria colonies on OXA from
samples enriched in the DF broth base (without FAC) when
compared to samples enriched in the AOAC 991.12 selective
enrichment broth. This may be related to differences in
formulation between the two enrichments. The AOAC 993.12
enrichment broth is designed to reduce the background flora on
OXA and is more selective than DF broth base (without FAC).
In some instances, this level of selectivity may cause stress on
Listeria cells, thus requiring a longer enrichment time to reach
a detectable level.
Based on the data submitted, two laboratories were removed
from statistical consideration for both the full-fat cottage cheese
and the deli turkey. For the cottage cheese, Laboratory 6 did not
follow the approved incubation time and temperature conditions
for the candidate method (samples were incubated for 48 h at
30°C, and the validated enrichment time and temperature are
24–28 h at 37°C), and Laboratory 12 confirmed growth from
all plates, regardless of supplementary tests that would have
precluded confirmation via API Listeria. Due to this fact,
all samples confirmed via API Listeria produced a Listeria
species result even if Gram reaction (Gram negative), motility
reaction (negative), catalase reaction (negative), and oxidase
reaction (positive) would indicate the organisms is not of the
genus Listeria. For the deli turkey, Laboratory 8 incorrectly
enriched half of their candidate method samples using the
reference method enrichment broth (UVM) instead of DF broth.
Laboratory 10 reported more confirmed positive results in
their uninoculated control samples (for both the candidate and
reference method) than for their low-level contamination level,
indicating a substantial level of laboratory cross-contamination.
Based on these results, these laboratories were removed
from statistical analysis. No laboratories were removed from
statistical analysis based on discrepancies between presumptive
and confirmed results.
During the collaborative study evaluation, seven falsepositive (three for full-fat cottage cheese and four for deli
turkey) and eight false-negative (four for full-fat cottage cheese
and four for deli turkey) results were obtained out of 792 total
test portions analyzed by the 3M MDA Listeria monocytogenes.
The candidate method correctly identified whether a test
portion was positive or negative more than 98.1% of the time
(false-positive rate of 0.9% and false-negative rate of 1.0%).
Several of the false-positive discrepant results were obtained
from uninoculated control test portions, and several of the
false-negative discrepant results were obtained from high-level
inoculated test portions, which may indicate that they are the
result of laboratory error and not performance of the assay. No
evidence of physical cause or suspicion of cause was noted, and
it was determined that these results would be included in the
statistical analysis.
For each matrix, the collaborative study indicated no
statistically significant difference between the candidate method
and the reference methods or the presumptive, and confirmed
results of the candidate method were obtained when the POD
statistical model was used.
Recommendations
It is recommended that the 3M Molecular Detection Assay
Listeria monocytogenes method be adopted as Official First
Action status for the detection of L. monocytogenes in selected
foods, including beef hot dogs (25 g and 125 g), deli turkey
(25 g and 125 g), cold smoked salmon (25 g), full-fat cottage
cheese (25 g), chocolate milk (25 g), and two environmental
surfaces, sealed concrete (sponge in 100 mL and sponge in
225 mL) and stainless steel (sponge in 225 mL).
992 Bird et al.: Journal of AOAC International Vol. 98, No. 4, 2015
Acknowledgments
We extend a sincere thank you to the following collaborators
for their dedicated participation in this study:
Peyman Fatemi and Sharon Spencer, Aemtek, Inc., Fremont,
CA
Joel Blumfield, EDL Labs, Inc., Purvis, MS
Adam Hankins, McCoy & McCoy Laboratories, Inc.,
Madisonville, KY
Rob Dermer, Natalie Shipley, and James Williams, Microbac
Laboratories, Inc., Fayetteville, NC
Ashley Morris, Robert Brooks, and Karen Powers, Microbac
Laboratories, Inc., Maryville, TN
Jerry Lynn Picket and Amanda Thielen, Tyson WBA
Analytical, Springdale, AR
Leslie Thompson, VANGUARD SCIENCES, North Sioux
City, SD
Chris Lopez, Alex Brandt, and Bharath Brahmanda, Food
Safety Net Services, San Antonio, TX
Luci Hardrath, AgSource Laboratories, Marshfield, WI
Yi Chen and Anna Laasri, U.S. Food and Drug Administration,
Center for Food Safety and Applied Nutrition, College Park,
MD
Robert Brooks, ATC Microbiology, LLC, North Little Rock,
AR
Diane Wood and Andrew Sweet, Maple Leaf Consumer
Foods, Guelph, Ontario, Canada
Carmen Chavarria, Luz Maria Cerda, and Barry Mailloux,
Maple Leaf Foods Consumer Foods, Ethel Laboratory, Toronto,
Ontario, Canada
Jean Schoeni, Covance, Inc., Madison, WI
Brian Kupski and Nicole Cuthbert, Silliker, Food Science
Center, Crete, IL
Ben Bastin, Q Laboratories Inc., Cincinnati, OH
We extend a special thanks to the following team members
at Q Laboratories, Inc. for their efforts during the collaborative
study: M. Joseph Benzinger Jr, Allison Mastalerz, Kiel Fisher,
Kateland Koch, Will Judd, and Nicole Klass.
References
(1) Centers for Disease Control and Prevention. http://www.
cdc.gov/mmwr/preview/mmwrhtml/mm6222a4.htm?s_
cid=mm6222a4_w (accessed September 2014)
(2) Batz, M.B., Hoffman, S., & Morris Jr., J.G. (2011) Ranking the
Risks: Food Combinations with the Greatest Burden on Public
Health, Emerging Pathogens Institute, University of Florida,
Gainesville, FL
(3) Official Methods of Analysis (2012) 19th Ed., Appendix J,
Methods Committee Guidelines for Validation of
Microbiological Methods for Food and Environmental Surfaces,
AOAC INTERNATIONAL, Gaithersburg, MD. http://www.
eoma.aoac.org/app_j.pdf (accessed July 2014)
(4) U.S. Department of Agriculture, Food Safety and Inspection
Service (2013) Isolation and Identification of Listeria
monocytogenes from Red Meat, Poultry, Egg Products, and
Environmental Samples, Microbiology Laboratory Guidebook,
Revision 8.09, Washington, DC. http://www.fsis.usda.gov/wps/
wcm/connect/1710bee8-76b9-4e6c-92fc-fdc290dbfa92/MLG-8.
pdf?MOD=AJPERES (accessed September 2014)
(5) Official Methods of Analysis (1999) Listeria monocytogenes
in Milk and Dairy Products, AOAC INTERNATIONAL,
Gaithersburg, MD, Method 993.12 (accessed July 2014)
(6) Official Methods of Analysis (2002) Aerobic Plate Count in
Foods, AOAC INTERNATIONAL, Gaithersburg, MD, Method
990.12 (accessed July 2014)
(7) Least Cost Formulations, Ltd, MPN Calculator-Version 1.6.
www.lcfltd.com/customer/LCFMPNCalculator.exe (accessed
September 2014)
(8) Official Methods of Analysis (2012) Gram-Positive Bacteria
Identification, AOAC INTERNATIONAL, Gaithersburg, MD,
Method 2012.02 (accessed July 2014)
(9) Wehling, P., LaBudde, R., Brunelle, S., & Nelson, M. (2011) J.
AOAC Int. 94, 335–347
(10) Least Cost Formulations, Ltd (2011) AOAC Binary Data
Interlaboratory Study Workbook. http://lcfltd.com/aoac/aoacbinary-v2-3.xls (accessed September 2014)