1
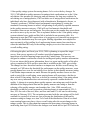
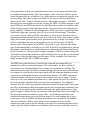
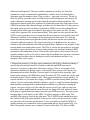
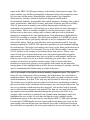
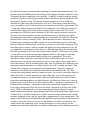
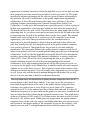
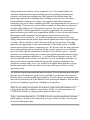
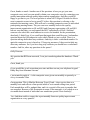
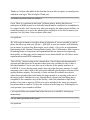
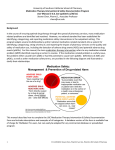
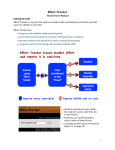
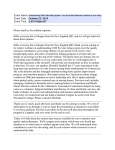
Event ID: 2647107
Event Started: 6/30/2015 3:47:56 PM ET
Please stand by for real time captions.
Welcome to the nursing home quality David -- data conference call. At this time all
participants are in a listen only mode and later we will conduct a question-and-answer
session. Please note that this conference is also being recorded. I would like to turn
the call over. Ms. Johnson you may begin.
Hi welcome and thanks for joining the webinar today. My name is Elizabeth Johnson
and I will be hosting today's program. This webinar is brought to you by mountain
Pacific quality health quality improvement network organization serving Alaska
Montana Wyoming and Hawaii and partnership with the queue I am QIO of the great
eight plus group which includes Colorado, Illinois, Iowa, Kansas, Minnesota,
Michigan, Nebraska, Nevada, New Mexico, North Dakota, Oregon, South Dakota,
Utah and Wisconsin. A few housekeeping items. The handouts for today's
presentation were distributed yesterday, Monday, on the 29th. If you have not
received them please contact your state QIO and you may e-mail me and I will send
them to you following the WebEx. I will put my e-mail address in the chat box as
soon as I am done. To enhance the learning experience, we will be muting all lines.
Please feel free to put any questions or comments in the chat box as we move along. I
would like to introduce our speakers today. Marilyn Reierson and Kelly O'Neill our
national leaders in the healthcare quality improvement. Together they provide
leadership for resting quality improvement and safety activities in nursing homes
across the country. Also key developers of tools and resources for QAPI but don't
blame them for the acronym. Thank you Marilyn and Kelly, passing the baton to you.
Great, thank you so much. We are pleased to be here today and we are going to be
exploring the three data sources that can support your quality improvement efforts
organizationally. As Weiser said my name is Marilyn Reierson and I'm pleased to
introduce you to my colleagues Kelly O'Neill and Jeanne Carls. We are members of
the national coordinating center and we support quality innovation network Quality
Improvement Organizations as well is nursing homes across the nation and improving
the quality of care and quality of life for nursing home residents. We are pleased to
have this opportunity to be with you today. The objective of the presentation today is
for you to be able to recognize, explain, and use several data sources to support
quality improvement efforts in your organization. First, gene will present the 5-Star
rating system and implication of the February 2015 updates. Then Kelly is going to
present helpful information about using some of the CASPER reports. And you will
hear from you little bit later in the webinar on the quality measure composite score.
Please feel free to participate using the chat feature throughout the webinar. We will
try to address your questions throughout the presentation and look forward to hearing
a little bit more from you on how you are using these various data sources to support
quality. Without further ado, let's hear from Jeanne Carls about the 5-Star ratings
system.
Hi, this is Jeanne. As you know, nursing home compare is a public reporting website
that includes detailed information about every Medicare or Medicaid certified nursing
home in the United States. It allows consumers, providers, state, and researchers to
compare information on nursing homes. Him the website gets more than 1.4 million
visitors per year. Public reporting and trends towards transparency with data are here
to stay. Knowing your data and how to use it for improvement efforts within your
organization is important. You may know that CMS added the 5-Star quality ratings
system to the CMS nursing home compare website in December of 2008. It was added
to assist the public in identifying meaningful distinctions among providers. The 5-Star
quality ratings system list and overall rating for each facility they stun facility
performance on three separate measures each of which has its own 5-Star rating. The
5-Star quality ratings system provides a summary of three dimensions of nursing
home quality, health inspection results, staffing data, and quality measure data. Let's
look at each of these in a little more detail. The health and inspections rating is based
on outcomes from state health inspections. These ratings are based on the relative
performance of facilities within a state. CMS chose to compare facilities to each other
within a state to help control for variation among states the results from different
management practices, differences in state licensing laws, and differences in state
Medicaid policies. The rating system reflects the finding of approximately 180,000
on-site inspections of nursing homes over the most recent three year period. Quality
measures are calculated using MDS assessments. Currently the quality measure rating
incorporates 11 different measures for nursing home residents. Eight our long stay and
three our short stay. The 11 core measures are calculated on the three most recent
quarters of available data reported by the nursing home. The staffing rating reflects
staffing levels based on the number of hours of care provided on average to each
resident, each day by nursing staff and the number of residents in the facility. CMS
aces facility staffing rating on two components. The number of registered nurse hours
per resident they and the staffing hours of RNs plus LP and plus nurse eight hours per
resident day. Staffing data are submitted by the facility and art case mix adjusted for
different levels of resident care needs. Nursing home with residence with more severe
needs would be expected to have more nursing staff than a nursing home where the
residents needs were not aside. Based on the 5-Star ratings for the health inspection
domain, the direct care staffing domain and the quality measure domain, the overall
composite rating is been assigned. In February of 2015, CMS announced an expanded
5-Star quality ratings system for nursing homes. Let's review the key changes. In
2015, CMS added to quality measures for antipsychotic medication use to the 5-Star
calculation. One measure for short stay and one measure for long stay residents. In
calculating use of antipsychotics, CMS excludes use of antipsychotic medications for
individuals who have been diagnosed with schizophrenia, Huntington's disease, or
Tourette's syndrome. CMS has raised performance expectations by raising the
standards for nursing homes to achieve a high rating on all publicly reported measures
in the quality measures category. CMS will use fixed numeric thresholds and
boundaries between me star categories. Providers can see the number they must obtain
an order to move up by one star. This is explained further in the 5-Star quality ratings
system technical users guide and this link is included in an upcoming slide. It is
important to note that CMS expects there to be progress over time and one progress is
achieved, the distribution may be reset again. Staffing algorithms were adjusted to
more accurately reflect staffing levels and nursing homes muster four stars him on
either the individual RN only or the staffing category to receive four stars on the
overall staffing rating.
Following the pilot, and fiscal year 2014, CMS is planning to expand the target
survey. State survey agencies will conduct specialized unannounced on-site
inspections of selected nursing homes across the United States. This process was
designed to enhance verification of both the staffing and quality measure information.
If you are interest did in more information, there is a report on the results of the pilot
survey completed in 2014 and five states that is available on the CMS .gov website.
The changes we have described can have an impact on a facilities overall rating. For
example, as CMS raises the threshold for performance on the quality measures, some
nursing homes have seen for me initially see a decline in their quality measures rating.
Until further improvements are made. Because the quality measure scores are also
used as part of the overall rating, some nursing homes will experience a decline in
there overall 5-Star rating. However, a decline in a nursing home 5-Star rating absent
any new survey information does not necessarily represent a sudden decline in
quality. A change in a nursing home quality measure star rating may result from the
addition of the antipsychotic data into the quality measure star rating or from the
rebasing of the quality measure star boundary line. Also, CMS currently sets
thresholds so that the overall proportion of nursing homes is approximately 25% 5Star, 20% for each of the two, three, and four stars and 15% one star for each rating
category in February 2015. The cut points associated with the star ratings will be held
constant for a period of at least one year, allowing the distribution of the quality
measures rating to change over time. Let's look at the distribution. Him as we noted
some nursing homes may have a lower overall rating after the recent changes to the
ratings system. This is a bar chart that compares the percentage of nursing homes in
each rating from April 2014 before the changes were made and in April 2015 after the
changes were made. The data is publicly available through the nursing home compare
site. Let's talk about how to interpret this chart. Looking at the bars labeled number
one for overall rating of one star you can see that in April 2014, about 10% of nursing
homes had an overall rating of one star. In April 2015, approximately 15% of nursing
homes had an overall rating of one star. The percentage of homes with ratings of two
and three stars overall are more similar all -- similar before and after the changes were
made. Fewer nursing homes have a rating of four star and 5-Star than before the
changes were made. If you look at the 5-Star rating, in April 2014, about 26% of
nursing homes had an overall rating of five stars. In April of 2015, approximately
22% of nursing homes had an overall rating of five hours. Of note, CMS is
implementing a system of quarterly electronic reporting that is auditable by referring
to payroll that will verify staffing information. This new system is expected to
increase accuracy and timeliness of data and allow for the calculation of quality
measures for staff turnover, retention, types of staffing, and levels of different types of
staffing.
Additional details are available on the calculation of the ratings system in CMS five
Star quality ratings system technical users guide. Available at the link on this slide.
Next, I will turn this over to Kelly to talk about CASPER reports.
Thanks Jeanne and hi everyone my name is Kelly O'Neill and I will provide a brief
overview him of the types of CASPER reports of able and suggest ways to use those
for quality assurance and performance improvement. I would encourage you to share
your thoughts and suggestions on using these reports through the chat function today.
I am sure that your colleagues on the call would appreciate hearing how you use the
reports, what do you find particularly helpful about them? And if you have any
questions, please enter those in the chat function as well, and we will get back to you
on those. CASPER is CMS reporting application and stands for certification in survey
provider enhanced report. Nursing homes access this application through the welcome
to the CMS system for providers page and then by selecting the CASPER reporting
link which is circled on the screenshot on this page. There are detailed instructions for
accessing and using CASPER reports. You can access the users guide for CASPER on
you're welcome page or at the link shown on the slide. A circle of the location for
choosing the different sections which are listed on this slide. I won't go into a lot of
detail today on the functionality of the sites, but know that the users guide is a great
resource. Once you have select did the Casper report -- CASPER reporting link you're
connected to the QI ES national system log in page. Quality improvement and
evaluation system. Him when you enter your login information the CASPER topic
homepage displayed as shown on the slide on the right. You can feelings to the
various functions available, such as logout, folders reports etc.. The main function will
focus on today is reports. These reports are really excellent resources for QAPI in
your organization to help you understand areas where you are doing well and where
you might need improvement. The report category came on the left with the various
report categories that are available to you. Some reports are restricted to specific users
or user groups. The report categories available to you may be different from those
shown on this slide. Today I will talk about two other report categories. The MDS
three-point oh, nursing home or provide a report, the MDS 3.0 quality measure or QM
report. When I select MDS three-point oh, and H providers cannot be available report
in that category appear in the right pane and the 14 reports listed in the right pane are
pretty standard -- standard for all nursing homes. When you select a report from those
listed in the right pane, generally you will see a criteria selection page. That allows
you to enter criteria. Often you'll have the choice to select from a drop-down list of
reporting timeframe options such as prior year, fiscal year today, prior quarter, month
today, prior month, prior business week, prior business day or today for example. You
select be timeframe that you are interested in for your chosen report. I'll briefly
discuss each of these reports in the MDS 3.0 and each so you can get an idea of the
type of information that is available to you. 0003 B and 4 D are produced as a package
and improve provider history, profiles and survey information including deficiencies
for the current year. The users guide contains examples of all these reports along with
a description of each data elements or fields included in the report. Here is an example
of page one of the provider history profile report. All the examples I will show you
today are taken from CMS CASPER user guide.
The MDS three-point oh activity report list the expected assessment that you
submitted as well as in activation request. This report can be useful to evaluate if
assessments were submitted and also to evaluate your workload and staffing. The
admission/reentry report. Resident submitted during your chosen time period and can
be compared to your facility roster report which will talk about an imminent to make
sure each new resident has an entry accepted in the database. The MDS assessment
with error numbers allows you to select error numbers you want to study. You can
select up to five error numbers and then select a time period and you'll get a detailed
list of assessments submitted with your specified error numbers. You might for
example look for a fatal error such as inconsistent reasons for assessment. This report
can help you determine which assessments need to be corrected and resubmitted, can
help you look for problems that could be addressed with additional training or other
types of support. And to identify any software related problems. Here's an example of
the assessment with error number reports. Him -- the discharge report lists your
resident discharge during your selected time period. You can compare this to your
roster report to see if residents discharge assessments were accepted in the database.
The error detailed by facility report shows errors encountered in successful
submissions, and it can be used to identify errors that I are occurring and these can be
used in your QA and QI initiatives to determine if there are processes that need to be
addressed and improved. The error number summary by facility, by Van door
summarizes errors on assessments submitted by vendors and it can be helpful to
determine specific member issues. That you have -- cap work to resolve. The air by
field, by facility report list errors in fields of successful submission, and can also be
used to determine training needs and to identify potential software problems. The
missing assessment report lists residence for whom the target date of the most recent
OBRA assessment other than discharge or death record is more than 138 days prior to
the report and it also list's residence for whom no OBRA record was submitted for a
current episode that began more than 60 days prior to the report run date. In other
words, there appears to be an assessment thing. This report can also provide data for
QAPI to assess your processes to ensure that all assessment are successfully done and
submitted. And here is an example of the missing assessment report. The nursing
home assessment prints report provides details on the most current assessment for a
selected resident assessment. This report can help you to problem solve any issues
related to what was submitted for each assessment item. And here is an example of the
nursing home assessment prints report. The RFA or reason for assessment or accepted
assessment report can help you to assess and evaluate your workload related to MDS
assessment and submission activity. Him and he roster report can be used to list your
current residence and as a QA tool to ensure that all residents have an entry record and
all discharged residence have a discharge record in the database and here is an
example of the roster report.
P submission statistics by facility report summarizes the facility submission during a
specified period and also useful to evaluate workloads and MDS assessment
processes. And just a couple more left in this category. Here is an example of the
submission statistics by facility report. You may not have access to this report or to
information about other facilities if you are part of a single facility reporting. And
lastly in this category, the MDS three-point oh vendor list. The vendor list can be used
to identify active vendors within a state. I have gone through these pretty quickly, 14
reports available to you under the category of MDS report no nursing home provider
reports. If you're not already familiar with these reports, I would recommend printing
them and then studying them to understand the subtleties or differences among the
reports. And you will get a feel for what the reports can tell you, and how they can
help you to better understand the areas that you are doing well with, and areas where
there may be opportunities for improvement in your MDS processes. The next report
category that we will discuss is the MDS 3.0 quality measure or QM report. The
available QM report is listed in the right pane. The CASPER users manual describes
the content of the QM report and how to access but it does not discuss how resident
are selected or the measure specifications. Users are asked to consult the MDS 3.0
quality measure users manual in order to understand and use these reports fully. The
link to the quality measure users manual is listed on this slide. The first available
report in the MDS 3.0 QM report category is the facility characteristics report. This
report contains your facilities demographic information along with comparative data
for your state and the nation. Demographics include gender, age, diagnostic
characteristics, and those include a psychiatric diagnosis, intellectual or
developmental disability, demographic also include prognosis, discharge plan, referral
status, psychometric, admission or reentry, and where residence enter the to solidify.
This is a great report to quantify your resident characteristics and help you to
understand your population. And can help you to focus efforts on areas important to
your residence. Here's an example example of a facility characteristic report. This
facility seems to have more younger male residence and more with a psychiatric
diagnosis as compared to the state and the nation. That information is highlighted in
blue for E's of noting be example. The QM reports available in CASPER are a great
source of current data on your quality measures as well as comparative data for your
state and the nation. There are currently three short stay measures and 14 long stay
measures reported in CASPER. This report also provides you with a national ranking
for each measure. The higher your ranking, the worse you are doing on the measure in
comparison to the nation. For example if you are in the 85th percentile, it means that
85% of facilities in the country are performing better than you are. This is a nice
report to help you at a glance determine areas of potential opportunity for quality
improvement. Your organization may have set goals for each measure and this can
help you assess where you are at in terms of meeting your goals. Him -- here's an
example of a facility level quality measure report. And you can see that three
measures are being in the lowest or worst quartile in the nation for this particular
nursing home. I have highlighted them in blue for ease of noting be example. And this
may be an indication that further study is needed in this area.
Here is an example of the quality measure monthly comparison report. This report
allows for easy comparison of the percentages for each measure for a specified sixmonth time frame. Since the report is intended for public use, data for measures with
small denominators, less than 30 for long stay and less than 24 short stay are contrast.
The resident level of quality measure reports list both active and discharge residence
that were included in the calculation for the measure for your chosen time period. You
can see by residence which measures they triggered. You can also look by measure
and see which resident triggered each measure. The data are very timely and include
any updates from assessment submitted through the previous week. Here is an
example of the resident level included in the dynamic then denominator and I have
highlighted the axes in blue. He also have the option to select multiple quality
measurement reports of the same time by selecting the MDS 3.0 QM report package.
Even though CASPER quality measure reports and nursing home care report use the
same sample selection and measure specification, there may be differences between
the results that are reported by the two systems and there are several reasons which we
will talk about on this in the next slide. Nursing home compare and CASPER each
contains some unique measure. Nursing home compare short and long stays and that
are not included CASPER measures include fall anti- anxiety or hypnotic use and not
in nursing home compare. Another reason for differences is that nursing home
compare data are run once a quarter. Where is the CASPER quality measure data are
updated more frequently. Therefore likely that the assessment database changed
between the time that the nursing home compare statistics were computed in the time
the CASPER quality measures were computed. Also, every quality measures based
upon the selection of a target assessment. So for nursing home compare, the target
assessment must have a reference date within the most recent three months measure,
or the most recent six months or short stay measure. On the CASPER QM report you
are allowed to customize the length of the selection period. So if the selection period
you select are different from those used for nursing home compare, the results may
differ. And a couple more reasons for differences. The results that are presented on it
nursing home compare are averaged across several calendar quarters while the results
on the CASPER QM reports are only for a single reporting period. Him and finally
one of the factors used in the risk adjustment computation is the national average for
the quality measure at the time of calculation. Since the calculations are usually
performed at different times for the two systems, the national means may differ in the
percentages may be different in the reports.
If you have technical questions about CASPER reports, the QIES technical support
office can help. Their information is him the slide and I found them to be very
responsive and able to sort through very detailed question so feel free to reach out to
them. In summary, MDS assessments are a powerful tool to facilitate care
management in nursing homes. They are part of key organizational systems and
processes and as such, they should be reviewed and included in QAPI efforts in the
organization. CASPER reports are a rich source of data to help you assess and
enhance your processes to conduct and use MDS assessments. The reports including
comparative data can guide you to areas that need further study or improvement. And
I would like to thank Sam us, and [ Indiscernible ] for informational is used in this
presentation and now I will turn it back to Maryland to talk about the quality measure
composite score.
Thanks so much Kelly. Another data source that can support your quality
improvement efforts within your organization is the quality measure composite score
data available through your and organization and to monitor progress of the National
Nursing Home Quality Care Collaborative that all of you have heard of. So today I'm
going to share a little bit of basic information about the construct of this score and
how it can be used by your organization so what do we mean by the term composite? I
did a quick web search and came up with a couple variations on the definition. Made
up of different parts or elements and consisting of separate interconnected parts. To
me these help and thinking about the makeup of the quality measure composite score.
The quality measure composite score includes 13 publicly reported long stay quality
measures. Together or all of them combined these measures represent processes and
interrelated systems of care. The quality measure composite score is really not
intended to replace any other data source such as a 5-Star rating system that really
serves as another way to look at quality from a systems perspective organization. The
13 long stay quality measures included in the composite score reflect percentages of
residents that trigger each of the quality measures listed on the slide. The lower
percentages are really the desire outcomes of all of the quality measures except the
last two on the slide and those are the vaccination measures. On those two higher
percentages are better him as more residents are vaccinated. The facility level quality
measure data is derived from the NDS 3.0 and that data for those data sources are
extracted out a monthly basis and we look at a six-month time period at a time and
look at rolling six-month period. I will show you that on a data slide coming up. But
these data sets are what is used to calculate the quality measure composite score. So
you might also be interested to know there is a little bit more than two months delay
from the last month of the time period so the data is actually a little more recent than
you are able to access on nursing home compare which is why again it is just one
more data source to think about quality within your organization. The actual
calculation of the composite score might be more detailed than some of you are
interested in but we do get some questions on it so some others of you might like to
know the formula. That is included on the slide. First to calculate the composite score,
numerators and denominators are added together from all 13 quality measures. That
becomes the composite score numerator and denominator. Next they composite
numerator is divided by the composite denominator and multiplied by 100. That
becomes the actual quality measure composite score. So you may remember when we
talked about the 13 quality measures a couple slides ago, two of the measures, the
vaccination measures, our directionally opposite which means that before all these
numerators and denominators are added together, the direction of those two vaccine
measures are reversed. Just so you know that is taking -- taken into consideration. By
keeping all the measures -- the measure directions consistently composite door -score can be interpreted did as the lower the better. Nationally 6.00 has been is that
list by CMS as a benchmark so it is becoming the goal that is adopted by many -many nursing homes that are participating in the National Nursing Home Quality Care
Collaborative. I would encourage you to know your own composite measure, quality
measure composite score, and set a goal that is appropriate for your organization. This
graph on this slide shows an individual nursing home quality measure composite score
overtime. Along the left or y-axis you see the numbers 10 all the way down to zero
which reflects the composite score. Along the bottom or x-axis you can see the
months representing the end of the six months rolling time period. And this particular
organization is trending line and is reflected in light blue so you can see that over time
there composite score has moved from just above seven to just under six. This graph
actually also includes information for the collective group of homes participating in
this particular QI end QIO collaborative or the quality improvement organization
collaborative. It also reflects the homes in the entire state, and there is also a line
reflecting all homes participating in the National Nursing Home Quality Care
Collaborative. It really gives that nursing home a good perspective of what is going on
in their own organization, at the local level within the state and at the national level.
The dotted red line is the goal of 6.00. This slide shows the same graph with all of the
supporting data. As you can see each quality measures listed to the left and to the right
be supporting data for each of the trendlines that is on the above graph. This example
features some color coding of red, if you look over at the composite score for this
organization, a list color coding of read that reflects the continued need for
improvement or focused attention to achieve the goal and then as they achieve the
goal, they actually have the font changed to green as the quality measure composite
score goal was achieved. That might be one way to look at your data within the
organization. This next graph illustrates the quality measure composite score for all
homes in the nation for several six-month period leading up to the start of the national
collaborative. You'll see that this graph does not actually have all of the information
needed to show when the launch of the national collaborative is starting, which was
April of 2015. That CMS will be closely monitoring this data as it is updated to
include continuing progress for all of the owns participating in the national
collaborative. It is a great trending graph that we will be able to keep an eye on. As
you can see by this graph, in the autumn, there is actually notable movement upward.
And this we see in the data every year. This is largely because of the construct of the
influenza vaccination measures. You will actually notice and uptake in your own data
as well. So not only well that trend be national during the fall months, but you will
also see it in your own data so don't be too alarmed about that.
This next graph shows the distribution of quality measure composite scores for all
nursing homes in the United States. and the Y axis you can see the percentage of
homes and along the bottom or the x-axis is the quality measure composite score
reflecting a low point of one or lower all the way up to a high of 20. Composite
measure score of 20. So the national goal line is shown there and read. It is the 6.00.
And the idea or goal is to see movement on this graph over time move towards the left
since we know that lower is better on the composite measure score. This graph shows
us that as of January of 2015 nearly 13% of homes across the nation were at or below
the goal of 6.00, which is great. Within your own organization, the quality measure
composite score can be used your team to start talking about how your own processes
and systems of care impact quality of life and quality of care for the residence. And
impact your own staff. You might brainstorm what could help improve all of the
quality measures and lead to a lower composite score. For example things like
consistent assignment focusing on staffing practices including recruitment and
retention, and some other examples not listed on this slide include things like
improving teamwork and communication, building on your own use of evidence based guidelines or practices to enhance care practices and clinical measures.
Improving your use of either completing the MDS assessment and also the process of
care planning. Those processes are just other examples of things that are systems of
care that might influence all of the quality measures. You can also use the data to
identify specific clinical opportunities or specific opportunities for performance
improvement projects within your organization. Really it is just one more data source
that supports quality assurance and performance improvement within your
organization so we would get -- we would encourage you to obtain it from your
quality innovation network quality improvement organization and to begin tracking it
over time. Him we did leave a bit of time here at the end for questions. We really
appreciate the opportunity to share more about the 5-Star rating system, CASPER
reports and the quality measure composite score. We do have time for some questions
and would encourage you to not ask any facility specific questions as we don't have
access to facility specific information at this time. If you do have spaces -- specific
questions we would encourage you to contact your quality innovation network polity
improvement organization and there is -- you should know who that is but we will
also post that link on the website or in chat here if you're not familiar with that is so
that you can contact them and obtain facility specific question information. Our
conference operator today is Joe. Joe, would you let people know how they can get
into the queue and for those who don't want to get in the queue feel free to enter
questions in chat.
We will now begin the question-and-answer session. If every question press star and
then one on your telephone keypad. If you would like your question to be removed
from the queue, press the pound sign or hash key. If you're using a speakerphone you
may need to press this pick up the handset before pressing the numbers. Star and then
one on your telephone keypad now. Standing by for questions.
While we are waiting for questions we do have a couple in the chat function so we
will go ahead and start to address some of those. Kelly, one of the questions is on
CASPER and whether it is being used for home health or oasis.
That is a good question and it is. CASPER is also the reporting application for home
health agencies. So that is also where they go to get a variety of oasis -based reports
for home health agency data.
Great, thanks so much. Another one of the questions is how you get your own
composite score, and you can actually obtain your composite score by contacting your
quality innovation network quality improvement organization. And they would be
happy to get that to you. The next question is when will Telligen Colorado be able to
semi- composite scores to her to spend? I believe this question is referring to the
national court meeting center. Who will not be sending composite scores to individual
participating nursing homes. They are sent on a monthly basis to the quality
improvement organization or QI end/QIO and if anyone representing a QI end/QIO
has not seen that data, you can contact the MCC individually off-line. And then
someone else asked the e-mail address to receive the handout for the presentation,
absolutely, I think Liza, if you could post that again that would be great. And another
question about the QM composite score which I think we just covered. There is a
question asking about short stay residents. And why is there a calculated number. So
again the composite score is based on 13 long stay measures. It does not include any
short stay measures. So if you have long stay residents you should have a calculated
number. And Joe, other any questions in the queue?
Kelly Peterson.
My question has RD been answered, I was just wondering about the handouts. Thank
you.
Great, thank you.
If you would like to ask a question press star and then one on your telephone keypad.
Kathy Ray from Montana veterans.
I just wanted to make it -- is the composite score given our monthly or quarterly or
every six months? Him
Great question. This is Marilyn Reierson. Your QI end -- does receive data on a
monthly basis and reflects a time period which is a six-month rolling time period.
Each month there will be updated data, and it is a period of the past six months that
one snapshot. Because of the fluctuation in some of the measures, it is looked at on a
six-month basis instead of individual one month time period. Does that help?
Yes. And then could we expect the report monthly from our quality improvement
organization or every quarter?
Great question, and I am not sure that that is been done consistently across quality
improvement organizations so I would encourage you to reach out to them directly for
the answer in your area. Mac thank you.
Julie [ Indiscernible ] please go ahead.
Hi Julie.
Can you hear me now? I was just wondering if there is any discussion going on that
you are aware of the quality measures some of those stay on there for a whole year
plus when people pass away and I can thing. Any discussion happening about
changing any of those parameters on the quality measures on the individual ones?
Falls an injury or false or any of the others?
That's a good question. This is Kelly. We aren't aware of discussions that are
occurring at CMS about that, but it doesn't mean that they are not happening. I would
encourage you to submit those types of questions to your QIO. They can share them
with us and we can add them to the TMS potential discussion list. It is a good
question. I know that does come up a lot and it impacts your reports.
Thank you.
I was just going to say Kelly there is an additional question and chat about the login
and password on CASPER. Is there one login per facility or can multiple people be in
that?
That's a good question. Let us double check and we will get back to on that. And if
anyone else knows that in chat if you have multiple logins at your facility and know it
is possible, let us know that.
Great, go ahead Joe, the next color?
Cap the [ Indiscernible ] from [ Indiscernible ].
We just chatted that question and it was answered, just wanted to find out who can
print reports.
Great, glad it was answered. Thanks.
Thank you.
Thanks to Carlene who added in the chat that she was able to register a second person
with their own login. That is helpful. Thank you.
No further questions from the audience.
Great. There is a question in chat from Val about what a facility that does not
participate in Medicare and is on federally loaned land be considered as a candidate to
be a target facility. And I am not sure what you mean by the phrase target facilities, so
would encourage you to get in the phone queue and help us to be able to answer your
question. Joe, any other colors in queue at this time?
No questions.
We will wait a moment in case they chime in otherwise if you are not able to call in,
please do follow-up with your QI end -- QIN/QIO in your area and we will definitely
get an answer to you on that. Him maybe just to clarify, if it is to be an organization
participating in the National Nursing Home Quality Care Collaborative, that is open to
all nursing homes or long-term care organizations that are interested in improving
their quality, so there may not be composite score data available for all if there are no
requirements around MDS submission.
This is Kelly, I want to jump in for a minute here. One of the people documented a
question and chat about we do not have short-term stay residents so why is there a
calculated number? Just in case that was in reference to the quality measures in
CASPER, if you are having some people show up in the short stay measure, I would
encourage you to take a look at the users guide and talk you through a selection of the
quality measure samples. So basically, it starts out that all residents are selected
whose latest episode either ends during the target period or is ongoing at the end of
the target period. And then for every episode that is selected, the next thing that is
computed is the cumulative days in the facility. And if the cumulative days in the
facility is less than or equal to 100 the rest and is included in the short stay measure
but greater than or equal to 101 days the resident is in the long stay. If that applies to
your question I just wanted to add that.
I just reposted that user manual link in the chat area so it should be showing up
momentarily.
Joe any other questions in the queue?
No questions.
Okay, we so much appreciate the opportunity to share a little bit more about various
data sources that can support your quality improvement initiatives. We would ask that
you take an opportunity to complete the polling question so on the right-hand side of
your screen, you should see a little arrow that indicates the polling section. Just a few
short questions and we would ask you to complete that today and press the submit
button. And thank you so much for your time. We appreciate your participation.
Thank you.
Thank you ladies and gentlemen. This does conclude today's conference. Thank you
for participating, and you may now disconnect. [ Event Concluded ]