1
FACTORY AUTOMATION
MANUAL
Software
VCS2-Config
in its most recent version as well as the supplementary clause: "Expanded reservation of proprietorship"
08/29/2008
The General Terms of Delivery for Products and Services of the Electrical Industry, published by the Central
Association of the Electrical Industry (Zentralverband Elektrotechnik und Elektroindustrie (ZVEI) e.V.)
Date of issue
With regard to the supply of products, the current issue of the following document is applicable:
User Manual
VCS2 Sensor Software
1
SOFTWARE „VCS2-CONFIG” ................................................................................................................ 3
1.1 SOFTWARE INSTALLATION ......................................................................................................................... 3
1.2 OPERATION................................................................................................................................................ 3
1.2.1
Selecting communication interface ................................................................................................. 3
1.2.2
Sensor configuration ....................................................................................................................... 6
1.2.3
Teaching In Colors ........................................................................................................................ 16
1.2.4
Color processing ........................................................................................................................... 20
1.2.5
Service ........................................................................................................................................... 23
2
COMMUNICATION PROTOCOL AND COMMAND REFERENCE .............................................. 25
2.1 PROTOCOL STRUCTURE............................................................................................................................ 25
2.1.1
Burst Mode .................................................................................................................................... 26
2.1.2
Fixed point notation ...................................................................................................................... 27
2.2 COMMAND REFERENCE............................................................................................................................ 28
2.2.1
System Identification ..................................................................................................................... 28
2.2.2
Communication ............................................................................................................................. 29
2.2.3
Data Acquisition............................................................................................................................ 30
2.2.4
Sensor Correction ......................................................................................................................... 32
2.2.5
Color Transformation ................................................................................................................... 33
2.2.6
Color Table, Color Recognition/Classification ............................................................................. 34
2.2.7
Output Encoding ........................................................................................................................... 36
2.2.8
Flash Operations and Parameters ................................................................................................ 37
3
LABVIEW® VIS ........................................................................................................................................ 39
3.1
3.2
3.3
4
STRUCTURE OF COMMAND VIS ................................................................................................................ 39
OPEN RESOURCE VI AND CLOSE RESOURCE VI ...................................................................................... 39
EXAMPLE ................................................................................................................................................. 40
DLL FUNCTION LIBRARY ................................................................................................................... 42
4.1 INTRODUCTION ........................................................................................................................................ 42
4.2 LIBRARY FUNCTIONS ............................................................................................................................... 42
4.2.1
Library .......................................................................................................................................... 42
4.2.2
USB Library .................................................................................................................................. 42
4.2.3
Devices .......................................................................................................................................... 43
4.3 FILES ....................................................................................................................................................... 45
4.4 REQUIREMENTS ....................................................................................................................................... 45
Rev. 4.8 (2008-05-13)
22-3061-11
Subject to change
-2-
User Manual
VCS2 Sensor Software
1 Software „VCS2-Config”
The sensors can be extensively configured by PC software. Therefore software tools are shipped
with the sensors for individually adjusting the sensors to any operational environment. The
software functions are as follows:
•
•
•
•
Sensor parameter configuration (signal gain, scanning frequency, processing mode etc.)
Color sampling (“Teach In“) procedure
Color processing (Recognition and classification)
Displaying of color values
The function is described in detail in the following sections.
1.1 Software installation
The software requires the following minimum system parameters:
•
•
•
•
•
•
•
•
PC with 300 MHz CPU
40 MB free hard disc space
Mouse
RS232 interface
USB interface for sensors with USB option
CD-ROM drive
VGA graphic with minimum resolution 800x600
MS Windows® OS (WIN98, WIN ME, WIN2000, WIN XP)
For installation insert the CD-ROM in the CD-ROM drive and follow the installation instruction
on the screen. Or, alternatively, start the program “SETUP.EXE“ from the folder
[CD drive]:\VCS2-CONFIG .
1.2 Operation
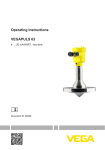
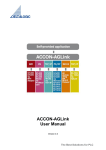
1.2.1 Selecting communication interface
The sensor system can be connected via RS232 or USB1 to the computer. Which interface is
going to be used has to be selected right after starting the program (Figure 1).
SERIAL CONNECTION
The configuration of the serial interface is placed on the left hand side. The communication port
can be chosen in the field “SELECT COM PORT“ (Figure 1). With “ADDRESS” the
corresponding sensor address can be chosen if several sensors are connected to the serial port
(refer to “SENSOR ADDRESS” below in section “SERVICE”).
Hint:
The software is limited to the COM ports 1 to 9.
1
Only available for sensors with USB port.
Rev. 4.8 (2008-05-13)
22-3061-11
Subject to change
-3-
User Manual
VCS2 Sensor Software
Figure 1: Selecting the RS232 interface port
By default the communication port is configured as follows:
•
•
•
•
•
Baud rate: 28800
Data bits: 8
Parity: no
Stop bits: 1
Flow control: no
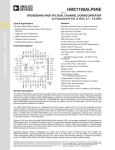
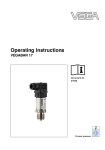
Figure 2: Start window
Status and error information are displayed in the text box “STATUS SERIAL“ below the button
“GET ID“.
Rev. 4.8 (2008-05-13)
22-3061-11
Subject to change
-4-
User Manual
VCS2 Sensor Software
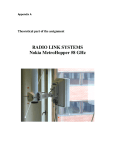
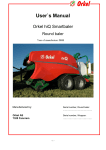
USB CONNECTION2
The program can be started via USB on the right hand side when a USB interface is available.
The number of detected devices is shown in the field “DEVICES DETECTED”. The desired
USB device can be chosen with the switch in the field “SELECT USB DEVICES” (Figure 3).
Figure 3: Selecting the desired USB device
SERVICE
With this switch within the field „SERVICE“ a service tool is started, which allows certain special
hardware functions and settings. The function are described in Section 1.2.5 (P. 23).
2
Only available for sensors with USB port.
Rev. 4.8 (2008-05-13)
22-3061-11
Subject to change
-5-
User Manual
VCS2 Sensor Software
1.2.2 Sensor configuration
The parameter window appears (Figure 4) after choosing a connection at the start of the program.
The parameter window can always be found under the tab “SENSOR PARAMETERS“ (in the
upper area of the program window). The sensor parameters are read out and displayed in the
program window.
Figure 4: Window for sensor parameter configuration
COLOR OBJECT TYPE
At first the type of object that is going to be measured has to be selected in the field “COLOR
OBJECT TYPE“ (Figure 5). The adjustment “ACQUISITION OFF” turns the signal acquisition
of the sensor off.
For self shining objects, such as lamps, LEDs etc. choose the “ACTIVE“ mode, for non selfshining objects, also called “Body Colors” choose the “PASSIVE“ Mode”. The latter are socalled body colors and are illuminated by a light source from the sensor system. Otherwise the
light source is switched off.
Figure 5: Selecting the object type
There are 4 additional “EXT.” modes, that are intended to be used with an external trigger
source to be provided on the “TRG 1” input. With this modes the sensor can be synchronized
with an external frequency. The modes with the “INV.” addition invert the TRG 1 signal.
Rev. 4.8 (2008-05-13)
22-3061-11
Subject to change
-6-
User Manual
VCS2 Sensor Software
For self-shining objects an ambient light compensation can be realized. For non-self-shining
objects a “Master-Slave” operation can be realized in that way that one sensor is switched to the
“PASSIVE” mode and all other sensors are adjusted to the “PASSIVE EXT” (or “PASSIVE
EXT. INV.”) mode. The master-slave operation is particularly useful for avoiding light
interfering effects if several sensor are used in close proximity. Additionally differential a signal
processing with to sensors is possible.
INTENSITY3
With the intensity regulator the brightness of the built-in light source can be adjusted.
SIGNAL GAIN3
The amplification gain (out of 4 gains) of the color signals from the primary color sensor can be
selected in the field “SIGNAL GAIN“ (Figure 6).
Figure 6: Selecting signal amplification gain
AUTO SET GAIN3
The amplification gain and illumination intensity can be automatically adjusted when the switch
in the “AUTO SET GAIN” field is set on. The signal range will be set to approx. 90% of the
entire range.
Hint
Before successfully applying the function “AUTO SET GAIN”3 it has to be verified that the
sensor system has been put in its operating point and the distance between sensor and objects
has been fixed. It is recommended that a white colored object or an object with the highest signal
amplitude (brightest object to be measured) is to be used for adjusting the signal amplification
gain and further to prevent from overdrive.
COLOR SPACE MODE
The color space which will be used throughout the color measurement is selected in the field
“COLOR SPACE MODE“. Depending on the light control setting, one of the following color
spaces shown in Table 1 can be selected. Figure 7 shows the selection field in the field “COLOR
SPACE MODE“.
Figure 7: Color space modes
Table 1: Color spaces depending on the two types PASSIVE and ACTIVE
PASSIVE (Body colors)
XYZ
3
ACTIVE (Self-shining)
XYZ
Only available for sensors with USB port.
Rev. 4.8 (2008-05-13)
22-3061-11
Subject to change
-7-
User Manual
VCS2 Sensor Software
xyY
L*a*b*
L*u*v*
Lab99
xyY
u’v’L*
Hint 1:
Due to the limited hardware accuracy of the sensor and the used non-standard illumination
source (white light LED), the obtained color values in the corresponding color spaces are not
colorimetrical accurate!
Hint 2:
The ranges of the color values in the parameterization software differ from the common
ranges for color values! Table 2 shows the range of the color values for the several color space
modes of the software in comparison to the common ranges. The visible range of the color
diagrams is pre-defined to a suitable value. To fit the color diagram scales to the desired
range, the axes can be adjusted by simply editing the numbers on the corresponding
axes.
Table 2: Axis scaling for the parameterization software
Color space
XYZ
xyY
L*a*b*
L*u*v*
u’v’L
DIN99
common range
X: 0…100
Y: 0…100
Z: 0…100
x: 0…1
y: 0…1
Y: 0…100
L*: 0…100
a*: -500…+500
b*: -200…+200
L*: 0…100
u*: -1300…+1300
v*: -1300…+1300
L: 0…100
u’: 0…1
v’: 0…1
L: 0…100
a: -500…+500
b: -200…+200
program range
X: 0…100
Y: 0…100
Z: 0…100
x: 0…100
y: 0…100
Y: 0…100
L*: 0…100
a*: -500…+500
b*: -200…+200
L*: 0…100
u*: -1300…+1300
v*: -1300…+1300
L: 0…100
u’: 0…100
v’: 0…100
L: 0…100
a: -500…+500
b: -200…+200
Multiple
1
1
1
100
100
1
1
1
1
1
1
1
1
100
100
1
1
1
REFERENCE WHITE
For storing a color value as reference white the actual sensor signals can be sampled in by
clicking on the button “SAMPLE” in the field “REFERENCE WHITE”. The signal settings
should have set with the GAIN and INTESITY function before sampling the reference white. It
is also recommended to use a white colored object for reference. The function “AUTO SET
GAIN“ can simplify adjusting the signal range. The button “DEFAULT“ sets the color values
for reference white to 100.
Rev. 4.8 (2008-05-13)
22-3061-11
Subject to change
-8-
User Manual
VCS2 Sensor Software
The color values for reference white can also be manually manipulated by clicking on the number
and than editing.
Hint 1:
The reference white is crucial for color measurements and displaying and therefore has to be resampled at any time when the signal settings, such as gain (AUTO SET GAIN) or light intensity
(LIGHT CONTROL - INTENSITY), have changed.
Hint 2:
The reference white is required for proper displaying the color on the monitor and not needed
for further signal processing in the color spaces XYZ and xyY. On the other hand, the reference
white is needed for a correct color transformation into the color spaces L*a*b*, L*u*v* and
Lab99. Therefore sampling of real sensor values is recommended for the color spaces L*a*b*,
L*u*v* and Lab99. However the sensor works acceptable even though a reference white has not
been sampled as long as the color values do not exceed the pre-defined reference white. In
general the sensor works fairly well when using the default (“DEFAULT“) reference white.
PROCESSING MODE
The sensor system provides up to 5 different signal processing modes. The desired mode can be
selected in the field “PROCESSING MODE“ by the menu shown in Figure 8.
Figure 8: Processing modes
Table 3 shows all processing modes and their description in detail.
Table 3: Processing modes and description
Processing mode
CLASSIFY
CHECK SPH.
CHECK CYL.
Rev. 4.8 (2008-05-13)
22-3061-11
Description
The actual measured color value is being classified among presampled color values. A classification is always done independently
if the colors match or not. As an example shows, if there is only one
color RED stored, all colors will be later classified as RED. Figure 9
shows the classification of the actual color value Cm to the stored
color C3 because the distance between Cm and C3 is the smallest
one.
In the mode CHECK SPH. (spherical) it is to be checked if a
measured color is within a spherical tolerance room. If the measured
color is within such a spherical room, the check is successful (color
recognized), otherwise the check was unsuccessful (color not
recognized).
Figure 10 shows spherical tolerances and a measured color Cm that
is within the tolerance C3 and hence was recognized as the color C3.
The mode CHECK CYL. (cylindrical) provides a method for
assigning cylindrical tolerance spaces. Tolerance parameters can be
configured separately for color and brightness. The measurement
principle is shown in Figure 11. Two tolerance parameters (color
and brightness tolerance) are necessary. This mode can not be
applied in the XYZ color space because there is no coordinate for
Subject to change
-9-
User Manual
VCS2 Sensor Software
Processing mode
Description
brightness.
Figure 9: Color classification principle
Figure 10: Color space with spherical tolerances
Rev. 4.8 (2008-05-13)
22-3061-11
Subject to change
- 10 -
User Manual
VCS2 Sensor Software
Figure 11: Color space with cylindrical tolerances
RESULT FORMAT
The user defines in the field “RESULT FORMAT“ how the results of the color checking or
classification are represented at the outputs of the color sensor. Figure 12 shows the 6 possible
output formats and Table 4 shows their descriptions in detail.
Figure 12: Color processing result formats at the sensor outputs
Table 4: Output formats for color checking and classification
Selection
OFF
ONE HOT
ONE HOT INV.
BINARY
BINARY INV.
DEVIATION4
4
Description
The outputs keep their last result and are switched off.
This is a “1-out-of-N” encoding. Each color value in the internal color
table (please refer to sect. 1.2.3, subsect. “COLOR TABLE”) is directly
assigned to one output signal. Thus there are as many colors possible as
sensor outputs are available.
Refer to “ONE HOT“, but output signals are inverted
The result is encoded binary and thus 2n (n = number of sensor outputs)
states are possible. The index 255 is used as “Not recognized” or “Out
of tolerance” in the CHECK mode.
Refer to “BINARY“, but output signals are inverted
If no matching color can be found, this result format indicates the colordeviation from the first entry of the color-table. The meaning of the
different output ports is shown in Table 5.
This mode is only available with the color-space-modes L*a*b* or
LAB99 and processing mode CHECK CYL.
The deviation encoding is only available for sensors with 8 output ports.
Rev. 4.8 (2008-05-13)
22-3061-11
Subject to change
- 11 -
User Manual
VCS2 Sensor Software
Table 5: Deviation-mode signal assignment
Ausgang
Anzeigensegment
OUT0
1 = color detected, 0 = No color detected
OUT1
Darker
OUT2
Brighter
OUT3
Deviation to red
OUT4
Deviation to green
OUT5
Deviation to yellow
OUT6
Deviation to blue
OUT7
Not used
RUNNING MODE
The output ports of the sensor system can be used continuously or triggered (“EXTERN
TRG.“ mode). The selection can be made in the field “RUNNING MODE“ (Figure 13).
When continuously used (“CONTINOUOS”), the outputs are always updated as fast as the
current adjusted response time.
When the “EXTERN TRG.“ mode was selected, the outputs are updated when a rising edge at
the input TRG 0 is detected and remain then in this state until the next rising edge occurs.
Figure 13: Output signals running mode
Additionally the sensor supports two different sequential modes. This makes it possible to detect
a color sequence defined by the color table in a trigger based mode or in a time based mode.
The triggered sequence mode („TRG. SEQU.“) compares the actual result with an entry in the
color table (please refer to sect. 1.2.3, subsect. “COLOR TABLE”) after each appearing trigger
on TRG 0. It starts with entry 0 and goes on after every successful comparison (correct color) to
the next entry. If a detected color does not match its table entry, or the time between two trigger
events is too long (timeout) the sequence will reset to entry 0. The adjustment of the timeout can
be done in the field “SEQUENCE TIMEOUT” (Figure 14)
Figure 14: Timer configuration for triggered color sequence
You can use this mode to recognize a color series of objects with undetermined object distance
and appearance time (e.g. to trigger on colored objects on an assembly line that appear in the
same order but undetermined in time).
The time based sequence mode („TIMED SEQU.“) works like the triggered sequence mode in
principle, but only the beginning of a new sequence has to be indicated by a trigger event on
TRG 0. After that the sensor automatically compares the colors after a programmable time
(interval). In case a color does not match its corresponding table entry, the sequence will reset to
Rev. 4.8 (2008-05-13)
22-3061-11
Subject to change
- 12 -
User Manual
VCS2 Sensor Software
entry 0. The adjustment of the timer interval can be done in the field “SEQUENCE
INTERVAL” (Figure 15).
Figure 15: Interval configuration for timed color sequence
Use this mode to recognize a color series of equidistant spaced and timed objects (e.g. a rotating
wire with color stripes).
A third sequence mode is chosen by activating “SELF TRIGG SEQ”. For this mode no external
trigger is required. The sequence starts by detecting a first color. If every color of the color table
is recognized in the right order, the sequence is finished successfully. If the time adjusted in the
field „SEQUENCE TIMEOUT“ to detect the next valid color of the color table is exceeded an
error signal occurs. The same is for detecting the wrong color sequence order. The coding of the
states shows Table 6. This mode requires the “CHECK SPH” or “CHECK CYL” mode.
Each state of the sequence detection is treated like an ordinary result of a single color detection
and is encoded accordingly. The appearance of the sequence state on the output port can be
adjusted by setting the proper “RESULT FORMAT” mode. The following modes are detected:
Table 6: Sequence Encoding
State
OFF
0
1
2
3
4
Description
Waiting for start
Sequence active
Sequence finished successfully
Wrong color detected
Trigger Timeout (triggered sequence)
Trigger too early (timed sequence)
AVERAGING
In the field “AVERAGING” values in the range of 1…65535 for averaging the sensor signals
can be adjusted .
Large averaging values are recommended for pure signal quality. Keep in mind that large
averaging values reduce the response time of the sensor (Table 7).
SCAN FREQUENCY
The scanning frequency of the sensor system in kHz can be defined in the field “SCAN
FREQUENCY“ (Figure 16).
Figure 16: Sensor system scanning frequency
Rev. 4.8 (2008-05-13)
22-3061-11
Subject to change
- 13 -
User Manual
VCS2 Sensor Software
Please notice the following relationship. If the scanning frequency is chosen to be low, the power
consumption of the sensor is low too (Illuminant will get darker). But if a high scanning
frequency is chosen, the power consumption rises (due to the increasing light intensity).
Hint 1:
The chosen frequency has also influence on the system’s ambient light compensation properties.
In the case of artificial ambient light (modulated mainly at 100 Hz) a frequency greater than
1 kHz is recommended in order to achieve good compensation properties.
Hint 2:
Due to hardware limitations higher frequencies for higher signal gain settings (SIGNAL GAIN5
> 5) are not available.
Table 7: Examples of dependency of response time on adjusted FREQUENCY and AVERAGING values
FREQUENCY
1kHz
10kHz
1kHz
10kHz
AVERAGING
1
10
100
10000
Response time
1ms
1ms
100ms
1000ms
SIGNAL MONITOR
The current sampled signals from the primary sensor are displayed in the graph “SIGNAL
MONITOR“ as raw data. Their description is shown in the following Table 8.
Table 8: Description of the signals in the sensor signal monitor
Signal color
Light red
Light green
Light blue
Dark red
Dark green
Dark blue
Description
Raw data of the red signal (bright phase)
Raw data of the green signal (bright phase)
Raw data of the blue signal (bright phase)
Raw data of the red signal (dark phase)
Raw data of the green signal (dark phase)
Raw data of the blue signal (dark phase)
The three color bars red, green and blue, displayed underneath the sensor signal monitor show
the differential signals of the raw data. In the self-shining mode the signals are identical to the
signals in the bright phase. On the right hand side a color sample is displayed that is being
continuously calculated from the actual three color signals.
Hint 1:
The signal data from the dark phase are zero in the self-shining mode and thus not visible. If the
signal data from the dark phase of body colors (passive mode) are very small, they are also not
visible. Moreover the signal amplitudes from the bright and dark phase can possibly overlap and
hence only one color is able to be seen at the same time.
5
The SIGNAL GAIN option is only available for VCS210 sensors.
Rev. 4.8 (2008-05-13)
22-3061-11
Subject to change
- 14 -
User Manual
VCS2 Sensor Software
Hint 2:
The color sample on the right hand side of the three color bars reproduces a sound color which
is similar to the measured object after setting a good reference white. However the color can be
incorrect and not 100% identical and shall merely serve as orientation, e.g. during the color
sampling process (“Teach-in”) or when displaying tolerance boundaries in color diagrams.
COLOR GROUPING
In the right lower window region a switch is located to activate or deactivate the color grouping
function (Figure 17).
Figure 17: Activating and deactivating of color grouping function
With this function arbitrary colors of the color table can be pooled to groups. In this way
complex class or tolerance boundaries can be realized. After activating the function in the color
table an additional column appears to indicate the group index. Colors with the same group index
are mapped to the same sensor output correspondingly to the adjusted „RESULT FORMAT“
mode.
SAVE PARAMETERS
There are two switches in the field “SAVE PARAMETERS“ for saving the current parameter
settings.
The switch “TO SENSOR“ stores all parameters into the built-in nonvolatile Flash-memory of
the sensor. The parameters will remain in the Flash-memory after power down.
The switch “TO FILE“ stores all parameters on a memory drive of a computer that is connected
to the sensor system.
LOAD PARAMETERS
The switch “FROM FILE“ in the field “LOAD PARAMETERS“ loads a parameter set into the
sensor system.
Hint:
After starting the software the parameters are automatically loaded from the built-in Flashmemory into the sensor system.
Rev. 4.8 (2008-05-13)
22-3061-11
Subject to change
- 15 -
User Manual
VCS2 Sensor Software
1.2.3 Teaching In Colors
The so-called “Teach-in“ procedure for sampling and storing colors into the color table is done
in the tab “TEACHING IN COLORS“ of the program window (Figure 18).
COLOR SPACE MODE
The currently selected color mode is shown in the field “COLOR SPACE MODE“ in the left
hand upper area of the program window.
Figure 18: Acquire color sample program window
PROCESSING MODE
The currently selected processing mode is shown in the field “PROCESSING MODE“ below
the field “COLOR SPACE MODE“.
CURRENT VALUES
This field shows the current sensor data (color coordinates) as they are transformed within the
current selected color space. Beneath these values the current color is shown as a visible color
sample (a valid reference white is the basic precondition for proper color representation).
COLOR TABLE
The color table is located on the right hand upper area of the program window. Its function is to
store colors for recognition or classification. On the left hand side buttons for sampling and
erasing colors are located.
The button “TEACH IN“ stores the current color space values into the next free row of the
color table. For overwriting a row of the color table the PC cursor must be set into the
corresponding row. After that the button “TEACH IN” has to be pressed.
Rev. 4.8 (2008-05-13)
22-3061-11
Subject to change
- 16 -
User Manual
VCS2 Sensor Software
The button ”CLEAR ROW“ clears all color values of one row that has been selected by a mouse
click. The then remaining data rows move up.
The button “CLEAR TABLE“ clears all entries in the color table.
EXPORT TABLE
The button “EXPORT TABLE” stores the current contents of the color table into a comma
separated spreadsheet file (.csv) onto the disk of the PC. The file can easily be processed with
common spreadsheet software.
AXIS SCALING
With this selection switch 3 scaling methods can be chosen (Figure 19).
Figure 19: Scaling options
„MANUAL“ allows manually editing of the diagram axes (by marking and editing the numbers
on the axes). „DEFAULT“ resets the axes to default values. The setting „AUTO“ activates an
auto scaling of the axes.
PROJECTION PLANE
The X and Y axes of the color diagram on the right hand side can be selected in field
“PROJECTION PLANE“ in order to display the desired color plane out of all three possible 2dimensional planes of the 3-dimensional color space. All colors and tolerances can be completely
viewed by this projection plane. To fit the color diagram scales to the desired range, the
axes can be adjusted by editing the numbers on the axes.
Figure 20: Selecting a 2-dimensional plane out of the 3-dimensional color space
All values stored in the color table (except the row index) can be manually modified. By clicking
on a table row the input mode becomes active and numbers can be simply modified by using the
keyboard. By entering the RETURN key or clicking on another area within the program window
the modified values will be stored into the color table. There is a scroll bar on the right hand side
at the table for scrolling the table up and down.
The used table columns depend on the selected processing mode (PROCESSING MODE) and
the activated grouping function. Variants are shown in Figure 21, Figure 22, Figure 23 and Figure
24.
Rev. 4.8 (2008-05-13)
22-3061-11
Subject to change
- 17 -
User Manual
VCS2 Sensor Software
Figure 21: classify mode
Figure 22: recognition with spherical tolerances
Figure 23: recognition with cylindrical tolerances
Figure 24: grouping of colors
There are no tolerance target values needed in the classification mode. The recognition mode
needs target values: one parameter, spherical radius (column TOL in Figure 22), is required for
spherical tolerances and two parameters, color (column TO ab in Figure 23) and brightness
(column TO L in Figure 23) tolerance, are required for cylindrical tolerances. The latter is
favorable in applications where the color brightness plays a less important role than the actual
color. If the TO L tolerance is hereby set to a high value the influence of the color brightness is
correspondingly low.
In the right column “GRP” a group index (0…255) can be assigned if the grouping function is
activated. The assigned index is encoded according to the adjusted output format (“RESULT
FORMAT”). Equal group index numbers activate the same sensor output. In this way different
colors can be mapped to the same output.
The color diagram is located in the right lower area of the program window.
Figure 25: Color diagram with tolerance cylinders
in the a*b* plane
Figure 26: L*b* plane
Figure 25 and Figure 26 show an example color diagram in the L*a*b* color space in the
processing mode cylindrical tolerances.
Rev. 4.8 (2008-05-13)
22-3061-11
Subject to change
- 18 -
User Manual
VCS2 Sensor Software
The sample colors in the right column of the color table correspond to the colors resulting from
the color values/coordinates in each row. The displayed color complies with the real color only if
a valid reference white was successfully sampled before. The visible colors in the color table are
also used for displaying the tolerance boundaries in the color diagram and hence support the user
at defining the tolerance boundaries in the diagram.
Hint 1:
Despite the tolerance rooms/boundaries may overlap, the color inspection and classification is
done always uniquely. The order of colors stored as rows in the color table does not affect in any
way the color inspection.
Hint 2:
The tolerance parameters are used as ∆E-like units. Table 9 shows how the human color
perception commonly recognizes color variations in the L*a*b* color space. Due to the
dependencies of the obtained color values on the used illumination source and the accuracy of
the sensor,. the table only serves as a clue. Practical tolerance values must be find individually for
the sensor.
Table 9: Common values of human perception of color variations
color variation ∆E
<1
1...2
2...3,5
3,5...5
>5
human perception
very small color variation that can not be seen by the human eye
small color variation that can be seen by trained human eye
medium color variation that can be seen by average human eye
considerable color variation
high color variation
Hint 3:
If the spherical tolerances processing mode is selected, the tolerance circles become ellipses in
some projection planes due to different scaling of the diagram axes and is, however, merely a
displaying effect.
SAVE PARAMETERS
The switch “TO SENSOR“ stores all parameters into the built-in nonvolatile Flash-memory of
the sensor. The parameters will remain in the Flash-memory after power down. The switch “TO
FILE“ stores all parameters on a memory drive of a computer that is connected to the sensor
system.
LOAD PARAMETERS
The switch “FROM FILE“ of the field “LOAD PARAMETERS“ loads a parameter set into the
sensor system.
Hint:
The buttons in the fields “SAVE PARAMETERS“ and “LOAD PARAMETERS“ are located in
each program tab and perform all the same functionality. An entire parameter set is always stored
or loaded. After starting the program all parameters are read out from the built-in Flash-memory
and are displayed in the program.
Rev. 4.8 (2008-05-13)
22-3061-11
Subject to change
- 19 -
User Manual
VCS2 Sensor Software
1.2.4 Color processing
Figure 27 shows the program window for color recognition and classification which can be found
under the tab “PROCESS COLORS“.
Figure 27: Color recognition and classification program window
The window arrangement and operation is similar to the program window “TEACHING IN
COLORS“ except for the three buttons on the left hand side of the color table which are
substituted by three number boxes.
COLOR INDEX
The color number of the recognized or classified color is shown in the field ”COLOR INDEX“
and represents the result of the entire sensor system’s signal processing path. This number is the
equivalent of the row number in the color table. If in the recognition (checking) processing mode
the tolerance boundaries were exceeded, the color number becomes 255. In addition the result is
also available at the sensor system’s communication interface.
COLOR DIST
The Euclidean distance between the actual measured color and the recognized or classified
(matched) color value is displayed in the field ”COLOR DIST“. If the cylindrical tolerance mode
is selected the euclidean distance becomes a 2-dimensional distance vector (2-dimensional color
vector). All other processing modes show a 3-dimensional euclidean distance vector.
Hint:
If in the processing modes “CHECK CYL“ and “CHECK SHP“ the tolerance room was
exceeded or the color was not recognized (Index 255), the distance to the next closest color is
calculated and shown in the field ”COLOR DIST“.
Rev. 4.8 (2008-05-13)
22-3061-11
Subject to change
- 20 -
User Manual
VCS2 Sensor Software
LIGHTNESS DIST
The field ”LIGHTNESS DIST“ shows the magnitude of the brightness distance in the cylindrical
tolerances processing mode (equal to an “altitude difference” in the color space).
Figure 28: Program window when tolerance was exceeded and color was not recognized
The color distance values can be read out by the RS232 or USB interface.
Hint:
If in the processing mode “CHECK CYL“ the tolerance room was exceeded or the color was not
recognized, respectively, the brightness distance to the next closest color is calculated and
displayed in the field ”LIGHTNESS DIST“.
SENSOR OUTPUT6
This display signalizes the switching states of the sensor outputs corresponding to the „RESULT
FORMAT“ and „COLOR GROUPING“ settings.
6
The number of displayed outputs depends on the used sensor type.
Rev. 4.8 (2008-05-13)
22-3061-11
Subject to change
- 21 -
User Manual
VCS2 Sensor Software
DEVIATION7
If the result format “DEVIATION” is selected, this display interprets the sensors outputs and
displays the color-deviation in plain text. If one of the other result modes is selected, this display
just shows whether a color is detected or not.
Figure 29: Result format "DEVIATION" - Display of color-deviation
AXSIS SCALING
With this selection switch 3 scaling methods can be chosen (ref. to above section).
7
Only usable for sensors with 8 outputs.
Rev. 4.8 (2008-05-13)
22-3061-11
Subject to change
- 22 -
User Manual
VCS2 Sensor Software
1.2.5 Service
With the switch within the field „SERVICE“ at the startup-screen a service tool is started, which
allows certain special hardware functions and settings. Figure 30 shows the program window.
Figure 30: „SERVICE“ program window
GET SENSOR ID
With „GET ID“ the device serial number and version of the sensor firmware is read from the
device and displayed on the right textbox.
SENSOR ADDRESS
With „GET ADDRESS“ in the area of „SENSOR ADDRESS“ the programmed address of the
sensor is read out and displayed on the right textbox. Underneath this switch there is a field to set
the particular sensor address (scope: 0…255). With “SET ADDRESS” the sensor is programmed
to listen to the chosen address.
BAUD RATE
With the „SELECT BAUD RATE“ switch, the sensor communication is reconfigured to the
chosen baudrate.
OFFSET CORRECTION
Press this button to start a routine that ascertains and corrects the sensors offsets. Offsets are the
sensors dark signals that are noticeable in the active mode for self-shining objects. For correct
operation, the hole of the sensor light input must be darkened.
LOAD FACTORY SETT.
With the „LOAD FACTORY SETT.” switch the factory settings are loaded into the RAM of the
Sensor.
Rev. 4.8 (2008-05-13)
22-3061-11
Subject to change
- 23 -
User Manual
VCS2 Sensor Software
EXT. TEACH BEHAVIOR
There are different ways of using the running mode “EXT. TEACH”. If the checkbox “AUTO
INCREMENT” is activated, the new color will be added as new entry of the internal color-table.
If it’s disabled, the last valid color-value will be overwritten.
The function “KEEP PREVIOUS TOLERANCES” is only useful with disabled “AUTO
INCREMENT”. It overwrites the color-values and keeps the old tolerance-values of the tableentry. If this checkbox is disabled, default tolerances are used.
The button “SET” sends the new properties to the sensor.
SET HYSTERESIS
This function guarantees a stable operation of the sensor system. It is recommended to chose a
high hysteresis value if the signal quality is poor in order to prevent the signal processing from
instability (“flutter”). The value for hysteresis can be set by pressing “SET HYSTERESIS“. The
value adjusted in the field “HYSTERESIS VALUE“ will be set. The value are percentages of the
pre-defined tolerances in the color table (refer to sect. 3.2.3).
OUTPUT BEHAVIOR
This function sets a hold time for the sensor outputs. Using the running modes “CONTINOUS”
and “EXT.TEACH” this function holds the output-values for the selected number of
milliseconds.
If this function is used with an external triggered mode and the checkbox “Fall off” is enabled,
the results fall back after the expiration of the desired number of milliseconds.
The max. adjustable time is 65535 ms.
SAVE TO SENSOR
With this switch the chosen settings will be stored in flash memory permanently.
Hint
If the program is ended without storing the settings to flash memory permanently, all
information are lost after a restart.
Rev. 4.8 (2008-05-13)
22-3061-11
Subject to change
- 24 -
User Manual
VCS2 Sensor Software
2 Communication protocol and command reference
The sensors can be fully controlled via RS232 or USB 8 . All commands are also available as
LabVIEW® VIs and DLL function library. All software is shipped with the sensor system.
2.1 Protocol structure
There is a uniform protocol for sending and receiving data, respectively. The smallest
communication unit is a byte (8 bits), however two bytes are always combined to one word and
transferred together.
Protocol structure
ID
LP
AD RR DH DL
…
CH CL
The high-order byte is followed by a low-order byte. After sending a command word and
receiving by the sensor system, a status response including error codes is sent back after
executing the command
Table 10: Protocol Build-Up
Word Byte
Name Description
0
0
ID
Command ID, higher 8 Bit of word 0
0
1
LP
Payload Length in Words, lower 8 bit of word 0
1
2
AD
Programmable Sensor Address, higher 8 bit of word 1
1
3
RR
Reserved (always 0), lower 8 bit of word 1
...
…
DH
Data, higher 8 bit
...
…
DL
Data, lower 8 bit
N
…
CH
Frame checksum, higher 8 bit
N
…
CL
Frame checksum, lower 8 bit
The Payload length is limited to 255 words. Bigger frames will lead to unpredictable behavior of
the device.
Every sensor can have an 8 bit wide address (AD). The sensor will only respond to commands
with this exact address but always to commands with address ‘0’. This address can be set by
command 0x11.
The checksum is a simple addition of all transmitted 16 bit words including the header. After
adding all values only the lower 16 Bit will be taken.
8
Only available for sensors with USB port.
Rev. 4.8 (2008-05-13)
22-3061-11
Subject to change
- 25 -
User Manual
VCS2 Sensor Software
Table 11: Response Codes
Response
0xF0
0xF1
Data Value
dep. on com.
0x00-0x03
0x04
0x05
0x06
0x07
0x08
0x00
0x00
0x00
dep. on com.
0xF2
0xF3
0xF4
0xE0
Description
Commando executed correctly
Internal status
Frame: wrong checksum
Frame: wrong length
Frame: receive buffer not ready
Frame: unknown error (fatal)
Frame: timeout (1s)
Illegal command
Command not enabled
Invalid parameter
Burst mode
If a frame is not transmitted completely within one second the sensor responds with a timeout
code (0xF1, Payload: 0x08).
Command sequence example 1:
Setting the light intensity to a value of 0x20: „2401 0000 0020 2421“
System Response to that command: “F000 0000 F000” (no error)
Command sequence example 2:
Reading actual value of the light intensity : „2500 0000 2500“
System Response to that command: “F001 0000 0020 F021” (no error)
2.1.1 Burst Mode
For getting values from the sensor system as fast as possible without querying them, a burst
mode has been implemented. When a burst mode is set by the burst mode command (0x12), this
initial command is acknowledged as usual. After that, the system will send frames of the
following structure continuously, until stopped by another burst mode command, switching the
burst mode off again.
Burst Frame Structure
ID
LP
AD RR TH
TL
DH DL
…
CH CL
Table 12: Burst Frame Build-Up
Word Byte
Name Description
0
0
ID
Burst Mode response Code, always “0xE0”
0
1
LP
Payload Length in Words, lower 8 bit of word 0
1
2
AD
Programmable Sensor Address, higher 8 bit of word 1
1
3
RR
Reserved (always 0), lower 8 bit of word 1
2
4
TH
Timing information, higher 8 Bit of word 2
Rev. 4.8 (2008-05-13)
22-3061-11
Subject to change
- 26 -
User Manual
VCS2 Sensor Software
2
5
TL
Timing information, lower 8 Bit of word 2
...
…
DH
Begin of burst data. Format according to requested mode.
...
…
DL
Begin of burst data. Format according to requested mode.
N
…
CH
Frame checksum, higher 8 bit
N
…
CL
Frame checksum, lower 8 bit
The burst frame has the same structure like all other frames. Directly after the header a timing
counter (TH/TL) is inserted. This counter indicates the time between two successive burst
frames in µs. After that, the requested data follows as if it was the payload of the requested burst
mode.
Other commands received by the system during a burst will be accepted and acknowledged
accordingly.
Burst Mode Sequence example:
Step 1: Enable Burst Mode (2F-Mode):
“1201 0000 0001 1202”. Response: “F000 0000 F000”.
Step 2: Receive Burst Frames
“E00A 0000 22D2 0112 00F9 0075 0EED 0F06 0F8A 0FFF 0FFF 0FFF 62D6”.
The system will go on sending frames similar to the above. The delay between this and
the last frame is 8.914ms (0x22D2). The bold values represent the payload as if requested
by a 0x2F-command.
Step 3: Stop Burst Mode:
“1201 0000 0000 1201”: Response (after the last burst-frame) “F000 0000 F000”
2.1.2 Fixed point notation
In many cases it is necessary to use a more precise numbering system than the 16-bit integer
number. For this reason the sensor system uses a 32-bit fixed point format number which has the
following structure:
Table 13: Fixed-Point Format (two’s complement)
Bit 31-21
Integer part
Bit 20-0
Fractional part
This format has a range +/-1024 with a resolution of 0.000 000 477. The representation
corresponds to the two’s complement. The conversion is described by the following formula:
F fixed = Freal ⋅ 221
Conversion Example 1 : From Float to Fixed Point
a) Number: +1.123
Because the value is positive, the formula can be used directly.
Rev. 4.8 (2008-05-13)
22-3061-11
Subject to change
- 27 -
User Manual
VCS2 Sensor Software
1.123 ⋅ 2 21 = 2355101.696 → 2355102 = 0x0023EF9E
b) Number: -1.123
Because the value is negative, the above result has to be converted to a negative two’s
complement value by inverting and adding “1”:
0x0023EF9E → 0xFFDC1061 → 0xFFDC1062
Conversion Example 2: From Fixed Point to Float
a) Number: 0x0023EF9E
Because the most significant bit is “0”, this is a positive value. Simple convert by using the above
formula.
0x0023EF9E 2355102
=
= +1.123000
2 21
2 21
b) Number: 0xFFDC1062
Because the most significant bit is “1”, this is a negative value. Before conversion, invert and add
“1”:
0xFFDC1062 → 0x0023EF9E = 2355102 → -1.123000
Important:
Please pay attention to the word order of the low and high word of the 32 bit number. First, the
lower part (Bit 15-0) is transmitted, then the higher part (Bit 31-16).
Communication Example:
Setting Reference White to 0.9/0.8/0.75 (Command 0x42)
0.90 → 0x001CCCCC
0.80 → 0x00199999
0.75 → 0x00180000
-> “4206 0000 CCCC 001C 9999 0019 0000 0018 A6B8”
2.2 Command reference
The following section describes all available commands. Data types other then 16 Bit integer (a
word) and 32 Bit fixed point are described at the command description directly.
The leading hex-number represents the command id, the rest of the header (for example the
length) and the checksum have to be set appropriately to build a complete communication frame.
2.2.1 System Identification
0x01 : ID-String
Response: ASCII-String with 16 Bit Character width
Note: Because the communication is 16-Bit based, only the lower 8 Bit of each word contain
ASCII code. The higher 8 Bit are always zero.
0x02 : Device Production Date
Rev. 4.8 (2008-05-13)
22-3061-11
Subject to change
- 28 -
User Manual
VCS2 Sensor Software
Response: 2 words
Word 1:
Word 2: Bit 15-8:
Word 2: Bit 7-0:
Year
Month
Day
Note: The date is coded directly to hexadecimal numbers. A received date “2005 0608” shows for
example that this device was build on the 8th of June in 2005.
0x03 : Device Feature Index
Response: 1 word
Bit 15-0:
Device Feature Index
0x04 : Device Hardware Revisions
Response: 2 words
Word 1: Bit 15-8:
Word 1: Bit 7-0:
Word 2: Bit 15-8:
Word 2: Bit 7-0:
System Board Revision
Communication Board Revision
Sensor Board Revision
Connector Board Revision
0x05 : Device Software Revision
Response: 1 word
Bit 15-8:
Bit 7-0:
Major Revision
Minor Revision
0x06 : Device Unique Serial Number
Response: 2 words
Word 1:
Word 2:
Device Unique Serial Number (high)
Device Unique Serial Number (low)
2.2.2 Communication
0x10 : Set Baud Rate
Send: 1 word
0:
1:
2:
3:
4:
5:
9.600
14.400
28.800 (default)
38.400
57.600
115.200
Note: As for all commands, the serial baudrate can be set with an USB command.
0x11 : Set Sensor Address
Send: 1 word
Note: Values other than 0-255 are ignored.
Rev. 4.8 (2008-05-13)
22-3061-11
Subject to change
- 29 -
User Manual
VCS2 Sensor Software
0x12: Set Serial Burst Mode
Send: 1 word
0: Burst Mode off
1: Burst 2F
2: Burst 3F
3: Burst 4F
4: Burst 5F
5: Burst 6F
Response:
Word 0: difference between two burst packages in us
Word 1: (and following) requested data
Note: For more information about the burst mode feature please refer to chapter 2.1.1.
0x13: Set USB-Burst Mode9
like 0x12, only for USB
2.2.3 Data Acquisition
0x20 : Set Acquisition Mode
Send: 1 word
0:
1:
2:
3:
4:
5:
6:
no acquisition
active light internal triggered
passive light internal triggered
active light external triggered
passive light external triggered
active light external triggered inverted
passive light external triggered inverted
0x21 : Read Acquisition Mode
Response: 1 word (like 0x20)
0x22 : Set Transimpedance Amplification10
Send: 1 word
0:
1:
2:
3:
Amplification factor 1
Amplification factor 5
Amplification factor 25
Amplification factor 100
0x23 : Read Transimpedance Amplification10
Response: 1 word (like 0x22)
0x24 : Set Illuminating Intensity10
9
Only available for sensors with USB port.
This function is only available for VCS210 sensors.
10
Rev. 4.8 (2008-05-13)
22-3061-11
Subject to change
- 30 -
User Manual
VCS2 Sensor Software
Send: 1 word
Note: Values other than 0-255 are ignored.
0x25 : Read Illuminating Intensity11
Response: 1 word (like 0x24)
0x26 : Set Light Compensation Frequency
Send: 1 word
Note: This value represents the time between bright and dark sample phases. The value 0xFFFF
represents a frequency of 100Hz, a value of 0x0270 a frequency of 10kHz. Values lower than
0x1D0 (>15kHz) may not give the expected results.
0x27 : Read Light Compensation Frequency
Response: 1 word (like 0x26)
0x28: Auto Gain Setup11
Response: 2 words
Word 1:
Word 2:
automatically found Gain
automatically found Intensity
0x29: Set Averaging Cycles
Send: 1 word
0x2A: Read Averaging Cycles
Response: 1 word (like 0x29)
0x2D : Read Raw ADC Channels
Response: 7 words
Word 1:
Word 2:
Word 3:
Word 4:
[X] Red Value
[Y] Green Value
[Z] Blue Value
Temperature Sensor
Note: Ranges are 0x0000 - 0xFFF0. The values are 12 Bit, left justified. 0xFFF0 represents the
darkest, 0x0000 the brightest intensity (inverted).
0x2F : Read Compensated ADC Channels
Response: 9 words
11
Word 1:
Word 2:
Word 3:
[X] Comp. Red Value
[Y] Comp. Green Value
[Z] Comp. Blue Value
Word 4:
[X] Red Value (Phase I)
This function is only available for VCS210 sensors.
Rev. 4.8 (2008-05-13)
22-3061-11
Subject to change
- 31 -
User Manual
VCS2 Sensor Software
Word 5:
Word 6:
[Y] Green Value (Phase I)
[Z] Blue Value (Phase I)
Word 7:
Word 8:
Word 9:
[X] Red Value (Phase II)
[Y] Green Value (Phase II)
[Z] Blue Value (Phase II)
Phase I:
Phase II:
Light Phase / no compensation
Dark Phase
Note: Ranges are 0x0000 - 0x0FFF. The values are averaged according to 0x29. 0x0000
represents the darkest, 0x0FFF the brightest value.
2.2.4 Sensor Correction
0x30 : Set Correction Matrix Mode
Send : 1 word
0 : Disabled
1 : Sensor Level Correction
2 : Sensor Matrix Correction
0x31 : Read Correction Matrix Mode
Response: 1 word (like 0x30)
0x32 : Set Correction Matrix
Send: 9 x Fixed Point
Matrix formula:
Xc = a00*R + a01*G + a02*B
Yc = a10*R + a11*G + a12*B
Zc = a20*R + a21*G + a22*B
Send order:
a00, a01, a02, a10, a11, a12, a20, a21, a22
Note: The values of the correction matrix are only limited within the range of the fixed point
numbers, but to let the system perform reasonable color transformations, the result of each
channel should be between 0.0-1.0. The settings can be verified by using command 0x3F.
0x33 : Read Correction Matrix
Response: 9 x Fixed Point (like 0x32)
0x3F : Read Corrected Channels
Response: 3 x Fixed Point
Fixed Point 1: Corrected X Channel
Fixed Point 2: Corrected Y Channel
Fixed Point 3: Corrected Z Channel
Rev. 4.8 (2008-05-13)
22-3061-11
Subject to change
- 32 -
User Manual
VCS2 Sensor Software
2.2.5 Color Transformation
0x40 : Set Color Space Mode
Send: 1 word
0:
1:
2:
3:
4:
5:
XYZ (raw)
xyY
L*u'v'
L*a*b*
L*u*v*
Lab99
0x41 : Read Color Space Mode
Response: 1 word (like 0x40)
0x42 : Write Reference White
Send: 3 x Fixed Point
Fixed Point 1: X reference
Fixed Point 2: Y reference
Fixed Point 3: Z reference
Note: The values of the correction matrix are only limited within the range of the fixed point
numbers, but to let the system perform reasonable color transformations, the result of each
channel should be between 0.0-1.0. A more practical way is to use command 0x44 to set the
reference white.
0x43 : Read Reference White
Response: 3 x Fixed Point (like 0x42)
0x44 : Set Reference White
Response: 3 x Fixed Point (like 0x43)
Note: This command takes the actual input light and sets this values as reference white.
Rev. 4.8 (2008-05-13)
22-3061-11
Subject to change
- 33 -
User Manual
VCS2 Sensor Software
0x4F : Read Transformed Channels
Response: 3 x Fixed Point
Tabelle 1: Ranges in different Transformation Modes:
Mode
Read order
Range 1
Range 2
Range 3
0
X, Z, Y
0-1
0-1
0-1
1
x, y, Y
0-1
0-1
0-1
2
u’, v’, L*
0-1
0-1
0-1
3
a*, b*, L*
+/- 5
+/- 2
0-1
4
u*, v*, L*
+/- 5
+/- 5
0-1
5
a99, b99, L99
+/-5
+/- 2
0-1
2.2.6 Color Table, Color Recognition/Classification
0x50 : Write Color Table Entry
Send: 9 x Fixed Point
Fixed Point 1:
Fixed Point 2:
Fixed Point 3:
Fixed Point 4:
Fixed Point 4:
Fixed Point 5:
Fixed Point 7:
Fixed Point 8:
Fixed Point 9:
Entry number (integer as Fixed Point)
Value 1
Value 2
Value 3
Tolerance 1 (Quadratic value of tolerance in spherical & cylindrical mode)
Tolerance 2 (only cylindrical mode, corresp. to lightness distance)
Raw Value 1 (X)
Raw Value 2 (Y)
Raw Value 3 (Z)
Note: This command writes a complete entry to the 255 entries long color table. The first value is
the index of this entry. The next three entries are the transformed color values of the color to be
recognized. The two tolerances depend on the classification mode. Please see chapter 1.2.4 for
more detailed information. The last three values are the corresponding raw values to the
transformed values. A more practical way to create a new entry is to use command 0x56.
0x51 : Read Color Table Entry
Send Entry Number: 1 x Fixed Point
Response:
Fixed Point 1:
Fixed Point 2:
Fixed Point 3:
Fixed Point 4:
Fixed Point 5:
Fixed Point 6:
Rev. 4.8 (2008-05-13)
22-3061-11
Value 1
Value 2
Value 3
Tolerance 1 (Quadratic value of tolerance in spherical & cylindrical mode)
Tolerance 2 (only cylindrical mode, corresp. to lightness distance)
Raw Value 1 (X)
Subject to change
- 34 -
User Manual
VCS2 Sensor Software
Fixed Point 7: Raw Value 2 (Y)
Fixed Point 8: Raw Value 3 (Z)
0x52 : Set Classification Mode
Send: 1 Word
Bit 15-8:
Bit 7-0:
Table size (number of valid entries)
0: no classification
1: spherical check (with radius check)
2: cylindrical check (with radius check)
3: spherical classification (without radius check)
0x53 : Read Classification Mode
Response: 1 Word (like 0x52)
0x54 : Set Hysteresis
Send: 1 Word
Note: This command sets a classification hysteresis (in percent) to filter small disturbances within
the color recognition. The value enlarges the radius of the actual recognized color and makes it
more difficult to leave.
0x55 : Read Hysteresis
Response: 1 Word (like 0x54)
0x56 : Set Color Table Entry
Response: 8 x Fixed Point
Fixed Point 1:
Fixed Point 2:
Fixed Point 3:
Fixed Point 4:
Fixed Point 5:
Fixed Point 6:
Fixed Point 7:
Fixed Point 8:
Value 1
Value 2
Value 3
Tolerance 1 (Quadratic value of tolerance in spherical & cylindrical mode)
Tolerance 2 (only cylindrical mode, corresp. to lightness distance)
Raw Value 1 (X)
Raw Value 2 (Y)
Raw Value 3 (Z)
Note: This command takes the actual light input as entry and auto-increments the table-size.
Tolerances are set default to 4 units.
0x57 : Set Tolerance-Defaults
Send: 2x Fixed Point
Fixed Point 1: Default value for Color-Tolerance
Fixed Point 2: Default value for Lightness-Distance
= (Value /100)²
= Value / 100
0x58 : Read Tolerance-Defaults
Response: 2x Fixed Point
Fixed Point 1: Default value for Color-Tolerance
Fixed Point 2: Default value for Lightness-Distance
Rev. 4.8 (2008-05-13)
22-3061-11
= (√Value) * 100
= Value * 100
Subject to change
- 35 -
User Manual
VCS2 Sensor Software
0x5F : Read Classified Value
Response: 3 x Fixed Point
Fixed Point 1: Index of recognized/classified color (closest color)
Fixed Point 2: Quadratic value of distance 1 (spherical & cylindrical mode)
Fixed Point 3: Value of Distance 2 (only cylindrical mode, corresp. to lightness distance)
2.2.7 Output Encoding
0x60 : Set Encoding Style
Send: 1 Word
Bit 15-12:
Output Mode
0 = [0000]: continuous
1 = [0001]: external triggered
2 = [0010]: trigger controlled sequence
3 = [0011]: timer controlled sequence
4 = [0100]: external triggered teach in
5 = [0101]: self triggered sequence
Bit 11-8:
Mapping Mode
0: no mapping (direct)
1: mapping enabled (use 0x62 to set entries)
Bit 7:
External Teach Mode: Auto increment enable
0: Auto increment disabled
1: Auto increment enabled
Bit 6:
External Teach Mode: Keep previous tolerance values
0: Set default tolerances
1: Keep previous tolerances (only useful in combination with Bit 7)
Bit 5:
External Trigger Modes: Automatic fall-off enable
0: Automatic fall-off disabled
1: Automatic fall-off enabled
Bit 4:
Encoding Polarity
0: not inverted outputs
1: inverted outputs
Bit 3-0:
Encoding Mode
0 = [0000]: off (output pins remain unchanged)
1 = [0001]: direct
2 = [0010]: 1-hot
3 = [0011]: 7-segment
4 = [0100]: Deviation
0x61 : Read Output Mode
Response: 1 Word (like 0x60)
0x62 : Set Encoding Map Entry
Rev. 4.8 (2008-05-13)
22-3061-11
Subject to change
- 36 -
User Manual
VCS2 Sensor Software
Send: 2 Word
Word 1:
Word 2:
Table Entry (range 0..255)
Table Value (range 0..255)
0x63 : Read Encoding Map Entry
Send: 1 Word (Table Entry 0..255)
Response: 1 Word (Table Value 0..255)
0x64 : Set Sequence Timeout
Send: 1 Word
Note: Sequence Timeout for triggered mode in ms.
0x65 : Read Sequence Timeout
Response: 1 Word (like 0x64)
0x66 : Set Sequence Interval
Send: 1 Word
Note: Time between two automatic samples for timed mode in ms
0x67 : Read Sequence Interval
Response: 1 Word (like 0x66)
0x68 : Set Output hold time
Send: 1 Word
Note: This command sets the time, for which the resulting output signal will be hold constant on
the output pins, no matter how short time the detected color was in front of the sensor. The time
is given in ms.
0x69 : Read Output hold time
Response: 1 Word (like 0x68)
0x6F: Read Encoded Output
Response: 1 Word (like encoded output pins)
2.2.8 Flash Operations and Parameters
0xA0 : Store Parameter
store all parameter from RAM to Flash
Note: Flash write operations can last up to seconds. The device must not be interrupted and
power supply has to be stable during this time. Otherwise the flash may be corrupted and the
device may start with an unknown or even a dangerous configuration.
0xA1 : Read Parameter
read stored parameter from Flash into RAM
Rev. 4.8 (2008-05-13)
22-3061-11
Subject to change
- 37 -
User Manual
VCS2 Sensor Software
0xA2 : Read Factory Settings
read factory defaults into RAM
Rev. 4.8 (2008-05-13)
22-3061-11
Subject to change
- 38 -
User Manual
VCS2 Sensor Software
3 LabVIEW® VIs
All commands described in chapter 4 are implemented as LabVIEW VIs and are shipped with
this color sensor system. The following VIs are saved as LabVIEW Version 6.1 libraries on CD:
Table 14: LabVIEW libraries
Library
libpcs_cmd.llb
libtools.llb
libft.llb
libpcs_com
Description
Main library with all commands
Help library for libpcs_cmd. Internal, shared VIs.
Help library for controlling the USB module.
general functions for communication
3.1 Structure of command VIs
All command VIs have the same standard structure (Figure 31).
Figure 31: VI entity
Resource Signal
The Resource signal is a so-called cluster signal (Figure 32) and contains information and
configuration about the communication interface.
Figure 32: Resource Cluster-Signal
The signal UsbHandleIn contains the handle for the USB communication. The VISAIn signal
stores all information for the serial communication interface. The communication channel is
selected by the signal SERIAL (TRUE: RS232, FALSE: USB).
error Signal
The error signal is a cluster signal and contains error information (Figure 33).
Figure 33: error Cluster-Signal
3.2 Open Resource VI and Close Resource VI
There are VIs for opening and closing the communication channel.
Rev. 4.8 (2008-05-13)
22-3061-11
Subject to change
- 39 -
User Manual
VCS2 Sensor Software
Figure 34: Figure 35: Open Resource VI
The switch T - Serial / F – USB selects between RS232 or USB. With the selection switch
SELECT COM PORT (IF SERIAL) the used COM-Port for the RS232 can be selected. Via
the selection switch SELECT BAUD RATE (IF SERIAL) the used baud rate can be chosen.
With the control “SELECT USB DEVICE” the desired USB device can be chosen.
Figure 36: Close Resource VI
For closing the used com port the VI close resource is provided.
3.3 Example
Figure 37 shows a block diagram for combination of LabVIEW VIs with the command 0x2F
(Read Compensated ADC Channels).
Figure 37: Combination with the command 0x2F (Read Compensated ADC Channels)
Rev. 4.8 (2008-05-13)
22-3061-11
Subject to change
- 40 -
User Manual
VCS2 Sensor Software
Figure 38: Front Panel of the example VI for the command 0x2F (Read Compensated ADC Channels)
Rev. 4.8 (2008-05-13)
22-3061-11
Subject to change
- 41 -
User Manual
VCS2 Sensor Software
4 DLL Function Library
4.1 Introduction
The function library PCSLib contains the functionality to communicate and configure the
sensors. For the communication two PC devices are supported: serial interface (COM1, COM2,
...) and the USB interface.
This document describe the library functions its usage and the delivered files.
4.2 Library Functions
Three function layer are supported:
•
PCS Library:
Information (name, version number) about the PCSLib.
•
USB Library:
Initializing of the USB-Library.
•
PCS Devices:
Opening and closing of the interfaces and the communication.
4.2.1 Library
PCS_VersionString
Delivers the PCSLib version string in the following format: “PCSLIB 1.3“
UCHAR*
PCS_VersionString (void);
Parameters:
- none Return Value:
string
Pointer to the PCSLib version string.
4.2.2 USB Library
PCS_initUSBLib
This function loads the USB library and initializes its functions. It is required to call this function,
before additional USB functions can be used.
ULONG
PCS_initUSBLib (void);
Parameters:
- none Return Value:
opening status
0
-1
Rev. 4.8 (2008-05-13)
22-3061-11
indicates the successful initialisation
if an error occurs
Subject to change
- 42 -
User Manual
VCS2 Sensor Software
PCS_closeUSBLib
This function closes the USB library and frees the allocated memory.
void PCS_closeUSBLib (void);
Parameters:
- none Return Value:
- none -
4.2.3 Devices
PCS_getUSBDeviceNum
Detects the number of sensors connected to the USB interface.
UCHAR
PCS_getUSBDeviceNum (ULONG* num);
Parameters:
num
Pointer that contains the device number.
Return Value:
Communication
error
PCSCS_OK
if command successful, otherwise the return value is an error code.
PCS_openDevice
Opens a communication device (USB or RS232 interface) and initializes the internal device
memory structure. Depending on the device type different configuration parameters are used.
UCHAR
PCS_openDevice (struct PCS_Device_def* pcsdev, UCHAR devtype,
UCHAR devnr, ULONG baud);
Parameters:
pcsdev
devtype
devnr
baud
Pointer to device structure to be initialized
Device type: PCSDT_USB, PCSDT_RS232
Device number; depending on device type (USB or RS232 device)
RS232 baud rate; default value: 28800 baud
Return Value:
Communication
error
PCSCS_OK
Rev. 4.8 (2008-05-13)
22-3061-11
if command successful, otherwise the return value is an error code.
Subject to change
- 43 -
User Manual
VCS2 Sensor Software
PCS_closeDevice
Closes a previous opened communication device.
void
PCS_closeDevice (struct PCS_Device_def *pcsdev);
Parameters:
pcsdev
Pointer to the device structure
Return Value:
- none -
PCS_sendCommand
This function sends a command via the opened communication interface to the sensor and
delivers the response.
UCHAR
PCS_sendCommand (struct PCS_Device_def* pcsdev,
UCHAR cmd, UCHAR devid,
USHORT* txd, USHORT txd_len,
USHORT* rxd, USHORT* rxd_len,
UCHAR* responsecode);
Parameters:
txd
txd_len
rxd
txd_len
responsecode
Pointer to the device structure
Code of the command to be send
Device ID of the sensor for communication.
0x00 (default) for broadcasting. All sensors connected to the opened
communication interface are addressed.
Pointer to send message
Length of send message
Pointer to receive message
Length of receive message
response code
Return Value:
Communication
error
PCSCS_OK
pcsdev
cmd
devid
Rev. 4.8 (2008-05-13)
22-3061-11
if command successful, otherwise the return value is an error code.
Subject to change
- 44 -
User Manual
VCS2 Sensor Software
Code Example:
#include "libpcs.h"
...
USHORT
UCHAR
USHORT
USHORT
USHORT
UCHAR
UCHAR
x, y, z;
devid = 0x00;
msg_tx[PCS_MAXMESSAGESIZE];
msg_rx[PCS_MAXMESSAGESIZE];
msg_tx_len, msg_rx_len;
com_status;
responsecode;
//
//
//
//
//
//
device id
transmit command data
received command data
data length (rx, tx)
communication status
protocol response code
msg_tx_len = 0;
com_status = PCS_sendCommand(pcsdev, PCSCC_ReadRawADCChannels, devid,
msg_tx, msg_tx_len, msg_rx, &msg_rx_len,
&responsecode);
if (com_status != PCSCS_OK || responsecode != PCSRC_OK)
{
printf("ReadRawADCChannels: communication error: %x, %x\n",
com_status, responsecode);
} else {
x = msg_rx[0];
// value x
y = msg_rx[1];
// value y
z = msg_rx[2];
// value z
}
4.3 Files
File
Description
libpcs.dll
libpcs.h
library and header file
Makefile
Makefile to generate the example executables (in this case gcc with cygwin)
acquisition.c
acquisition.exe
benchmark.c
benchmark.exe
identify.c
identify.exe
shows the sensor color values in Lab color space
benchmark the USB and serial communication speed
reads the sensor identify string
PCSLib_en_x.y.pdf this documention
4.4 Requirements
•
installed FTD2XX.DLL for USB communication
•
installed development environment
Rev. 4.8 (2008-05-13)
22-3061-11
Subject to change
- 45 -
User Manual
VCS2 Sensor Software
Revision
1.8
1.81
2.0
2.01
2.02
2.1
3.01
3.02
3.03
3.1
3.11
3.2
3.3
3.31
3.32
3.33
3.4
4.0
4.1
4.2
4.3
4.4
4.5
4.6
4.7
4.8
Remark
Chap. 4: commands 0x44 & 0x56 added, command 0x51, 0x60 changed
Section 4.1 Description of the fixed point format corrected
program screen shots updated, table 7 changed
Table 10, section 3.2.2 corrected
Chap. 3: new screenshots of V2.0 implemented, new functions documented
Section 4.8: Command 0x60 edited
Section 3.2.3: Hint 2 and table 12 edited
Section 3.2.2, Subsection “COLOR SPACE MODE”: Hint added
Section 3.2.2, Subsection “FREQUENCY”: screenshot replaced, Hint 2 added
Chap. 3: new screenshots of V2.1 implemented
Section 3.2.3 new function “EXPORT TABLE” documented
Chap. 2: edited, Tab. 3 adapted, Sect. 2.2 added
Chap. 3: Sect. 3.2.2 Subsect.: “SERVICE” Command “LOAD FACTORY SETT.” added, “COLOR OBJECT TYPE” edited,
“LIGHT CONTROL” replaced by “INTENSITY”, “RUNNING MODE” edited, “HYSTERESIS” replaced by
“AVERAGING”, “FREQUENCY” edited
Chap. 4: Sect. 4.1 Command sequence example added, Command 0x20 edited, commands 0x29 and 0x2A added, commands
0x54 and 0x55 corrected
Chap. 6: completely edited, additional specifications added
Chap. 3: Sect. 3.2.2 Subsect.: “COLOR SPACE MODE”: Hint 2 added
Chap. 2: Subsect.: “SERVICE”: „SERVICE“ edited
Sect. 1.1.4 edited
Chap. 2, Sect. 3.2.2, Subsect. “RESULT FORMAT and Subsect. “RUNNUNG MODE” edited, Subsect. “FREQUENCY”
Table 12 added, Fig. 28 added
Sect. 2.1.3 Fig. 9 added
Chap. 3: Sect. 3.2.2 Subsect.: “SERVICE” Commands „OFFSET CORRECTION“, „SET HYSTERESIS“ und „SET
OUTPUT HOLD TIME“ added
Chap. 2 edited.
Chap. 3: new screen shots added, new functions “SCALING OPTION” and “SENSOR OUTPUT” added
Corrected response codes in communication protocol (F1 F2)
specification in tab 25 changed, Sect. 4.2.7 command 0x63 edited
Screenshots updated, specification adapted
new screenshots added, Sect. 3.2.1 „SERIAL CONNECTION“ field “ADDRESS” added, Sect. 4.1.9 Command 0x60 „self
triggered sequence“ added
old Chap. 1 “INTRODUCTION AND COLORIMETRIC BASICS”, Chap. 2 “SENSOR HARDWARE” and Chap. 6
“SPECIFICATION” removed. New Chap. 4 “DLL Function Library“ added.
New output-modes: Fall off, Deviation, Keep Tolerances, Auto Increment enable
Screenshots updated; Function “SAMPLE” Sec. 1.2.3 edited
new screenshots inserted
New screenshots inserted
Commands 0x57 and 0x58 inserted, Section 1.2.5 updated (Switch “KEY LOCK” insertewd)
Chap. 2 7-sehm. mode removed
new screen shots added
New screenshots, Sec. 1.2.1 edited
Rev. 4.8 (2008-05-13)
22-3061-11
Subject to change
- 46 -
08/29/2008
Date of issue
With regard to the supply of products, the current issue of the following document is applicable:
The General Terms of Delivery for Products and Services of the Electrical Industry, published by the Central
Association of the Electrical Industry (Zentralverband Elektrotechnik und Elektroindustrie (ZVEI) e.V.)
in its most recent version as well as the supplementary clause: "Expanded reservation of proprietorship"
FACTORY AUTOMATION –
SENSING YOUR NEEDS
Worldwide Headquarters
Pepperl+Fuchs GmbH
68307 Mannheim · Germany
Tel. +49 621 776-0
E-mail: [email protected]
USA Headquarters
Pepperl+Fuchs Inc.
Twinsburg, Ohio 44087 · USA
Tel. +1 330 4253555
E-mail: [email protected]
Asia Pacific Headquarters
Pepperl+Fuchs Pte Ltd.
Company Registration No. 199003130E
Singapore 139942
Tel. +65 67799091
E-mail: [email protected]
www.pepperl-fuchs.com
Subject to modifications
Copyright PEPPERL+FUCHS • Printed in Germany
XXXXXX
08/2008