1
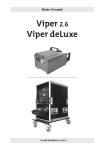
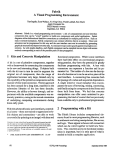
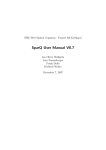
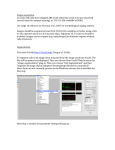
REDVINE Version 0.5 Beta Documentation
Muralikrishna Sridhar, Feng Gu∗, Anthony G. Cohn, and David C. Hogg
School of Computing, University of Leeds
1
Introduction
This documentation details the user manual and technical background of the
REDVINE syste,, a novel approach, where interactions in a video are represented
using an activity graph. The activity graph embodies all the interactions i.e.
all the qualitative spatiotemporal relations between all pairs of interacting cotemporal object tracks during the entire video, as well as other properties such as
pre-computed ‘primitive events’ and object types. Interactions between subsets
of objects or those involving only a subset of spatial relations are captured
by interaction sub-graphs of an activity graph. Learning involves using subinteraction graphs that are labelled in the ground truth with corresponding
event label(s), in order to learn event models for each event under consideration.
Given an unseen video that we represent as a corresponding activity graph, the
task of event detection corresponds to finding the most probable covering of
the activity graph with sub-interaction graphs, given a learned event model.
Each detected interaction sub-graph is mapped back to the video in the form
of event detections, where an event detection corresponds to an interaction by
a subset of objects during certain time intervals, together with their respective
event label(s). In this documentation we illustrate the REDVINE system on a
dataset consisting of common outdoor verbs1 (taken from www.visint.org).
2
2.1
User Manual
Prerequisites of the System
REDVINE is implemented in MatLab, and to run the system properly, users
are required to install the ‘Graphviz’ and ‘ffmpeg’ packages. These packages are
required for the displaying functions. Once the REDVINE package is unzipped,
it should contain the following directories:
∗ If you have any questions of the documentation or software, please contact Dr. Muralikrishna Sridhar ([email protected]) or Dr. Feng Gu ([email protected]).
1 In this documentation and the current system we assume that the task is to learn verb
models. The system could equally be used to learn more general kinds of event models,
providing each instance takes place over some one-piece interval and involves interactions of
objects.
1
• Images: this directory stores all the images converted from each video
in the dataset, through ‘ffmpeg’, and they are required for the displaying
functions of the system.
• Output: this directory stores the output of the system, e.g. images,
videos and results, and if it is not originally included in the package, users
will be able to create it after the REDVINE is launched.
• RedVine: this directory consists of all the Matlab scripts of the system
(under the directory of ‘. . . /REDVINECode’).
• Tracks: this directory consists of all the Viper2 files where both tracks
and spatio-temporal ground truth are stored.
2.2
System Architecture
The work-flow of REDVINE consists of three major stages, namely ‘system
setup’, where the relevant system parameters are initialised, e.g. directories of
input and output; ‘relational representation’, where each input video is represented as an activity graph and numerous displaying tools are provided; and
‘learning and classification’, where the activity graph of a video is mined as
interaction sub-graphs (corresponding to particular spatio-temporal regions of
interest) that are then represented as histogram feature vectors for classification. Each of these stages is displayed in the following flowcharts: Figure 1,
Figure 2 and Figure 3.
2.3
Graphical User Interface
A comprehensive graphical user interface (GUI) is provided by the system,
where each component of the pipeline can be called individually. Users need to
firstly start Matlab and point it to the directory of REDVINE scripts, through
‘addpath(genpath(0 . . . /REDVINECode0 ))’. Now the REDVINE GUI can be
launched by typing ‘REDVINE’ in the Matlab command window, as shown in
Figure 4.
There are five components of the GUI that corresponds to the three major
stages of the systems, including ‘Set Up’ in the system setup stage; ‘SpatioTemporal Representation’ in the relational representation stage; ‘Graph Mining’, ‘Feature Extraction’, and ‘Learning and Detection’ in the learning and
classification stage. The description of each part is given as follows:
1. Set up
• The buttons ‘Browse for Image Directory’, ‘Browse for Tacks
Directory’ and ‘Browse for Output Directory’ can be used to
specify the directories of Images, Tracks and Output, please note
2 Details of the ViPER: the Video Performance Evaluation Resource can be found in
http://viper-toolkit.sourceforge.net/
2
Figure 1: A flowchart of the system setup stage.
users are allowed to create a new directory for output files through
the pop-up window if necessary.
• In the list of ‘Select Spatial Relation(s)’, users can select the types
of qualitative-spatial-relationships (e.g. RCC3, QTC6 and QTC6V3 )
included for the computation of activity graphs.
• In the list of ‘Select Event Classes’, users can select a list of verbs
that will be used by the system, e.g. ‘approach’, ‘follow’ etc.
• The ‘Save’ button is for initializing the system’s default parameters,
which should be performed whenever users change any settings.
2. Spatio-Temporal Representation
• The ‘Parse Viper Files4 ’ button is for extracting tracks and ground
truth from all the Viper files supplied in the directory of ‘Tracks’
and saving it in ‘.mat’ format that can be used by the rest of the
pipeline.
• The ‘Compute Interaction Graphs’ button can be used to start
the computation process of activity graphs.
• The ‘Select Video for Display’ button allows the visualisation of
a selected video.
3 For the illustration of these relationships, please refer to [3], which can be found at
http://www.comp.leeds.ac.uk/qsr/publications.html
4 Details of the Viper format are provided in http://viper-toolkit.sourceforge.net/docs/file/,
the current system only accepts tracks presented as the Viper format.
3
Parse Viper Files
Compute Interaction Graphs
Q. Rel
Q. Rel + Primitive Events
display
Select a Verb
All the Videos
Q. Rel/Graphs
Select a Video
Display Options
Adjustable Speed
Spatial Relationships Shown
Interaction Graphs Shown
Output Options
Save Images
Images to Video
Figure 2: A flowchart of the relational representation stage.
4
Figure 3: A flowchart of the learning and classification stage.
• In the list of verbs selected in the ‘Set Up’ session will be shown for
users to select a particular verb for visualisation.
• The ‘Play Video (s)’ can be used to visualise for all the videos of
the selected verb.
• Alternatively, the ‘Show QRel/Graphs’ allows the user to visualise
for all the qualitative relations/graphs of the selected verb.
• The two tick-boxes ‘Spatial Relationship’ and ‘Interaction Graph’
allow users to specify types of information for displaying a video, for
example, if neither is chosen, it will only show the tracks, and if
‘Spatial Relationship’ is chosen, in addition to tracks, spatial relationships in a video will also be shown, and so forth.
• The two tick-boxes ‘Save Images’ and ‘Images→Videos’ give users
the options to save all the images that have been displayed, as well
as to convert those images into a video through ‘ffmpeg’.
• The slider is used to adjust the speed of displaying functions from
slow (left) to fast (right).
• The button of ‘Stop’ is for aborting any displaying functions.
3. Graph Mining
• The button ‘Mine Activity Graph’ is used to call the process of
mining activity graphs from the interaction graph of each video.
5
Figure 4: A screen snapshot of the REDVINE GUI.
• The button ‘Display Sub-Graph’ allows users to display all the
mined activity graphs obtained through the mining process.
• The button ‘Mine Graphemes’ is for mining a Grapheme dictionary that will used for feature extraction.
• The button ‘Display Graphemes’ can be used to display the obtained Grapheme dictionary.
4. Feature Extraction
• The button ‘Histogram of Graphemes’ is used to extract features
from the mined interaction sub-graphs which now are represented as
feature vectors of histograms.
• The button ‘Display Embedded Features’ allows for the visualisation of extracted features in a lower dimensional space.
5. Learning and Detection
• The button ‘Video N Fold CV’ allows users to start the recognition
and detection process, where currently only the option of video-based
N -fold (N = 5) cross validation is provided; however in the future
more options will added, e.g. the option of choosing different classifiers and the option of specifying the value of N .
.
6
3
3.1
Technical Details
System Overview
Recognizing verbs in videos has many interesting applications and is a reasonably well researched area. However, interestingly much of this research has
focussed on representation of activities in videos using optical flow based representations. The flow based representation has found to be particularly well
suited for a reasonable vocabulary of verbs that are predominantly action verbs
such as kick and run. Some recent approaches focus on extending the flow
based approaches to model certain simple interaction verbs such as ‘exchange’
and ‘follow’.
In this work, the interactions between all the object tracks for an entire
video is compactly represented using an activity graph. The activity graph is
a three layered graph which represents the spatio-temporal relations between
all pairs of co-temporal object tracks. In short, layer one nodes of the activity
graph correspond to object tracks, layer two nodes represent qualitative spatial relations5 that hold for certain maximal intervals between certain pairs of
object tracks that are observed co-temporally, and layer three nodes represent
qualitative temporal relations between certain pairs of these maximal intervals.
Section 3.2 describes how videos are represented using activity graphs in our
framework.
While an activity graph exhaustively represents all interactions i.e. all spatial relations between all pairs of objects in a given video, verbs would generally
correspond to a subset of smaller interactions. As we shall illustrate in section 3.3, Interaction sub-graphs of the activity graph naturally captures these
smaller interactions and are thus readily usable as training samples for supervised training of verb models for each verb class, when they are marked with
respective verb labels as a part of a manually specified ground truth. Section
3.3 describes the task of learning verb models.
Given an unseen video, the task of verb detection can be formulated as the
task of finding the most probable covering of the object tracks with interactions that are detected as belonging to certain verb classes. In our framework,
this task naturally translates to finding the most probable covering of the corresponding activity graph with interaction sub-graphs using a learned verb model.
We characterize the most probable covering as composed of a few highly probable interaction sub-graphs that are also large in size and are layed out on
the activity graph in a manner such that labels for overlapping graphs tend
to reflect co-occurrence statistics from the training set. Each detected subinteraction graph is mapped back to the video in the form of verb detections,
where a verb detection corresponds to an interaction by a subset of objects during certain time intervals, together with their respective verb label(s). Section
3.4 describes how the video event detection is formulated as finding an optimal
covering of an activity graph.
5 Other properties which hold for intervals of time, such as primitive events, or type information can also be represented as layer 2 nodes.
7
Spatial
Relations
Approach (Ap)
I1
Disconnected (Dr)
Pursue (Pu)
Static (St)
I2
I3
Partially Overlaps (PO)
I5
Chase
Follow
I4
Event
Ground
Truth
Approach
(a)
=
1, 0 , 0, 1, 0, …..
Follow
Background
Follow
Chase
Chase
(b)
(c)
Approach
Figure 5: An illustration of the relational approach
3.2
Video Activity Graphs
We propose that activity graphs a natural way of representing interactions between objects participating in video activities, using qualitative spatial and
temporal relations. We describe how an interaction between a person and a
ball that occurs in a particular video is captured by the corresponding activity
graph. At the top, in Fig. 1.a is a sequence of images representing the interaction between a person and a ball, where the ball approaches the person,
the person chases the ball and then they are static with respect to each other.
Below that is shown, two parallel sequences of episodes [2], where each episode
corresponds to an interval, during which a qualitative spatial relationship holds
maximally. For example, the relationship Disconnected (Dr) holds maximally
for the interval I4 between the objects O1 and O2 respectively, as shown in Fig.
1.a .
As already mentioned above, activity graphs are three layered graphs, in
which the layer 1 nodes are mapped to the interacting object tracks. Layer
2 nodes represent all the episodes between all those pairs of tracks which are
co-temporally observed and are labelled with their respective maximal spatial
relation as shown in Fig. 1.a. For example, the sub-graph with the two layer 1
nodes and the first of the layer 2 nodes labelled with Dr represents the fact that
the relation Dr holds between O1 and O2 during the interval I3 and is equivalent
to the logical formulae Holds(O1 ,O2 ; Dr; I4 ). Layer 3 nodes of the activity graph
8
are labelled with Allens apostrophe temporal relations between certain pairs of
intervals corresponding to episodes represented by respective pairs of layer 2
nodes, and these pairs are characterized by the property that both intervals of
a pair do not lie outside and on the same side of the interval characterizing
the interaction. For example, the sub-graph formed by the two layer 2 episode
nodes labelled as Dr and Po respectively and the first of the layer 3 node labelled
with the symbol m represents the fact that the relationship meets, signified by
the symbol m, holds between the intervals corresponding to these two episodes
namely I4 and I5 , and is equivalent to the logical formulae Meets(I4 ; I5 ). Note
that we do not represent the relations between the intervals I1 and I4 as both
of them can potentially lie outside and on the same side of the interval shown.
The choice of a graph based representation as opposed to a logic based one is
motivated by the rationale that they offer a computationally efficient alternative
to logical predicates6 , by avoiding repetition of object and episode variables
and also provide a well defined and computationally efficient comparison of
interactions, by means of suitable similarity measure, as described below.
However, the expressive of activity graphs may be plagued by noisy qualitative spatio-temporal relationships which arises due to the jitter arising from
unstable bounding boxes, and may not represent intuitive transitions between
spatial states. To address this problem, in [4] we proposed an approach which incorporates a temporal model that reflects more natural state transitions learned
from a manually annotated ground truth and therefore discourages unintuitive
state transitions that may arise from video noise. The temporal model arises
from a state transition matrix which is defined on the Conceptual Neighbourhood Graphs (CNG) [4] for topological relationships (RCC5). CNGs naturally
capture transitions between mutually exclusive and exhaustive et of qualitative
relationships at a certain level of granularity and thus enable the definition of a
well defined temporal model. This property motivates our choice of using CNGs
arising from well researched calculi such as RCC5, QTC6, DIR4. Thus, each
sequence of episodes (e.g. Fig. 1.a) correspond to one of the three different
types of qualitative relations (e.g in Fig 1.a corresponds to topology (RCC5)
and relative trajectories (QTC6)).
3.3
Learning Verb Models of Interaction Sub-graphs
An activity graph exhaustively represents all interactions i.e. all spatial relations
between all pairs of co-temporally observed objects in a given video. However,
verbs would generally correspond to a subset of smaller interactions i.e. a subset
of spatial relations between a subset of objects. For example, the intervals for
the two verbs follow and chase corresponds to a smaller interaction involving
only a subset of spatial relations, namely Ap, Pu and Po. In our framework,
the smaller interactions naturally map to interaction sub-graphs of the activity
graph. For example, the smaller interaction given above corresponds to an
6 This is because these initial/final relations are somewhat arbitrary in different instances
of the same class, depending on when these intervals start/finish.
9
interaction sub-graph of the activity graph in Fig. 1.b, which contains the
corresponding objects, the subset of spatial relations Ap, Pu and Po and the
appropriate temporal relationships, as shown in Fig. 1.c.
As our ground truth consists of such smaller interactions (in terms of objects
and time intervals) with corresponding verb labels, the corresponding interaction sub-graphs with their verb labels readily serve as training examples for
supervised training of verb models for each verb class v ∈ V, where V is the set
of all verb classes under consideration. In general we represent an event not just
by one interaction graph that represents the interaction in the interval exactly
specified by the ground truth, but by a collection of interaction graphs that
closely overlap with this graph. We also include background interaction subgraphs i.e. those interaction sub-graphs that do not overlap any of the positive
examples for all the verb classes.
3.3.1
Spatio-temporal Bag of Graphemes
Given a set of sub-interaction graphs, we build a spatio-temporal bag-of-graphemes
(BoG), in order to learn verb class models for each verb. As we shall see later,
this representation is also useful during verb detection. The BoG representation requires the construction of a grapheme vocabulary. We obtain this
vocabulary by mining graphemes each of which tend to have relatively high
dependencies with respect to a particular target class. To this end, we first
exhaustively mine all interaction sub-graphs that represent interactions upto a
maximum number of objects and a maximum number of episodes. Then we apply minimum-redundancy maximum-relevancy (MRMR) [1] which searches for
a subset of graphemes that have a maximum mutual dependencies with respect
to all classes and a minimum redundancy within this set as expressed below.
Gmax = arg max
G
1
1 X
I(gi , V) −
kGk
kGk2
gi ∈G
X
I(gi , gj )
gi ,gj ∈G
The BoG representation represents an interaction sub-graph in terms of a
histogram which records the normalized frequency with which each grapheme
from the grapheme vocabulary occurs in the interaction sub-graph. We learn
verb models for each verb class by using a one vs all learning scheme with
SVM that uses χ2 histogram kernel to compute the similarity between a pair of
graphs.
3.4
Video Event Detection as finding an Optimal Covering
of an Activity Graph
Given an unseen video the task of verb detection can be formulated as the task
of finding the most probable covering of the object tracks with interactions that
are detected as belonging to certain verb classes. In our framework, this task
naturally translates to finding the most probable covering of the corresponding
activity graph with interaction sub-graphs using a learned verb model.
10
In order to identify the most likely sub-interaction graphs given the event
class models, we first exhaustively mine all the interaction sub-graphs of the
activity graph. For each of these sub-graphs, we measure the likelihood with
respect to the learned model for each event class. This results in an initial interpretation of the activity graph in terms of all possible and highly overlapping
sub-interaction graphs, each of which have a certain likelihood with respect to
each of the event classes.
In order to obtain an interpretation with the above properties, we first filter
less likely graphs by applying a threshold to choose only those graphs whose
likelihood probability with respect to the most likely class (for that graph)
exceeds the threshold. We further filter those graphs whose probabilities do
not decline rapidly beyond the top k probabilities. We perform this filtering
operation to remove graphs that do not clearly belong to a small subset of
classes.
3.5
Summary and Future Work
One direction for future research is to investigate the role of other qualitative
relations and their role in representing activities. Another interesting direction
is to model human actions by considering relationships between body parts.
These body parts could be obtained using part-based models. A principal contribution of this paper is a general way of addressing problems in video activity
understanding using graph based relational learning. In the future, it would
be interesting to extend this formalism to other tasks in activity understanding
such as anomaly detection, scene description and gap filling.
References
[1] Hanchuan Peng, Fuhui Long, and Chris Ding. Feature selection based on
mutual information: criteria of max-dependency, max-relevance, and minredundancy. IEEE Transactions on Pattern Analysis and Machine Intelligence, 27:1226–1238, 2005.
[2] Muralikrishna Sridhar, Anthony G. Cohn, and David C. Hogg. Unsupervised
learning of event classes from video. In Proc. AAAI, pages 1631–1638. AAAI
Press, 2010.
[3] Muralikrishna Sridhar, Anthony G. Cohn, and David C. Hogg. Benchmarking qualitative spatial calculi for video activity analysis. In Proc. IJCAI
Workshop Benchmarks and Applications of Spatial Reasoning, pages 15–20,
2011.
[4] Muralikrishna Sridhar, Anthony G. Cohn, and David C. Hogg. From video
to rcc8: Exploiting a distance based semantics to stabilise the interpretation
of mereotopological relations. In Max J. Egenhofer, Nicholas A. Giudice,
Reinhard Moratz, and Michael F. Worboys, editors, COSIT, volume 6899 of
Lecture Notes in Computer Science, pages 110–125. Springer, 2011.
11