1
SO FTGEN ETI
CS
®
TM
Aut
omat
edChi
mer
i
sm
Anal
ysi
sSof
t
war
e
User M anual
SO FTGEN ETI
CS®
Sof
tware PowerTool
sf
orGeneti
cs Anal
ysi
s
www.
sof
tgeneti
cs.
com
Copyright, Licenses and Trademarks
©2001-2012 SoftGenetics LLC. All rights reserved. No part of this publication may be
reproduced, transmitted, transcribed, or translated into any language in any form by any means
without the written permission of SoftGenetics LLC. The software is copyrighted
and cannot be altered or given to a third party without the written authorization from
SoftGenetics LLC. The software may be licensed from Soft Genetics LLC. Mutation
Explorer, Mutation Surveyor, NextGENe, JelMarker, ChimerMarker and GeneMarker are
trademarks of SoftGenetics LLC. All other product names and/or logos are trademarks of their
respective owners.
Limited Liability of Using the Software
In no event shall Soft Genetics LLC. be liable for direct, indirect, incidental, special, exemplary,
or consequential damages (including, but not limited to, procurement of substitute goods or
services; loss of use, data, or profits; or business interruption), however caused and any theory of
liability, whether in contract, strict liability, or tort (including negligence or otherwise) arising in
any way out of use of this software, even if advised of the possibility of such damage.
SoftGenetics End User License Agreement
For NextGene, GeneMarkerMTP and ChimerMarker
NOTICETOUSER:PLEASEREADTHISCONTRACTCAREFULLY.BYUSINGALLORANYPORTIONOFTHESOFTWAREYOUACCEPTALLTHE
TERMSANDCONDITIONSOFTHISAGREEMENT,INCLUDING,INPARTICULARTHELIMITATIONSON:USECONTAINEDINSECTION2;
TRANSFERABILITYINSECTION4;WARRANTYINSECTION6AND7;LIABILITYINSECTION8.YOUAGREETHATTHISAGREEMENTIS
ENFORCEABLELIKEANYWRITTENNEGOTIATEDAGREEMENTSIGNEDBYYOU.IFYOUDONOTAGREE,DONOTUSETHISSOFTWARE.IF
YOUACQUIREDTHESOFTWAREONTANGIBLEMEDIA(e.g.CD)WITHOUTANOPPORTUNITYTOREVIEWTHISLICENSEANDYOUDONOT
ACCEPTTHISAGREEMENT,YOUMAYOBTAINAREFUNDOFTHEAMOUNTYOUORIGINALLYPAIDIFYOU:(A)DONOTUSETHE
SOFTWAREAND(B)RETURNIT,WITHPROOFOFPAYMENT,TOTHELOCATIONFROMWHICHITWASOBTAINEDWITHINTHIRTY(30)
DAYSOFTHEPURCHASEDATE.
1.Definitions."Software"means(a)allofthecontentsofthefiles,disk(s),CD‐ROM(s)orothermediawithwhichthisAgreementisprovided,
includingbutnotlimitedto(i)SoftGenetics,LLCorthirdpartycomputerinformationorsoftware;(ii)digitalimages,stockphotographs,clip
art,soundsorotherartisticworks("StockFiles");(iii)relatedexplanatorywrittenmaterialsorfiles("Documentation");and(iv)fonts;and
(b)upgrades,modifiedversions,updates,additions,andcopiesoftheSoftware,ifany,licensedtoyoubySoftGenetics,LLC(collectively,
"Updates")."Use"or"Using"meanstoaccess,install,download,copyorotherwisebenefitfromusingthefunctionalityoftheSoftwarein
accordancewiththeDocumentation."PermittedNumber"meansone(1)unlessotherwiseindicatedunderavalidlicense(e.g.volume
license)grantedbySoftGenetics,LLC."Computer"meansanelectronicdevicethatacceptsinformationindigitalorsimilarformand
manipulatesitforaspecificresultbasedonasequenceofinstructions."SoftGenetics,LLC"meansSoftGenetics,LLCStateCollege,PA16803
2.SoftwareLicense.AslongasyoucomplywiththetermsofthisEndUserLicenseAgreement(the"Agreement")andpayalllicensefeesfor
theSoftware,SoftGenetics,LLCgrantstoyouforaperiodofone(1)yearanon‐exclusivelicensetoUsetheSoftwareforthepurposes
describedintheDocumentation.SomethirdpartymaterialsincludedintheSoftwaremaybesubjecttoothertermsandconditions,whichare
typicallyfoundina"ReadMe"filelocatednearsuchmaterials.
2.1.GeneralUse.YoumayinstallandUseacopyoftheSoftwareonyourcompatiblecomputer,usetheSoftwareonacomputerfileserver,
providedconcurrentusedoesnotexceedthePermittedNumber.Noothernetworkuseispermitted,includingbutnotlimitedto,usingthe
Softwareeitherdirectlyorthroughcommands,dataorinstructionsfromortoacomputernotpartofyourinternalnetwork,forinternetor
webhostingservicesorbyanyusernotlicensedtousethiscopyoftheSoftwarethroughavalidlicensefromSoftGenetics,LLC;and
2.2.BackupCopy.YoumaymakeonebackupcopyoftheSoftware,providedyourbackupcopyisnotinstalledorusedonanycomputer.You
maynottransfertherightstoabackupcopyunlessyoutransferallrightsintheSoftwareasprovidedunderSection4.
2.3.HomeUse.You,astheprimaryuserofthecomputeronwhichtheSoftwareisinstalled,mayalsoinstalltheSoftwareononeofyourhome
computers.However,theSoftwaremaynotbeusedonyourhomecomputeratthesametimetheSoftwareontheprimarycomputerisbeing
used.
2.4.StockFiles.Unlessstatedotherwiseinthe"Read‐Me"filesassociatedwiththeStockFiles,whichmayincludespecificrightsand
restrictionswithrespecttosuchmaterials,youmaydisplay,modify,reproduceanddistributeanyoftheStockFilesincludedwiththe
Software.However,youmaynotdistributetheStockFilesonastand‐alonebasis,i.e.,incircumstancesinwhichtheStockFilesconstitutethe
primaryvalueoftheproductbeingdistributed.StockFilesmaynotbeusedintheproductionoflibelous,defamatory,fraudulent,lewd,
obsceneorpornographicmaterialoranymaterialthatinfringesuponanythirdpartyintellectualpropertyrightsorinanyotherwiseillegal
manner.YoumaynotclaimanytrademarkrightsintheStockFilesorderivativeworksthereof.
2.5.UseracknowledgesandagreesthattheSoftwareislicensedbySoftGeneticsforresearchuseonlyAnyviolationofthisrestrictiononuse
shallconstituteabreachofthisAgreement.UserassumesallriskforuseoftheSoftware.UserfurtheracknowledgesthatUserisresponsible
forvalidatingtheSoftwareforuseinUser’sintendedapplicationsDuetothenatureofcomputers,software,andinstallationprocedures,
SoftGeneticscannotacceptanyliabilityorresponsibilityforvalidationoftheSoftwareinanyofUser’sapplications.
3.IntellectualPropertyRights.TheSoftwareandanycopiesthatyouareauthorizedbySoftGenetics,LLCtomakearetheintellectual
propertyofandareownedbySoftGenetics,LLCanditssuppliers.Thestructure,organizationandcodeoftheSoftwarearethevaluabletrade
secretsandconfidentialinformationofSoftGenetics,LLCanditssuppliers.TheSoftwareisprotectedbycopyright,includingwithout
limitationbyUnitedStatesCopyrightLaw,internationaltreatyprovisionsandapplicablelawsinthecountryinwhichitisbeingused.You
maynotcopytheSoftware,exceptassetforthinSection2("SoftwareLicense").Anycopiesthatyouarepermittedtomakepursuanttothis
AgreementmustcontainthesamecopyrightandotherproprietarynoticesthatappearonorintheSoftware.Youalsoagreenottoreverse
engineer,decompile,disassembleorotherwiseattempttodiscoverthesourcecodeoftheSoftwareexcepttotheextentyoumaybeexpressly
permittedtodecompileunderapplicablelaw,itisessentialtodosoinordertoachieveoperabilityoftheSoftwarewithanothersoftware
program,andyouhavefirstrequestedSoftGenetics,LLCtoprovidetheinformationnecessarytoachievesuchoperabilityandSoftGenetics,
LLChasnotmadesuchinformationavailable.SoftGenetics,LLChastherighttoimposereasonableconditionsandtorequestareasonablefee
beforeprovidingsuchinformation.AnyinformationsuppliedbySoftGenetics,LLCorobtainedbyyou,aspermittedhereunder,mayonlybe
usedbyyouforthepurposedescribedhereinandmaynotbedisclosedtoanythirdpartyorusedtocreateanysoftwarewhichis
substantiallysimilartotheexpressionoftheSoftware.RequestsforinformationshouldbedirectedtoSoftGenetics,LLC.Trademarksshallbe
usedinaccordancewithacceptedtrademarkpractice,includingidentificationoftrademarksowners'names.Trademarkscanonlybeusedto
identifyprintedoutputproducedbytheSoftwareandsuchuseofanytrademarkdoesnotgiveyouanyrightsofownershipinthattrademark.
Exceptasexpresslystatedabove,thisAgreementdoesnotgrantyouanyintellectualpropertyrightsintheSoftware.
4.Transfer.Youmaynot,rent,lease,sublicenseorauthorizealloranyportionoftheSoftwaretobecopiedontoanotheruserscomputer
exceptasmaybeexpresslypermittedherein.Youmay,however,transferallyourrightstoUsetheSoftwaretoanotherpersonorlegalentity
providedthat:(a)youalsotransferthisAgreement,theSoftwareandallothersoftwareorhardwarebundledorpre‐installedwiththe
Software,includingallcopies,Updatesandpriorversions,andallcopiesoffontsoftwareconvertedintootherformats,tosuchpersonor
entity;(b)youretainnocopies,includingbackupsandcopiesstoredonacomputer;and(c)thereceivingpartyacceptsthetermsand
conditionsofthisAgreementandanyothertermsandconditionsuponwhichyoulegallypurchasedalicensetotheSoftware.
Notwithstandingtheforegoing,youmaynottransfereducation,pre‐release,ornotforresalecopiesoftheSoftware.
5.MultipleEnvironmentSoftware/MultipleLanguageSoftware/DualMediaSoftware/MultipleCopies/Bundles/Updates.IftheSoftware
supportsmultipleplatformsorlanguages,ifyoureceivetheSoftwareonmultiplemedia,ifyouotherwisereceivemultiplecopiesofthe
Software,orifyoureceivedtheSoftwarebundledwithothersoftware,thetotalnumberofyourcomputersonwhichallversionsofthe
SoftwareareinstalledmaynotexceedthePermittedNumber.Youmaynot,rent,lease,sublicense,lendortransferanyversionsorcopiesof
suchSoftwareyoudonotUse.IftheSoftwareisanUpdatetoapreviousversionoftheSoftware,youmustpossessavalidlicensetosuch
previousversioninordertoUsetheUpdate.YoumaycontinuetoUsethepreviousversionoftheSoftwareonyourcomputerafteryou
receivetheUpdatetoassistyouinthetransitiontotheUpdate,providedthat:theUpdateandthepreviousversionareinstalledonthesame
computer;thepreviousversionorcopiesthereofarenottransferredtoanotherpartyorcomputerunlessallcopiesoftheUpdatearealso
transferredtosuchpartyorcomputer;andyouacknowledgethatanyobligationSoftGenetics,LLCmayhavetosupportthepreviousversion
oftheSoftwaremaybeendeduponavailabilityoftheUpdate.
6.LIMITEDWARRANTY.SoftGenetics,LLC.warrantstothepersonorentitythatpurchasesalicensefortheSoftwareforusepursuanttothe
termsofthislicensethattheSoftwarewillperformsubstantiallyinaccordancewiththeDocumentationfortheninety(90)dayperiod
followingreceiptoftheSoftwarewhenusedontherecommendedhardwareconfiguration.Non‐substantialvariationsofperformancefrom
theDocumentationdoesnotestablishawarrantyright.THISLIMITEDWARRANTYDOESNOTAPPLYTOUPDATES,FONTSOFTWARE
CONVERTEDINTOOTHERFORMATS,PRE‐RELEASE(BETA),TRYOUT,PRODUCTSAMPLER,ORNOTFORRESALE(NFR)COPIESOF
SOFTWARETomakeawarrantyclaim,youmustreturntheSoftwaretothelocationwhereyouobtaineditalongwithproofofpurchase
withinsuchninety(90)dayperiod.IftheSoftwaredoesnotperformsubstantiallyinaccordancewiththeDocumentation,theentireliability
ofSoftGenetics,LLCandyourexclusiveremedyshallbelimitedtoeither,atSoftGenetics,LLCoption,thereplacementoftheSoftwareorthe
refundofthelicensefeeyoupaidfortheSoftware.THELIMITEDWARRANTYSETFORTHINTHISSECTIONGIVESYOUSPECIFICLEGAL
RIGHTS.YOUMAYHAVEADDITIONALRIGHTSWHICHVARYFROMJURISDICTIONTOJURISDICTION.Forfurtherwarrantyinformation,
pleaseseethejurisdictionspecificinformationattheendofthisAgreement,ifany,orcontactSoftGenetics,LLC'sCustomerSupport
Department.
7.DISCLAIMER.THEFOREGOINGLIMITEDWARRANTYSTATESTHESOLEANDEXCLUSIVEREMEDIESFORSOFTGENETICS,LLC'SORITS
SUPPLIER'SBREACHOFWARRANTY.SOFTGENETICS,LLCANDITSSUPPLIERSDONOTANDCANNOTWARRANTTHEPERFORMANCE,
MERCHANTABILITYORRESULTSYOUMAYOBTAINBYUSINGTHESOFTWARE.EXCEPTFORTHEFOREGOINGLIMITEDWARRANTY,AND
FORANYWARRANTY,CONDITION,REPRESENTATIONORTERMTOTHEEXTENTTOWHICHTHESAMECANNOTORMAYNOTBE
EXCLUDEDORLIMITEDBYLAWAPPLICABLETOYOUINYOURJURISDICTION,SOFTGENETICS,LLCANDITSSUPPLIERSMAKENO
WARRANTIES,CONDITIONS,REPRESENTATIONSORTERMS,EXPRESSORIMPLIED,WHETHERBYSTATUTE,COMMONLAW,CUSTOM,
USAGEOROTHERWISEASTOANYOTHERMATTERS,INCLUDINGBUTNOTLIMITEDTONON‐INFRINGEMENTOFTHIRDPARTYRIGHTS,
INTEGRATION,SATISFACTORYQUALITYORFITNESSFORANYPARTICULARPURPOSE.TheprovisionsofthisSection7shallsurvivethe
terminationofthisAgreement,howsoevercaused,butthisshallnotimplyorcreateanycontinuedrighttoUsetheSoftwareaftertermination
ofthisAgreement.
8.LIMITATIONOFLIABILITY.INNOEVENTWILLSOFTGENETICS,LLCORITSSUPPLIERSBELIABLETOYOUFORANYDAMAGES,CLAIMS
ORCOSTSWHATSOEVERORANYCONSEQUENTIAL,INDIRECT,INCIDENTALDAMAGES,ORANYLOSTPROFITSORLOSTSAVINGS,EVENIF
ASOFTGENETICS,LLCREPRESENTATIVEHASBEENADVISEDOFTHEPOSSIBILITYOFSUCHLOSS,DAMAGES,CLAIMSORCOSTSORFOR
ANYCLAIMBYANYTHIRDPARTY.THEFOREGOINGLIMITATIONSANDEXCLUSIONSAPPLYTOTHEEXTENTPERMITTEDBYAPPLICABLE
LAWINYOURJURISDICTION.SOFTGENETICS,LLC'SAGGREGATELIABILITYANDTHATOFITSSUPPLIERSUNDERORINCONNECTION
WITHTHISAGREEMENTSHALLBELIMITEDTOTHEAMOUNTPAIDFORTHESOFTWARE,IFANY.SoftGenetics,LLCisactingonbehalfofits
suppliersforthepurposeofdisclaiming,excludingand/orlimitingobligations,warrantiesandliabilityasprovidedinthisAgreement,butin
nootherrespectsandfornootherpurpose.Forfurtherinformation,pleaseseethejurisdictionspecificinformationattheendofthis
Agreement,ifany,orcontactSoftGenetics,LLC
9.ExportRules.YouagreethattheSoftwarewillnotbeshipped,transferredorexportedintoanycountryorusedinanymannerprohibited
bytheUnitedStatesExportAdministrationActoranyotherexportlaws,restrictionsorregulations(collectivelythe"ExportLaws").In
addition,iftheSoftwareisidentifiedasexportcontrolleditemsundertheExportLaws,yourepresentandwarrantthatyouarenotacitizen,
orotherwiselocatedwithin,anembargoednation(includingwithoutlimitationIran,Iraq,Syria,Sudan,Libya,Cuba,NorthKorea,andSerbia)
andthatyouarenototherwiseprohibitedundertheExportLawsfromreceivingtheSoftware.AllrightstoUsetheSoftwarearegrantedon
conditionthatsuchrightsareforfeitedifyoufailtocomplywiththetermsofthisAgreement.
10.GoverningLaw.ThisAgreementwillbegovernedbyandconstruedinaccordancewiththesubstantivelawsinforceintheStateof
Pennsylvania,UnitedStatesofAmerica.
June2012
Table of Contents
TABLE OF CONTENTS CHIMERMARKER V.3.0.2
CHAPTER 1 INSTALLING CHIMERMARKER ...................................................................................................... 5
COMPUTER SYSTEM REQUIREMENTS ...........................................................................................................................6
VALIDATION VERSION ...............................................................................................................................................6
Installation.......................................................................................................................................................6
LOCAL-LICENSING OPTION .........................................................................................................................................7
Installation.......................................................................................................................................................7
Registration .....................................................................................................................................................8
NETWORK-LICENSING OPTION ....................................................................................................................................8
Install License Server Manager ........................................................................................................................8
Register License Server Manager for ChimerMarker Usage ............................................................................9
Installing ChimerMarker Software ................................................................................................................10
QUESTIONS...........................................................................................................................................................11
CHAPTER 2 CHIMERISM ANALYSIS ............................................................................................................... 13
OVERVIEW............................................................................................................................................................14
PROCEDURE ..........................................................................................................................................................14
IMPORT DATA FILES ...............................................................................................................................................14
Procedure ......................................................................................................................................................14
Features .........................................................................................................................................................14
RAW DATA ANALYSIS..............................................................................................................................................15
SELECT PRE-TRANSPLANT SAMPLE IDENTIFIERS ............................................................................................................15
SELECT ALLELE AND SIZE CALL PARAMETERS................................................................................................................16
REVIEW MAIN ANALYSIS SCREEN RESULTS ..................................................................................................................18
AUTOMATED CHIMERISM DETECTION AND QUANTIFICATION..........................................................................................19
ALTERNATIVE METHOD PROCEDURE ..........................................................................................................................21
SELECT PRE-TRANSPLANT SAMPLE IDENTIFIERS ............................................................................................................22
Genotype the single source samples .............................................................................................................22
Automated Chimerism Calculations ..............................................................................................................25
TOOLS AND ICONS ..................................................................................................................................................27
COMPREHENSIVE RESEARCH REPORT .........................................................................................................................29
Print Individual Markers ................................................................................................................................32
LONGITUDINAL REPORT FOR ENGRAFTMENT MONITORING / DETECTION OF MALIGNANT RELAPSE ........................................34
Procedure ......................................................................................................................................................34
Icons and Functions .......................................................................................................................................34
What to Expect ..............................................................................................................................................37
CHIMERISM CALCULATIONS......................................................................................................................................38
DECISION PATHWAY FOR SINGLE DONOR CHIMERISM CALCULATIONS ..............................................................................40
DECISION PATHWAY FOR DOUBLE DONOR CHIMERISM CALCULATIONS.............................................................................42
CHAPTER 3 GENOTYPING GENERAL PROCEDURE.......................................................................................... 59
OVERVIEW............................................................................................................................................................60
IMPORT DATA FILES ...............................................................................................................................................60
Procedure ......................................................................................................................................................60
Features .........................................................................................................................................................60
RAW DATA ANALYSIS..............................................................................................................................................61
Main Toolbar Icons ........................................................................................................................................61
What to Expect ..............................................................................................................................................62
PROCESS DATA ......................................................................................................................................................64
Run Wizard Template Selection .....................................................................................................................64
1
May 2013
Table of Contents
Run Wizard Data Process ..............................................................................................................................65
Run Wizard Additional Settings .....................................................................................................................67
ADJUST ANALYSIS PARAMETERS ................................................................................................................................68
Re-analyze with Run Wizard ..........................................................................................................................68
Re-analyze with Auto Run .............................................................................................................................68
Re-analyze Individual Samples ......................................................................................................................68
CHAPTER 4 GENOTYPING MAIN ANALYSIS OVERVIEW ................................................................................. 69
MAIN ANALYSIS WINDOW.......................................................................................................................................70
Sample File Tree ............................................................................................................................................70
Synthetic Gel Image and Electropherogram with Peak Table .......................................................................72
Report Table ..................................................................................................................................................76
MENU OPTIONS ....................................................................................................................................................77
File Menu .......................................................................................................................................................77
View Menu.....................................................................................................................................................77
Project Menu .................................................................................................................................................80
Applications Menu .........................................................................................................................................81
Tools Menu ....................................................................................................................................................81
Help Menu .....................................................................................................................................................82
MAIN TOOLBAR ICONS ............................................................................................................................................82
ADDITIONAL ANALYSIS OPTIONS ...............................................................................................................................84
Browse By All Colors ......................................................................................................................................84
Profile Comparison View ...............................................................................................................................84
CHAPTER 5 FRAGMENT SIZING STANDARDS................................................................................................. 87
SIZE TEMPLATE EDITOR ...........................................................................................................................................88
Procedure ......................................................................................................................................................90
Icons and Functions .......................................................................................................................................91
What to Expect ..............................................................................................................................................92
SIZE CALIBRATION CHARTS.......................................................................................................................................93
Procedure ......................................................................................................................................................95
Icons and Functions .......................................................................................................................................96
What to Expect ..............................................................................................................................................97
CHAPTER 6 PANEL EDITOR ........................................................................................................................... 99
OVERVIEW..........................................................................................................................................................100
Project Panel................................................................................................................................................100
Panel Templates ..........................................................................................................................................100
Sample List ..................................................................................................................................................101
Overlay Trace...............................................................................................................................................101
Panel Table ..................................................................................................................................................104
PROCEDURE ........................................................................................................................................................105
Pre-Defined Panels ......................................................................................................................................105
Custom Panel Creation ................................................................................................................................105
Adjusting Panels ..........................................................................................................................................107
Genotyping and Chimertyping Panels .........................................................................................................107
Editing a Chimertyping Panel ......................................................................................................................108
OPTIONS, FUNCTIONS AND ICONS ...........................................................................................................................109
Menu Options ..............................................................................................................................................109
Toolbar Icons ...............................................................................................................................................110
Saving a panel with signal information .......................................................................................................111
Project Panel................................................................................................................................................111
WHAT TO EXPECT ................................................................................................................................................112
2
May 2013
Table of Contents
CHAPTER 7 REPORTS AND PRINTING .......................................................................................................... 115
REPORT TABLE ....................................................................................................................................................116
Allele List .....................................................................................................................................................116
Bin Table ......................................................................................................................................................117
Peak Table ...................................................................................................................................................118
Allele Count .................................................................................................................................................119
PRINT REPORT.....................................................................................................................................................120
Report Content Options ...............................................................................................................................121
Icons and Functions .....................................................................................................................................122
SAVE PROJECT .....................................................................................................................................................122
CHAPTER 8 MATERNAL CELL CONTAMINATION ANALYSIS .......................................................................... 123
MATERNAL CELL CONTAMINATION (MCC) ANALYSIS .................................................................................................124
Overview ......................................................................................................................................................124
Procedure ....................................................................................................................................................124
Results .........................................................................................................................................................127
Tools and Icons ............................................................................................................................................127
Comprehensive Reports ...............................................................................................................................130
CHAPTER 9 ADDITIONAL TOOLS ................................................................................................................. 131
AUTOMATED CONTROL CONCORDANCE ...................................................................................................................132
NEGATIVE CONTROL CONCORDANCE .......................................................................................................................133
FILENAME GROUP EDITOR .....................................................................................................................................133
OUTPUT TRACE DATA ...........................................................................................................................................134
CONVERT TXT TO BINARY......................................................................................................................................135
EXPORT ELECTROPHEROGRAM ................................................................................................................................135
CHAPTER 10 USER MANAGEMENT ............................................................................................................. 137
OVERVIEW..........................................................................................................................................................138
PROCEDURE ........................................................................................................................................................138
USER MANAGER ..................................................................................................................................................138
HISTORY.............................................................................................................................................................139
SETTINGS ...........................................................................................................................................................139
EDIT HISTORY/AUDIT TRAIL ...................................................................................................................................139
INDEX .......................................................................................................................................................... 141
3
May 2013
Table of Contents
4
May 2013
Chapter1 Installing ChimerMarker
Chapter 1 Installing ChimerMarker
Chapter 1 Installing ChimerMarker
Computer System Requirements
Local Version
Network Version
Questions
5
May 2013
Chapter1 Installing ChimerMarker
Computer System Requirements
ChimerMarker software has been tested and validated for various computer systems. The minimum system
requirements are:
Windows® PC
OS: Windows® 98, NT, XP, Vista, Windows® 7
Processor: Pentium® III, 1 GHz
RAM: 512MB CPU
Available hard disk space: 20GB
Intel® Powered Macintosh®
OS: 10.4.6, with Parallels® desktop for MAC or VMware Fusion® or Apple™ Boot Camp
RAM: 2GB
Available hard disk space: 20GB
Installation of ChimerMarker is not supported on Linux or UNIX-based operating systems.
ChimerMarker will only recognize PC file formats. To convert Macintosh file formats to PC file formats, please
download the ABI PRISM® 3100 Genetic Analyzer Conversion Utilities to convert Mac files to PC files at:
http://www.appliedbiosystems.com/support/software/3100/conversion.cfm
Validation Version
The validation or trial version of ChimerMarker can be installed on as many computers as you wish. The trial
period expires 35 days after installation of the software.
Installation
1.
Insert the SoftGenetics CD into the CD-ROM drive. If your computer
is not set to automatically open a CD, navigate to the optical or CDROM drive on the computer and open the directory.
2. Double-click the ChimerMarker Setup executable file (EXE)
3. The Installation Wizard will launch
4. Click the Next button in the Welcome window
5. Read the SoftGenetics End User License Agreement, check the option “I
accept the terms of the License Agreement”, and click Next in the
Read Me File window
6. Select “Install ChimerMarker (Recommended)” in the Select Program
window and click Next
7. Click Next in the Destination Location window to install
ChimerMarker in the default folder. Click the Browse button to
choose a different installation directory
NOTE: The default Destination Location for the ChimerMarker program is
C:\ProgramFiles\SoftGenetics\ChimerMarker\”version number”
8. Click Next in the Select Program Manager Group window to accept the
default Program Manager Group
NOTE: Changing the Program Manager Group default may affect program
operability. It is recommended to accept the default.
9. Click Next in the Start Installation window to install ChimerMarker
10. Click Finish in the Installation Complete window
11. The Installation Wizard will close
12. Eject the SoftGenetics CD
13. Launch ChimerMarker by double-clicking the ChimerMarker
desktop icon OR open the Start menu and navigate to SoftGenetics →
ChimerMarker, the version that was just installed → ChimerMarker
program
6
May 2013
Chapter1 Installing ChimerMarker
14. The Configure window will appear. Click Run Validation to launch the software
15. If the Run Validation button is grayed-out this indicates the 35-day trial period has expired.
Local-licensing Option
ChimerMarker v2.8.1 software and above supports text-based registration for the local-licensing option.
Text-based registration does not require a USB device, dongle, or key. This text-based registration ID is
registered to one specific PC--the license will be 'locked' to this one PC. If the license needs to be transferred to a
different PC, registration for that one license/PC must be inactivated first before the software can be registered
to a new PC.
Installation
1.
2.
3.
4.
5.
Insert the SoftGenetics CD into the optical or CD-ROM drive. If
your computer is not set to automatically open a CD, navigate to
the optical or CD-ROM drive on the computer and open the
directory.
Double-click the ChimerMarker Setup executable file (EXE)
The Installation Wizard will launch
Click the Next button in the Welcome window
Read the SoftGenetics End User License Agreement, check the option
“I accept the terms of the License Agreement”, and click Next in
the Read Me File window
6.
Select “Install ChimerMarker (Recommended)” in the Select
Program window and click Next
7. Click Next in the Destination Location window to install
ChimerMarker in the default folder. Click the Browse button to
choose a different installation directory
NOTE: The default Destination Location for the ChimerMarker program
is C:\ProgramFiles\SoftGenetics\ChimerMarker\ver#
8. Click Next in the Select Program Manager Group window to accept
the default Program Manager Group
NOTE: Changing the Program Manager Group default may affect
program operability. It is recommended to accept the default.
9. Click Next in the Start Installation window to install ChimerMarker
10. Click Finish in the Installation Complete window
11. The Installation Wizard will close
12. Eject the SoftGenetics CD
13. Launch ChimerMarker by double-clicking the ChimerMarker
desktop icon OR open the Start menu and navigate to SoftGenetics
→ ChimerMarker, the version that was just installed → ChimerMarker
program
14. The Configure/Registration window will appear. Click Register Now
to register the local license
15. Select local-licensing registration method from the Choose Registration Method dialog box:
a. Click Register Local Text-based Key
7
May 2013
Chapter1 Installing ChimerMarker
Registration
1.
2.
The Register Local Text-based Key window appears for the Register
Local Text-based Key method.
If the computer ChimerMarker is being installed on has an
internet connection, select Register Online. If the computer
does not have an internet connection or is connected to a proxy
server, select Register Offline.
Online Registration
A.
B.
C.
D.
E.
Locate the Account and Password on the SoftGenetics CD.
Enter your Account, Password, and e-mail address information in the appropriate fields
The Request Code information is automatically generated by ChimerMarker
Click Register
Your software will be registered automatically. A confirmation e-mail will be sent to you once registration
is complete.
NOTE: Some characters can commonly be misread. If you get an error trying to register, check for number “1”
and lower case letter “L” or number “0” and upper case letter “O” confusion.
F. Launch ChimerMarker and begin analysis
Offline Registration
A. Click the Register Offline option. The license message displays the
offline registration procedure, “Email the User ID, Account, and
Password to [email protected] by clicking the Copy
button then pasting into an email. SoftGenetics will send a reply
with the appropriate Registration ID. Paste this ID into the
Registration ID field. Click Register to complete the registration
process.” Click OK
B. Enter your Account and Password information from the SoftGenetics
CD and use the Copy button to copy this information along with
the Request Code string and paste into the body of an e-mail
C. Send the e-mail to [email protected]
D. The Registration ID will be sent to you (via e-mail) within one
business day
E. Copy and paste the entire Registration ID from the e-mail into the
Register ID field
F. Click Register
G. Launch ChimerMarker and begin analysis
Network-licensing Option
Installing License Server Manager and ChimerMarker Software
The network-licensing option of ChimerMarker can be installed on any computer in a network configuration.
SoftGenetics uses the License Server Manager (LSM) to control the number of concurrent users accessing the
network-licensing option of ChimerMarker v2.00 (and above). LSM uses text-based registration—no hardware is
required. Both software components, ChimerMarker and LSM, are installed from the same EXE. The computer
where License Server Manager program is installed is considered the “Server” computer. Computers on the
network other than the Server are called “Client” computers.
Installing License Server Manager will require restarting the system to complete installation. Please save all
work and close all applications before installing LSM.
Install License Server Manager
8
May 2013
Chapter1 Installing ChimerMarker
1.
Insert the SoftGenetics CD into the optical or CD-ROM drive. If your
computer is not set to automatically open a CD, navigate to the
optical or CD-ROM drive on the computer and open the directory.
2. Double-click the ChimerMarker Setup executable file (EXE)
3. The Installation Wizard will launch
4. Click the Next button in the Welcome window
5. Read the SoftGenetics End User License Agreement, check the option “I
accept the terms of the License Agreement”, and click Next in the
Read Me File window
6. Select “Install License Server Manager” in the Select Program
window and click Next
7. Click Next in the Destination Location window, Next in the Select
Program Manager Group window, and Next in the Start Installation
window to enter the LSM installation wizard
8. Click the Next button in the Welcome window
9. Read the SoftGenetics End User License Agreement, check the option “I
accept the terms of the License Agreement”, and click Next in the
Read Me File window
10. Click Next in the Destination Location window to install LSM in the
default folder. Click the Browse button to choose a different
installation directory
NOTE: The default Destination Location for the License Server
Manager program is C:\ProgramFiles\SoftGenetics\License
Server
11. Click Next in the Start Installation window to install License
Server Manager
12. Select the Launch License Server Manager option and click
Finish
13. Click OK in the Install window to
restart the system.
14. The Installation Wizard will close
and the system will restart
15. Eject the SoftGenetics CD
Register License Server Manager for ChimerMarker Usage
1. Open License Server from the System or Icon Tray by clicking the LSM
NOTE: A red star indicates the License server is not running. The icon with a
star indicates the License Server is running properly.
2.
3.
4.
5.
Click OK in the dialog box to proceed with registering License Server
from the License Server Manager console.
Select Register from the Help menu to activate the Register Product
window
Select ChimerMarker from the Register
Product Name drop-down menu
If the computer License Server is being
installed on has an internet connection,
select Online Registration. If the
computer does not have an internet
connection or is connected to a proxy
server, select Offline Registration.
Online Registration
A. Locate the Account and Password on
the SoftGenetics CD
9
May 2013
icon
white
Chapter1 Installing ChimerMarker
B.
C.
D.
E.
Enter your Account, Password, and E-mail address information in the appropriate fields
The Request Code information is automatically generated by License Server
Click Register
Your software will be registered automatically. A confirmation
mail will be sent to you once registration is complete
NOTE: Some characters can commonly be misread. If you get an
error trying to register, check for number “1” and lower case letter
“L” or number “0” and upper case letter “O” confusion.
F. Restart License Server to apply the registration information
G. Install ChimerMarker software and configure network client
e-
Offline Registration
H. Copy and paste the entire Request ID string from the Register
Online dialog, and type your Account and Password information
from the SoftGenetics CD into the body of an e-mail
I. Send the -email to [email protected]
J. The Register ID character string will be sent to you via e-mail
within one business day
K.
Copy and paste the Registration ID from the e-mail into the Register
ID field of the Offline Registration tab. Please be sure to copy the
entire registration ID character string
L. Click Register
M. Restart License Server to apply the registration information
N. Install ChimerMarker software and configure network client
Installing ChimerMarker Software
Install ChimerMarker
computers
software
on
client
16. Insert the SoftGenetics CD into the optical or CD-ROM drive. If
your computer is not set to automatically open a CD, navigate
the optical or CD-ROM drive on the computer and open the
directory
17. Double-click the ChimerMarker Setup executable file (EXE)
18. The Installation Wizard will launch
19. Click the Next button in the Welcome window
20. Read the SoftGenetics End User License Agreement, check the
option “I accept the terms of the License Agreement”, and
click Next in the Read Me File window
21. Select “Install ChimerMarker (Recommended)” in the Select
Program window and click Next
22. Click Next in the Destination Location window to install
ChimerMarker in the default folder. Click the Browse button
choose a different installation directory
NOTE: The default Destination Location for the ChimerMarker
program is C:\ProgramFiles\SoftGenetics\ChimerMarker\ver#
23. Click Next in the Select Program Manager Group window to
accept the default Program Manager Group
NOTE: Changing the Program Manager Group default may affect
program operability. It is recommended to accept the default.
24. Click Next in the Start Installation window to install
ChimerMarker
25. Click Finish in the Installation Complete window
26. The Installation Wizard will close
27. Eject the SoftGenetics CD
10
May 2013
to
to
Chapter1 Installing ChimerMarker
28. Launch ChimerMarker by double-clicking the ChimerMarker desktop icon OR open the Start menu and
navigate to SoftGenetics → ChimerMarker, the version that was just installed → ChimerMarker program
29. The Configure/Registration window will appear. Click Configure
Network Client to configure the client software to contact License
Server Manager
30. Click Configure Connection to License Server Manager from the
Choose Network Configuration dialog box
31. Input ‘Server Name’ or ‘Server IP Address’ of the License Server
Manager server
32. Click Configure and ChimerMarker software will automatically
open if connection is properly established and a license is
available
Questions
If you have any questions during installation, setup, or program operation, please contact us at (814) 237-9340
OR (888) 791-1270 OR email us at [email protected]
11
May 2013
Chapter 2 Chimerism Analysis
12
May 2013
Chapter 2 Chimerism Analysis
Chapter 2 Chimerism Analysis
Chapter 2 Chimerism Analysis
Overview
Procedure
Icons and Functions
What to Expect
Save and Export Results
Chimerism Equations
13
May 2013
Chapter 2 Chimerism Analysis
Overview
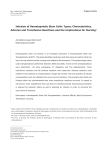
ChimerMarker™, automated chimerism analysis software, integrates speed and accuracy with a biologistfriendly interface. The software can be used to monitor chimerism level in both allogeneic and autologous stem
cells transplant (SCT) or hematopoietic stem cells transplant (HSCT), bone marrow transplant (BMT, post bone
marrow engraftment), cord and peripheral blood stem cells transplant (PBSCT) samples. The program provides
accurate, rapid genotyping and chimerism analysis; automatically identifies donor and recipient peaks in postBMT samples, calculates percent chimerism and quality metrics for single donor or double donor cases, and has
multi-lineage capabilities for chimerism analysis of T-cells, B-cells, and other cell type populations.
ChimerMarker includes functions for comparison of samples at different time points to conduct longitudinal
studies for monitoring each individual and a comprehensive chimerism analysis report. The chimerism analysis
performs repetitive calculations (using published methods). ChimerMarker is compatible with ABI®PRISM,
Beckman-CEQ™, and MegaBACE® genetic analyzers, and custom primers or commercially available human
identification chemistries (including, PowerPlex®16, PowerPlex®18, PowerPlex®21, PowerPlex®ESI).
Chimerism analysis is completely linked to the main analysis screen, removing the error-prone step of data
transfer from genotyping software to chimerism analysis software.
Procedure
Import Data Files
After installing ChimerMarker software you are ready to begin fragment analysis. First, raw data files must be
uploaded to the program. Below is the list of file types supported by ChimerMarker.
ABI - .fsa, .hid
MegaBACE - .rsd
Beckman-Coulter - .esd
Spectrumedix - .smd
Generic - .scf, sg1
Procedure
1.
2.
3.
4.
5.
6.
7.
Launch ChimerMarker
Click Open Data
The Open Data Files box will appear
Click Add button
The Open dialog will appear
Navigate to directory containing raw data files
Select all files by CTRL+A or use CTRL and/or SHIFT
keys to select individual samples
8. Click Open button in the Open dialog
9. The files selected will appear in the Data File List field
10. Click OK button in the Open Data Files box and the
samples will be uploaded to ChimerMarker
Features
There are several features available in the Open Data Files box to make data upload easier.
Add…
Used to locate and select raw data files for upload. Click the arrow button next to the Add button to see the four
most recently accessed directories.
Remove
Used to remove samples from the Data File List. Highlight the sample to remove by single left-clicking it in the
Data File List then click Remove.
Remove All
Removes all sample files from the Data File List field.
Add Folder…
14
May 2013
Chapter 2 Chimerism Analysis
Click Add Folder to upload raw data files from a specific folder in the file directory tree. Click the Default
hyperlink to choose a folder to which ChimerMarker will always open when the Add or Add Folder buttons are
clicked.
Channels
Opens the Set Channels dialog with 4 and 5-color tab options and allows the user to choose from ABI,
MegaBACE, and Beckman-Coulter standard dye color orders. The user can also manually enter dye color and
name. The default channel color setup is ABI. Set the dye color channels before clicking OK in the Open Data
Files dialog box.
Raw Data Analysis
Once the raw data files are uploaded, the Raw Data Main Analysis window appears. Double-click the samples in
the Sample Tree to open the individual Raw Data Traces. The Synthetic Gel Image displays the unprocessed data in
a traditional gel format with larger fragments located on the right. The Electropherograms display fluorescent
signal intensities as a single line trace for each dye color. The signal intensities, recorded in Relative Fluorescent
Units (RFUs), are plotted along a frame scale in the Raw Data Analysis window with fragment mobility from right
to left. The largest size fragments are on the far right of the trace.
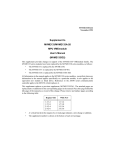
Select Pre-transplant Sample Identifiers
ChimerMarker uses the allele calls of the donor(s) and recipient pre-transplant samples to automatically detect
and label peak origin in all post-transplant samples (donor, recipient or shared). This information can be set
automatically when file naming systems are used (see figure below) or by right mouse click on the sample name
and select set sample type.
15
May 2013
Chapter 2 Chimerism Analysis
Analysis Preferences, Multi-Lineage
Analysis
The program preferences include labeling
peak ratios by height or area; with multilineage capabilities for chimerism analysis
of T-cells, B-cells, and other cell type
populations.
By
doing
multi-lineage
assessment, valuable information about the
current graft status of the host can be seen.
In addition, there are functions for comparison of samples at different time points to conduct longitudinal
studies and produce a comprehensive graph. Case specific panels are automatically constructed, using Donor
and Recipient allele calls.
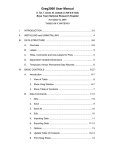
Select Allele and Size Call Parameters
Run Wizard Template Selection:
1.
Select from the pre-loaded run templates for
many
commercially
available
human
identification kits, or select custom parameters
and save the template using the save icon.
•
Panel Select from drop-down menu
•
Size Standard Select from drop-down menu
•
Standard Color Select from drop-down menu
2.
Data Processing:
Select “Auto Create CHM Panel” to have
ChimerMarker automatically creates a
Chimertyping panel and applies it
(recommended). Deselect to manually create
Chimertyping panel (see Alternative
Chimerism Method below)
Default settings for Raw data analysis, Size Call
and Allele Call are recommended for most data
sets.
Select "Customize Marker Parameters" to
specify the marker parameters for the
Chimertyping Panel.
3.
If an allelic ladder sample was run with the samples
amplified with a commercially available kit, select
Auto Select Best Ladder and Auto Panel Adjustment.
If no allelic ladder sample was used, deselect these
options.
NOTE: If data has high noise-to-signal ration please use the
Alternative Method Procedure presented at the end of this
section.
If Pre-transplant CE data files are not available
Import Donor and Recipient Genotypes as a Text
File:
16
May 2013
Chapter 2 Chimerism Analysis
There are two major steps in the procedure to import the pre-transplant genotypes of donor and recipient into ChimerMarker
in order to create a specific genotyping panel for a patient. The format of the tab delimited text file must be followed in
order to properly create the chimertyping panel.
Format Specifications:
1) Marker names are case sensitive
2) Homozygous allele does not need to be duplicated in both cells
3) No space between "Donor" and the number (1 or 2)
4) Must save as a tab delimited text file
1) Creating Excel and Text File:
1.
2.
3.
4.
5.
6.
Identification of Donor1, Donor 2, and Recipient
in first column
Marker names should be in first row. Name is
case sensitive and must match the name on the
genotyping panel exactly.
Specify alleles for each marker as shown. There
should be two cells for each marker
If there are no alleles for a given marker, leave
both cells under the marker blank.
If allele is homozygous, do not populate the size
twice. Only enter the allele once as shown in the
example.
Save as Tab Delimited Text File.
2)
Importing
ChimerMarker:
1.
2.
3.
4.
Text
File
into
Select appropriate genotyping panel
and size standard in the first window
of the run wizard
Select the option to import text file
as shown in the figure
Specify panel name
Click "Next" and OK to run the
analysis
17
May 2013
Chapter 2 Chimerism Analysis
Review Main Analysis Screen Results
The peak origin of each post-transplant sample is displayed in a flag at the top of the peak – D = donor (D1 and
D2 for double donor cases), R = recipient and D1R or D2R for shared peaks. Sample names with a green sheet
have high quality size calls. If the sample has yellow or red sheets by the file name please refer to the Size
Calibration chapter. Allele calls are displayed below each peak. If there are any red OL (off ladder) allele peaks,
please see the Panel Editor chapter for information on panel alignment and calibration.
Review Results
Donor
and
Recipient
indicated in File Name
Tree – based on user
specified names in View –
Preferences – Chimerism
Tab
Post-Transplant Sample: ChimerMarker will differentiate and label peaks for Donor (D), Recipient (R),
or Mixture (Mix) for shared alleles in each locus. Heterozygous Imbalances are also calculated for sister alleles of
the same locus separately for donor and recipient.
If there is excessive heterozygous imbalance in single source sample(s) for a given allele, it is recommended by
several publications on chimerism analysis that these are unsuitable for chimerism calculations and long term
monitoring. The heterozygous imbalance is displayed in the peak flags to assist researchers in rapid evaluation
18
May 2013
Chapter 2 Chimerism Analysis
of peak height balance in heterozygous, single source samples. The heterozygous imbalance in the mixture
sample is the peak ratio of sister peaks.
Any edits must be made in the main analysis window and
saved in the chimerism project (.SGC) file. This maintains
integrity of the analysis going forward into the Chimerism
Application and Calculations.
Automated Chimerism
and Quantification
Detection
Select Applications from the Main Tool Bar. Choose Single
Donor or Double Donor Chimerism Analysis to launch the
linked chimerism application directly from the main
screen. There is no need for copy/paste or data transfer.
The dialog boxes for Single Donor Chimerism Settings and
Double Donor Chimerism Settings provide flexibility of
analysis options. Details of the equations used for all
calculations are provided at the end of this chapter in the
section on Chimerism Equations.
1.
Select %Chimerism Type
a. %CHM Donor or
b. %CHM Recipient
2.
Select Quantification Type
a. Peak Area or
b. Peak Height
3.
Select Analysis Type
a. With Deconvolution or
b. Without Deconvolution
4.
Statistical Parameters provide check box options
to ignore a locus if the heterozygous imbalance is
less than the level entered by the user. Ignore
Shared Allele Imbalance should be checked to
ignore a locus where the peak intensity or area of
any unshared sister allele exceeding the peak
intensity or area of the shared peak containing the
other sister allele.
5.
Set the desired Error Threshold for Locus Error,
Coefficient of Variation and Measurement Error
19
May 2013
Chapter 2 Chimerism Analysis
6.
Specify the percent for Limit of Detection Threshold. Any sensitivity above the threshold % will be
flagged red. Also specify the Threshold type, donor or recipient. It is best to use the same type as the
%CHM Type selected in the Basic Settings.
7.
Apply Stutter Adjustment will subtract marker stutter specific values, specified in the panel, in the
stutter alleles. The stutter % value for each markers can be displayed if "Show Stutter %" is selected
along with "Apply Stutter Adjustment"
8.
Click the save icon (bottom left corner) to save your selections as the default settings.
Select OK to review the results of chimerism calculations.
An example of SAI for locus D2S1338 is
displayed here. Quantification is suspect
when PCR bias results in the smaller
fragment from one individual is more
efficiently amplified than the larger fragment
that is shared between donor and recipient.
REVIEW RESULTS
The automated chimerism calculations are displayed in the center table. To view the results for a given file, click
on the file name in the list at the left. Loci that do not meet the selected chimerism analysis settings are Ignored
and highlighted in yellow in the report table. To manually ignore (disable) a locus, right click on the cell in the
Ignore column and select Ignore. The locus label of any uninformative loci are red in the electropherogram.
20
May 2013
Chapter 2 Chimerism Analysis
NI: Non-Informative-Marker is Non-Informative based on peak pattern and parameters chosen in analysis
settings.
NAN: No Available Number-No results can be calculated for the following peak pattern.
ME: Measurement Error
LE: Locus Error
MOE: Margin of Error
Alternative Method Procedure
The alternative workflow is designed for problematic data – such as for files that have extensive pull up peaks or
shifts in migration from capillary electrophoresis variation over time. Optimally, these issues are resolved by
maintenance to the CE system; however, the alternative workflow in ChimerMarker provides the flexibility to
allow accurate chimerism detection and monitoring in some sub-optimal data sets. Initial analysis starts with
genotyping (determining size and allele calls) of the single source donor and recipient sample for each case.
Please follow the steps in Chapter 3 Genotyping Details. After genotyping the original single source samples the
case specific chimerism panel is constructed as described in Chapter 6, Panel Editor. Return to the main analysis
screen and activate the Run Wizard. Use the chimerism panel for the case under analysis and re-analyze the data
with the new panel. Information about the origin of each fragment (donor, recipient, or shared peak) from the
chimerism panel is displayed as flags on each peak. D indicates a donor peak (D1 or D2 if two donors are
involved, R indicates a recipient peak and D1R indicates the peak is shared (occurs in both the donor and the
recipient).
21
May 2013
Chapter 2 Chimerism Analysis
Select Pre-transplant Sample Identifiers
ChimerMarker uses the allele calls of the donor(s) and recipient pre-transplant samples to automatically detect
and label peak origin in all post-transplant samples (donor, recipient or shared). This information can be set
automatically when file naming systems are used (see figure below) or by right mouse click on the sample name
and select set sample type.
Analysis Preferences, Multi-Lineage Analysis
The program preferences include labeling peak ratios by height or area; with multi-lineage capabilities for
chimerism analysis of T-cells, B-cells, and other cell type populations. By doing multi-lineage assessment,
valuable information about the current graft status of the host can be seen . In addition, there are functions for
comparison of samples at different time points to conduct longitudinal studies and produce a comprehensive
graph. Case specific panels are automatically constructed, using Donor and Recipient allele calls.
Genotype the single source samples
Follow the steps for importing and processing data from Chapter 3 and 4 Genotyping General Procedure and
Genotyping Main Analysis Review. Review the results in the main analysis.
22
May 2013
Chapter 2 Chimerism Analysis
After reviewing the results and making any desired edits (Chapter 4, Genotyping Main Analysis), Use Tools
Panel Editor and construct the Chimertyping panel as described in Chapter 6, Panel Editor.
The identifier may be any combination of letters and
numbers (for example, in place of RECIPIENT labs may
wish to type in the recipient’s ID number or name.
1.
2.
3.
4.
5.
6.
Launch the Run Wizard (Project drop-down or
green arrow icon)
Select the Chimertyping panel from the dropdown
menu
Click Next
Select Only Call Alleles Present in CHM Panel to
filter out extraneous peaks. Adjust other parameters
if needed to proceed with genotyping analysis.
Click Next and OK
Review the results in the electropherograms and
linked report table
23
May 2013
Chapter 2 Chimerism Analysis
Review Results
Donor
and
Recipient
indicated in File Name
Tree – based on user
specified names in View –
Preferences – Chimerism
Tab
Post-Transplant Sample: ChimerMarker will differentiate and label peaks for Donor (D), Recipient (R),
or Mixture (Mix) for shared alleles in each locus. Heterozygous Imbalances are also calculated for sister alleles of
the same locus separately for donor and recipient.
If there is excessive heterozygous imbalance in single source sample(s) for a given allele, it is recommended by
several publications on chimerism analysis that these are unsuitable for chimerism calculations and long term
monitoring. The heterozygous imbalance is displayed in the peak flags to assist researchers in rapid evaluation
of peak height balance in heterozygous, single source samples. The heterozygous imbalance in the mixture
sample is the peak ratio of sister peaks.
Any edits must be made in the main analysis window and saved in the chimerism project (.SGC) file. This
maintains integrity of the analysis going forward into the Chimerism Application and Calculations.
24
May 2013
Chapter 2 Chimerism Analysis
Automated Chimerism Calculations
Select Applications from the Main Tool Bar. Choose Single Donor or Double Donor Chimerism Analysis to
launch the linked chimerism application directly from the main screen. There is no need for copy/paste or data
transfer. The dialog boxes for Single Donor Chimerism Settings and Double Donor Chimerism Settings provides
flexibility for analysis options. Details of the equations used for all calculations are provided at the end of this
chapter in the section on Chimerism Equations.
1.
Select %Chimerism Type
a. %CHM Donor or
b. %CHM Recipient
2.
Select Quantification Type
a. Peak Area or
b. Peak Height
3.
Select Analysis Type
a. With Deconvolution or
b. Without Deconvolution
4.
Statistical Parameters provide check box options to Ignore a
locus if the heterozygous imbalance is less than the level
entered by the user. Ignore Shared Allele Imbalance should be
checked to ignore a locus where the peak intensity or area of
any unshared sister allele exceeding the peak intensity or area
of the shared peak containing the other sister allele.
5.
Set the desired Error Threshold for Locus Error, Coefficient of
Variation and Measurement Error
6.
Specify the percent for Limit of Detection Threshold. Any
sensitivity above the threshold % will be flagged red. Also
specify the Threshold type, donor or recipient. It is best to use
the same type as the %CHM Type selected in the Basic Settings.
7.
Apply Stutter Adjustment will subtract marker stutter specific
values, specified in the panel, in the stutter alleles. The stutter %
value for each markers can be displayed if "Show Stutter %" is
selected along with "Apply Stutter Adjustment"
8.
Click the save icon (bottom left corner) to save your choices as
the default settings.
Select OK to review the results of chimerism calculations.
25
May 2013
Chapter 2 Chimerism Analysis
An example of SAI for locus D2S1338 is displayed here. Quantification is suspect when PCR bias results in the
smaller fragment from one individual is more efficiently amplified than the larger fragment that is shared
between donor and recipient.
REVIEW RESULTS
The automated chimerism calculations are displayed in the center table. To view the results for a given file, click
on the file name in the list at the left.
NI: Non-Informative-Marker is Non-Informative based on peak pattern and parameters chosen in analysis
settings.
NAN: No Available Number-No results can be calculated for the following peak pattern.
ME: Measurement Error
LE: Locus Error
MOE: Margin of Error
26
May 2013
Chapter 2 Chimerism Analysis
Tools and Icons
Analysis Settings – Reopens the Chimerism Settings Dialog Box
Set Multiple Sample View – to view traces of selected files
27
May 2013
Chapter 2 Chimerism Analysis
Profile Comparison View – to view selected traces and level of 2D or 3D offset
Chimerism Analysis Comments – to record any case notes to be saved and printed with the final report (saves
up to 6400 characters).
Save the report table in .xls or .txt file format
Show or Hide – toggle this icon to show or hide the
electropherograms
Analysis Parameter icon to relaunch the Chimerism Analysis
Settings Box
28
May 2013
Chapter 2 Chimerism Analysis
Multiple Sample view – alternative path to display electropherograms of multiple samples
Profile Comparison – alternative path to display profile comparison view
Column Headings – select any or all available column headings for the report table
Printing Options – Preview – to review comprehensive research report or print directly from
Chimerism Analysis screen
Longitudinal Report – Activates the Longitudinal Report Options to monitor Chimerism trend
Help
Icon - quick reference and description to abbreviations and statistical parameters used in
chimerism results window.
Comprehensive Research Report
Single Donor Report (page 1)
29
May 2013
Chapter 2 Chimerism Analysis
Single Donor Report (page 2)
Comprehensive report for each sample at a given time point in the study; includes header, electropherograms (traces) and
report table. The report header uses information from user management and the analysis settings to specify the technician,
project, time, date, and parameters for electronic record keeping. The electropherograms (traces) show each dye-color
separately with labels for D (donor) and R (recipient). Results displayed include quality control metrics: coefficient of
variation, standard deviation, % chimerism, measurement error, and locus error for each marker; and the total average %
Chimerism. Nil represents uninformative loci (all peaks are shared) and are not included in the chimerism calculations or
indicates parameters could not be calculated based on data. ChimerMarker software also contains the functionality to allow
the analyst to manually exclude loci from calculations if needed.
The comprehensive report may be printed directly or saved as a .png or .jpeg image.
30
May 2013
Chapter 2 Chimerism Analysis
Double Donor Report: Report results in 2-page format
A two page report for cases with two different donors provides the header and electropherograms on page 1 and
the header and calculation results on page 2, including the option to report total Average Chimerism or to report
chimerism from donor 1 and donor 2 separately.
Page 1: Electropherograms
31
May 2013
Chapter 2 Chimerism Analysis
Page 2: Results Table
Print Individual Markers
Individual markers for each samples can be printed along with the corresponding Donor and Recipient markers.
From the Chimerism Analysis Results page, select Individual Marker Print from the print drop down arrow.
Specify the Print settings and click "Preview" to see the report.
32
May 2013
Chapter 2 Chimerism Analysis
Each informative markers will be grouped with the appropriate marker from Donor and Recipient sample for
comparison. Both Marker result and average result for the samples are displayed on the right hand side. The
header is the same in all print preview modes.
33
May 2013
Chapter 2 Chimerism Analysis
Longitudinal Report for Engraftment Monitoring / Detection of
Malignant Relapse
Short Tandem Repeat (STRs) provide a highly sensitive measure of chimerism in post-BMT
monitoring which is essential for long term tracking of engraftment and early detection of malignant
cell replapse. Each patient project is easily appended (see Tools – Add Samples to Project) with
sequential samples from a monitoring study. The longitudinal graphs are easily appended with
results from sequential samples. The report header provides verification of the user and the analysis
parameters.
Procedure
1.
2.
3.
4.
5.
6.
Open a saved project or start a new project following the Chimerism Analysis procedures in Chapter 2.
Select Project – Add Samples to saved project to add serial sample(s) if appropriate
Select Applications -- Select Single Donor or Double Donor Chimerism Analysis
Review Chimerism Results
Select the Longitudinal Report Icon
Use the Add Samples Icon to begin longitudinal study or to add serial samples to an existing
engraftment monitoring
Icons and Functions
Print Report: Print the longitudinal report as zoomed view or global view
Save Report: Save report as a PNG image
Display Settings: Change the display settings on the Longitudinal Report, including how dates,
statistics, and chart layers.
Add Samples: Bring up a dialog box with all samples currently in the project. Add samples by
checking the specific sample and specifying a date.
Remove Samples: Bring up a dialog box with all samples that are in current graph. Remove samples
by selecting desired samples.
Add Patient Information: Add patient name, sex, age, and date of transplantation.
Chimerism Display: Switch display of double donor chimerism from individual donors, total donor,
or display all.
Graph Display: Switch from bar graph to line graph and vice versa.
"Show 3D": Will display the graph in a 3-D format
"Show Sample List": Display a table that contained all samples and stats of current samples in graph.
34
May 2013
Chapter 2 Chimerism Analysis
Display Settings:
Label Settings: Select the statistics that will be displayed
on top of the bar or line graph for each sample.
Date Format Setting: Select the date display that will be
shown on the X-axis of the graph.
Chart Setting: Specify number of layers to display
statistics label.
Save Picture Setting: Specify if patient information and
sample list should be saved with image.
Add Samples:
Sample Name: Select sample to add by checking the box
next to each sample name.
Date: Specify dates for each sample.
Remove Samples:
Sample Name: Select sample to remove by checking the
box next to each sample name.
35
May 2013
Chapter 2 Chimerism Analysis
Patient Information:
Note: the following entries are included in print report
headers.
Case Number: If applicable, input the case number for
this sample or project.
Patient Name: Specify Patient Name/ID. This will
appear as header on graph.
Gender Specify patient sex.
Age: Specify patient age.
Date of Birth: Specify the pateint’s date of birth, or
check No Date if no date is available.
Date of Transplantation: Specify date of transplantation
by using the drop down menu, or check Use Current
Date or No Date.
Transplantation
Type:
Specify
the
transplantation to be displayed on report.
type
of
Donor Information: Use this section to briefly describe
your donors, (e.g. donor sex, relation to patient, and so
on).
Comments: Add comments to the project if needed. Any
comments added will be printed with the report.
Print Settings for Double Donor:
CHM Type: Select type of donor chimerism to display.
Print Settings: Select print settings for the graph.
NOTE: "Keep Show Setting," if selected will print the
report as zoomed in the graphical view.
Chart Type: Select the type of chart to print.
"Preview" will show a print preview of the settings selected.
36
May 2013
Chapter 2 Chimerism Analysis
What to Expect
The Longitudinal Report contains a header with
User Identification from User Management (see
Chapter 9 – User Management) and Analysis
Parameters, Chimerism Trend (donor or recipient)
with the %chimerism on the Y axis and the sample
date on the X-axis. This graph is saved with the
project and is easily appended with subsequent
serial samples, printed from the print preview, or
saved as a .png, .jpeg or .bmp image.
Single donor Example with quality control metrics in the bar graph and sample date displayed as the
month/day/year.
This Double donor monitoring report displays the trend of engraftment with an increase in overall chimerism
and Donor 1 stability and a decrease in Donor 2 chimerism percentage. In this example the analyst entered Tx to
indicate sample at transplant and then the weeks post-transplant for the sequential samples.
37
May 2013
Chapter 2 Chimerism Analysis
Chimerism Calculations
Metrics for variation in amplification --- measure of variation from sources other than chimeras (LCN,
amplification variation --- PCR conditions, PCR bias, random events, CE conditions…)
Example of variation PCR bias: Alleles in loci that have a smaller size range are able to be amplified more than
alleles in loci of larger size range in the same amount of time. One of the causes of
heterozygous imbalance is PCR bias – the amplification of the smaller fragment more times
than the larger one. In the example above there is almost no amplification difference
between the two closely spaced alleles at D21S11 for both Donor and Recipient genotypes.
In contrast, the alleles at Penta E for both of these individuals have a larger molecular
weight difference, resulting in the smaller of the two fragments being amplified more than
the larger fragment. This is a source of variation (heterozygous imbalance) due to PCR
process. In this example, both D21S11 and Penta_E are acceptable candidate loci to track
chimerism because there are no shared alleles between the donor and the recipient. D21S11
is preferable over Penta_E because there is less imbalance at D21S11(97 – 99% in D21S11
compared to 76 – 86% in Penta_E) in the original individual samples, less random variation.
Equations:
Quality Metrics: These equations pertain to the quality control metric calculations in the
Chimerism Analysis. These metrics include measurement error, locus error, and coefficient
of variation. All calculations are multiplied by 100 to convert results to percentage.
38
May 2013
Chapter 2 Chimerism Analysis
Measurement Error (ME): Estimate ratio of Allele 1 in donor and recipient to Allele 2 of
donor and recipient at a locus. At optimal efficiency, the measurement should be 1,
indicating that there is no imbalance between either allele. If ME is high, the DNA
measurement between the sister alleles of donor and recipient is large. (Similar to
heterozygous imbalance but take into account the entire locus)
ME=[(A-B)/(C)]*100
A= R1+ D1 (allele 1 of recipient + allele 1 of donor)
B=R2 + D2 (allele 2 of recipient + allele 2 of donor)
C= larger of A or B
Locus Error (LE): Estimate relative deviation of a locus %CHM from the Average %CHM.
LE=[(Average %CHM - Locus %CHM)/ Average %CHM]* 100
Locus %CHM= the chimerism level calculated for that individual locus using the
alleles only from
that
locus.
High LE=high variation of locus from the rest of the sample.
Low LE= low variation of locus from the rest of the sample.
Coefficient of Variance (CV): Ratio of the standard deviation to the average percent
chimerism of the sample. It gives a measure of variation within the sample relative to the
sample's average.
CV= [Standard deviation (σ)/ Average %CHM (μ)]* 100
If the CV is small, all data points in the sample varies by only a small fraction.
If CV is large, indicate that the data varies greatly or there is an outlier in the sample.
Margin of Error (MOE): Calculated by obtaining value in T-table according to degree of
freedom and confidence interval multiply by the Standard Error of the Mean.
MOE= SE* T-score
Standard Error of the Mean (SE)= St. Dev/ Square root of (N), where N= number of
informative markers.
Large MOE indicates sampling variability in the data and results are more open to
interpretation. Small MOE indicates less sampling variability in the data and results may be
less open to interpretation.
Limit of Detection:
Homozygous: [(T)/Total DNA in Marker]* 100
Heterozygous:[ (T*2)/ Total DNA in Marker]*100
**T= Threshold set in panel under Minimum Heterozygote Intensity.Stutter Adjustment:
X= Stutter % specified in panel
A=Stutter contribution
39
May 2013
Chapter 2 Chimerism Analysis
Y= DNA of minor allele not affected by stutter
Equation:
Major allele x (X)= A (Stutter contribution RFU)
Minor allele - A= Y (DNA not affected by stutter)
**(Y) is used for Chimerism calculations in equation below:
Decision Pathway for Single Donor Chimerism Calculations
Shared case: With deconvolution
Non-shared <> all && Non-shared <> None
GenoType
R&D+D;
Peaks = 2
1.1
R&D+R;
Peaks = 2
1.2
N
N
R&D >= D
Y
R=R&D-D;
Total D=2*D;
CHM% = Total D/total;
R% = R/total;
R&D+D+R;
Peaks = 3
1.3
R&D >= R
R&D < D
&&
R&D < R
R&D > D
&&
R&D > R
R&D > D
&&
R&D <= R
R&D <= D
&&
R&D > R
R1=R&D-D;
IMB R=R/R1;
R1=(R&D)-D;
Total R=R1+R;
Total D=D*2;
CHM%=total D/
total;
R% = total R/ total;
D1a1=(R&D)-R;
Total D= D1a1+D;
Total R= R*2;
CHM%=total D/
total;
R%=total R/total;
Label with SAI;
Ingore the marker
depending on the
selction
Label with SAI;
Ingore the marker
depending on the
selction
Y
D=R&D-R;
R=2*R;
CHM% = D/total;
R% = R/total;
Ignore the Marker
and labeled with
“SAI” in the result
table
D1a2=R&D-R;
IMB D=D1a2/D;
Y
Imbalance R <
Imbalance D
D1a2=R&D-R;
Total D= D1a2+D;
Total R= R*2;
CHM% = total D/
total;
R% = total R/total
40
May 2013
N
R1=(R&D)-D;
Total R=R1+R;
Total D=D*2;
CHM%=total D/
total;
R% = total R/total;
Chapter 2 Chimerism Analysis
Shared case: Without deconvolution
Non-shared <> all && Non-shared <> None
GenoType
R&D+D;
Peaks = 2
2.1
R&D+R;
Peaks = 2
2.2
N
N
R&D >= D
Y
R&D+D+R;
Peaks = 3
2.3
R&D >= R
R&D < D
&&
R&D < R
R&D > D
&&
R&D > R
R&D > D
&&
R&D <= R
R&D <= D
&&
R&D > R
% CHM= [D/
(R+D)]* 100
% R= [R/(R+D)]*
100
% CHM= [D/
(R+D)]* 100
% R= [R/(R+D)]*
100
Label with SAI;
Ingore the marker
depending on the
selction
Label with SAI;
Ingore the marker
depending on the
selction
Y
nil
% CHM= [D/
(R+D)]* 100
% R= [R/(R+D)]*
100
nil
Ignore the Marker
and labeled with
“SAI” in the result
table
Non-shared case: With/without deconvolution
Non-shared
allele
1D+1R
Shared = 0
3.1
1D+2R
Shared = 0
3.2
2D+1R
Shared = 0
3.3
2D+2R
Shared = 0
3.4
Chm D% = D/total;
R% = R/total;
Chm D% = D/total;
R% = (R1+R2)/
total;
Chm D% =
(D1+D2)/total;
R% = R/total;
Chm D% =
(D1+D2)/total;
R% = (R1+R2)/
total;
41
May 2013
Chapter 2 Chimerism Analysis
Decision Pathway for Double Donor Chimerism Calculations
1R + 1D1 + 1D2
Genotype
1R+1D1+1D2
Shared=0
1.1
1R+1D1&D2
Shared=1
1.2
Other cases
Total D%=
(D1+D2)/total;
D1%=D1/total;
D2%=D2/total;
R%=R/total
Total D%
=D1&D2/total;
R%=R/total;
Can’t be
calculated
Case 1.0
1R+1D1+2D2
The same case as
(1R+2D1+1D2), with D1, D2
exchanged.
Genotype
1R+1D1&D2
+1D2a1
Shared=1
2.2
1R&D2+1D1
+1D2a1
Shared=1
2.3
Other cases
Do SAI function
(D1&D2)
Do SAI function
Can’t be
calculated
1R+1D1+2D2
Shared=0
2.1
Total D%
=(D1+D2a1
+D2a2)/total;
D1%=D1/total;
D2%=(D2a1+D2a2)
/total;
R%=R/total
D1&D2 >= D2a1
D1&D2 < D2a1
Total D%=(D1&D2
+D2a1)/total;
D1a1=D1&D2D2a1;
D1%=D1a1/total;
D2%=2*D2a1/total;
R%=R/total;
Y
Y
Y
D2&R >= D2a1
Options in the
dialog
N
%Total D%=
(1D1&D2+D2a1)/
Total
%R= R/Total
%D1=NIL
%D2=NIL
Label with “SAI”
Y
Label with SAI
And ignored the
marker directly
Case 2.0
42
May 2013
R=R&D2-D2a1;
Total D%=
(2*D2a1+D1)/total;
D1%=D1/total;
D2%=2*D2a1/total;
R%=R/total
D2&R < D2a1
Y
Label with SAI
And ignored the
marker directly
Chapter 2 Chimerism Analysis
1R+2D1+2D2
Genotype
1R+1D1a1+1D2a2+
1D2a1+1D2a2
No shared
3.1
Total
D%=(D1a1+D1a2+
D2a1+D2a2)/total
D1%=(D1a1+D1a2)
/total
D2%=(D2a1+D2a2)
/total;
R%=R/total
1R&D1+1D1a1
+1D2a1+1D2a2
Shared=1
3.2
1R+1D1a1+1D2a1
+1D1&D2
Shared=1
3.3
1R+1D1&D2'
+1D1&D2
Shared=2
3.4
See page 3.3
Total
D%=(D1&D2'+
D1&D2)/total;
R%=R/total;
Do SAI function
(R&D1)
1R&D1&D2
+1D1a1+1D2a1
Shared=1
3.5
1R&D1&D2
+1D1&D2
Shared=2
3.6
See page 3.5
Do SAI function
(R&D1&D2)
R&D1&D2
< D1&D2
R&D1 >= D1a1
R&D1 < D1a1
Y
1R&D2+1D1a1+
1D1a2+1D2a1
Shared=1
3.7
R=R&D1-D1a1;
D1=2*D1a1;
Total D%=(2*D1a1
+D2a1+D2a2)/total;
D1%=(2*D1a1)
/total;
D2%=(D2a1+D2a2)
/total;
R%=R/total
Y
Y
1R&D1+1D1&D2
+1D2a1
Shared = 2
3.8
Label with SAI
And ignored the
marker directly
Label with SAI
And ignored the
marker directly
Do SAI function
(D1&D2)
Do SAI function
(R&D2)
D1&D2 < D2a1
Y
D2&R >= D2a1
Y
R=R&D2-D2a1;
D2=2*D2a1;
Total D%=(2*D2a1
+D1a1+D1a2)/total;
D2%=(2*D2a1)
/total;
D1%=(D1a1+D1a2)
/total;
R%=R/total
D1&D2 >= D2a1
Y
D2=2*D2a1;
D2%=D2/total;
D1a2=D1&D2D2a1;
D2&R < D2a1
Y
Label with SAI
And ignored the
marker directly
Do SAI function
(R&D1)
Label with SAI
And ignored the
marker directly
R&D1>=D1a2
Y
D1=2*D1a2;
R=R&D1-D1a2;
D%=(D1+D2)/total;
R%=R/total;
D1%=D1/total;
Case 3.0
43
May 2013
R&D1<D1a2
Y
Label with SAI
And ignored the
marker directly
Other
cases
Can’t be
calculated
R&D1&D2
>= D1&D2
Y
Total D=2*D1&D2;
Total R=R&D1&D2
-D1&D2;
D%=Total D/total;
R%=Total R/total
Chapter 2 Chimerism Analysis
1R+1D1a1+1D2a1
+1D1&D2
Shared=1
3.3
Do SAI function
D1&D2 >= D1a1
&&
D1&D2 >= D2a1
D1&D2 < D1a1
&&
D1&D2 < D2a1
Y
Y
Y
D1a2=D1&D2D2a1;
Label with SAI
And ignored the
marker directly
D1a1=0 ||
D1a2=0;
Y
N
IMB D1=D1a1/
D1a2;
IMB D1=0;
D2a2=D1&D2D1a1;
D2a1=0 ||
D2a2=0;
Y
N
IMB D2=D2a1/
D2a2;
IMB D2=0;
Imb D1 = 0,
IMB D2 =0
N
Y
IMB D1<= D2
N
Y
D1&D2 > D1a1
&&
D1&D2 < D2a1
D2a2=D1&D2D1a1;
D1=2*D1a1;
D1a2=D1&D2D2a1;
D2=2*D2a1;
D1%=D1/total;
D2%=(D2a1+D2a2)
/total;
D2%=D2/total;
D1%=(D1a1+D1a2)
/total;
Total D% = 0;
D1%=0;
D2%=0;
R%=0;
Total
D%=(D1&D2+
D1a1+D2a1)/total;
R%=R/total
Case 3.3
44
May 2013
D1&D2 < D1a1
&&
D1&D2 > D2a1
Y
D2a2=D1&D2D1a1;
D1=2*D1a1;
D1a2=D1&D2D2a1;
D2=2*D2a1;
D1%=D1/total;
D2%=(D2a1+D2a2)
/total;
D2%=D2/total;
D1%=(D1a1+D1a2)
/total;
Label with SAI;
Label with SAI,
whether ignored the
marker depending
on the selection in
the setting box.
whether ignored the
marker depending
on the selection in
the setting box.
Chapter 2 Chimerism Analysis
1R&D1&D2
+1D1a1+1D2a1
Shared=1
3.5
Do SAI function
R&D1&D2 >=
(D1a1+D2a1)
R&D1&D2 <
(D1a1+D2a1)
Y
Y
D1=D1a1*2;
D2=D2a1*2;
R=R&D1&D2D1a1-D2a1;
Total
D%=(D1+D2)/total;
D1%=D1/total;
D2%=D2/total;
R%=R/total;
Label with SAI
And ignored the
marker directly
Case 3.5
45
May 2013
Chapter 2 Chimerism Analysis
2R+1D1+2D2
The same case as
(2R+2D1+1D2)
Genotype
1R1+1R2+1D1
+1D2a1+1D2a2
Shared=0
4.1
1R1+1R2+1D2a1
+1D1&D2
Shared=1
4.2
Total
D%=(D1+D2a1
+D2a2)/total
D1%=(D1)/total
D2%=(D2a1+D2a2)
/total;
R%=(R1+R2)/total
R1+D1&D2&R
+D2a1
Shared =1
4.3
R1+R&D2+D1
+D2a1
Shared =1
4.4
R1+D2&R+D1&D2
Shared =2
4.5
R&D1+R&D2
+D2a1
Shared =2
4.6
Other cases
Do SAI function
(D1&D2&R)
See page 4.4
See page 4.5
See page 4.6
Can’t be
calculated
D1&D2&R >= R1
D2a1+D1&R+R
+D2a2
Shared =1
4.7
D1&D2&R < R1
Y
Y
R=2*R1;
D1&D2=
D1&D2&R-R1;
Total
D%=(D1&D2+
D2a1)/total;
R%=R/total;
Label with SAI
And ignored the
marker directly
Do SAI
D1=D1&D2-D2a1;
Do SAI function
(D1&D2)
D1&R>=R
D1&R<R
D1>0
D1&D2 >= D2a1
Y
D2a2=D2a1;
D2=2*D2a1;
D1=D2&D1-D2a1;
Total D%=
(D2a1+D1&D2)/
total;
D1%=(D1)/total;
D2%=(D2)/total;
R%=(R1+R2)/total
D1%=D1/total;
D2%=2*D2a1/total;
Y
Select the option
in the dialog
N
Y
D1&D2 < D2a1
D1% = Nil;
D2% =Nil;
N
Y
Label with SAI
And ignored the
marker directly
Total D%=
(D1&D2)+D2a1)/Total;
%R= (R1+R2)/Total;
%D1=NIL;
%D2=NIL;
Label with SAI
Case 4.0
46
May 2013
D1=D1&R-R;
R%=2*R/total;
Total D =
(D2a1+D2a2+D1)/
total;
D2% =
(D2a1+D2a2)/total;
D1%=(D1)/total;
Label with SAI
And ignored the
marker directly
Chapter 2 Chimerism Analysis
R1+R&D2+D1
+D2a1
Shared =1
4.4
Do SAI function
(R&D2)
R&D2 >= D2a1
&&
R&D2 >= R1
R&D2 < D2a1
&&
R&D2 < R1
Y
Y
Y
R2=R&D2-D2a1;
Label with SAI
And ignored the
marker directly
R1=0 || R2=0;
Y
R2=R&D2-D2a1;
D2a2=R&D2-R2;
D2=2*D2a1;
Total
D%=(D1+D2)/total;
D1%=D1/total;
D2%=D2/total;
IMB R=R1/R2;
Label with SAI;
whether ignored the
marker depending
on the selection in
the setting box.
D2a2=R&D2-R1;
D2a1=0 ||
D2a2=0;
N
Y
IMB D2=D2a1/
D2a2;
IMB D2=0;
Imb R = 0, IMB
D2 =0
Y
N
Total D% = 0;
D1%=0;
D2%=0;
R%=0;
Imbalance R <=
Imbalance D2
Y
D2a2=R&D2-R1;
D2=D2a1+D2a2;
Total
D%=(D1+D2)/total;
D1%=D1/total;
D2%=D2/total;
N
R2=R&D2-D2a1;
D2a2=R&D2-R2;
D2=2*D2a1;
Total
D%=(D1+D2)/total;
D1%=D1/total;
D2%=D2/total;
R%=2*R1/total;
R%=(R1+R2)/total;
Case 4.4
47
May 2013
R&D2 < D2a1
&&
R&D2 > R1
Y
R%=(R1+R2)/total;
N
IMB R=0;
R&D2 > D2a1
&&
R&D2 < R1
D2a2=R&D2-R1;
D2=D2a1+D2a2;
Total
D%=(D1+D2)/total;
D1%=D1/total;
D2%=D2/total;
R%=2*R1/total;
Label with SAI;
whether ignored the
marker depending
on the selection in
the setting box.
Chapter 2 Chimerism Analysis
R1+D2&R+D1&D2
Shared =2
4.5
R&D1+R&D2
+D2a1
Shared =2
4.6
Do SAI function
(D2&R)
Do SAI function
(D2&R)
D2&R >= R1
Y
D2&R < R1
D2&R >= D2a1
Y
R=2*R1;
D2a1=D2&R-R1;
Y
D%=(D1+D2)/total;
D1%=D1/total;
D2%=D2/total;
R%=R/total
D1&R >= R1
D1&R < R1
D1=R&D1-R1;
D%=(D1+D2)/total;
D1%=D1/total;
D2%=D2/total;
R%=2*R1/total;
Label with SAI
And ignored the
marker directly
D1&R < D2a1
D1=D1&D2-D2a1;
D2=2*D2a1;
Label with SAI
And ignored the
marker directly
Do SAI function
(D1&R)
Do SAI function
(D1&D2)
D1&D2 >= D2a1
Y
D2=2*D2a1;
R1=R&D2-D2a1;
Label with SAI
And ignored the
marker directly
D2&R < D2a1
%Donor=(D2a1+
D1&D2)/ total
%D1=NIL
%D2=NIL
%R= (total R)/total
Label with SAI
whether ignored the
marker depending
on the selection in
the setting box.
Case 4.5 and Case 4.6
48
May 2013
Chapter 2 Chimerism Analysis
2D1+2D2+2R
5.2 5.5 5.7 exchange needed
Genotype
R1+R2
+D1a1+D1a2
+D2a1+D2a2
Shared =0
5.1
Total
D%=(D1a1+D1a2+
D2a1+D2a2)/total;
D1=(D1a1+D1a2)
/total;
D2=(D2a1+D2a2)
/total;
R%=(R1+R2)/total
R1+R&D2
+D1a1+D1a2
+1D2a1
Shared =1
5.2
D1&D2+D2&R
+D1&R
Shared=3
5.3
D1&D2&R
+D1&D2+R1
Shared=2
5.4
R1+R&D1
+D1&D2+D2a1
Shared =2
5.5
R1+R&D1&D2+D2
a1+D1a1
Shared =1
5.6
Other cases
See page 5.2
Total
D%=2*(D1&D2)
/total;
See page 5.4
See page 5.5
See Page 5.6
Can’t be
calculated
R1+R&D1
+D2a1+D2a2
+1D1a1
Shared =1
5.7
R=(D2&R+D1&R)D1&D2;
R%=R/total
D1&D2
+D1a1+D2a1
+R1+R2
Shared =1
5.8
See page 5.7
See page 5.8
Case 5.0
49
May 2013
D1&R+D2&R+
D1a1+D2a1
Shared =2
5.9
See page 5.9
Chapter 2 Chimerism Analysis
R1+R&D2
+D1a1+D1a2
+1D2a1
Shared =1
5.2
Do SAI function
(R&D2)
R&D2 > D2a1
&&
R&D2 > R1
R&D2 < D2a1
&&
R&D2 < R1
Y
Y
Y
Label with SAI
And ignored the
marker directly
R1=0 || R2=0;
N
IMB R=0;
IMB R=R1/R2;
D2a2=D2a1;
Total
D%=(D1a1+D1a2
+D2a1+D2a2)/total;
D1%=(D1a1+D1a2)
/total;
D2%=(D2a1+D2a2)
/total;
Label with SAI;
D2a2=R&D2-R1;
whether ignored the
marker depending
on the selection in
the setting box.
D2a1=0 ||
D2a2=0;
Y
N
IMB D2=D2a1/
D2a2;
IMB D2=0;
Imb R = 0 &&
IMB D2 =0
N
Y
Imb R <= Imb D2
Y
R2=R1;
D2a2=R&D2-R1;
Total
D%=(D1a1+D1a2+
D2a1+D2a2)/total;
D1=(D1a1+D1a2)
/total;
D2=(D2a1+D2a2)
/total;
R%=2*R1/total
N
Total D% = 0;
D1%=0;
D2%=0;
R%=0;
R2= R&D2-D2a1;
R%=(R1+R2)/total;
D2a2=D2a1;
Total
D%=(D1a1+D1a2
+D2a1+D2a2)/total;
D1%=(D1a1+D1a2)
/total;
D2%=(D2a1+D2a2)
/total;
Case 5.2
50
May 2013
R&D2 <= D2a1
&&
R&D2 > R1
Y
R2= R&D2-D2a1;
R%=(R1+R2)/total;
R2= R&D2-D2a1;
Y
R&D2 > D2a1
&&
R&D2 <= R1
R2=R1;
D2a2=R&D2-R1;
Total
D%=(D1a1+D1a2+
D2a1+D2a2)/total;
D1=(D1a1+D1a2)
/total;
D2=(D2a1+D2a2)
/total;
R%=2*R1/total
Label with SAI;
whether ignored the
marker depending
on the selection in
the setting box.
Chapter 2 Chimerism Analysis
D1&D2&R
+D1&D2+R1
Shared=2
5.4
Do SAI function
D1&D2&R>=D1&D2
&&
D1&D2&R>=R1
D1&D2&R<D1&D2
&&
D1&D2&R<R1
Y
Y
Y
D1&D2&R>D1&D2
&&
D1&D2&R<R1
D1&D2&R<D1&D2
&&
D1&D2&R>R1
Y
D1&D2'=
D1&D2&R-R;
Label with SAI
And ignored the
marker directly
D1&D2=0 ||
D1&D2' = 0;
Y
N
IMB D1&D2=0;
IMB D1&D2
=(D1&D2')/
(D1&D2);
R2=D1&D2&RD1&D2;
R1=0 && R2=0;
Y
N
IMB R=0;
IMB R=R1/R2;
Imb R = 0 &&
IMB D1&D2 =0
N
Y
Total D% = 0;
D1%=0;
D2%=0;
R%=0;
Imb D1&D2 <=
Imb R
Y
R2=D1&D2&RD1&D2;
Total D%
=2*D1&D2/total;
R%=(R1+R2)/total
N
D1&D2'=
D1&D2&R-R;
Total D%=
(D1&D2'+D1&D2)/
total;
R%=(2*R1)/total
Case 5.4
51
May 2013
R2=D1&D2&RD1&D2;
D1&D2'=
D1&D2&R-R1;
Total D%
=2*D1&D2/total;
Total D%
=(D1&D2'+D1&D2
)/total;
R%=(R1+R2)/total
R%=(2*R1)/total
Label with SAI;
Label with SAI;
whether ignored the
marker depending
on the selection in
the setting box.
whether ignored the
marker depending
on the selection in
the setting box.
Chapter 2 Chimerism Analysis
R1+R&D1
+D1&D2+D2a1
Shared =2
5.5
Do SAI function
(R&D1)
N
R&D1 >= R1
Y
R=2*R1;
D1a1=R&D1-R1;
Label with SAI
And ignored the
marker directly
Do SAI function
(D1&D2)
D1&D2 >= D1a1
&&
D1&D2 >= D2a1
Y
Check step
(D1, D2)
D1&D2 < D1a1
&&
D1&D2 < D2a1
Y
Y
Label with SAI
ignored the marker
directly
IMB D1 <= IMB D2
Y
D1&D2 > D1a1
&&
D1&D2 < D2a1
N
D2a2=D1&D2D1a1;
D1=2*D1a1;
D2=D2a1+D2a2;
D1a2=D1&D2D2a1;
D1=D1a1+D1a2;
D2=2*D2a1;
D%=(D1&D2+
D2a1+D1a1)/total;
D%=(D1&D2+
D2a1+D1a1)/total;
D1%=D1/total;
D2%=D2/total;
R%=R/total;
D1%=D1/total;
D2%=D2/total;
R%=R/total;
In: Check step
(D1, D2)
D1&D2 < D1a1
&&
D1&D2 > D2a1
D1a2=D1&D2D2a1;
Y
D2a2=D1&D2D1a1;
D1=2*D1a1;
D2=D2a1+D2a2;
D1a2=D1&D2D2a1;
D1=D1a1+D1a2;
D2=2*D2a1;
D%=(D1&D2+
D2a1+D1a1)/total;
D%=(D1&D2+
D2a1+D1a1)/total;
D1a1=0 ||
D1a2=0
Y
N
Imb D1=D1a1/
D1a2;
IMB D1=0;
D1%=D1/total;
D2%=D2/total;
R%=R/total;
D1%=D1/total;
D2%=D2/total;
R%=R/total;
Label with SAI
Label with SAI
D2a2=D1&D2D1a1
whether ignored the
marker depending
on the selection in
the setting box.
whether ignored the
marker depending
on the selection in
the setting box.
D2a1=0 ||
D2a2=0;
Y
N
IMB D2=0;
Imb D2=D2a1/
D2a2;
Imb D1 = 0 &&
IMB D2 =0
N
Out: Check step
(D1, D2)
Case 5.5
52
May 2013
Y
Total D% = 0;
D1%=0;
D2%=0;
R%=0;
Chapter 2 Chimerism Analysis
In: Check step
(D1&D2, R2)
2D1+2D2+2R
Case 5.6
D1&D2=R&D1&D
2-R1;
R1+R&D1&D2
+D2a1+D1a1
Shared =1
D1&D2=0 &&
(D1a1+D2a1)=0
Y
N
IMB D1&D2=0;
Imb D1&D2
=D1&D2/
(D1a1+D2a1);
Do SAI function
R2=R&D1&D2D1a1-D2a2;
R&D1&D2>=R1
&&
R&D1&D2>=(D1a1
+D2a1)
Y
R&D1&D2<R1 &&
R&D1&D2<(D1a1+
D2a1)
R&D1&D2>R1 &&
R&D1&D2<(D1a1+
D2a1)
Y
Y
R&D1&D2<R1 &&
R&D1&D2>(D1a1+D2
a1)
Y
Check step
(D1&D2, R2)
R2=R1;
R%=(R1+R2)/total;
IMB R=R1/R2;
R2=R&D1&D2D1a1-D2a2;
R%=(R1+R2)/total;
R%=(R1+R2)/total;
Imb D1&D2
<= Imb R
R2=R&D1&D2D1a1-D2a2;
N
IMB R=0;
Label with SAI
And ignored the
marker directly
Y
R1=0 && R2=0;
Y
Imb R = 0 &&
IMB D1&D2 =0
N
R2=R1;
Label with SAI;
Label with SAI;
whether ignored the
marker depending
on the selection in
the setting box.
whether ignored the
marker depending
on the selection in
the setting box.
Y
N
Out: Check step
(D1&D2, R2)
Total D% = 0;
D1%=0;
D2%=0;
R%=0;
R%=(R1+R2)/total;
In: Check step
(D1, D2)
D1&D2=R&D1&D
2-R1;
D2a2=D1&D2D1a1;
Check step
(D1, D2)
D2a1=0 &&
D2a2=0
Y
Imb D1<=Imb
D2
Y
N
Imb D2=D2a1/
D2a2;
IMB D2=0;
N
D2a2=D1&D2D1a1;
D1a2=D1&D2D2a1;
D1%=2*D1a1/total;
D2%=(D2a1+D2a2)
/total;
D1%=(D1a1+D1a2)
/total;
D2%=2*D2a1/total;
Total
D%=(2*D1a1+
D2a1+D2a2)/total
Total
D%=(D1a1+D1a2+
2*D2a1)/total
D1a2=D1&D2D2a1
D1a1=0 &&
D1a2=0;
Y
N
IMB D1=0;
Imb D1=D1a1/
D1a2;
Imb D1 = 0 &&
IMB D2 =0
N
Out: Check step
(D1, D2)
Case 5.6
53
May 2013
Y
Total D% = 0;
D1%=0;
D2%=0;
R%=0;
Chapter 2 Chimerism Analysis
R1+R&D1
+D2a1+D2a2
+1D1a1
Shared =1
5.7
Do SAI function
R&D1 >= D1a1
&&
R&D1 >= R1
R&D1 < D1a1
&&
R&D1 < R1
Y
Y
Y
Label with SAI
And ignored the
marker directly
R1=0 || R2 = 0;
N
IMB R=0;
IMB R= R1/R2;
D1a2=D1a1;
Total
D%=(D1a1+D1a2
+D2a1+D2a2)/total;
D1%=(D1a1+D1a2)
/total;
D2%=(D2a1+D2a2)
/total;
Label with SAI;
whether ignored the
marker depending
on the selection in
the setting box.
D1a2=R&D1-R1;
D1a1=0 ||
D1a2=0;
Y
N
IMB D1
=D1a1/D1a2
IMB D1=0;
Imb R = 0 &&
IMB D1 =0
N
Y
Imb R <= Imb D1
Y
R2=R1;
D1a2=R&D1-R1;
Total
D%=(D1a1+D1a2+
D2a1+D2a2)/total;
D1=(D1a1+D1a2)
/total;
D2=(D2a1+D2a2)
/total;
R%=2*R1/total
N
R2= R&D1-D1a1;
R%=(R1+R2)/total;
Total D% = 0;
D1%=0;
D2%=0;
R%=0;
D1a2=D1a1;
Total
D%=(D1a1+D1a2
+D2a1+D2a2)/total;
D1%=(D1a1+D1a2)
/total;
D2%=(D2a1+D2a2)
/total;
Case 5.7
54
May 2013
R&D1 < D1a1
&&
R&D1 > R1
Y
R2= R&D1-D1a1;
R%=(R1+R2)/total;
R2= R&D1-D1a1;
Y
R&D1 > D1a1
&&
R&D1 < R1
R2=R1;
D1a2=R&D1-R1;
Total
D%=(D1a1+D1a2+
D2a1+D2a2)/total;
D1=(D1a1+D1a2)
/total;
D2=(D2a1+D2a2)
/total;
R%=2*R1/total
Label with SAI;
whether ignored the
marker depending
on the selection in
the setting box.
Chapter 2 Chimerism Analysis
D1&D2
+D1a1+D2a1
+R1+R2
Shared =1
5.8
Do SAI function
D1&D2 >D1a1
&&
D1&D2 >D2a1
D1&D2 <D1a1
&&
D1&D2 <D2a1
Y
Y
Y
D1&D2 >D1a1
&&
D1&D2 <=D2a1
D1&D2 <=D1a1
&&
D1&D2 >D2a1
Y
D1a2=D1&D2D2a1;
Label with SAI
And ignored the
marker directly
D1a1=0 || D1a2
= 0;
Y
D2a2=D1&D2D1a1;
D1a2=D1a1;
D1%=2*D1a1/total;
D2%=(D2a1+D2a2)
/total;
N
D1a2=D1&D2D2a1;
D2a2=D2a1;
D1%=(D1a1+D1a2)
/total;
D2%=2*D2a1/total;
IMB D1= D1a1/
D1a2;
IMB D1=0;
Label with SAI;
whether ignored the
marker depending
on the selection in
the setting box.
D2a2=D1&D2D1a1;
D2a1=0 ||
D2a2=0;
Y
N
IMB D2
=D2a1/D2a2
IMB D2=0;
Imb D1 = 0 &&
IMB D2 =0
N
Y
Total D% = 0;
D1%=0;
D2%=0;
R%=0;
Imb D1 <=
Imb D2
Y
N
D2a2=D1&D2D1a1;
D1a2=D1a1;
D1%=2*D1a1/total;
D2%=(D2a1+D2a2)
/total;
D1a2=D1&D2D2a1;
D2a2=D2a1;
D1%=(D1a1+D1a2)
/total;
D2%=2*D2a1/total;
Total
D%=(D1&D2+
D1a1+D2a1)/total;
R%=(R1+R2)/total
Case 5.8
55
May 2013
Label with SAI;
whether ignored the
marker depending
on the selection in
the setting box.
Chapter 2 Chimerism Analysis
D1&R+D2&R+
D1a1+D2a1
Shared =2
5.9
Do SAI function
D1&R>D1a1
&&
D2&R>D2a1
R1=D1&R-D1a1;
R2=D2&R-D2a1;
D1=D1a1*2;
D2=D2a1*2;
Total
D%%=(D1+D2)/
total;
D1%=D1/total;
D2%=D2/total;
R%=(R1+R2)/total;
D1&R>=D1a1
&&
D2&R<D2a1
D1&R<D1a1
&&
D2&R>=D2a1
D1&R<D1a1
&&
D2&R<D2a1
R1=D1&R-D1a1;
D2a2=D2&R-R1;
R=R1*2;
D1=D1a1*2;
D2=D2a1+D2a2;
R1=D2&R-D2a1;
D1a2=D1&R-R1;
D1=D1a1+D1a2;
D2=D2a1*2;
R=R1*2;
Label with SAI;
Total
D%%=(D1+D2)/
total;
D1%=D1a1*2/total;
D2%=(D2a1+D2a2)
/total;
R%=R1*2/total;
Total
D%%=(D1+D2)/
total;
D1%=(D1a1+D1a2)
/total;
D2%=D2a1*2/total;
R%=R1*2/total;
Case 5.9
56
May 2013
whether ignored the
marker depending
on the selection in
the setting box.
Chapter 2 Chimerism Analysis
2R+1D1+1D2
6.3 6.5 exchange needed
Genotype
R1+R2+D1+D2
Shared=0
6.1
Total D%=(D1+D2)
/total;
D1%=D1/total;
D2%=D2/total;
R%=(R1+R2)/total
R1+D1&D2&R
Shared=1
6.2
R1+D2&R+D1
Shared=1
6.3
R1+R2+D1&D2
Shared=1
6.4
R1+1D1&R+D2
Shared=1
6.5
Other cases
Do SAI function
Total D%=D1&D2
/total;
R=R1+R2;
R%=R/total;
D1=D1&R-R1;
Total D%=(D1+D2)
/total;
D1%=D1/total;
D2%=D2/total;
R=2*R1;
R%=R/total
Can’t be
calculated
Do SAI function
D1&D2&R >= R 1
Y
D1+D2=D1&D2&R
-R1;
Total D%=(D1+D2)
/total;
R=2*R1;
R%=R/total
D1&D2&R < R 1
Y
D2&R >= R
Label with SAI
And ignored the
marker directly
D2&R < R
Y
Y
D2=D2&R-R1;
Total D%=(D1+D2)
/total;
D1%=D1/total;
D2%=D2/total;
R=2*R1;
R%=R/total;
Label with SAI
And ignored the
marker directly
Case 6.0
57
May 2013
Chapter 3 Genotyping General Procedure
58
May 2013
Chapter 3 Genotyping General Procedure
Chapter 3 Genotyping General Procedure
Chapter 3 Genotyping General Procedure
Import Data Files
Raw Data Analysis
Process Data
Adjust Analysis Parameters
59
May 2013
Chapter 3 Genotyping General Procedure
Overview
Chapters 3 and 4 provide a detailed description of importing data, all raw data and analysis icons, capillary
electrophoresis review and details for genotyping. For streamlined workflow for chimerism detection,
quantification and monitoring please go to the Chimerism Analysis Chapter.
Import Data Files
After installing ChimerMarker software you are ready to begin fragment analysis. First, raw data files must be
uploaded to the program. Below is the list of file types supported by ChimerMarker.
ABI - .fsa, .abi, ab1, .hid
MegaBACE - .rsd
Beckman-Coulter - .esd
Spectrumedix - .smd
Generic - .scf, sg1
Procedure
2.
3.
4.
5.
6.
7.
8.
Launch ChimerMarker
Click Open Data
The Open Data Files box will appear
Click Add button
The Open dialog will appear
Navigate to directory containing raw data files
Select all files by CTRL+A or use CTRL and/or SHIFT
keys to select individual samples
9. Click Open button in the Open dialog
10. The files selected will appear in the Data File List field
11. Click OK button in the Open Data Files box and the
samples will be uploaded to ChimerMarker
Features
There are several features available in the Open Data Files box to make data upload easier.
Add…
Used to locate and select raw data files for upload. Click the arrow button next to the Add button to see the four
most recently accessed directories.
Remove
Used to remove samples from the Data File List. Highlight the sample to remove by single left-clicking it in the
Data File List then click Remove.
Remove All
Removes all sample files from the Data File List field.
Add Folder…
Click Add Folder to upload raw data files from a specific folder in the file directory tree. Click the Default
hyperlink to choose a folder to which ChimerMarker will always open when the Add or Add Folder buttons are
clicked.
Channels
Opens the Set Channels dialog with 4 and 5-color tab options and allows the user to choose from ABI,
MegaBACE, and Beckman-Coulter standard dye color orders. The user can also manually enter dye color and
name. The default channel color setup is ABI. Set the dye color channels before clicking OK in the Open Data
Files dialog box.
60
May 2013
Chapter 3 Genotyping General Procedure
Raw Data Analysis
Once the raw data files are uploaded, the Raw Data Main Analysis window appears. Double-click the samples in
the Sample Tree to open the individual Raw Data Traces. The Synthetic Gel Image displays the unprocessed data in
a traditional gel format with larger fragments located on the right. The Electropherograms display fluorescent
signal intensities as a single line trace for each dye color. The signal intensities, recorded in Relative Fluorescent
Units (RFUs), are plotted along a frame scale in the Raw Data Analysis window with fragment mobility from right
to left. The largest size fragments are on the far right of the trace.
Raw Data Analysis Window
Sample Tree
Synthetic Gel Image
Raw Trace Data
Project
Summary
Main Toolbar Icons
Spike Removal: Removes peaks from voltage spikes caused by micro-air bubbles or debris in the laser
path. This option is selected by default in the Run Wizard.
Saturation Correction: A synthetic peak is created based on peak shape before and after saturation. The
results of these will be less accurate than that of non-saturated peaks. This option is selected by default
in the Run Wizard.
Smooth: This function smoothes the baseline by eliminating smaller noise peaks. This option is selected
by default in the Run Wizard.
Baseline Subtraction: Selecting this option will remove the baseline completely so that the Y-axis will be
raised above the noise level. This option is selected by default in the Run Wizard.
Auto Pull-up Removal: Automatically removes peaks caused by wavelength bleed-through to other
wavelengths. This option is selected by default in the Run Wizard.
Manual Pull-up Correction: This allows the user to manually adjust larger pull-up peaks in case the
Auto Pull-up Removal function has not corrected the problem. It is recommend to de-select Pull-up
Correction in the Run Wizard when using this function.
61
May 2013
Chapter 3 Genotyping General Procedure
2nd Derivative Trace: This feature reduces high background noise and sharpens peaks. Baseline
fluctuation caused from dye blobs or the DNA template in PCR can also be reduced with this function.
It is recommended to de-select Spike Removal in the Run Wizard when this function has been activated.
What to Expect
The raw data correction icons can be selected individually in the Raw Data Analysis window. The images below
demonstrate how the data will look before (left image) and after (right image) the parameter is applied.
Range
AutoRange - Analyzes from 0 to end of trace for size call
Manual Range – user-defined range
Right-click in gel image and select Get Start Point
Smooth
Fourier frequency transformation (FFT) to determine frequency domain
Use only top 40% of lowest frequencies
Smoothing broadens peaks and therefore you can lose resolution
Enhanced Smooth - Same as Smooth but use only top 20% of lowest frequencies
Baseline Subtraction
Use 20% of lowest intensities (to the right of the beginning of the range)
Looks at trace in 500-600 frame sections
62
May 2013
Chapter 3 Genotyping General Procedure
Pullup Correction
Ax=B
A being the major coefficient
Input matrix or use single dye adjustment up to 0.20 for small corrections
When Manual Pullup correction is chosen, a .txt or .mtx matrix file can be uploaded and used to deconvolute
dye colors.
NOTE: De-select automatic Pullup Correction in the Run Wizard Data Process box if a manual matrix correction
has been applied.
Saturated Peak Correction
ABI instrument saturated peaks are typically >8000 RFU
The top of a saturated peak looks split
A small pullup peak may be present under the saturated peak
ChimerMarker takes the small pullup peak and adds it to the split in the saturated peak
Spike Removal
Caused by overheating of camera chip, voltage spike, etc
Spikes usually only 1-2 frames wide; peaks usually 5-10 frames wide
Create a first derivative trace of the raw data
Spikes are the 1st DT outliers (3-5 sigma)
Second Derivative Trace
(A1-A2)-(A2-A3) = A1+A3-2(A2)
Use when you have a fat base to your peaks (ex. Dye blob under peak, etc)
63
May 2013
Chapter 3 Genotyping General Procedure
NOTE: Do not use 2nd DT with Spike Removal because real peaks look like spikes.
Process Data
After the raw data files have been uploaded to ChimerMarker, they are ready to be processed. The processing
step includes application of a sizing standard, filtering of noisy peaks, and comparison to a known allelic Panel.
ChimerMarker combines all these steps in one simple tool called the Run Wizard. To access the Run Wizard
simply click the Run Project icon in the main toolbar.
Run Wizard Template Selection
Procedure
1.
2.
3.
4.
Click the Run Project icon in the toolbar.
The Run Wizard Template Selection dialog box will appear.
Select a template (a previously saved set of size standard,
standard color, and analysis type named for future use), OR
select a new combination of size standard, standard color,
and analysis type.
Click Next when finished.
Icons and Functions
Template Name
Select from existing pre-made templates or create your own by entering a Template Name and clicking the Save
button. When a template is saved, only the settings in the Template Selection box of Run Wizard will be saved.
To create a new template, click Select an existing template or create one. A template can also be selected from the
list of available templates in the left section of the window and then saved for future use by clicking the Save
button.
If you do not want to use a template, select the appropriate size standard, standard color, and type of analysis;
Use last template will automatically be selected.
Panel
ChimerMarker comes preloaded with many common kit Panels including Promega’s PowerPlex kits and
Additional Panels can be imported by selecting the Open Files icon next to the Panel field. A custom Panel can be
created in the Panel Editor tool. See Chapter 6 Panel Editor.
Panel Editor: A Panel can be selected from any available from the drop-down menu or can be viewed
and selected by clicking the Panel Editor icon.
Import a Panel: If a Panel cannot be found in the Panel Editor tool, it can be imported by clicking on the
Import a Panel icon.
Size Standard
64
May 2013
Chapter 3 Genotyping General Procedure
ChimerMarker comes preloaded with many common size standards including GeneScan 500 and LIZ600. A
custom Size Standard can be created by selecting the Size Template Editor icon next to the Size Standard field. See
Chapter 5 Fragment Sizing Standards.
Size Template Editor: This allows the user to check sample files against a selected size standard,
modify and save the size standard for future use, or create a new size standard.
Standard Color
Select the dye color which contains the internal lane standard.
Analysis Type
The Analysis Type option is inactivated in ChimerMarker.
Run Wizard Data Process
Procedure
5.
6.
The Data Process window of Run Wizard appears.
Select the appropriate analysis settings in the Data Process
window and click Next to continue.
Icons and Functions
Raw Data Analysis
Auto Range (frame)
The range in camera frames will automatically find the processable data range. If
Auto Range is not selected, manually enter the start and end frame numbers of the
data set for analysis.
NOTE: If automatic size call fails due to high saturation, de-select Auto Range and
manually input the required data range.
Intensity Coefficients: Allows for manual correction of excessive bleedthrough peaks; best used for experiments with one-color analysis. Allows for
manual correction of low RFU by using an number greater than 1 to increase the RFU
Smooth
Smoothes the baseline by eliminating smaller noise peaks.
Enhanced Smooth
This feature is used only in cases where the data is extremely difficult to analyze and cannot be corrected
with the Smooth function.
Peak Saturation
The software will analyze saturated data points by creating a synthetic estimate of the peak shape based on
the curves prior to saturation. The results will be less accurate than that of non-saturated peaks.
Baseline Subtraction
This function removes the baseline completely so that the Y-axis will be raised above the noise level. It uses
20% of lowest intensities (to the right of the beginning of the range) and looks at the trace in 500-600 frame
sections
Enhanced Baseline Subtraction
This feature is used only in cases where the data has excessive baseline in one or more of the dyes, or has an
interfering slope from the ion front in the smaller marker ranges. The function uses the second derivative of
the absolute value for every 30 data points and looks at the trace in 300 frame sections
65
May 2013
Chapter 3 Genotyping General Procedure
In situations where there is an extended ion front in the mini-STR range Enhanced Baseline Subtraction
should be used.
Pull-up Correction
This function removes peaks caused by wavelength bleed-through to other wavelengths. The function
should be disabled if a Manual Pull-up Correction was used in the Raw Data Analysis window.
Spike Removal
Removes peaks from voltage spikes caused by micro-air bubbles or debris in the laser path. Spikes are
typically less than a base-pair wide. Do not select Spike Removal when 2nd Derivative Trace has been applied.
Size Call
ChimerMarker offers two sizing methods:
Local Southern
Used in most genotyping software applications and is recommended for most analyses. This method is
based on the idea that smaller size fragments run faster. Plot a size v. time graph and overlay a size v.
1/time graph to determine linear trace. (Southern, E.M. “Measurement of DNA Length by Gel
Electrophoresis.” 1979. Analytical Biochemistry. 100, 319-323).
Cubic Spline Method
Cubic Spline is offered as an alternative method that may be more appropriate for some data. This method
uses a cubic equation to connect known points on the size v. time graph. An example of a cubic equation:
ax3+bx2+cx+d. (The Astrophysical Journal. December 1, 1994. 436, pages 787-794.)
Local Southern Method
Cubic Spline Method
Allele Call
The Allele Call section allows the user to set allele calling range, detection thresholds and filters.
Auto Range
The software will identify peaks in the processable data range for each lane.
66
May 2013
Chapter 3 Genotyping General Procedure
Manual Range
To select a specific analysis region, de-select Auto Range and input the desired base pair range. Peaks outside the
Manual Range will not be called.
Peak Detection Threshold
NOTE: The Peak Detection Threshold parameters are only applied to peaks outside of the Panel Markers. To
adjust settings for peaks within Panel Marker ranges, see Chapter 6 Panel Editor.
Min Intensity
Minimum RFU threshold of peak height used for peak detection. Peaks below this value will not be called.
Max Intensity
Maximum RFU threshold of peak height. Peaks above this value will be flagged with a yellow Allele Label,
given a Quality Rank of Check, and marked with HI Quality Reasoning.
Percentage Global Max
Relative minimum intensity of allele peaks to the 5th highest peak in the dye color used for peak detection.
Peaks below this value will not be called.
Load Default
Recalls any settings previously saved by the user. If there are no user-saved settings, the program loads the
default settings for that particular analysis type.
Save Default
Saves any settings defined by the user that is different from the default. These settings can be recalled for
consistency of analysis on similar data sets.
Run Wizard Additional Settings
Procedure
7.
The Run Wizard Additional Settings box
appears
8. Select an Allelic Ladder and adjust the Peak
Score parameters.
9. Click OK
10. The Data Processing box appears
11. The data is sized, peaks are filtered, and the
Panel is applied
12. Click OK when the Data Processing box is
finished.
Functions
Allelic Ladder
Permits the selection of a sample containing an allelic ladder. If the user selects one ladder, the ladder will be in
bold font and is set to the top electropherogram in the Main Analysis window. All samples will be analyzed using
this selected ladder.
Allele Evaluation
Peak Score
User-definable confidence level of the allele call. Peak score is an algorithm that takes into account signalto-noise ratio and peak morphology. Rejected samples appear in red, samples that need to be checked
appear in yellow, and samples that have passed appear in green.
Auto Select Best Ladder
ChimerMarker identifies ladder samples in the dataset as defined in the View → Preference → Chimerism → Ladder
Identifier field. Ladder samples are then compared to the chosen Panel. Each ladder that is within the range of
the selected panel will pass and appears in bold font in the Sample File Tree.. Auto Select Best Ladder will
analyze each sample file with the passing ladder that best matches that sample. The print report provides the file
name of reference ladder used for each sample.
Auto Panel Adjustment
When selected, the Markers and Bins of the chosen Panel will be aligned with the peak positions of the Ladder
samples in the dataset (within a five base pair shift). Ladder samples are identified by ChimerMarker as defined
67
May 2013
Chapter 3 Genotyping General Procedure
in the View → Preference → Chimerism → Ladder Identifier field. Major alleles and variant (or virtual) alleles are
specified in the Control Column in the Panel editor. See Chapter 6 Panel Editor. This information is used for
pattern recognition and automatic panel adjustment.
NOTE: Panels that do not contain variant (virtual) alleles can be manually adjusted in the Panel Editor by first clicking
the Major Adjustment of Panel icon then the Minor
Adjustment of Panel icon.
NOTE: Panel must be saved with signal information
For optimum Auto panel adjustment. See Chapter 6.
Adjust Analysis Parameters
After the clicking OK in the Run Wizard Additional Settings box, the Data Processing
box appears. The raw data is being processed and sized, then the filtering parameters
are applied, and finally a Panel is applied (if selected). Click OK in the Data
Processing box when analysis is complete.
Review the results in the Main Analysis window. See Chapter 4 Main Analysis
Overview. If you notice many false positive peak calls, you may need to adjust the
analysis parameters. There are three options for adjusting the analysis parameters as
discussed below.
NOTE: Manual edits will be lost when data is re-analyzed.
Re-analyze with Run Wizard
To re-analyze with the Run Wizard tool, simply click the Run Project icon in the
main toolbar. The Run Wizard will launch and the most recently selected
parameters will be displayed. Adjust parameters as necessary and click OK in
the Run Wizard Additional Settings box. The Use Old Calibration box will appear
with the option to Call Size Again. Only select Call Size Again if the Run
Wizard Template Selection Size Standard selection was changed or any of the Run
Wizard Data Process Raw Data Analysis parameters were changed. Click the
Apply to All button. The Data Processing box will appear again and the data
will be re-analyzed with the new parameters.
Re-analyze with Auto Run
To re-analyze with Auto Run, first select Project → Options. The Project Options Settings box will appear. This box offers
all the same parameters settings as are available in the Run Wizard. Use the tabs to view the Template Selection, Data
Process, and Additional Settings boxes. Click OK when finished. Next, select Project → Auto Run. The data will be reanalyzed with the new parameters.
NOTE: The Additional Settings Allele Evaluation Peak Score parameters can be changed in the Project Options Settings box
and will be applied to the data without having to re-analyze the data with Run Wizard or Auto Run.
Re-analyze Individual Samples
To re-analyze an individual sample, dye color, or marker, click the Call Allele icon in the main toolbar. The arrow next
to the icon opens the drop-down menu with additional options. Click an option from the drop-down and the Recall
Allele box will appear. Adjust parameters as necessary and click OK. The new parameters will be applied.
All Samples
Applies the new parameter settings to all samples in the dataset –
similar to Run Wizard and Auto Run.
Open Samples
Applies the new parameter settings only to samples that are
checked in the Sample File Tree.
Current Sample
Applies the new parameter settings only to the sample
highlighted in the Sample File Tree.
Call the Dye
Applies the new parameter settings to the dye selected in the
Recall Allele → Call Allele by Dye field.
Call the Marker
Applies the new parameter settings to the marker selected in the Recall Allele → Call Allele by Marker field.
68
May 2013
Chapter 4 Genotyping Main Analysis Overview
Chapter 4 Genotyping Main Analysis Overview
Chapter 4 Genotyping Main Analysis Overview
Main Analysis Window
Menu Options
Main Toolbar Icons
Additional Analysis Options
69
May 2013
Chapter 4 Genotyping Main Analysis Overview
Main Analysis Window
The main window of ChimerMarker has an easy to use layout. The sample files are displayed on the left, the
Synthetic Gel Image is displayed at the top, Electropherograms appear below the gel image, and the Report Table is
on the right side of the window.
To resize the frames in the Main Analysis window, simply place the cursor over the partitions that separate the
Synthetic Gel Image/Electropherogram/Sample File Tree/Report Table. The cursor will change to a two-headed arrow
bisected by two vertical lines. Hold down the left mouse button and drag the gray vertical line in the direction
you wish. To open and close the frames, use the Show/Hide icons in the main toolbar.
Main Analysis Window
Sample File Tree
Report Table
Synthetic Gel Image
Electropherogram
Project
Summary
Sample File Tree
The Sample File Tree of the main analysis window contains two folders. The
first is the Raw Data folder which, when expanded, displays a list of all the
dataset samples. When a sample is double-clicked its preprocessed
electropherogram trace will appear in the Raw Data Analysis window. See
Chapter 3 General Procedure.
The second folder, Allele Call, also contains a list of all the samples, but
when the filename is double-clicked the sample’s electropherogram trace
appears in the Main Analysis window with all sizing information and allele
call filtering applied. The Allele Call folder also flags each sample with a
green sheet, yellow sheet or red strike-through indicating size calling
success. See Chapter 5 Fragment Sizing Standards.
Right-click the sample filename in the Raw Data or Allele Call folder to see additional options.
70
May 2013
Chapter 4 Genotyping Main Analysis Overview
Sorting Options
Select Page
Opens electropherogram traces for the number of samples specified in the View → Preference → Display Settings
→ Max Chart # In Page field. Hot Key = Page Up/Page Down
Select Next Group
In descending order, selects the same number of samples previously selected by Select Page, grouping options
(see Sample Grouping section below) or double-click option.
Select Max
Opens electropherogram traces for the number of samples specified in the
View → Preference → Display Settings → Max # Open Charts.
Deselect All
Unselects all selected samples in the Sample File Tree list and closes the
electropherogram traces.
Sort Samples
Opens the Sort Sample Options box. Select First, Second, and Third Order
sorting from the drop-down menu options Sample Type, File Name, Lane
Number, Well ID, and Size Score. You can specify the key word for index that
is separated by the "split symbol". For example, if 123_45_67 is the file name,
and you want to group by "45", the key word index would be "2". Each key
word index is separated by an (_) underscore. Hot Key = F3
Search Options
Search File
Opens the File Search box. Enter any part of a filename to search for the sample in the list. Click the Search
button. Left-click and use CTRL or SHIFT key to highlight samples then click the Open Selected button. The
electropherograms of the selected samples will open in the Main Analysis window. Hot Key = CTRL+F
Sample Information
Sample Info
Opens the Sample Information box. A list of Properties appears and includes
information like; Sample Name, Well ID, Lane Number, Instrument Name,
and Chemistry. The list of Properties varies depending on the file type. Hot
Key = F2
Edit Comments
Opens the Edit Comments box. Enter information in the Comments field. The
last ten comments will be stored and can be subsequently selected for future
samples. The Sample Comments will appear on the Print Report. See Chapter
7 Reports and Printing. Hot Key = F4
Disable Samples
Disable Sample
Opens the Input Disable Reason box and marks the sample with a red strikethrough. A disabled sample cannot be selected for display in the Main
Analysis window and will not appear in the Report Table if View → Preference
→ Options → Show Disabled Samples in Report is deselected. Select a Comment
Template or enter a new comment in the Comments field and click OK to
disable the sample. Hot Key = CTRL+DEL
Add Samples
From the main toolbar, select Project → Add Samples to Project. The Open Data
Files box will appear. Click the Add button to select additional samples to
add to the project and click OK. The added samples will be sized and the
allele calls will be filtered according to the parameters set in the Run Wizard.
71
May 2013
Chapter 4 Genotyping Main Analysis Overview
Sample Grouping
From the main toolbar, select Project → Apply Sample Grouping. The File Name Group Editor tool will appear (See
Chapter 9 Additional Tools). Select Group and Control identifiers and click Match. Click OK to apply the
matched groups. Group numbers will appear next to the filenames in the Sample File Tree. Use the Select Next
Group right-click menu option OR CTRL+PageUp/Down to open samples in a group. To disable the Sample
Grouping feature, go to View → Preference → Others and uncheck Enable Sample Grouping.
Synthetic Gel Image and Electropherogram with Peak Table
The Synthetic Gel Image and Electropherogram displays are associated in the Main Analysis window. Both display
the fragment information in a visual form. When ChimerMarker is initially launched, all dye colors are
displayed in the Synthetic Gel Image and Electropherogram at once. Single left-click the Show Color icon in the
main toolbar to cycle through the dye colors or use the Show Color drop-down menu to disable individual
colors or Show/Hide All colors.
Navigation
Zoom In/Out
In the Synthetic Gel Image or the Electropherogram, hold down
the left mouse button and drag a box from upper left to
lower right around the area you would like to zoom in on.
To zoom back out, hold down the left mouse button and
drag a box in the opposite direction from lower right to
upper left. The user may also use the Zoom icons in the
main toolbar to zoom in and out. The main analysis
window also allows the user to manually set the x and y
axis with the Set Axis icon.
Horizontal Movement
The Synthetic Gel Image and the Electropherogram are
synchronized to allow the user to view both images at once.
To move the images in the horizontal direction, use the top
slider bar (below the toolbar) to scroll the image in either
direction, or hold down the right mouse button and drag
the trace right or left.
Marker/Locus Specific Viewing
To scroll through individual markers/loci, select a marker from the Marker drop-down list in the main toolbar.
To view subsequent markers, use the Up/Down Arrow keys.
Synthetic Gel Image Features
The Synthetic Gel Image displays all samples in the dataset vertically. The direction of fragment mobility is
horizontal with the small size fragments on the left and the larger fragments on the right so that the gel aligns
with the electropherogram trace display. Move the mouse pointer over the Synthetic Gel Image to reveal the
sample lane filename.
Image Utilities
Click the Image Utilities icon in the upper left corner of the Synthetic Gel Image. A fly-out menu appears
with the following options:
Copy to Clipboard
Copies the Synthetic Gel Image to the Windows clipboard for pasting into other applications such as
Microsoft PowerPoint.
Save Image
Allows the user to save the Synthetic Gel Image as a BMP image file.
Show in Window
Opens a separate window containing the Synthetic Gel Image. The separate window can be maximized for
closer gel image inspection.
72
May 2013
Chapter 4 Genotyping Main Analysis Overview
Image Display
Intensity
Move the Intensity slide bar, located in the upper left corner of
the Synthetic Gel Image, up and down to adjust the intensity of the
fragments displayed.
Grey-Scale
Go to View → Preference → Display Settings → Gel Image. Select
Gray for Single Dye to change the single dye Synthetic Gel Image
to black and white when only a single dye color is selected (when
multiple dye colors are selected the fragments will appear in their
respective colors). Click the Background in White option to
reverse the black and white exposure for single dye color gel
images.
Electropherogram and Peak Table Features
The Electropherogram displays fluorescent signal intensities from capillary electrophoresis instruments as a single
line trace for each dye color. The signal intensities are recorded in Relative Fluorescent Units (RFUs) which are
plotted along the y-axis. Along the x-axis are the base pair sizes of the fragments. The frame units plotted along
the x-axis in the original Raw Data Analysis window are converted to base pair size units as defined by the Size
Standard selected and the Internal Lane Standard (ILS) of the individual samples. Fragment mobility is from
right to left with the smallest size fragments on the far left of the trace.
The Peak Table contains information about the called peaks currently displayed in the Electropherogram.
Electropherogram Trace Display
Range
The base pair size range (x-axis) is as set in the Run Wizard Data Process Allele Call options box. The RFU
range (y-axis) is variable and will re-adjust according to the maximum peak height in the trace. To
manually set x and y-axis ranges, use the Set Axis icon in the main toolbar.
Cursor Locator
The x and y-axis position of the mouse pointer in the electropherogram is displayed in the upper right
corner of the electropherogram.
Allele Call
If a Panel is applied to the data, then grey horizontal bar Markers will appear above the electropherogram
indicating locus ranges. Bin ranges appear as dye-colored brackets above and below the sample trace. Allele
Labels appear below the electropherogram and are associated with the center of each called peak which is
also marked by a light grey vertical line in the electropherogram. If a Panel is not applied, then Allele Labels
for called peaks will only indicate the base pair size of the peak.
Peak Table
The Peak Table can be displayed below the
Electropherogram by clicking the Show Chart/Table icon
in the main toolbar. Right-click in the Peak Table and
select Show Columns. The Show Columns fly-out
appears with column options.
Dye
Indicates the dye color of the peak.
Size
Indicates the base pair size of the peak (x-axis).
Height
Indicates the peak height in RFUs (y-axis).
Height Ratio
The value obtained when the peak’s height is divided
by the height of the highest peak in the dye color or
Marker.
73
May 2013
Chapter 4 Genotyping Main Analysis Overview
Area
Indicates the area under the curve of the peak. The area calculation begins and ends along the x-axis as
indicated by the Start and End columns of the Peak Table respectively.
Area Ratio
The value obtained when the peak’s area is divided by the area of the highest peak in the dye color or
Marker.
Marker (Panel Only)
Indicates which Marker (Locus) the peak is contained in.
Allele (Panel Only)
Indicates which Bin the peak is contained in.
Difference (Panel Only)
Indicates the absolute value in base pairs of how far the peak center is from the Bin center.
Quality (Panel Only)
Assigns a Pass/Check/Undetermined quality ranking for each peak with regard to the peak Score as set in the
Run Wizard Additional Settings box (See Chapter 3 General Procedure) and/or software editing of the
original raw data, such as correction of saturated peaks (SAT Repaired).
Score
The peak quality score is calculated based on signal-to-noise ratio and peak shape or morphology. Lower
scores indicate poorer quality peaks. Additionally, the Score value is a based on an exponential curve.
Start/End
Indicate the beginning and end of the Area calculation for the peak.
Comments
Software and user edited comments appear in the Comments column.
Quality Reasons
Indicates the reason why a peak received a Quality rank of Check or Undetermined. For explanation of the
two and three letter codes see below OR click the Help icon above the Report Table.
SP = Saturated (Pull- up)
Intense peaks may cause “pull-up” or
additional peaks to appear in other dye
colors.
LS = Low Score
Quality Score is based on Signal-to-Noise
Ratio and Peak Morphology and the Pass,
Check, Reject ranges are set in the Run
Wizard Additional Settings box.
PL = Beyond Ploidy
When the number of peaks identified
within a marker exceeds the maximum
number of peaks expected as set in the
Panel Editor Edit Panel box.
OL = Off Ladder
Peak is outside of the marker range.
OB = Out of Bin
Peak is within the marker range but
outside of a bin.
LO = Low Intensity
Single peak called below the Minimum
Homozygote Intensity threshold because a
second peak was detected above N-x
percentage value as set in the Panel Editor
Edit Marker box
BC = Bin Conflict
More than one called peak present within
a bin.
HI = High Intensity
Peak intensity approaches and/or exceeds
the maximum peak intensity filter as set in
the Run Wizard Data Process box.
SR = Saturated (Repaired)
Intense peaks with characteristic
morphology are identified and “repaired”
for allele calling.
74
May 2013
Chapter 4 Genotyping Main Analysis Overview
IMB = Heterozygote Imbalance
Peak intensity does not exceed the
minimum percentage of the major peak
within the marker as set in the Panel Editor
Edit Marker box.
IHE = Inconclusive Heterozygous
Peak intensity is within the heterozygous
inconclusive range set for this locus in the
Panel Editor Edit Panel box.
IHO = Inconclusive Homozygous
Peak intensity is within the homozygous
inconclusive range set for this locus in the
Panel Editor Edit Panel box.
Save Peak Table
Click the Save Peak Table icon in the main toolbar to export the Peak Table information currently being
displayed in Excel (.xls) or tab-delimited Text (.txt) format. All samples peak information for only the dye
colors selected will be exported in the table. Additionally, the user can right-click in the Peak Table and select
Copy Table (Hot Key = CTRL+C) to place the current table information onto the Windows clipboard. The
information can then be pasted into most common spreadsheet or word processing programs including
Microsoft Excel.
Editing Peaks
Double-click the vertical grey peak center bar to select a peak. Right-click anywhere in the Electropherogram
or Peak Table to see additional menu options.
Insert Allele
Right-click at the place in the electropherogram where you would like to add
an allele and select Insert Allele. The base pair size or bin name will be applied
in the Allele Label and the peak specifications will be calculated and displayed
in the Peak Table.
Delete/Undelete Allele
Right-click at the vertical grey bar indicating the center of the called peak or the
peak cell in the Peak Table and select Delete (Hot Key = DEL). To call the allele
again, right-click the peak and select Undelete (Hot Key = SHIFT+DEL).
Confirm/Unconfirm Allele
If a peak is given a low quality score, it will receive a Check (yellow) or Undetermined (red) Quality ranking.
To give the peak a Pass (green) Quality ranking, right-click the peak center bar and select Confirm (Hot Key
= CTRL+M). The peak will be marked Pass (green) and receive a “Confirmed” comment in the Peak Table.
To un-confirm the allele, select Unconfirm from the right-click menu (Hot Key = CTRL+ALT+M).
Confirm/Unconfirm All
Confirm All and Unconfirm All options perform the same actions as the Confirm/Unconfirm allele except that
the Quality ranking for all peaks in that dye color for that sample will be affected.
Edit Allele
Right-click an allele in the Electropherogram or Peak Table and select Edit Allele. The Edit Allele box appears.
Add or change the values in the Allele and/or Size field. The Allele field will be blank if no Panel has been
applied to the dataset. Check Confirm the Allele to automatically give the peak a Quality rank of Pass (green).
Allele Comments
Right-click an allele in the Electropherogram or Peak Table and select Edit
Comments. The Edit Allele Comments box appears. Select a comment from the
Comments Template list or enter a new comment in the Comments field. Click OK
and the comment will appear in the Comments column of the Peak Table. Only
one user edited comment can be added to a peak. Comments automatically
generated by the software cannot be removed. Additional user comments will
simply be added next to the software comment.
View History
75
May 2013
Chapter 4 Genotyping Main Analysis Overview
Opens the Show Edit History window. Shows a record of all manual edits performed on the peak. The Show
Edit History window is only active when the Help → User Management → Settings → Record Data Edit History
option is selected. See Chapter 10 User Management.
Report Table
The Main Analysis window Report Table contains additional information about sample peaks. See Chapter 7
Reports and Printing.
Navigation
The Report Table is linked to the other frames in the Main Analysis window. Double-click on the desired allele OR
use the Arrow keys to move to the cell of interest and hit Enter key OR use Alt + Arrow keys to move to
different cells and zoom in on the peak in the Electropherogram.
Select multiple cells by holding down SHIFT key OR hold left mouse button and drag over desired cells.
The rules by which the Report Table and other frames in the Main Analysis window are linked are controlled by
options in the View → Preferences → Others tab.
Display Settings
Click the Report Settings icon in the Report Table toolbar. The Allele
Report Settings box will appear. Select different Report Styles to see
additional options. After selecting Report Style options, click the Save
as Default icon in the bottom left corner of the Allele Report Settings
box. Your options will be saved and will be recalled the next time you
select that Report Style. Additionally, select View → Preferences →
Others → Show Disabled Samples in Report to include samples that are
disabled in the Sample File Tree.
Sort Options
Sort by Marker
Select Sort by Marker from the right-click menu and choose from the fly-out menu to sort Ascending or Descending.
If Ascending is chosen, then low quality peaks will be sorted to the top of the table. If Descending is chosen, then
the lower quality peaks will be placed at the bottom of the table. This option is only available with Marker Table
and Allele Count Report Styles.
Sort by Column
Select Sort by Column from the right-click menu and choose from the fly-out menu to sort Ascending or
Descending. If Ascending is chosen, then lesser values will be sorted to the top of the table and greater values to
the bottom the table and vice versa if Descending is chosen. This option is available with all Report Styles.
Editing Peaks
To edit peaks, first left single or double-click the cell in the Report Table then right-click to see menu options or
use Hot Keys.
Delete Peaks
Right-click the peak cell in the Report Table and select Delete Peaks (Hot Key = DEL). The deleted peak will be
removed from the Report Table.
Confirm Peaks
If a peak is given a low quality score, it will receive a Check (yellow) or Undetermined (red) Quality ranking. To
give the peak a Pass (green) Quality ranking, right-click the peak cell and select Confirm Peaks (Hot Key =
CTRL+M). The peak will be marked Pass (green).
Peak Information
76
May 2013
Chapter 4 Genotyping Main Analysis Overview
Hold down CTRL key and click the peak cell of interest. The Allele Peak Info box will appear containing
information such as Sample, Dye, Size, Marker, Allele, Score and Comments. The information in these fields
cannot be edited. This option is only available with Allele List, Marker Table, and Peak Table Report Styles.
Save Report Table
To save all information currently displayed in the Report Table, click the Save Report icon in the Report Table
toolbar. Choose a directory, enter a filename (ProjectName_AlleleReport is the default) and save as an Excel (.xls)
or tab-delimited Text (.txt) file.
To export only selected cells in the report table, first select the cells by left-mouse drag across the cell range or
hold SHIFT key and select cells. Right-click on the highlighted cells and select Copy (Hot Key = CTRL+C). The
information is saved to the Windows clipboard and can be pasted into any common word processor or
spreadsheet program like Microsoft Excel. The row and column headers for those cells will be copied with the
highlighted cell information.
Menu Options
The following menu options can be found in the menu bar of the Main Analysis window.
File Menu
The File menu contains functions for opening and saving raw and processed data.
Open Data
Launches the Open Data Files window where the user can select raw data files for
upload into ChimerMarker. Accepted file formats include .fsa, .ab1, .abi, .scf, .rsd,
.esd, .smd, .smr. See Chapter 3 General Procedure.
Open Project
Opens a folder search window where the user can select to open previously saved
SoftGenetics ChimerMarker project files (.sgf, .sfp)
Re-Open Project
Saves the last four projects that were opened by ChimerMarker and allows the user to launch any one of those
four projects directly.
Save Project
Saves a SoftGenetics ChimerMarker project (.sgf, .sfp) to a specified directory. Raw data files and analyzed data
files with edits are saved within a project file.
Close All
Closes a project without exiting the program.
NOTE: It is recommended to select Close All before exiting the program.
Exit
Closes the ChimerMarker program.
View Menu
The View menu contains options for how the data is displayed in the Main
Analysis window.
Show Navigator/ Gel Image/ Report
Toggles the Sample File Tree, Synthetic Gel Image, or Report Table frames open and
closed in the Main Analysis window.
Preference…
Activates the three-tab Preferences box.
Start up Settings
The Start up Settings tab, effective only at start up, allows you to select the Run Method and General Settings.
77
May 2013
Chapter 4 Genotyping Main Analysis Overview
Run Method
Classic: Appropriate for experienced users. The user will move
through the program data input, settings, and display options
without prompting, by simply following the program’s
sequential analysis flow.
Wizard: Activates the Run Wizard which will guide the user
through the program’s operation. This setting is best for the
inexperienced user.
General Settings
Show Navigator:
When selected, the Sample File Tree will
automatically be displayed in the Main Analysis window after
data processing.
Show Gel Image: When selected, the Synthetic Gel Image will
automatically be displayed in the Main Analysis window after
data processing.
Show Report: When selected, the Report Table will automatically be displayed in the Main Analysis window
after data processing.
Display Settings
The Display Settings tab is used to set how the data is displayed in the electropherograms.
Allele Label
Decimal Precision: Select 0 to 2 decimal places for peak size
labeling.
Mark Off-Allele as ‘OL’: Select this option to label alleles that are
outside of allele ranges as ‘OL’.
Use Size String for Label: Select this option to label peaks in the
electropherograms according to size instead of the allele label.
To display a rounded size string, set the Decimal Precision to 0.
Larger Font: Doubles the font size of the allele label characters.
This increased font size will carry over to the Print Report.
Chart Settings
Max # of Open Charts: Select the maximum number of samples
you would like to display as an electropherogram at one time
(Max = 96). Use the Sample File Tree right-click option Select Max
to open the number of samples specified.
Max Chart # in Page: Select the maximum number of sample electropherograms you would like displayed in
the Main Analysis window at one time (Max = 8). Use the Sample File Tree PageUp/Down option to select
subsequent groups of samples.
Max Allele Label Layers: Select the number of allele label layers to view at once (Max = 10). This determines
how far you must zoom in to clearly read neighboring allele labels and affects how the print report will be
displayed.
Show Loci with multiline: Select this option to display the names of all markers above the electropherogram
when two or more dyes are displayed.
Peak Label
Choose up to four labels (size, height, area, score) to display as a flag next to individual peaks in the
electropherogram.
Position: Choose to place the peak label at either the top of the peak, to the right side of the peak, or in the
allele label in the Electropherogram.
Gel Image
78
May 2013
Chapter 4 Genotyping Main Analysis Overview
Gray for Single Dye: When selected will display and print the gel image with a black background and white
bands. When deselected the gel image will display a black background and colored bands (depending on
dye color chosen to view).
NOTE: When all dye colors are selected, the bands in the gel image will be displayed in color regardless if
this option is selected.
Background in White: Only available when Gray for Single Dye is selected. Will invert the gel image so that the
background will be white and the band fragments will be black.
Chimerism Analysis Preferences, Multi-Lineage Analysis
The program preferences include labeling peak ratios by height or area; with multi-lineage capabilities for
chimerism analysis of T-cells, B-cells, and other cell type populations. By doing multi-lineage assessment,
valuable information about the current graft status of the host can be seen. . In addition, there are functions for
comparison of samples at different time points to conduct longitudinal studies and produce a comprehensive
graph. Case specific panels are automatically constructed, using Donor and Recipient allele calls.
Select the desired Peak Ratio method – Peak Height or
Area
Enter the File identifiers used by your laboratory. The
program uses these portions in the file name to
differentiate between allelic ladder, positive and
negative controls, Donor, recipient and tissue type. For
example, using these designators: if there is a sample
from the recipient from blood, a second sample from
the recipient from TCells and a third sample from the
recipient from BCells the file names should include
7. RECIPIENT_BLOOD_
8. RECIPIENT_T CELLS_
9. RECIPIENT_BCELLS_
The identifier may be any combination of letters and numbers (for example, in place of RECIPIENT labs may
wish to type in the recipient’s ID number or name.
Show Ladder Samples in Report: When selected, the samples designated as Ladders by the Ladder Identifier field
will appear in the Report Table.
Show Control Samples in Report: When selected, the samples designated as Positive and Negative Controls by
the Positive/Negative Control Identifier fields will appear in the Report Table.
Mark Deleted/Edited Peaks with Symbols: when selected samples that are deleted are marked with an χ at the
top of the peak. Samples that were edited are marked with an E at the top of the peak.
Label Peak Ratio: Select from displaying peak ratio from height or area in peak flags on the electropherogram
Ladder Identifier: Enter common filename nomenclature for Ladder samples in the dataset (must be in all
capital letters). Upon first analysis, ChimerMarker will automatically scan the dataset filenames for the
Ladder Identifier values and subsequently label the Ladder samples with an “LD:” and display the sample
filename in blue font in the Sample File Tree. Default is “LADDER”.
NOTE: The Ladder Identifier option affects the operation of the Auto Select Best Ladder and Automatic Panel
Adjustment features in the Run Wizard Additional Settings box. After modifying the Ladder Identifier field,
re-activate Run Wizard and proceed through Data Process. The Auto Select Best Ladder and Automatic Panel
Adjustment features may now be selected.
Positive Control Identifier: Enter common filename nomenclature for Positive Control samples in the dataset
(must be in all capital letters). Upon first analysis, ChimerMarker will automatically scan the dataset
filenames for the Positive Control Identifier values and subsequently label the Positive Control samples with a
“PC:” and display the sample filename in green font in the Sample File Tree. Default is “-PC-“.
79
May 2013
Chapter 4 Genotyping Main Analysis Overview
Negative Control: Enter common filename nomenclature for Negative Control samples in the dataset (must
be in all capital letters). Upon first analysis, ChimerMarker will automatically scan the dataset filenames for
the Negative Control Identifier values and subsequently label the Negative Control samples with an “NC:”
and display the sample filename in red font in the Sample File Tree. Default is “-NC-”.
NOTE: To implement a change in the Identifier fields, right-click any sample in the Sample File Tree and select
Set Sample Type Auto Identify.
Report Settings
The Report Settings tab allows users to select how data is displayed in
the Report Table.
Automatically Re-Sort Report: Check this option if you would like
ChimerMarker to automatically re-sort the report every time you
modify alleles. Un-check this feature if you want the report to
remain sorted until you choose to re-sort.
Automatically Scroll Charts to Alleles When Selected in Report: You
may choose whether to scroll to alleles in the trace when selecting
the allele in the report. Leave this feature on to have the software
automatically call up alleles in the trace when you double-click on
them in the report.
Show Disabled Samples in Report: ChimerMarker identifies samples
that failed during electrophoresis or size calling. The default setting excludes the disabled samples from the
report. The option may be selected to have failed or user-disabled samples to be identified in the report.
Others
The Others tab has additional selections for the project.
Enable Sample Grouping: When Project → Apply Sample
Grouping is implemented, the Enable Sample Grouping option
will be automatically selected. De-select Enable Sample
Grouping to inactivate the Apply Sample Grouping option. The
Apply Sample Grouping information is saved and can be
recalled by selecting Enable Sample Grouping. See Chapter 9
Additional Tools – Filename Group Editor.
Automatically Save Run Wizard Parameters to INI file:
Automatically saves the Run Wizard parameters in an .ini
file when the project is saved. The location is the same
location as the saved project and the name of this file is the name given to the
SaveProjectName_RunWizardParameters.ini.
Channels: Opens the Set Channels box and allows the user to choose from ABI, MegaBACE, and
Beckman-Coulter standard dye colors. The user can also manually enter dye color and name.
The default channel color setup is ABI. See Chapter 3 General Procedure.
Project Menu
The Project menu contains options for how the data is processed and printed.
Run
Activates the Run Wizard and begins the data processing setup. This allows the
user to select or adjust program settings in a sequential manner. The same process
action can also be accomplished by clicking the Run icon in the toolbar.
Auto Run
ChimerMarker will process data using the last set of parameters selected. If one or
more of the parameters require changing to improve analysis, select Project →
Options, change the desired setting(s), and re-process the samples for analysis.
80
May 2013
Chapter 4 Genotyping Main Analysis Overview
Add Samples to Project
The user can add samples to a project that has already been sized and analyzed. When selected, the Open Data
Files box will appear. Click Add to select individual files to the project and click OK. The raw data file will be
sized and processed with the same settings as the other files in the project and added to the bottom of the Sample
File Tree.
Print Report
Selecting Print Report launches the Print Report Settings box which allows the user to define display settings in the
Print Report. The software permits printing of the sample electropherograms. You can choose to print all
samples, selected samples, or print samples along with the allele table, if desired. See Chapter 6 Reports and
Printing.
Options
Allows you to access and change parameters in the Project Option Settings window. This three-tab window
contains settings identical to the Run Wizard. Adjust settings in the Project Options Settings box before selecting
Auto Run. See Chapter 3 General Procedure.
NOTE: Auto Run does not need to be selected after adjusting the Additional → Allele Evaluation → Peak Score
settings. The changes will automatically be applied when the Project Option Settings window is closed.
Project Comments
Allows the user to write free-form comments regarding the analysis. These comments are saved with the project
file and can be displayed in the Print Report.
Applications Menu
The Applications menu contains individual modules for specific data and analysis types. These modules present
advanced features and reporting options necessary for the particular application. The types of Chimerism
Analysis (single donor or double donor) may be selected from this drop-down menu.
Tools Menu
The Tools menu contains the Panel and Size Editors in addition to other miscellaneous modules.
Panel Editor
Provides a variety of tools to adjust, edit, and create control Panels. See Chapter
6Panel Editor.
Size Template Editor
Allows the comparison of sample files against a selected size standard, to modify
and save the size standard for future use, or create a customized size standard. See
Chapter 5 Fragment Sizing Standards.
Positive Control Template Editor
This menu enables the user to enter positive control genotypes; making them
available in the third screen of the Run Wizard for automated positive control
concordance. See Chapters 2 General Procedure and 9 Additional Tools.
File Conversion
This tool allows import of time and distance files from custom genetic analyzers for use with files formatted by
the Convert Text to Binary File tool.
Tools.
File Name Group Tool
Used specifically with the MSI and LOH applications, the Filename Group Tool allows users to define how
reference samples and tumor samples should be grouped or paired. A Text (.txt) file is exported. See Chapter 9
Additional Tools.
81
May 2013
Chapter 4 Genotyping Main Analysis Overview
Convert Text to Binary Files
For customers developing their own instrumentation, the Convert Text to Binary Files option allows users to
upload four or five-color Text files (without headers) for conversion into SCF (four-color data) or SG1 (five-color
data) trace files for analysis with ChimerMarker. See Chapter 9 Additional Tools.
.
Output Trace Data
Provides the option to output the raw or sized trace data as a TXT or SCF file. Select the samples to include, dye
colors, data type, and the directory to output the trace files. See Chapter 9 Additional Tools.
Export Electropherogram
Allows the user to export the trace images to a specified folder.
Magic Wizard
Contains three option boxes: Start Your Project, Run and Report.
Start Your Project
Allows the user to easily access the Open Data or Open Project
upload windows. The user can also re-open the four previously
opened projects by selecting the black arrow next to Open Project.
Run
Selecting Run launches the Run Wizard. Selecting AutoRun will
process the data automatically with the process options currently
selected. See Chapter3 General Procedure.
Report
Allows the user to Save Project or Print Report. Selecting Print Report will launch the Print Report Settings box.
See Chapter 7 Reports and Printing.
Show Last Event
Opens the last active Data Process action.
Help Menu
Help
Launches a searchable version of this manual.
User Management
Allows an administrator to assign access rights to different users. Also used to set up the password protection
feature. See Chapter 10 User Management.
About…
Displays information specific to the version of ChimerMarker running on the computer. Also contains links to
email Technical Support and the SoftGenetics website.
Main Toolbar Icons
Open Data
Opens data input dialog box to begin analysis.
Run Project
Opens Run Wizard for processing the data.
Show/Hide Toggles
Displays or hides the Sample File Tree, Synthetic Gel Image, and Report Table frames,
respectively.
82
May 2013
Chapter 4 Genotyping Main Analysis Overview
Print Report
Provides the user display options for the Print Report.
Show Color
Allows the user to select all colors to view, hide all colors, or choose a single dye layer. Choose a single
dye by single left mouse clicking on the icon.
Zoom In
Use the icon to zoom in on the image, or hold down the left mouse button and draw a box, from the top
left corner to bottom right corner, around the area you wish to zoom in.
Zoom Out
Use the icon to zoom out on the image, or hold down the left mouse button and draw a box, from the
bottom right corner to top left corner.
Set Axis
The default setting automatically sets the Y-axis according to the maximum peak intensity of the
samples. Two other options are available: auto fit the Y-axis using peak intensities of the alleles, or the
user can select the ranges for the X- and Y-axis.
Browse by All Colors
Displays a comparative view of sample electropherograms by dye color. Individual samples can be
selected from the drop-down menu.
Allele Call Icons
These icons are only available after the raw data has been processed and the Sample File Tree Allele Call folder is
selected.
Size Calibration
Displays calibration charts for linearity of lane analysis.
Show Chart/Table
Toggles display to show only the Peak Table, the Peak Table and Electropherogram, or just the
Electropherogram.
Save Peak Table
Exports the Peak Table as an Excel (.xls) file or tab-delimited Text (.txt) file.
Call Allele
Call alleles by sample(s), by marker, or by dyes. Permits slight modifications to the samples without
having to activate Run Wizard again. Settings to change include Peak Detection Threshold, Stutter Peak
Filter, and Peak Score Threshold.
Marker Drop-down Menu
Allows the selection of a marker to view. This is available after the samples have
been compared to a Panel.
Event Log
Displays each lane’s processing success or failure.
Magic Wizard
Activates the Start Your Project, Run and/or Report dialog boxes.
Report Table Icons
The icons are located directly above the Report Table.
83
May 2013
Chapter 4 Genotyping Main Analysis Overview
Report Settings
Allows the user to customize Report Table display settings.
Save Report
Exports the Report Table as an Excel (.xls) file or tab-delimited Text (.txt) file.
Customize Bin Column
Allows the user to select which bins to include/exclude in the Report Table.
Additional Analysis Options
In addition to the Main Analysis window, there are two other display options in which the sample data can be
viewed: Browse By All Colors and the Profile Comparison View.
Browse By All Colors
Click the Browse by All Colors icon in the Main Analysis
window toolbar.
Navigation and peak editing options in the All Color Browser
is similar to the Main Analysis window.
To scroll through samples in the All Color Browser, click the
drop-down menu in the upper right corner and select a
sample from the list. Once a sample is selected in the dropdown menu, you can use the Up/Down Arrow keys to scroll
through samples.
Icons and Functions
Zoom In/Out
Use these icons to increase/decrease the zoom
aspect of the electropherograms.
Show/Hide Mouse Cross Lines
When selected, x and y-axis grid lines will appear at the tip of the mouse cursor along with the base
pair size and RFU value of the mouse cursor position.
Show/Hide Bin Ranges
When selected, the Bin brackets at the top and bottom of the electropherogram trace will appear.
Auto Scale Markers
When selected, the RFU intensities of low peaks are adjusted to match the intensity of the highest peak
in the dye color. When low peaks are increased, the intensity magnification factor is noted in the
Marker (2X – 8X).
Print
Opens the Print Report settings box. See Chapter 7 Reports and Printing.
Profile Comparison View
Applications → Profile Comparison View
The Profile Comparison View was developed as an easy way to compare several sample traces at once.
Procedure
1.
2.
3.
4.
Select several samples from the Sample List by placing a
check mark in the empty box to the left of the filename.
Click OK
The traces will appear in the window to the right.
Slide the 2D Offset bar to the right to de-convolute the traces.
84
May 2013
Chapter 4 Genotyping Main Analysis Overview
5.
6.
7.
Select the Line List tab to open the list of traces present in the viewer. Select any trace to bold the trace line.
Select a marker from the drop-down list to view one marker at a time.
Select Show 3D to see the traces in a three dimensional view.
Icons and Functions
Dye Color
Single click to scroll through the dye colors
Zoom In/Out
Single click to zoom in or out on the center of the Trace View window.
Tools
All viewing options are selected by default. Unselect these options to change the Trace View settings.
Save
Save the Trace View image as a Bitmap (.bmp) file.
85
May 2013
Chapter 5 Fragment Sizing Standards
86
May 2013
Chapter 5 Fragment Sizing Standards
Chapter 5 Fragment Sizing Standards
Chapter 5 Fragment Sizing Standards
Size Template Editor
Size Calibration Charts
87
May 2013
Chapter 5 Fragment Sizing Standards
Size Template Editor
The Size Template Editor is a tool in ChimerMarker for creating and modifying Size Standards. To open the Size
Template Editor, select Tools → Size Template Editor from the menu bar OR click the Size Template Editor icon in
the Run Wizard Template Selection box.
Due to differential fragment mobility in capillary gel electrophoresis, a sizing standard must be applied. Each
sample run through a CE instrument will contain an Internal Lane Standard (ILS). The ILS contains peaks of
known size and is usually tagged with red or orange fluorescent dye. Since the ILS dye-labeled fragments
migrate through the same capillary as the other dye-labeled sample fragments, they are subject to the same
environmental conditions and can therefore be used as a guide to determine the size of the other fragments in
the sample. A Size Standard template is applied to each ILS and sizes between the known ILS peaks are
interpolated.
NOTE: ChimerMarker is optimized to size fragments with linear mobility. Larger fragments or those run
through a high viscosity gel (i.e. agarose) do not migrate linearly and therefore cannot be analyzed with
ChimerMarker at this time.
Size Template Editor
Size Standard List
The Size Standard List contains all pre-defined Size Standards and any custom-made Size Standards. Single-left
click a Size Standard in the list to select it. The Expected Size Standard trace and Size Table will appear on the right.
Additional Options
88
May 2013
Chapter 5 Fragment Sizing Standards
To see additional options for each Size Standard, right-click the Size Standard name and the right-click
menu will appear with the following options.
Delete Size Standard
Select Delete to delete the Size Standard from the Size Standard List and from the SoftGenetics ChimerMarker
Size Standard directory.
NOTE: This action is irreversible.
Export Size Standard
Opens the Save As window. Choose a directory folder and click Save. The Size Standard will be copied to
the selected directory and will also remain in the Size Standard List and SoftGenetics ChimerMarker Size
Standard directory. The Size Standard will be exported as an XML file which can be opened with Internet
Explorer, Microsoft Excel, or Notepad.
Reload Size Standard
Click Reload to undo editing changes to the Size Standard. The most recently saved Size Standard will be
restored.
NOTE: If the user selects Save Size Standard and then answers “NO” to the “Size Standard has been
changed, save changes?” the changes will remain in the Expected Size Standard and Size Table until the user
chooses Reload or ChimerMarker program is closed.
Sample List
The Sample List contains a list of all the samples in the dataset. Double-click the filename and the sample’s ILS
trace will appear in the Sample ILS frame. Use the Up/Down Arrow keys to scroll through samples in the list.
Expected Size Standard and Size Table
The Expected Size Standard frame displays, as a trace, all the known fragment peaks that are expected to appear in
the Sample ILS. Single left-click a green triangle atop a peak to select the peak. The green triangle will turn
yellow when the peak is selected.
Additional Options
Once a peak is selected, right-click anywhere in the Expected Size Standard frame. The right-click menu will
appear with the following options.
Edit Size
The Edit Size box appears. Adjust parameters and click OK.
Size: Enter the expected base pair size of the ILS fragment.
Comments: Enter free form text regarding the Size.
Enabled: When selected, a “1” will appear in the Expected Size Table. Deselect
this option to disable the Size in the Size Standard. Disabled sizes will be used
for pattern recognition in the sample ILS but will not be used to size fragments
in the other dye colors. Disable a Size if its position is variable from sample to
sample.
NOTE: If the Enabled value is changed in the Size Table, you must click another cell in the Size Table before
saving the Size Standard or the change will not take effect.
Insert Size
Right-click at the position in the Expected Size Standard frame or in the Sample ILS where the Size should be
placed. The Edit Size box will appear. ChimerMarker will automatically interpolate the value in the Size
field if there are two or more Sizes present in the trace. Adjust as necessary and click OK. A green triangle
will appear at the cursor position indicating where the new Size was placed.
NOTE: The height of the new Size in the Expected Size Standard trace is dependent on the height of the peak
in the corresponding Sample ILS trace.
Delete Size
Select Delete Size to remove the Size completely from the Size Standard. Alternatively, the Size can be
disabled by deselecting Enabled in the Edit Size box or by placing a “0” in the Enabled column of the Expected
Size Table.
NOTE: Sizing is often more successful when there are many Sizes in the Size Standard.
Set Value to Column
89
May 2013
Chapter 5 Fragment Sizing Standards
Makes all values in the column equal to the value in the highlighted cell. Only available in the Expected Size
Table.
Sample ILS
The Sample ILS frame displays the selected sample’s ILS trace. Click the Show Dye icon in the toolbar to cycle
through the other dye colors. Right-click at a peak without a green triangle indicator and choose Insert Size. The
Edit Size box will appear. Adjust as necessary and click OK. The green triangle will now appear atop the peak
and also in the Expected Size Standard.
Match Score
Appears in the upper right corner of the Sample ILS and corresponds to the degree of pattern match between the
sample’s ILS and the Size Standard selected. Perfect matches receive a score of 100, no correlation receives a
score of 0.
Navigation in the Sample ILS frame is similar to the navigation options in the Main Analysis window. See
Chapter 4 Main Analysis Overview.
Procedure
As mentioned previously, Size Standards are created to assign base pair size information to fragment peaks in a
sample ILS. The other dye color fragment peak positions are then interpolated based on a linear size scale from
the base pair sizes assigned to the peaks in the ILS. ChimerMarker’s Size Template Editor tool allows users to
apply pre-defined commercial Size Standards or create new custom Size Standards based on the dataset ILSs.
Pre-defined Size Standards include:
5C120
ET400-R
ET550-R
ET900-R
GS-100-250
GS-75-300
GS200
GS350
GS400
GS500
GS500_1
HD400
ILS500
ILS600
Liz120
Rox1000
SEQ_600
SNPlex_48plex_v1
Pre-Defined Size Standards
There are two ways to choose a pre-defined Size Standard for the dataset. If the Size Standard name is known,
simply single left-click the Size Standard name in the Size Standard List and click OK in Size Template Editor. The
selected Size Standard will then appear in the Size Standard field of Run Wizard Template Selection box and will be
used to size the data.
Alternatively, if the Size Standard name is not known, follow the Best Match steps below.
1.
2.
3.
4.
5.
In Size Template Editor, select BestMatch → Match All
The Data Processing box appears
ChimerMarker cycles through all Size Standards
Click OK when Data Process is finished
The Size Standard with the best average Match Score across all samples
in the dataset will be highlighted in the Size Standard List and appear in
the Expected Size Standard frame
NOTE: BestMatch will not always choose the correct Size Standard. User
inspection is required.
6. Once the Size Standard is chosen, click OK in the Size Template Editor
7. The selected Size Standard will then appear in the Size Standard field of
Run Wizard Template Selection box and will be used to size the data.
Custom Size Standard Creation
Follow the steps below to create a new Size Standard based on the dataset currently uploaded to ChimerMarker.
1.
In Size Template Editor, select File → New Size Standard OR click the New
Size Standard icon
90
May 2013
Chapter 5 Fragment Sizing Standards
2.
3.
4.
5.
6.
7.
8.
The Input Dialog box appears
Enter a Size Standard name and click OK
The Expected Size Standard frame will be blank
Right-click at a known peak in the Sample ILS frame
Select Insert Size
The Insert Size box appears
Enter the base pair size of the peak in the Size field
and click OK
9. A green triangle will appear atop the peak in the
Sample ILS and a new peak will appear in the
Expected Size Standard frame
10. Continue Insert Size operation for the rest of the
peaks in the Sample ILS
11. ChimerMarker will interpolate Size values after two
peaks are added to the Size Standard
NOTE: It is recommended to use the interpolated Size
values when creating a Size Standard due to the
differential migration patterns of each sample.
12. When the Size Standard is complete, select File →
Save Changes OR click Save Changes icon
13. Click OK in Size Template Editor
14. Proceed with Run Wizard data analysis
Icons and Functions
The following are explanations of menu and icon options in Size Template Editor.
Menu Options
The Size Template Editor contains three menu options – File, BestMatch, and Help. The File menu allows the user to
create, save, and export Size Standards. The BestMatch menu contains options for selecting a Size Standard. The
Help menu shows navigation hints for Size Template Editor.
File Menu
New Size Standard
Opens the Input Dialog box with a field to enter a new Size Standard name. Follow the steps above – Custom
Size Standard Creation.
Delete Current Size Standard
Deletes the Size Standard that is currently highlighted in the Size Standard List
NOTE: This action is irreversible.
Save Changes
Saves edits and changes to the Size Standard in the SoftGenetics ChimerMarker Size Standard directory
Save as New Size Standard
Opens the Input Dialog box with a field to enter a new Size Standard name. The Size Standard is added to
the Size Standard List and saved in the SoftGenetics ChimerMarker Size Standard directory.
Import Size Standard
Opens a Windows Explorer window to the SoftGenetics ChimerMarker Size Standard directory. Use the
Import Size Standard option to find previously exported Size Standard Files (.xml) on local or networked
computers.
Export Size Standard
Exports the currently selected Size Standard in the Size Standard List as an XML file to a specified directory
on a local or network computer.
Import ABI Size Standard
Opens a Windows Explorer window to the same folder the sample files were uploaded from.
Export ABI Size Standard
Exports the currently selected Size Standard in the Size Standard List as an XML file to a specified directory
on a local or network computer.
91
May 2013
Chapter 5 Fragment Sizing Standards
Exit
Closes the Size Standard Editor tool. Be sure to save changes to the Size Standard before exiting.
BestMatch
Match Selected
When selected, the Data Process box appears. Each sample in the dataset is compared to the currently
highlighted Size Standard in the Size Standard List. The green triangle indicators are adjusted to give the
best match possible.
Match All
When selected, the Data Process box appears. All samples in the dataset are compared to each Size Standard.
The Match Scores for each sample are averaged together. The Size Standard with the highest average Match
Score for the dataset is chosen as the Best Match.
Help
The Help menu contains a link to Hot Keys in Size Template Editor. Click Hot Keys and the Size Editor Action
Help box appears.
Toolbar Icons
Size Template Editor
Found in the Run Wizard Template Selection box or in the Tools menu.
Create New Size Standard
Opens the Input Dialog box with a field to enter a new Size Standard name. Allows for the creation of a
new Size Standard.
Save Changes
Saves modifications made to the Size Standard to the SoftGenetics ChimerMarker Size Standard
directory.
Delete
Deletes the Size Standard that is currently highlighted in the Size Standard List.
NOTE: This action is irreversible.
Show Dye
Allows the user to select a single dye color to view in the Sample ILS frame. Cycle through the colors
by left-clicking the icon or use the drop-down menu.
Size Match
Automatically places the green size marker triangles atop the peaks of the sample trace and matches it
with the selected Size Standard.
What to Expect
Once the Size Standard is created, it can be applied to the dataset. Save the edited Size Standard in Size Template
Editor then exit Size Template Editor. If the Size Template Editor was accessed via the Run Wizard Template Selection
box icon then the selected Size Standard will appear in the Size Standard field. If the Size Template Editor was
accessed via the Tools menu then click the Run Process icon in the Main Analysis toolbar. The Run Wizard will
appear. Select the Size Standard from the Size Standard drop-down menu in the Run Wizard Template Selection
box. Proceed through the other Run Wizard boxes and click OK when the Data Process window is complete. The
Size Standard will be applied.
The success of size calling for each sample is indicated by the green, yellow, and red sheet next to the sample
filename in the Sample File Tree of the Main Analysis window. The lane sizing quality is determined by the Match
Score which in turn is a calculation of how closely the sample’s ILS peaks match to the selected Size Standard. If
a sample receives a low Match Score, the sample will be marked with a yellow sheet. If the size calling failed (the
sample’s ILS peaks could not be aligned with the Size Standard selected) then the sample will be marked with a
92
May 2013
Chapter 5 Fragment Sizing Standards
red strike-through. When low score or failed samples occur, select the Size Calibration Charts icon in the main
toolbar to correct the size calling.
Low Match Score and Failed Samples
Size Calibration Charts
The Size Calibration Charts tool is designed to aid the user in determining success or failure of size call after
ChimerMarker’s automatic sizing is performed. Click the Size Calibration Charts icon in the main toolbar of the
Main Analysis window. As mentioned previously, once a Size Standard has been applied to the dataset, Size
Match Score indicators appear next to the filename in the Main Analysis window Sample File Tree. Samples with a
high Match Score are indicated by a green sheet; those with a low Match Score have a yellow sheet. Samples
where size calling failed receive a red strike-through. To analyze how each individual sample was matched to
the Size Standard selected, access the Size Calibration Charts. Within Size Calibration Charts, the user can modify
how each sample was sized and view the statistical information for disabled Size Standard peaks.
Sample List
The Sample List includes filename, Match Score, and disabled peak information for each sample in the dataset.
Sort the list by single left-clicking the column header. The list will re-sort in ascending or descending order
based on the values in the column selected. Single left-click a sample to view its Sample ILS and Calibration Plots
on the right OR use the Up/Down Arrow keys. Right-click the sample row and select Mark as Failed to disable
the sample; select Unmark Failed to reverse the action. Disabled samples will appear “greyed-out” in the Sample
List.
Score
The Score column displays the sample’s Match Score which corresponds to the degree of pattern match between
the sample’s ILS and the Size Standard selected. Perfect matches receive a score of 100; no correlation receives a
score of 0 and the sample is considered to have failed size calling.
Disabled Size Columns
The Sizes that were disabled in the Size Standard (see Size Template Editor section above) will appear as column
headers in the Sample List. If no Sizes were disabled then only the Sample Name and Score columns will appear in
the Sample List. The base pair size position of the disabled peak is reported for each sample. If the disabled peak
is at the beginning or end of the Size Standard, no base pair size position will reported.
93
May 2013
Chapter 5 Fragment Sizing Standards
Size Calibration Charts
Disabled Size Statistics
If Sizes were disabled in the Size Standard (see previous section – Size Template Editor), then the Disabled Size
Statistics table will appear in the bottom left corner of the Size Calibration Charts window. The average base pair
position, the standard deviation, and the difference between the maximum and minimum base pair positions
across all samples are calculated for each ILS peak matched to the disabled peak’s position. No statistics will be
calculated for disabled peaks at the beginning or end of the Size Standard.
Size Standard Trace
The Size Standard Trace displays a synthetic trace of the selected Size Standard. Enabled Sizes are red; disabled
Sizes are grey. Each peak in the Size Standard Trace represents the expected base pair size of peaks in the sample
ILS.
Sample ILS
The Sample ILS displays the currently selected sample’s ILS trace. Single left-click samples in the Sample List to
see additional samples OR use the Up/Down Arrow keys. The green triangle peak indicators appear atop peaks
that correspond to the enabled Sizes in the Size Standard Trace. The base pair size associated with the green
triangle peak indicator is located above the electropherogram. The peaks selected for size calling can be edited
in the Sample ILS frame as described below.
Navigation in the Sample ILS frame is similar to navigation options in the Main Analysis window. See Chapter 4
Main Analysis Overview.
Editing Size Call
Single left-click a green triangle peak indicator to select it. The triangle that is currently selected will be
yellow. To move the green triangle, hold down the CTRL key and left-click and drag it to the desired
position. Right-click the green triangle peak indicator or right-click the top of an unmarked peak to see
additional options.
Delete Peak
Removes the green triangle peak indicator from the Sample ILS and the peak will not be considered in the
Match Score calculation. The Match Score calculation is updated when Update Calibration is selected.
94
May 2013
Chapter 5 Fragment Sizing Standards
Add Peak
Right-click at the peak position and select Add Peak. A green
triangle peak indicator will appear at the cursor position. To move
the green triangle hold down the CTRL key and left-click and drag
it to the desired position. The newly added peak will be included
in the Match Score calculation. The Match Score calculation is
updated when Update Calibration is selected.
NOTE: Add Peak is only available when no other green triangle
peak indicator is selected.
Fix Size
When selected, the Calibration Editor box appears. Enter the correct base pair size of the peak and click OK.
NOTE: Only Sizes that occur in the selected Size Standard can be entered in the Calibration Editor Size field.
The peak will be “fixed” at the specified base pair position and all green
triangle peak indicators to the left and right of the “fixed” peak will be
adjusted to correctly align with the chosen Size Standard.
The Fix Size feature is useful when the selected Size Standard has uniformly
spaced peaks and the sample ILS has additional peaks due to pull-up or other
experimental abnormalities thereby influencing the pattern recognition
algorithm.
NOTE: Fix Size is not active for manually added peaks or peaks outside the Size Standard range.
Reset Peaks
Select Reset Peaks to eliminate manually added peaks and/or extra green triangle peak indicators after Fix
Size.
NOTE: Deleted peaks will not be recalled when Reset Peaks is selected.
Update Calibration
After editing peaks in the Sample ILS, select Update Calibration. The Match Score for the sample will be
recalculated based on the edited peak indicator positions. When Size Calibration Charts is closed, the Size
Match Score indicators next to the filenames in the Sample File Tree in the Main Analysis window will be
updated.
Copy Current Calibration Data
When selected, the frame position and base pair position of the green triangle peak indicators for the
selected sample will be copied to the Windows clipboard and can be pasted into a spreadsheet or word
processing program such as Microsoft Excel or Word.
Calibration Plots
The Calibration Plots chart the migration linearity of the ILS
fragment peaks for each sample. The charts plot the peak base pair
positions on the y-axis as a function of time (raw data frame
numbers) on the x-axis. As the linearity of the line decreases so
does the Match Score for the sample. Incorrectly identified peaks
will result in a low Match Score.
Double-click a Calibration Plot to select the sample in the Sample List
and display the sample in the Sample ILS. The currently selected
sample filename will appear red in the upper left corner of the
Calibration Plot.
Procedure
After a Size Standard has been chosen and the data is processed by the Run Wizard, the Size Calibration Charts
can be used to correct improperly sized samples.
1. Click the Size Calibration Charts icon in the main toolbar
2. The Calibration Charts window appears
3. Select a sample to edit in the Sample List
4. The sample’s ILS appears in the Sample ILS frame
95
May 2013
Chapter 5 Fragment Sizing Standards
5.
6.
7.
8.
9.
Right-click in the Sample ILS frame and chose Add, Delete, or Fix Size to correct size call
Right-click again and select Update Calibration
The changes will be implemented for the sample and the Match Score will be updated
When editing is finished, close Size Calibration Charts
The Size Match Score indicators in the Sample File Tree of the Main Analysis window will be updated
Icons and Functions
Toolbar Icons
Size Calibration
Found in the main toolbar of the Main Analysis window.
View Mode
Change the layout of the Calibration Plots frame. Adjust the maximum number of rows and columns
displayed. Maximum number of rows and columns is 5.
Chart Synchronize
When selected, both the Expected Size Standard and Sample ILS traces become synchronized. This
option is not selected by default.
Preprocess Raw Data
Select Preprocess Raw Data to smooth the samples’ raw data ILS.
Auto Fit Y
Provides the option to automatically fit the Sample ILS’s y-axis by the maximum peak height in the
trace OR by only the highest matched peaks.
Print
Provides Print Preview and Print of size calibration page, providing a physical record of size
calibration for the project.
Save
Allows the user to save the size calibration pages as .png images.
Manual Calibration
Provides the option of manually entering standard peak sizes if many peaks have been modified. This
window contains three columns: Standard Size (fragment sizes of standards used for size calling),
Peak Position (in frames), and Size (sizes are automatically entered, but easily edited).
96
May 2013
Chapter 5 Fragment Sizing Standards
What to Expect
It is important to verify sizing accuracy prior to analyzing a dataset. If a sample is not sized correctly, peaks may
be called Off Ladder (OL) if a panel is applied. Incorrect sizing most dramatically affects larger size fragments.
Before & After Editing Size Call
97
May 2013
Chapter 6 Panel Editor
98
May 2013
Chapter 6 Panel Editor
Chapter 6 Panel Editor
Chapter 6 Panel Editor
Overview
Procedure
Icons and Functions
What to Expect
99
May 2013
Chapter 6 Panel Editor
Overview
The Panel Editor can be accessed from the Tools menu in the Main Analysis window OR via the Panel Editor icon
in the Run Wizard Template Selection box. The purpose of a Panel is to outline the position of expected alleles.
Loci or Markers give a range where a group of alleles is expected to appear and Bins indicate the specific base
pair position of the expected allele. In ChimerMarker, Markers are indicated by a horizontal gray bar across the
top of the electropherogram. Bins are indicated by the dye-colored brackets at the top and bottom of the
electropherogram.
NOTE: Only in the Panel Editor do the vertical gray bars within the electropherogram indicate the center of the
Bin. For all other views in ChimerMarker, the vertical gray bars in the electropherogram indicate the center of
the detected peak.
Panel Editor
Project Panel
The Project Panel list includes the template panel used for the project and all allelic ladder samples that fit the
pattern recognition to the selected template panel. These ladder file names are in bold font in the main analysis
window when Select Best Ladder is used for the Run Wizard. ChimerMarker selects the best fit ladder from this
list as the reference ladder for each sample in the project. The reference ladder for a given sample is listed on the
print report.
Panel Templates
The Panel Template List includes a list of all pre-defined and custom Panels saved
to the Panels folder in the SoftGenetics ChimerMarker directory. Single left-click
on the panel name to display the trace. Single right-click on the Panel name to
displaythe pop-up menu of options. . Double-click the Panel name to expand the
folder and view the Markers associated with the Panel. Single left-click the
Marker name to display that Marker in the Overlay Trace frame.
Additional Options
To see additional options for each Panel, right-click the Panel name and the rightclick menu will appear with the following options.
100
May 2013
Chapter 6 Panel Editor
Edit Panel
Opens the Edit Panel box. Editing the Panel Name field will change how the Panel is labeled in Panel Editor. Set
the Ploidy from Monoploid (1) to Decaploid (10) to Unlimited. If the number of peaks within a Marker exceeds
the Ploidy setting, the additional peaks will be labeled Off Ladder (OL) and given the Undetermined (red)
Quality rank and PL Quality Reasoning. When Unlimited is selected the PL rule is never fired.
Delete Panel
Select Delete (Hot Key = DEL) to delete the Panel from the Panel List and from the SoftGenetics ChimerMarker
directory.
NOTE: This action is irreversible.
Export Panel
Opens the Save As window. Choose a directory folder and click Save. The Panel will be copied to the selected
directory and will also remain in the Panel List and SoftGenetics ChimerMarker Panel directory. The Panel will
be exported as an XML file which can be opened with Internet Explorer, Microsoft Excel, or Notepad.
Reload Panel
Click Reload to undo editing changes to the Panel. The most recently saved Panel will be restored.
NOTE: If the user makes changes to the panel and then answers “NO” to the “The Panel has been changed, save
changes to file?” the changes will remain in the Overlay View until the user chooses Reload Panel or
ChimerMarker program is closed.
Sample List
The Sample List contains all the samples uploaded to ChimerMarker in the current project. Samples with a
checkmark next to the filename will be displayed in the Overlay View. Double-click the sample filename OR
right-click the sample and choose Select/De-Select to enable/disable it in the Overlay View. Right-click any sample
in the list and choose Select All/De-Select All to display all or no sample traces in the Overlay View.
Sorting Options
Sample Name
Sorts the samples in alphanumeric descending order. Sample Name sorting is the default option.
Size Score
Sorts the samples by the lane size score as it appears in the Size Calibration Charts (See Chapter 4 Fragment
Sizing Standards). Samples with higher scores will appear at the top of the list.
Overlay Trace
The Overlay Trace displays all selected samples in the Sample List. The Marker bars appear above the
electropherogram and the Bins appear within the electropherogram as brackets at the top and bottom. The
center of the Bin is indicated by the vertical grey bar in the electropherogram (only in Panel Editor). The Overlay
Trace view can be changed by clicking the Trace Mode icon in the toolbar. Other options include Max & Average
and Gel Image.
Navigation in the Overlay Trace frame is similar to the navigation options in the Main Analysis window. See
Chapter 4 Main Analysis Overview.
Marker Options
Create Marker
Hold down CTRL key and left-click and drag across peaks in the Overlay View. A light-blue hashed box will
appear. Right-click in the hashed box and select Create Marker. The Create Marker box appears. Adjust
parameters and click OK.
Marker Name: Edit the Marker Name field to change how the Marker will be
labeled in the Panel.
Boundary: The base pair range of the Marker is defined by the range of the
light-blue hashed box and is therefore inactive in the Create Marker box. To
edit the Boundary, see Edit Marker below.
Nucleotide Repeat
101
May 2013
Chapter 6 Panel Editor
Auto Detect: Based on the peaks present in the Overlay View, ChimerMarker will attempt to detect the
number of nucleotides in each repeat unit of the alleles and place Bins at the appropriate interval.
Set by Manual: Select this option if the number of nucleotides in the allele repeat unit is known and
ChimerMarker will place Bins at the specified interval.
Auto Binning
Fixed Bin Width: Check this option to enter the number of base pairs on the right and left of the center of the
Bins. If 0.5 is selected as the Bin Width then the total Bin range will be 1.0 base pairs.
Auto Label: When deselected, the Bins are automatically labeled with the base pair size of the Bin position to
the nearest tenth of a base pair. If selected, the base pair size is rounded up to a whole number value.
Edit Marker
Double-click the Marker bar OR right-click the Marker bar and select Edit Marker. The Edit Marker box appears.
Adjust parameters and click OK.
NOTE: The Edit Marker box can also be accessed by right-clicking the Marker name in the Panel List and selecting
Edit.
Marker Parameters
Marker Name: Edit the Marker Name field to change how the
Marker will be labeled in the Panel.
Nucleotide Repeats: Use the Nucleotide Repeats drop-down menu (16) or enter a value into the field to set the number of base pairs
expected between each allele in the Marker.
Boundary: To move a Marker left or right, hold down SHIFT key
and left-click and drag the Marker bar. To adjust the base pair
range over which a Marker is located, hold down SHIFT key and
mouse-over the edge of the Marker bar until a double-headed
arrow appears then left-click and drag the Marker edge to
increase or decrease the range OR right-click the Marker bar and
select Edit Marker. The Edit Marker box appears. Adjust the
Boundary field values as necessary.
Additionally, if a Marker needs only slight adjustment to the right
or left, right-click the Marker bar and select Adjust Marker. The
Marker will move automatically to align with the closest peaks.
Filtering Parameters
Min Homozygote Intensity: Sets the minimum RFU value at which
the software will call a peak if it is the only peak in a marker. The
number of peaks in a marker is determined by the number of peaks above the Min Heterozygote Intensity
level.
Min Heterozygote Intensity: Sets the minimum RFU value at which the software will call peaks if there is
more than one peak in a marker. The number of peaks in a marker is determined by the number of peaks
above this minimum intensity level.
NOTE: If the minimum homozygous and minimum heterozygous vaues are different from each other, a
single peak above the(inconclusive heterozygous) Min Heterozygote Intensity but below Min Homozygote
Intensity will be called and labeled with a Check Quality and LO Quality Reason if a second peak is detected
above the N-x Stutter Filter value. The second peak will not be called however, because it is below the Min
Heterozygote Intensity threshold.
Inconclusive Range: If desired, set an inconclusive range for homozygous and heterozygous peaks. Peaks
within the inconclusive range will be flagged with a Check Quality and IHO (inconclusive homozygous) or
IHE (inconclusive heterozygous) Quality Reason . This setting is helpful for flagging peaks that are above
the minimum detection level but are not high enough to include in statistics (within the stochastic range).
Max Heterozygote Imbalance: Uses the percentage of the highest peak in a marker to define the maximum
peak threshold. For example, if the threshold is set to 60%, the height of all allele peaks must reach at least
60% of the height of the highest peak in that particular locus. If a peak does not reach that height, it is
flagged with a Check Quality and IMB Quality Reason.
Min Heterozygote Imbalance: Uses a percentage of the highest peak in a marker to define the minimum peak
threshold. If a peak does not reach the minimum imbalance threshold, the peak will not be called. This
102
May 2013
Chapter 6 Panel Editor
function is the equivalent to a filter, allowing users to filter out peaks that are less than a given percent of the
highest peak within the marker.
Stutter Filter: Forward and reverse stutter peaks commonly caused by PCR/chemical reactions can be
removed using the Stutter Filter. In human identification analysis, the stutter positions of interest are N-4,
N-8, and N+4, relative to the highest peaks in the marker (given tetra-nucleotide repeat units). The “x”
refers to the number of nucleotide repeats specified in the Marker Parameters – Nucleotide Repeats field. The
settings are in percentage of the primary peak. Peaks in the N-x, N-2x, N+x positions that are below the
stutter threshold will not be called.
NOTE: The stutter filter is meant to eliminate the extra steps of analyzing peaks caused by instrument
anomalies. Set all Stutter Filter settings to “0%” if all peaks must be called.
Apply Filter to All Markers: When selected, the values in the filtering parameters fields will be applied to all
Markers in the Panel. To optimize the stutter filter, set each marker with stutter values determined during
your lab validation procedures.
Edit Marker Bins
Right-click the Marker bar and select Update Alleles.
parameters and click OK.
The Update Marker Alleles box will appear.
Adjust
Nucleotide Repeat
Auto Detect: Based on the peaks present in the Overlay View,
ChimerMarker will attempt to detect the number of nucleotides in each
repeat unit of the alleles and place Bins at the appropriate interval.
Set by Manual: Select this option if the number of nucleotides in the allele
repeat unit is known and ChimerMarker will place Bins at the specified
interval.
Auto Binning
Fixed Bin Width: Check this option to enter the number of base pairs on
the right and left of the center of the Bins. If 0.5 is selected as the Bin
Width then the total Bin range will be 1.0 base pairs.
Auto Label: When deselected, the Bins will be automatically labeled with
the base pair size of the Bin position to the nearest tenth of a base pair. If
selected, the number will be rounded up to a whole number value.
To associate Bins with a different Marker, hold down CTRL key and leftclick and drag across peaks at the edge of a Marker. A light blue hashed box
will appear. Right-click in the hashed box and select Change Marker. The Edit
Group Allele box will appear. Select New Marker and a pre-defined name will
appear. Use this Marker label or create a new name and click OK. The
highlighted Bins are now incorporated into the newly created Marker.
Delete Marker
Right-click the Marker bar and select Delete Marker OR right-click the Marker name in the Panel List and select
Delete (Hot Key = DEL).
Bin Options
Create Bin
To create a Bin position, right-click in the electropherogram at the exact
position to place the new Bin. Select Insert Allele. The Allele Editor box will
appear. Adjust parameters and click OK.
Allele: Enter a name for the Bin. All peaks that appear within the Bin
will display this value in the Allele Label in the Main Analysis window.
Size: Indicates the base pair position of the center of the Bin.
Origin: This is filled in automatically based on donor and recipient
peak information from the analysis. If the original electropherogram is
not available the origin (Donor1, Donor2, Recipient may be selected
for Chimertyping Panels). Nil is used for genotyping panels of single
source data.
103
May 2013
Chapter 6 Panel Editor
Boundary: Indicates the range of the Bin on either side (Left and Right) of the Bin center.
Marker: Select which Marker to associate the Bin with. The Markers to the right and left of the Bin position
will be displayed as well as the option to create a new Marker for the Bin. All Bins must be associated with
a Marker.
Comments: Free-form text field to associate a comment with the Bin.
Control Gene: Select Control Gene if the Bin contains a major peak in the Ladder samples. Bins marked as
Control Gene will display the Allele Label below the Electropherogram trace of the Ladders in the Main
Analysis window. Bins marked “0” will not display an Allele Label even if a peak is present.
Edit Bin
Right-click the vertical grey bar in the center of the Bin in the Overlay Trace. Select Edit Allele and the Allele Editor
box appears. Adjust parameters and click OK. See Create Bin section above for explanation of Allele Editor
options.
To move a bin, hold down SHIFT key and left-click and drag the vertical grey bar in the center of the Bin to the
right or left. Let go of the SHIFT key and mouse button and the Bin will remain in place. To edit the range of a
Bin in the Overlay View, click the Trace Mode icon to view the Gel Image. Hold down SHIFT and mouse over the
vertical white line of the Bin edge. When a double-headed arrow appears, hold down left-click and drag the Bin
edge to adjust the range.
Delete Bin
Right-click the vertical grey bar in the center of the Bin in the Overlay Trace. Select Delete Allele. The Bin will be
deleted from the Panel. To delete multiple Bins, hold down CTRL key and left-click and drag across peaks in the
Overlay View. A light-blue hashed box will appear. Right-click in the hashed box and select Delete Alleles. The
Bins highlighted by the hashed box will be removed from the Panel.
Panel Table
The Panel Table displays Marker and Bin information for the dye color displayed in the Overlay Trace frame. All
columns except Dye and Marker can be edited in the Panel Table. Right-click a highlighted cell and select Set
Value to Column to make all values in the column equal to the value in the highlighted cell.
Dye
Indicates the dye color of the Bin.
Marker
Indicates which Marker the Bin is contained in.
Size
Indicates the position of the Bin center in base pairs.
Left/Right Range
Indicates the range of the Bin on either side of the Bin center.
Allele Name
Peaks that appear within the Left/Right Range of the Bin will be labeled with the Allele Name.
Control
Bins marked with a “1” are considered major alleles in the Ladder
sample and will be marked with an Allele Label and a darkened
rectangle to mark the bin in the Main Analysis window. Bins marked
with a “0” are minor peaks and will not receive an Allele Label, the bin
will be marked with an clear rectangle in the Main Analysis window.
NOTE: The designation of 0 and 1 in the Control column is used to
assist with pattern recognition in the AutoPanel Adjust algorithm.
Distance/kb
104
May 2013
Chapter 6 Panel Editor
Allows the user to input the distance (in kb) that each allele is from the beginning of the sequence. For example,
“38.1” means that the allele is 38.1 kb from the beginning of the sequence.
NOTE: This option is not applicable for forensic STR analysis.
Comments
Free-form text field to associate a comment with the Bin.
Procedure
As mentioned previously, Panels are created to outline the position, in base pairs, of expected peaks. In
ChimerMarker, the Panels associated with several commercially distributed human identiy kits are included.
Examples of some of the pre-defined Panels include Promega’s Powerplex kits and Beckman's Vidiera.
ChimerMarker also offers the opportunity to create a new custom Panel if the pre-defined Panels do not include
a kit that the user is working with. Below is a discussion of how to use the pre-defined Panels or create a new
Panel with ChimerMarker’s Panel Editor tool.
The Panels displayed by default include:
PowerPlex® 16
PowerPlex® S5
PowerPlex® Y
PowerPlex® ES
PowerPlex®ESX16 and 17
PowerPlex®EXI16 and 17
PowerPlex® 1.2
PowerPlex® 16 Monoplex System, Penta D
PowerPlex® 16 Monoplex System, Penta E
PowerPlex® ES Monoplex System, SE33
PowerPlex® EURO
PowerPlex®18D
MentypeChimeraPanel
Pre-Defined Panels
The pre-defined Panels appear in the Panel List. Single-click any Panel in the Panel List to select it. In addition to
the Panels displayed by default, the user has the option to import standard Panels and Bins Text files. Follow
the steps below to import Panels and Bins Text files.
Panels and Bins Files
1.
2.
3.
In Panel Editor, select File → Import ABI Panels from the menu bar.
The Import Panels from GeneMapper box appears.
Click the access button next to the Panel File field. A Windows Explorer
window will appear.
4. Navigate to the location of the Panels.txt file and click Open.
5. Next, click the access button next to the Bins Load from File field and locate
the Bins.txt file.
6. Click Open.
NOTE: Select Bins Auto Build if a Bins.txt file does not exist.
7. Click OK in the Import Panels from GeneMapper box.
8. All Panels in the Panels.txt file will be uploaded into ChimerMarker.
9. Select a newly uploaded Panel from the Panel List.
10. Edit the Markers and Bins so that they align with the peaks in the dataset.
11. Save the edited Panel and close Panel Editor.
12. Click the Run Project icon in the Main Analysis window.
13. Select the Panel from the Panel field in the Run Wizard Template Selection box.
14. Proceed through Run Wizard and data analysis. See Chapter 3 General Procedure and Chapter 4 Main
Analysis Overview.
Custom Panel Creation
Follow the steps below to create a new Panel based on the dataset currently uploaded to ChimerMarker.
Automatic Panel Creation
2.
3.
4.
In Panel Editor, select File → Create New Panel from the menu bar or click the Create New Panel icon.
The Create New Panel box appears.
Enter a name for the Panel in the Name field. This will be the
Panel name that is displayed in the Panel List.
105
May 2013
Chapter 6 Panel Editor
5.
The Type will, by default, display the Analysis Type chosen initially in Run Wizard Template Selection. The
only option in ChimerMarker is ChimerismType.
6. Select Automatically Create
a. Use All Samples will create a Panel based on an overlay of all the sample peaks in the dataset
b. Use Selected Samples will create a Panel based only on the samples selected in the Panel Editor Sample
List
7. Select User Donor/Recpient to use the donor and recipient allele
calls to make a Chimertyping Panel.
8. If required, check the Fixed Bin Width option and enter a value for
the left and right Bin ranges
9. Select Customize Marker Parameters to input specific parameters for
the new panel. Select this option to keep stutter specific values for
each marker.
10. When finished, click OK
11. The new Panel will be created and added to the Panel List
NOTE: New Panels are created based on the Max & Average View Mode.
More intense peaks are given higher priority for Bin placement when
peaks do not overlap perfectly.
12. Edit the Markers and Bins as described in the previous section –
Panel Editor Overview.
13. Follow steps 10-14 above.
Manual Panel Creation
1.
2.
3.
4.
5.
6.
7.
In Panel Editor, select File → Create New Panel from the menu bar or
click the Create New Panel icon.
Enter a Panel name in the Name field
Choose the appropriate Analysis Type from the Type drop-down menu
Select Manually Create
When finished, click OK
The Panel name will appear in the Panel List; however, no Markers or Bins will be associated with the Panel
Follow the steps in the previous section – Panel Editor Overview – to create Markers and Bins
Create a Marker in Panel Editor
106
May 2013
Chapter 6 Panel Editor
Adjusting Panels
It is common for panel alignment to be shifted due to variations in
genetic analyzers or run conditions (such as temperature, injection
time). Markers or bins can be manually aligned to the allele ladder
using the shift and mouse key.
Align all of the bins within a marker
1. Hold down the shift key
2. At the same time place the mouse over the gray marker name bar at the top of the electropherogram
3. The marker rectangle will be outlined in red and the panel name will be in red font when the adjust
feature is active
4. Drag the marker to align the bins with the peaks of the
allelic ladder
5. Save the panel with signal information (the turquoise
save icon) to enable the major panel adjust feature to
work in future projects
Align an individual bin
1.
2.
3.
4.
5.
Select the gray vertical bar of the bin with
the mouse – the bar will turn blue
Hold down the shift key and click on the
gray, vertical bar for the bin
The vertical bar will be outlined in red and
the panel name will be in red font
Use the mouse to drag the gray vertical bar
to the center of the peak
Save the aligned panel with signal
information
Genotyping and Chimertyping Panels
ChimerMarker includes two types of panel files: Genotyping and Chimertyping. As described above,
genotyping panels contain all loci and alleles which may be amplified by a given human identification chemistry
(such asPowerPlex16 or PowerPlex ESI/ESX). Chimertyping panels contain only the alleles of the donor(s) and
recipient. If the selection is made to automatically construct a chimertyping panel in the second screen of the run
wizard, the program will use the allele calls of the pre-transplant samples to construct the chimertyping panel
107
May 2013
Chapter 6 Panel Editor
for the patient. If preferred, these panels are easily constructed in the panel editor after the genotyping panel has
been applied to the project.
File Create Panel
Select User Donor/Recipient Select OK to automatically
create a case specific chimertyping panel. If a naming
convention was not used to designate donor and recipient
files the designation may be made here by the user. Right
click on the file name and set as the appropriate file type.
This automatically creates a chimertyping panel with the
alleles found in all of the participants of the study (donors
and recipients). When used in the chimerism analysis (please see Chapter 7, Chimerism Analysis), the panel calls
only those peaks that are consistent with the donor(s) and recipient alleles. In addition to the columns discussed
above for the genotyping panel table, chimertyping panels have an Origin column. This documents the
individual(s) that were the sources of these allele calls and is used to label the peaks in the electropherograms of
mixture (post-bmt) samples in chimerism projects (please see Chapter 7 Chimerism Analysis).
Editing a Chimertyping Panel
It is very likely that some of the peaks will be minor peaks (only as small percentage of the RFU (height) of the
major peaks. To ensure these minor peaks are not missed it is essential to set the minimum percentage to be
accepted as a peak during the analysis. After the chimertyping panel is created:
108
May 2013
Chapter 6 Panel Editor
1.
2.
3.
4.
Right mouse click on one of the Marker (Loci) label above the electropherogram and select Edit Marker
Enter the appropriate value into the Min. Heterozygous Imbalance box
Select the Apply to all Markers to set this heterozygous imbalance to the same level in each marker or if
your lab has determined that certain loci have different ranges, type in the appropriate value for each
locus.
Save the panel with a name that will indicate the study/case number and chimertyping
Typical Human Identification Genotyping panels use a 20% minimum
heterozygous imbalance filter. If minimum heterozygous imbalance is set to
20%, minor peaks must be at least 20% of the height of the major peak at
that locus. For chimerism detection and monitoring it is necessary to detect
minor peaks early on in studies. Set the Min. Heterozygous filter to the
appropriate level for your study. In this example, the filter is set to 5% -- any
peak that is 5% or more of the height of the tallest peak at the locus will be
called. Peaks that are less than 5% of the taller peak height will not be
called. To ensure that all peaks outside the stutter position are called, set the
minimum heterozygous imbalance to 1.
Options, Functions and Icons
The following are explanations of menu and icon options in Panel Editor.
Menu Options
The Panel Editor contains three menu options – File, Tools, and Help. The File menu allows the user to create, save,
and export Panels. The Tools menu contains options for datasets with allelic ladder samples and exporting a
Panel. The Help menu contains navigation hints for Panel Editor.
File Menu
Create New Panel
Launches the Create New Panel dialog box with the options to create a new Panel Automatically or Manually
Delete Current Panel/Marker
Deletes the Panel or Marker that is currently highlighted in the Panel List
Save Changes
Saves edits and changes to the Panel in the SoftGenetics ChimerMarker Panel directory (Hot Key = CTRL+S)
Save as New Panel
Opens the Input Dialog box with a field to enter a new Panel name. The Panel is added to the Panel List and
saved in the SoftGenetics ChimerMarker Panel directory.
Import Panels
Opens a Windows Explorer window to the same folder the sample files were uploaded from. Use the Import
Panels option to find previously exported Panel Files (.xml) on local or networked computers.
Import Pre-Defined Panels
Opens the SoftGenetics ChimerMarker MLPA Panel folder. Use this option to find additional MRC Holland
MLPA Panels.
Import ABI Panels
Launches the Import Panels from GeneMapper box. Opens Panels and Bins Text files and converts them to single
Panel files in XML format for use in ChimerMarker.
109
May 2013
Chapter 6 Panel Editor
Export Panel
Exports the currently selected Panel in the Panel List as an XML file to a specified directory on a local or network
computer.
Exit
Closes the Panel Editor tool. Be sure to save changes to the Panel before exiting.
Tools Menu
Match Ladder
Opens the Select Ladder box. Choose an allelic ladder sample from the drop-down menu. Click OK and the
Panel will adjust slightly to align with the peaks in the selected ladder sample.
NOTE: Large differences between peak and Bin position cannot be resolved with the Match Ladder function.
Virtual Panel
Select a Panel from the Panel List and click Virtual Panel in the Tools menu. The Create Virtual Panel process box
will appear. Click OK and a new Panel will be added to the Panel List labeled VPanel_PanelName. This newly
created Panel is an adjusted version of the original panel selected in the Panel List. ChimerMarker attempts to
align the original Panel to the Ladder sample peaks based on an average calculation.
NOTE: It is recommended to use Virtual Panel only when small adjustments to the Marker and Bin placement
are required. Use Major Panel Adjustment icon for larger adjustments.
Export the Project Panel
Exports the currently selected Panel in the Panel List as an XML file to a
specified directory on a local or network computer.
Help Menu
The Help menu contains a link to Hot Keys in Panel Editor. Click Hot Keys and the
Panel Editor Action Help box appears.
Toolbar Icons
Panel Editor
Found in the Run Wizard Template Selection box OR the Tools menu.
Create New Panel
Opens the Create New Panel box. Follow the steps in the Create a Custom Panel section above.
Save Changes
Permanently saves Panel edits to the currently opened Panel file which is located in the SoftGenetics
ChimerMarker Panel directory.
Save Changes with Signal Info
Permanently saves all Panel edits, including height information which is used with the Major Panel
Adjustment feature.
NOTE: A Panel must be correctly aligned with peaks in the dataset before selecting Save Changes with Signal
Info in order for the AutoPanel Adjust in the RunWizard and the Major Panel Adjustment features to work
correctly.
Delete Current Panel/Marker
Deletes whichever Panel or Marker is currently highlighted in the Panel List. This action is irreversible.
Show Dye
Allows the user to select a single dye color to view in the Overlay View. Cycle through the colors by
left-clicking on the icon.
Trace Mode
Single left-click to cycle through the options or use the drop-down menu.
Trace Overlay displays all traces of the selected samples in the Samples List one dye color at a time.
Single click any trace in the Trace Overlay frame and the trace will become bold and the associated
110
May 2013
Chapter 6 Panel Editor
sample will be highlighted in the Sample List.
Max & Average displays two traces in the electropherogram. The darker color line corresponds to
the maximum peak height at that position and the lighter color line corresponds to the average of
all selected sample traces at that position.
Gel Image displays selected samples as a synthetic gel image. Bin ranges in the Gel Image mode
appear as white vertical lines and can be manipulated by holding down SHIFT and dragging the
white lines left or right.
Check Range in Edit When activated, the software will warn the user if they set the left or right range of an
allele to overlap with another allele. This feature will prevent the user from setting allele boundaries too
close to neighboring alleles. This option is selected by default.
Major Adjustment of Panel Uses previously defined size and height information located in the Panel file
when the panel was previously saved with signal information, to identify Marker and Bin positions. To
be used when a Panel must be adjusted by 1 - 5 base pairs in order to align with the dataset peaks. Best
used for panels with evenly spaced alleles.
Minor Adjustment of Panel Aligns the center of the Bin to the center of the nearest peak (within one
base pair of the Bin). NOTE: use adjust icons only if there are no variant allele bins in the panel.
Saving a panel with signal information
For optimal automatic panel adjustment, a panel
should be adjusted manually the first time and
then saved with signal information from several
ladder samples from the same genetic analyzer and
used for analysis of any samples from that
analyzer. To manually adjust alignment hold down
the shift key and use the mouse to shift all of the
bins for a marker with the entire gray horizontal
bar containing the marker name; or to shift
individual bins hold down the shift and use the
mouse to move the vertical bar into place. This
signal information is used to adjust to any normal
variation of different runs from the analyzer.
For example, if the laboratory routinely uses two
3130 genetic analyzers (3130_1 and 3130_2) there would be a panel saved with ladder signal from each genetic analyzer.
Saving the panel with signal information from the ladders provides the program with the information needed to
automatically adjust the panel with subsequent data. A common occurrence is a difference due to run time variation,
causing a shift in the peaks of 1-5 base pairs. The major panel adjustment icon can be used to automatically align the
panel to the current ladders.
Project Panel
Once a panel has been aligned and saved with ladder signal information
it can be set as the project panel. This panel has signal information and is
used to automatically adjust to multiple ladder files in a project. Right
click on the panel name in the list of panels and select Set As Project
Panel. The panel name will be displayed at the top of the panel list
111
May 2013
Chapter 6 Panel Editor
under the heading Project Panel. Exit from the panel editor and the project panel will be applied to the project.
What to Expect
Once a Panel has been created, aligned and saved with signal information, it can be applied to the dataset. Save
the edited Template Panel with signal information in Panel Editor then exit the Panel Editor. If the Panel Editor
was accessed via the Run Wizard Template Selection box icon, then the selected Panel will appear in the Panel
field. If the Panel Editor was accessed via the Tools menu, then click the Run Process icon in the Main Analysis
toolbar. The Run Wizard will appear. Select the Panel from the Panel drop-down menu in the Run Wizard
Template Selection box. Proceed through the other Run Wizard boxes and click OK when the Data Process
window is complete. The Panel will be applied.
The summary bar at the bottom of the main analysis screen displays information about the results. Ladder errors
may be flagged with a yellow vertical bar and green allele label to alert the analyst if a non-control, minor peak is
higher than expected (figure 1). If any peaks are not in the expected bin they are flagged with red allele labels
and red vertical bars (figure 2). The analyst can return to the panel editor to determine if there were problems
with the capillary for that particular ladder (figure 3).
Figure 1 Yellow and green flagging alerts the analyst that although the panel is
aligned with the ladder bins, some of the minor peaks in this ladder have a higher
RFU than expected.
112
May 2013
Chapter 6 Panel Editor
Figure 2 One of the ladder samples in this run has peaks that are out of the bins.
These out of bin peaks are flagged with red allele label and red vertical bars
Figure 3 The trace overlay view in the panel editor shows the automatic adjustment of the
panels to the ladder samples, illustrating that the ladder file in error is an outlier. The
analyst may elect to disable this ladder sample in the main analysis window.
113
May 2013
Chapter 6 Panel Editor
After the Panel is applied to the dataset, the Markers and Bins appear in the Electropherogram and Report Table. In
the Electropherogram, the Markers are horizontal grey bars, the Bins appear as dye-colored brackets above and
below the trace, and the center of the peaks are marked with a vertical grey bar. Peaks that fall outside of the
Markers are marked Off Ladder (OL). Peaks that fall within the marker but outside of a bin are marked OB.
The allele ladder that best matches a sample file is used by the Auto Select Best Ladder in the Run Wizard. The
file name of the ladder used for a sample is displayed in the allele report. See Chapter 7 Reports and Printing.
114
May 2013
Chapter 7 Reports and Printing
Chapter 7 Reports and Printing
Chapter 7 Reports and Printing
Report Table
Print Report
Save Project
115
May 2013
Chapter 7 Reports and Printing
Report Table
The general features of the Report Table were outlined in Chapter 4 Main Analysis Overview. Here we will
discuss and give examples of each Report Style available in the Report Table.
Allele List
The Allele List Report Style displays the base pair size (or Allele Label, if a Panel is applied) of the called peaks.
The sample names are listed in rows in the far left column and peaks are numbered in columns at the top of the
table.
Features
Report sample by Sample Name or File Name
Show Only Uncertain Alleles
When selected, displays only the peaks with Quality ranks of Check (yellow)
and Undetermined (red).
Show Rejected Low Score Alleles
When selected, the peaks with peak scores below the Run Wizard Additional
Settings Allele Evaluation Peak Score Reject setting will be displayed in the
table.
Hide Extra Sample Names
When data is displayed in Vertical Orientation, the sample names are
repeated for each row of data that the sample is associated with. If Hide
Extra Sample Names is selected, then the sample name will only appear
once in the first of the rows it is associated with.
Features
Options
Extend Diploid Homozygous: Repeats the same Allele Label in the second allele position of the marker when only
one peak is detected in the marker. Only active when the Edit Panel Ploidy option is set to 2-Diploid.
Show Allele Name/Size (0.1bp)/Height/Area: Allele Name is displayed in the Report Table by default regardless of
table Orientation. Select to display Size, Height, and/or Area of the peak
all within the same cell. Parentheses separate the peak statistics from the
Allele Name. Only enabled when Vertical Orientation is selected.
Orientation
Horizontal: Sample names appear on the left in rows and Markers appear
at the top in columns.
Vertical: Sample names appear in the far left column in rows with
Markers listed in the second column. Alleles in order of base pair size
appear at the top in columns.
Show _____ when no allele call: Allows user to specify a symbol or short word to
enter in the cell of the allele report when there is no peak (no amplicon) at that
marker. If not selected these cells will be empty in the allele report.
Show Only Uncertain Alleles: When selected, displays only the peaks with Quality ranks of Check (yellow) and
Undetermined (red).
Show Rejected Low Score Alleles: When selected, the peaks with peak scores below the Run Wizard Additional
Settings Allele Evaluation Peak Score Reject setting will be displayed in the table.
Hide Extra Sample Names: When data is displayed in Vertical Orientation, the sample names are repeated for each
row of data that the sample is associated with. If Hide Extra Sample Names is selected, then the sample name will
only appear once in the first of the rows it is associated with.
116
May 2013
Chapter 7 Reports and Printing
Bin Table
If a peak is detected in at least one sample, the Bin Table Report Style will report the presence or absence of a peak
at that position for the rest of the samples in the dataset.
Features
Options
Abide By Panel: When selected, the table will show only called
alleles within Panel Marker ranges. This option is only active when
a Panel is applied to the data.
Show Type Symbol: Enter values to indicate the presence of a peak at
the position (Positive), the absence of a peak at the position
(Negative), and a Check or Undetermined Quality rank at the
position (Suspected).
Show Intensity (Raw): Displays the peak intensity (RFU) value for all
Positive and Suspected peak positions. A “0” value is given to
Negative positions. Selecting Raw will show the peak intensity
values for all positions including Negative positions.
Show Peak Area: Displays the peak area value for all Positive and
Suspected peak positions. Dollar signs “$” separate values if more than one display option is selected.
Orientation
Horizontal: Sample names appear on the left in
rows and Markers appear at the top in columns.
Vertical: Sample names appear in the far left
column in rows. Markers and Alleles, in order of
base pair size, appear at the top in columns.
Show Only Uncertain Alleles:
When selected,
displays only the peaks with Quality ranks of
Check (yellow) and Undetermined (red).
Show Rejected Low Score Alleles: When selected, the
peaks with peak scores below the Run Wizard
Additional Settings Allele Evaluation Peak Score
Reject setting will be displayed in the table.
Hide Extra Sample Names: When data is displayed
in Vertical Orientation, the sample names are
repeated for each row of data that the sample is
associated with. If Hide Extra Sample Names is
selected, then the sample name will only appear
once in the first of the rows it is associated with.
117
May 2013
Chapter 7 Reports and Printing
Additional Functions
Allele Editing Options
The Bin Table Report Style offers additional options when a cell in the table is right-clicked.
Insert a Peak at this Bin Site
To indicate the presence of a peak at a position when it has been labeled with a Negative Type Symbol, rightclick the cell and select Insert a Peak at this Bin Site. The Negative Type Symbol will change to a Positive or
Suspected Type Symbol depending on the Quality rank of the peak. (Hot Key = INS)
Delete
To indicate the absence of a peak at a position that has been labeled with a Positive or Suspect Type Symbol,
right-click the peak cell and select Delete. The Type Symbol will change to Negative. (Hot Key = DEL)
Confirm
To indicate the peak present at the position is truly a peak, right-click the peak cell and select Confirm Peaks.
Only peaks centered within a Panel Bin will change from Suspect Type Symbol to Positive Type Symbol when
confirmed. Once a peak is confirmed, it cannot be unconfirmed, only deleted. (Hot Key = CTRL+M)
Delete Bin Columns
To completely eliminate an entire column in the Report Table, left-click any cell within the column then rightclick the cell and select Delete Bin Columns. When Vertical Orientation is selected, the Report Table rows which
contain the Bin information will be deleted (not the columns which contain the sample information).
Binning Options
To adjust which Bins are displayed and to merge Bins in the Report Table, click the Bin icon in the toolbar of the
Report Table. The Report Bin Columns box will appear.
Display Bins
By default, all Bins will be selected with a checkmark at the
beginning of the row. Individually deselect Bins for exclusion from
the Report Table by single left-clicking the checkmark box. To
deselect all, right-click any cell in the Report Bin Columns box and
select Uncheck All. To deselect only a few Bins, left-click a cell to
highlight the row then hold CTRL or SHIFT key and select
additional rows. Next, right-click and select Check or Uncheck to
include or exclude the Bins, respectively. Click OK in the Report
Bin Columns box when finished and only the Bins with checkmarks
will be displayed in the Report Table.
Merge Bins
To make two or more Bins become one Bin, single left-click a row to highlight it. Next, hold down SHIFT
key to select additional rows. Right-click the highlighted rows and select Merge Bins. (Hot Key = CTRL+M)
Click OK in the Report Bin Columns box when finished, and the selected Bins will be averaged together.
Only Bins immediately adjacent to one another may be selected for merging. Only the height and area for
the first peak in the new merged Bin will be reported.
Peak Table
The Peak Table Report Style displays user-defined peak statistics. Sample
names are displayed in the far left column in rows and the Marker
names are in the column adjacent to the sample names. In columns at
the top of the table are the selected peak statistic information labels.
The column options available in the Peak Table Report Style are similar to
the options available in the Peak Table that appears below the
Electropherograms. See Chapter 4 Main Analysis Overview for column
option definitions.
Features
Options
Size Range (bps): When selected, allows the user to define a specific
118
May 2013
Chapter 7 Reports and Printing
base pair range. Only the peaks within the range will be displayed within the Report Table.
Abide By Panel: When selected, the table will show only called alleles within Panel Marker ranges. This option is
only active when a Panel is applied to the data.
Grouped by Markers: When selected, alleles within the Marker will be listed one after the other in the columns at
the top of the table. When de-selected, each allele will be represented by a row so that the Marker name may be
listed several times according to the number of alleles in the Marker. This option is only active when a Panel is
applied to the data.
Columns
Click the Columns button to open the Set Peak Table Columns box. All column options are listed in the All
Columns field on the left. The columns currently being displayed in the Report Table are listed in the Selected
Columns field on the right.
Selecting Columns
Single left-click options in the All Columns field and click the Add button
to add the column option to the Selected Columns field. Hold down CTRL
or SHIFT key to select multiple options then click Add. Click the Add
All button to move all the options in the All Columns field to the Selected
Columns field.
De-selecting Columns
Single left-click options in the Selected Columns field and click Remove to
move the column option to the All Columns field. Hold down CTRL or
SHIFT key to select multiple options then click Remove. Click the
Remove All button to move all the options in the Selected Columns field to
the All Columns field.
Click OK in the Set Peak Table Columns box and the Allele Report Settings box when finished. The options in the
Selected Column field will be displayed along the top of the table in columns.
Show Only Uncertain Alleles: When selected, displays
only the peaks with Quality ranks of Check (yellow)
and Undetermined (red).
Show Rejected Low Score Alleles: When selected, the
peaks with peak scores below the Run Wizard
Additional Settings Allele Evaluation Peak Score Reject
setting will be displayed in the table.
Hide Extra Sample Names: When data is displayed in
Vertical Orientation, the sample names are repeated for
each row of data that the sample is associated with. If
Hide Extra Sample Names is selected, then the sample
name will only appear once in the first of the rows it is
associated with.
Allele Count
The Allele Count Report Style displays the number of alleles present in
the Panel Marker. Sample names are listed in rows in the left column
and Markers are listed along the top row in columns. A Total Number
column lists the number of peaks detected in the sample.
NOTE: Allele Count requires that a Panel is applied to the data. See
Chapter 6 Panel Editor.
Features
Orientation
Horizontal: Sample names appear on the left in rows and Markers
appear at the top in columns.
119
May 2013
Chapter 7 Reports and Printing
Vertical: Markers appear on the left in rows and
sample names appear at the top in columns.
Show Rejected Low Score Alleles: When selected, the
peaks with peak scores below the Run Wizard
Additional Settings Allele Evaluation Peak Score Reject
setting will be displayed in the table.
Hide Extra Sample Names: This feature is not active for
Allele Count Report Style.
Print Report
The ChimerMarker Print Report displays Electropherogram and/or Peak Table information for all or selected
samples in a dataset. To access the Print Report, go to Project → Print Report OR click the Print Report icon in the
Main Analysis window. The Print Report options box will appear. Select desired settings and click Preview to
view the Print Report before printing or click OK to begin printing without previewing the report. The reference
ladder (best match) used for each sample is listed on the allele report.
NOTE: The View → Preference → Display Settings options will affect how the Print Report is displayed.
ChimerMarker Print Report
120
May 2013
Chapter 7 Reports and Printing
Report Content Options
The basic printing options allow the user to choose the Print Type, Samples to print, Dyes to include, and Content
options. Each electropherogram will be automatically labeled with its respective sample file name in the printed
report. The Advanced button provides more options.
Print Type
Normal: All Print Report options are available when Normal Print Type is
selected.
Chart Overlay: Prints only the Electropherogram with the report.
Samples
All Samples: Prints all the samples in the project.
Selected Samples: Prints only those sample files that have been selected in the
Main Analysis window Sample File Tree.
Contents
Electropherogram: Prints the peak trace for each dye color and sample selected.
NOTE: The zoom setting of the Electropherogram in the Main Analysis window will be represented in the Print
Report. Zoom out fully to include all peaks in the Print Report.
Peak Table: Prints the Peak Table for each dye color below the dye color’s electropherogram trace.
NOTE: If neither Electropherogram nor Peak Table were selected, the Print Report will contain a list of each dye
color selected for each sample selected and the allele count within each dye color.
Dyes
Dye 1-4: Click the checkbox to include the dye color in the Print Report.
Mix Dyes: Prints all selected dye colors on one electropherogram.
Advanced Options
Print Project Comments: Includes the Project Comments at the top of the Print
Report. Select Each Page option to display the Project Comments on each page in
the report.
Label Dyes & Peak Numbers: Labels dye color with number of peaks for each
electropherogram.
Implement Y Axis Settings: Prints the report using the Y-axis settings the user
selected in the Main Analysis window Set Axis icon.
Chart Height (mm): Specify the size of the printed electropherograms (Minimum
= 10mm, maximum = 100mm).
Print Markers: The Marker label bars appear above the electropherogram.
Print Alleles: The Allele Labels appear below the electropherogram.
Abide by Panel: Prints only alleles within a Panel. Alleles that are outside the Panel are not included in the
printed report.
New Page for Each Sample: Prints a new page for each sample instead of continuing on the same page as the
previous sample.
Auto Scale Markers When selected, the RFU intensities of low peaks are adjusted to match the intensity of the
highest peak in the dye color. When low peaks are increased, the intensity magnification factor is noted in the
Marker (2X – 8X).
Grouped by Dye: Organizes the electropherograms in the Print Report such that samples are listed in order of dye
color selected i.e. all samples in blue first, then all samples in green, etc.
Mark Deleted/Edited Peaks: Prints an x above a deleted peak and an E above an edited peak in the
electropherogram.
Label Peak Ratio: Select this option to print the peak ratios on the electropherogram of the print report.
Chart Height: Use this feature to customize the size of the electropherogram in the print report.
121
May 2013
Chapter 7 Reports and Printing
Icons and Functions
The following icons are available in the Print Preview window prior to printing the Print Report.
Print
Opens the Print options box. Select a printer, the print range and
the number of copies.
Export to File
Opens the Export Report to Files box. Save each page of the Print
Report as an individual image file JPEG or PNG. Select the directory to export
the files to.
Named by sample name saves each PNG or
JPEG under the sample name.
Start by Page Number combines the page number and the sample name for the
saved file name.
Named by page number saves each file by the page number within the report.
Page Setup
Opens the Page Setup box. Choose the paper size, margins and
orientation (Portrait or Landscape).
Content Options
Opens the Print Report options box. See the section above - Report Content Options.
Zoom to Fit
Zooms out to view the entire Print Preview page.
Zoom to Width
Zooms in to view the Print Preview page at maximum width without losing information off the screen.
Zoom Ratio
Enter percentage numbers to increase or decrease the zoom aspect of the Print Preview page.
Save Project
After a dataset is analyzed and edited, the project can be saved as a SoftGenetics
ChimerMarker Project (SGF). Project files contain the raw, unprocessed data files, the
sample files after processing, the process parameters, and all edits. The project file does
not contain any custom or modified Panels or Size Standards. To export a custom Panel,
see Chapter 6 Panel Editor. To export a custom Size Standard, see Chapter 5 Fragment
Sizing Standards.
NOTE: Previous versions of ChimerMarker saved projects in SFP format. This format
can be opened with current ChimerMarker versions.
To save a project, go to File → Save Project in the Main Analysis window. The Save Project
box will open. Select a directory and enter a project name. Click Save.
To re-open the project, go to File → Open Project in the Main Analysis window. The last
folder accessed by ChimerMarker will appear. Navigate to the directory containing the
SGF (or SFP) file and click Open. Additionally, the last four projects that were opened
by ChimerMarker appear when the File → Reopen Project fly-out menu is selected. Click
a project from the fly-out menu and it will be uploaded to ChimerMarker.
122
May 2013
Chapter 8 MCC Analysis
Chapter 8 Maternal Cell Contamination Analysis
Chapter 8 MCC Analysis
Overview
Procedure
Icons and Functions
Save and Export Results
123
May 2013
Chapter 8 MCC Analysis
Maternal Cell Contamination (MCC) Analysis
Overview
Please follow steps from Chapter 3 for importing of raw sample data. The initial step for Maternal Cell
Contamination analysis is genotyping of all samples imported into ChimerMarker. After reviewing and
confirming all allele calls, the MCC Analysis tool can be accessed under Application tab in the main menu toolbar.
Procedure
Genotyping of all sample data:
Follow the steps for importing and processing data from Chapter 2, General Procedure. Review the results in the
main analysis window.
After reviewing the results and making any desired edits (Chapter 3, Main Analysis), go to View-> Preference->
Chimerism tab to specify identifiers for maternal and fetus sample.
Maternal Cell Contamination Analysis:
After genotyping and specifying the identifiers for the maternal and
fetus samples, go to Application-> MCC analysis.
Auto Identify button will automatically group fetus sample and
maternal sample using identifiers specified in
View ->Preference->Chimerism Tab.
Load Txt button can group samples by using a text file created from
Excel (tab delimited txt file) or other word editing programs. Refer to
page 123 for more information.
Grouping button brings up a dialog window that is used to group
maternal and fetus samples into different groups or patients.
124
May 2013
Chapter 8 MCC Analysis
Quantification Type:
1) Area: uses area of allele for %MCC calculations
2) Height: uses height of allele for %MCC calculations
Analysis Threshold:
Set desired threshold for analysis.
Ignore Status:
If selected, any maternal allele detected in the stutter position of
fetus sample will be ignored.
Sex marker:
Specify marker name that is used for sex identification.
Grouping Options: Match by Section,
Fixed Position or Order
Match by Section:
Group Identification: specify which column to group each set of
samples/individual patients.
Control identification: specify which column the identifiers
specified in the View->Preference->Chimerism tab can be found.
Control: specify identifiers to set as control (usually maternal
sample).
Match: group samples and control according to selected method.
Load File: Load grouping file from text.
Match by Fixed Position:
Group Identification: specify characters location to group each
set of samples/individual patients.
Control Identification: specify characters location that the
identifiers specified in the View->Preference->Chimerism tab can
be found.
Match by Order:
Group Size: select the number of samples to group by order.
125
May 2013
Chapter 8 MCC Analysis
Grouping by Text File Rules:
1) Sample name in text file must be identical to sample name loaded in project.
2) Each Row correspond to an individual group/patient
3) First column is recognized as maternal sample
4) Each sample name within a row is separated by a "tab"
* If using Excel to create group information, the file must be save as a tab delimited text file. The
following illustration shows an example of grouping information created in Excel and Notepad.
Excel Example:
*After creating the file, go to File-> select "Save As"->" Save as type"-> select Text (Tab delimited) (*.txt)
Text File Example:
126
May 2013
Chapter 8 MCC Analysis
Results
The automated MCC calculations are displayed in the center table. To view the results for a given file, click on
the file name in the list at the left. Any markers that are ignored are highlighted in red in the electropherogram.
Tools and Icons
Analysis Setting-Reopens MCC Analysis settings dialog box.
Set Multi Sample View- Select multiple samples to view
electropherograms.
Profile Comparison View- to view selected traces and level of 2D
or 3D offset
MCC Analysis Comments- to record any case notes to be saved
and printed with the final report (saves up to 6400 characters).
127
May 2013
Chapter 8 MCC Analysis
Examples Screens of Tool Selections
Multi Sample View to display electropherograms of several samples
Profile Comparison View with 2D and 3D Options
MCC Analysis Comments saved with project and displayed in comprehensive report
128
May 2013
Chapter 8 MCC Analysis
Save the report table in .xls or .txt file format
Show or Hide – toggle this icon to show or hide the electropherograms
Analysis Parameter icon to relaunch the Chimerism Analysis Settings Box
Multiple Sample view – alternative path to display electropherograms of multiple samples
Profile Comparison – alternative path to display profile comparison view
Column Headings – select any or all available column headings for the report table
Printing Options – Preview – to review comprehensive research report or print directly from
Chimerism Analysis screen
129
May 2013
Chapter 8 MCC Analysis
Comprehensive Reports
First page of report includes header, electropherograms (traces) and report table.
The report header uses information from user management, signature box, and the analysis settings to specify
the technician, project, time, date, and parameters for electronic record keeping. The electropherograms (traces)
show each dye-color separately with labels for M (maternal) and F (Fetus). Results displayed include quality
control metrics: coefficient of variation, standard deviation, % MCC, and the total average %MCC. NI
represents uninformative loci (all peaks are shared) and are not included in the chimerism calculations or
indicates parameters could not be calculated based on data. ChimerMarker software also contains the
functionality to allow the analyst to manually exclude loci from calculations if needed.
The second page also includes the header, signature box, and the results table that was displayed in the
MCC analysis results window.
130
May 2013
Chapter 9 – Additional Tools
Chapter 9 Additional Tools
Chapter 9 Additional Tools
Automated Control Concordance
Filename Group Editor
Output Trace Data
Convert TXT to Binary
Export Electropherogram
131
May 2013
Chapter 9 – Additional Tools
Automated Control Concordance
Positive Control Template Editor
1.
2.
3.
4.
Tools Positive Control Template Editor to
launch dialog box
Import Genotypes from samples using
dropdown menu
Select from functions to Add new positive
control samples, Edit or Delete files
Select the appropriate positive control file from the dropdown menu in the run wizard. Summary
message is located at the bottom of the main analysis window. For example, if a project has one positive
control file that is in agreement with the positive control template, the message is PC error 0/1.
Example of Positive and
Negative samples in
concordance with controls
5.
If the positive control samples are not in agreement with the template the message will be
PC error 1/1 and red lines will indicate the peaks in error.
Example of Positive sample not in
concordance with positive control
template
132
May 2013
Chapter 9 – Additional Tools
Negative Control Concordance
1.
2.
3.
Use View Preferences Chimerism to
select the file name recognition
GeneMarker automatically changes font
of negative control file name to red in
Filename Tree
Any negative control sample that has
peak(s) will result in a negative control
(NC error) in the Project Summary Bar
Filename Group Editor
Project → Apply Sample Grouping OR Tools → File Name Group Tool
The Filename Group Editor can be used to group family members or other related samples in the dataset based on
their filenames for simplified analysis.
Procedure
1.
2.
3.
Select Project → Apply Sample Grouping
The File Name Group Editor window appears
Click the Load Files icon and select all files to pair if
the dataset samples do not automatically appear in the
File Name List field
4. Choose Match by Sections or Match by Fixed Position
5. Enter values for the Group Identification and Control
Identification fields
6. Enter a Control Identifier value and click Match
7. The samples from the File Name List will be paired into
groups in the Matched Groups window
8. When the samples are grouped correctly, click OK OR
click the Save Groups to File icon to save the
grouping information as a tab-delimited Text file
9. The File Name Group Editor window will close and the grouping information will appear next to the sample
filenames in the Sample File Tree in the Main Analysis window (if Project → Apply Sample Grouping was
chosen).
10. To navigate by group in the Sample File Tree, hold down the CTRL key and hit the PageUp/Down keys.
Sample groups will be opened consecutively.
Icons and Functions
Load Files
Opens a directory window where raw data files can be located and uploaded to the Filename Group
Editor
Add Files
Opens a directory window where additional raw data files can be uploaded into the Filename List field
Remove Files
133
May 2013
Chapter 9 – Additional Tools
Removes any files selected in the Filename List. Select multiple files to remove by holding down the SHIFT key
and selecting additional samples
Save Groups to File
Saves the filenames of the samples paired in the Matched Groups field. Samples identified as Controls
will be in the first column of the Matched Groups tab-delimited Text file.
Match by Sections
Automatically separates the sample filenames into groups based on the specified Section Separators.
Group Identification: Identifies how to match the filenames into groups based on the section entered into the
Compare by Section field. The section of the filename specified will be highlighted red in the File Name List.
Control Identification: Identifies which section of the filename contains the reference vs. sample information
based on the section number entered in the Match to Identifier by Section field. The section of the filename
specified will be highlighted green in the File Name List.
Match by Fixed Position
Allows the user to manually identify the characters of the
filename for grouping the samples. Section Separators like “_ , -“
are counted as individual characters.
Group Identification: Enter the number of the beginning and
ending character to identify how to group the samples. The
section of the filename specified will be highlighted red in the File
Name List.
Control Identification: Enter the number of the beginning and
ending character to identify which part of the filename contains
the control identifier. The section of the filename specified will
be highlighted green in the File Name List.
Control Identifier
Enter the character from the Control Identification section (highlighted green) that describes the control or
reference sample. Example: N = normal or R = reference. Select Case Sensitive if the Control Identifier needs to
be identified by upper or lower case letters.
Control Match Mode
Choose either Whole Words or Include.
Whole Words should be used if the characters entered into the Control Identifier field need to match exactly.
Include should be selected if the characters in the Control Identifier field only need to be identified in the filename,
i.e. not an exact match.
Output Trace Data
Tools → Output Trace Data
The Output Trace Data tool exports raw or sized data of uploaded sample
files as Text (.txt) or SCF (.scf) files.
Procedure
1.
2.
3.
4.
5.
6.
Select whether to export the data as a Text or SCF file
Choose the directory and folder to save the exported data to in the
Output File Name field.
Select the samples to include in the output file from the Select Samples
field.
Select which dye color data to export from the Select Dyes field.
Select whether to export raw or sized data from the Data Type options.
Click Export to export the data to the specified folder.
134
May 2013
Chapter 9 – Additional Tools
Convert TXT to Binary
Tools → Convert Text to Binary Files
The Convert Text to Binary tool allows the user to upload trace data information in Text (.txt) file format for
conversion into a four-color SCF file or a five-color SG1 file. The SCF and SG1 files can then be read by
ChimerMarker and translated into chromatograms. This tool is useful for institutions developing their own
fragment analysis instruments.
Procedure
1.
2.
3.
4.
5.
Click the Load Text File button and select Text (.txt) files to
convert
Once files are uploaded, they will appear in the Text File field
The software will automatically calculate a Recommended
Ratio for the user to condense the number of frames in a
single trace
Enter a condense frames by XX number in the Condense
Frames field
Click Export to SG1 if exporting a five-color trace, click
Export to SCF if exporting a four-color trace.
Export Electropherogram
Tools →Export Electropherogram
The Export Electropherogram tool allows the user to export the
trace images to a specified folder.
Procedure
1. Use a dropdown menu to specify the output folder.
2. Specify the prefix and suffix for the exported file name. The
full file name will be Prefix+Sample name+”_”+Dye
name+Suffix+Extension name.
3. Select samples, Dyes and Image Size
4. Use a dropdown menu to specify the export format. JPEG
and PNG are both available. PNG is recommended.
135
May 2013
Chapter 10 User Management
136
May 2013
Chapter 10 User Management
Chapter 10 User Management
Chapter 10 User Management
Procedure
User Manager
History
Settings
Edit History/Audit Trail
137
May 2013
Chapter 10 User Management
Overview
User management may be implemented after installation of ChimerMarker. The administrator activates User
Management from the Help drop-down menu. User management provides control of user access rights and
automatically generates an audit trail of all edits.
Procedure
1.
2.
3.
Select Help → User Management
The Login box appears
Click Run User Protection to activate the setup
Administrator
4. Enter Organization Name, an Administrator username
and password
5. Click OK
6. You are now logged in as the Administrator
7. Click the Add User button to add additional users
8. Click the Access Rights button to set up user type access
permissions
9. Be sure to select Run User Protection and click OK to exit
10. Login is required to open ChimerMarker after the User
Manager is activated.
User Manager
The User Manager tab displays user information and contains options for creating and deleting users.
User Window
Displays all users by name, type and creation date
Organization
Enter your organization name
Run User Protection
When selected, users will be prompted to log on with a user
name and password. When deselected, any person can launch
ChimerMarker without a username and password.
Add User
Launches the Add User box where a new username and
password can be input. This is also where the user type can be
chosen. A user can be deleted by right-clicking the username
and selecting Delete User.
NOTE: Only the Administrator can add and delete users.
My Password
Launches the Change Password box where the user that is logged in
can enter a new password. The new password must be entered
twice to ensure accuracy.
Access Rights
Launches the Access Rights of User Types box where the different
access rights available to each user type can be identified. Clicking
the Set Default button will return the Access Rights for the User
Type selected back to factory defaults.
NOTE: Only the Administrator can change Access Rights for a User
Type.
Change User
Prompts for a confirmation of action then launches the Login box.
138
May 2013
Chapter 10 User Management
History
The User Manager History tab monitors user activity associated with the user manager function.
Date/Time
Records the computer’s date and time for the activity.
User
Identifies the username of the person that performed the activity.
Events
Records the user manager activity that was performed.
Comments
Gives additional information for the event that was performed. For
example, if a user is added, then the username of the person that
was added is recorded under Comments.
Settings
The User Manager Settings tab contains additional options for the User Management function.
Overtime Protection
When selected, ChimerMarker will logout the user after the
specified time entered in the Wait field. When the user is logged
out, the status of the analysis remains unchanged until the user logs
back in (with username and password).
Record Data Edit History
When selected, any changes made to the allele calls of the project
will be saved in the Edit History log. Please see Edit History section
below for more information.
Edit History/Audit Trail
When Record Data Edit History is selected in the User Manager Settings box (see User Management Settings
section above), any change to allele calls in the analysis will be recorded. Changes can also be recovered in the
Edit History feature.
Procedure
1.
2.
3.
Click the Show Chart/Table icon in the Main Analysis window.
The Peak Table will appear below the sample electropherogram.
Make changes to allele calls by right-clicking any cell in that allele’s row in the Peak Table or right-click the
grey vertical bar at the center of the peak in the electropherogram.
4. Choose to Edit Allele, Edit Comments, Add/Delete Allele, and Confirm. See Chapter 4 Main Analysis Overview.
5. Once a change has been made to the allele call, notice the pink shading in the No. column of the Peak Table.
This indicates a change has been made to that allele.
6. Right-click any changed allele and select View History.
7. The Show Edit History window appears.
8. Select a change from the Edit History List to view changes in
the Current/Old Values table. Changes will be highlighted in
red.
9. To recover a change, right-click the row in the Edit History List
and select Recover Old Value. A star will appear in the
Recover column.
10. Click OK and click Yes when the warning prompts you to
confirm.
139
May 2013
Chapter 10 User Management
Edits History Window
140
May 2013
Index
Index
2
2D OFFSET ................................................................... 81
ND
2 DERIVATIVE TRACE .................................................... 57
BIN RANGE ....................................................................98
BIN TABLE ..................................................................113
BINNING ................................................................ 98, 99
BINS..........................................................................110
BROWSE BY ALL COLORS...................................................79
BROWSE BY ALL COLORS ..................................................80
A
C
ABIDE BY PANEL .......................................................... 117
ACCESS RIGHTS ........................................................... 134
ACCOUNT AND PASSWORD ..............................................7, 9
ADD FOLDER ............................................................ 14, 55
ADD SAMPLES ............................................................... 67
ADD SAMPLES TO PROJECT ............................................... 77
ADD USER.................................................................. 134
ADJUSTING PANELS ...................................................... 103
ADMINISTRATOR .......................................................... 134
AGAROSE GEL ................................................................ 84
ALLELE BOUNDARIES ...................................................... 107
ALLELE CALL ................................................................. 62
ALLELE CALL FOLDER ....................................................... 66
ALLELE COMMENTS ........................................................ 72
ALLELE COUNT REPORT STYLE ......................................... 115
ALLELE EVALUATION ....................................................... 62
ALLELE LABEL ................................................................ 74
ALLELE LIST ................................................................ 112
ALLELIC LADDER............................................................. 62
ALTERNATIVE CHIMERISM DETCTION METHOD ...................... 20
ANALYSIS TYPE .............................................................. 60
APPLY FILTER TO ALL MARKERS ......................................... 99
APPLY SAMPLE GROUPING ............................................... 76
AUDIT TRAIL ............................................................... 135
AUTO FIT Y .................................................................. 92
AUTO IDENTIFY.............................................................. 76
AUTO PANEL ADJUSTMENT ............................................... 63
AUTO PULL-UP REMOVAL ................................................ 56
AUTO RANGE ........................................................... 60, 62
AUTO RUN ................................................................... 77
AUTO SCALE MARKERS ............................................. 81, 117
AUTO SELECT BEST LADDER .............................................. 62
AUTOMATIC PANEL CREATION ......................................... 101
AUTOMATICALLY RE-SORT REPORT ..................................... 76
AUTOMATICALLY SCROLL CHARTS TO ALLELES WHEN SELECTED IN
REPORT ................................................................... 76
CALIBRATION PLOTS ........................................................91
CALL ALLELE ..................................................................80
CALL ALLELE ICON ...........................................................63
CHANGE PASSWORD ......................................................134
CHANGE USER .............................................................134
CHART HEIGHT .............................................................117
CHART OVERLAY...........................................................117
CHART SETTINGS ............................................................75
CHART SYNCHRONIZE .......................................................92
CHECK RANGE IN EDIT ....................................................107
CHIMERISM ANALYSIS ......................................................12
CHIMERISM PANELS ......................................................103
CLASSIC ........................................................................74
CLIENT COMPUTER ........................................................... 7
CLOSE ALL ....................................................................74
COLOR MATRIX ..............................................................58
CONFIDENCE LEVEL ..........................................................62
CONFIRM PEAKS .............................................................73
CONFIRM/UNCONFIRM ALLELE ..........................................72
CONTACT US ..................................................................10
CONTROL CONCORDANCE ....................................... 128, 129
CONTROL GENE ............................................................100
CONTROL IDENTIFICATION ....................................... 130, 131
CONTROL IDENTIFIER .....................................................131
CONTROL MATCH MODE ................................................131
CONVERT MACINTOSH FILE FORMATS .................................... 5
CONVERT TEXT TO BINARY ..............................................132
CONVERT TEXT TO BINARY FILES .........................................78
CREATE BIN ...................................................................99
CREATE MARKER ............................................................97
CREATE NEW PANEL ....................................... 101, 105, 106
CREATE NEW SIZE STANDARD ............................................88
CUBIC SPLINE METHOD ....................................................61
CURRENT/OLD VALUES ..................................................135
CUSTOM PANEL CREATION ..............................................101
CUSTOM SIZE STANDARD CREATION ....................................86
CUSTOMIZE BIN COLUMN .................................................80
B
BASELINE SUBTRACTION................................... 56, 57, 60, 61
BC = BIN CONFLICT ........................................................ 71
BECKMAN-COULTER COLOR ORDER ................................ 14, 55
BESTMATCH ................................................................. 86
BESTMATCH MATCH ALL ................................................. 88
BESTMATCH MATCH SELECTED.......................................... 88
BIN BOUNDARY ........................................................... 100
BIN OPTIONS ................................................................ 99
D
DATA FILE LIST ......................................................... 13, 55
DATA PROCESSING .................................................... 62, 63
DECIMAL PRECISION ........................................................74
DELETE BIN .................................................................100
DELETE MARKER .................................................... 99, 105
DELETE PANEL ....................................................... 97, 105
DELETE PEAKS ................................................................73
141
May 2013
Index
DELETE SIZE .................................................................. 85
DELETE SIZE STANDARD .............................................. 85, 87
DELETE/UNDELETE ALLELE ............................................... 71
DIFFERENCE .................................................................. 70
DISABLE SAMPLES .......................................................... 67
DISABLED SAMPLES ......................................................... 76
DISABLED SIZE COLUMNS ................................................. 89
DISPLAY SETTINGS .......................................................... 74
DISTANCE/KB.............................................................. 100
DYE COLOR CHANNELS................................................. 14, 55
GEL IMAGE DISPLAY ........................................................69
GEL IMAGE DISPLAY SETTINGS............................................75
GENEMARKER HID LOCAL VERSION ............................ 5, 6, 8, 9
GENEMARKER HID NETWORK VERSION................................. 7
GENERAL SETTINGS .........................................................74
GENOTYPING PANELS .....................................................103
GROUP IDENTIFICATION .......................................... 130, 131
GROUPED BY DYE .........................................................117
E
HI = HIGH INTENSITY .......................................................71
HIDE EXTRA SAMPLE NAMES ...........................................112
HIDE TOGGLES ...............................................................79
HORIZONTAL MOVEMENT .................................................68
HORIZONTAL REPORT TABLE ............................................112
EDIT ALLELE .................................................................. 72
EDIT BIN .................................................................... 100
EDIT BINS .................................................................... 99
EDIT HISTORY ............................................................. 135
EDIT HISTORY LIST........................................................ 135
EDIT MARKER ............................................................... 98
EDIT MARKER BINS ........................................................ 99
EDIT PANEL .................................................................. 97
EDIT SIZE ..................................................................... 85
EDITING PEAKS ......................................................... 71, 73
EDITING SIZE CALL .......................................................... 90
ELECTROPHEROGRAM ...................................................... 68
ELECTROPHEROGRAM TRACE DISPLAY.................................. 69
ENABLE SAMPLE GROUPING.............................................. 76
ENGRAFTMENT MONITORING ............................................ 29
ENHANCED BASELINE SUBTRACTION .................................... 60
ENHANCED SMOOTH ....................................................... 60
EVENT LOG ................................................................... 80
EXIT ........................................................................... 74
EXPORT ABI SIZE STANDARD ............................................ 87
EXPORT CALIBRATION DATA ............................................. 91
EXPORT ELECTROPHEROGRAM ........................................... 78
EXPORT ELECTROPHEROGRAM ......................................... 132
EXPORT PANEL ....................................................... 97, 106
EXPORT SIZE STANDARD ............................................. 85, 87
EXPORT THE PROJECT PANEL ........................................... 106
EXPORT TO SCF ........................................................... 132
EXPORT TO SG1 .......................................................... 132
EXTEND DIPLOID HOMOZYGOUS ...................................... 112
F
FILE NAME GROUP ....................................................... 130
FILE NAME GROUP TOOL .......................................... 78, 130
FILE TYPES ............................................................... 13, 55
FILENAME GROUP EDITOR .............................................. 130
FILTERING PARAMETERS................................................... 98
FIX SIZE ....................................................................... 91
FIXED BIN WIDTH .......................................................... 99
FRAGMENT MOBILITY....................................................... 84
FRAME ........................................................................ 60
H
I
IHE = INCONCLUSIVE HETEROZYGOUS ..................................71
IHO=INCONCLUSIVE HOMOZYGOUS ....................................71
ILS STATISTICS ...............................................................90
IMB = HETEROZYGOTE IMBALANCE .....................................71
IMPLEMENT Y AXIS SETTINGS ...........................................117
IMPORT A PANEL ............................................................60
IMPORT ABI PANELS ............................................. 101, 105
IMPORT ABI SIZE STANDARD .............................................87
IMPORT DATA FILES .................................................. 13, 55
IMPORT PANELS ...........................................................105
IMPORT PANELS FROM GENEMAPPER ................................101
IMPORT PRE-DEFINED PANELS .........................................105
IMPORT SIZE STANDARD ...................................................87
INSERT ALLELE ...............................................................71
INSERT SIZE ...................................................................85
INSTALLATION ................................................................. 5
INSTALLATION WIZARD ........................................... 5, 6, 8, 9
INTENSITY .....................................................................62
INTENSITY COEFFICIENTS ...................................................60
INTERNAL LANE STANDARD (ILS) ........................................84
L
LABEL DYES & PEAK NUMBERS ........................................117
LADDER IDENTIFIER ................................................... 63, 76
LADDER LABEL ...............................................................76
LANE SCORE ..................................................................89
LINE LIST ......................................................................81
LINKED USER MANUAL.....................................................78
LINUX ........................................................................... 5
LO = LOW INTENSITY .......................................................71
LOCAL SOUTHERN ...........................................................61
LOGIN ........................................................................134
LONGITUDINAL GRAPH REPORTS .........................................29
LOW TEMPLATE FLAGGING .................................................98
LS = LOW SCORE ............................................................71
G
GEL IMAGE ................................................................. 107
142
May 2013
Index
M
MACINTOSH ................................................................... 5
MAGIC WIZARD ....................................................... 78, 80
MAJOR ADJUSTMENT OF PANEL ....................................... 107
MANUAL CALIBRATION.................................................... 92
MANUAL PANEL CREATION............................................. 102
MANUAL PULL-UP CORRECTION......................................... 56
MANUAL SELECTION OF RANGE .......................................... 62
MARK OFF-ALLELE AS ‘OL’ .............................................. 74
MARKER BOUNDARY ...................................................... 98
MARKER DROP-DOWN MENU ........................................... 80
MARKER OPTIONS ......................................................... 97
MARKER PARAMETERS .................................................... 98
MARKERS .................................................................. 110
MATCH BY FIXED POSITION ............................................ 131
MATCH BY SECTIONS .................................................... 131
MATCH LADDER .......................................................... 106
MATCH SCORE ................................... 86, 88, 89, 90, 91, 92
MATCHED GROUPS ...................................................... 131
MATERNAL CELL CONTAMINATION ................................... 120
MAX # OF OPEN CHARTS ................................................. 75
MAX & AVERAGE ........................................................ 107
MAX ALLELE LABEL LAYERS ............................................... 75
MAX CHART # IN PAGE ................................................... 75
MAXIMUM IMBALANCE ................................................... 98
MCC ANALYSIS ........................................................... 120
MEGABACE COLOR ORDER ......................................... 14, 55
MENU OPTIONS ............................................................ 73
MERGE BINS............................................................... 114
MINIMUM COMPUTER REQUIREMENT .................................... 5
MINIMUM HETEROZYGOTE INTENSITY ................................. 98
MINIMUM HOMOZYGOTE INTENSITY ................................... 98
MINIMUM IMBALANCE .................................................... 98
MINOR ADJUSTMENT OF PANEL ....................................... 107
MIX DYES .................................................................. 117
MODIFY SIZE STANDARD .................................................. 86
MULTI-LINEAGE ANALYSIS........................................... 15, 20
N
NAVIGATION................................................................. 68
NEGATIVE CONTROL ....................................................... 76
NEGATIVE CONTROL CONCORDANCE ................................. 130
NEW PAGE FOR EACH SAMPLE......................................... 117
NEW SIZE STANDARD CREATION ........................................ 87
NEW TEMPLATE.............................................................. 59
NUCLEOTIDE REPEAT .................................................. 97, 99
NUCLEOTIDE REPEATS ..................................................... 99
OPEN DATA ............................................................ 73, 79
OPEN DATA FILES ..................................................... 13, 55
OPEN PROJECT ....................................................... 73, 118
OPTIONS ......................................................................77
OUTPUT TRACE DATA .............................................. 78, 131
OVERLAY TRACE .............................................................97
OVERTIME PROTECTION .................................................135
P
PANEL .........................................................................59
PANEL CREATION ..........................................................101
PANEL EDITOR ....59, 60, 62, 63, 71, 77, 95, 96, 97, 101, 102,
105, 106, 108, 115, 118
PANEL LIST ....................................................................96
PANEL TABLE ...............................................................100
PANELS AND BINS FILES ..................................................101
PASSWORD .................................................................134
PEAK DETECTION THRESHOLD ............................................62
PEAK INFORMATION ........................................................73
PEAK LABEL ...................................................................75
PEAK SATURATION ..........................................................60
PEAK SCORE ..................................................................62
PEAK TABLE .......................................................... 69, 135
PEAK TABLE COLUMNS ...................................................115
PEAK TABLE REPORT STYLE..............................................114
PERCENTAGE .................................................................62
PL = BEYOND PLOIDY ......................................................71
POSITIVE CONTROL .........................................................76
POSITIVE CONTROL TEMPLATE EDITOR ......................... 78, 129
PRE-DEFINED PANELS ....................................................101
PRE-DEFINED SIZE STANDARDS ..........................................86
PREFERENCES BOX ...........................................................74
PREPROCESS RAW DATA ...................................................92
PRINT ........................................................................118
PRINT ALLELES .............................................................117
PRINT MARKERS ...........................................................117
PRINT PAGE SETUP........................................................118
PRINT PROJECT COMMENTS ............................................117
PRINT REPORT ...... 67, 74, 77, 78, 79, 81, 111, 116, 117, 118
PRINT REPORT CONTENT OPTIONS ....................................117
PROFILE COMPARISON VIEW .............................................81
PROJECT COMMENTS .......................................................77
PROJECT OPTION SETTINGS ...............................................77
PROJECT PANEL ..............................................................96
PROMEGA POWERPLEX ..................................................101
PULLUP CORRECTION .......................................................58
PULL-UP CORRECTION ......................................................61
Q
O
OFF LADDER PEAKS ......................................................... 93
OFF LADDER PEAKS ...................................................... 110
OFFLINE REGISTRATION ..................................................7, 9
OL = OFF LADDER .......................................................... 71
ONE-COLOR ANALYSIS ...................................................... 60
ONLINE REGISTRATION ...................................................7, 8
QUALITY.......................................................................70
QUALITY REASONS ..........................................................70
R
RAW DATA ANALYSIS ......................................................60
RAW DATA FOLDER .........................................................66
143
May 2013
Index
RAW DATA MAIN ANALYSIS WINDOW ............................ 14, 56
RAW DATA TRACES ................................................... 14, 56
RE-ANALYZE INDIVIDUAL SAMPLES...................................... 63
RE-ANALYZE WITH AUTO RUN ........................................... 63
RE-ANALYZE WITH RUN WIZARD ........................................ 63
RECORD DATA EDIT HISTORY .......................................... 135
RECOVER OLD VALUE .................................................... 135
REGISTRATION................................................................. 7
REGISTRATION ID .........................................................7, 9
RELOAD PANEL .............................................................. 97
RELOAD SIZE STANDARD .................................................. 85
REOPEN PROJECT ......................................................... 118
RE-OPEN PROJECT ......................................................... 73
REPORT SETTINGS .......................................................... 80
REPORT SETTINGS ICON ................................................... 72
REPORT SETTINGS PREFERENCES TAB .................................. 76
REPORT STYLE ............................................................. 112
REPORT STYLE OPTIONS ................................................... 72
REPORT TABLE ....................................................... 72, 112
REPORT TABLE LAYOUT ................................................. 112
REPORT TABLE ORIENTATION .......................................... 112
RUN ...................................................................... 77, 78
RUN METHOD ............................................................... 74
RUN PROJECT .......................................................... 59, 79
RUN USER PROTECTION ................................................. 134
RUN WIZARD ........................................................... 59, 74
RUN WIZARD ADDITIONAL SETTINGS .................................. 62
RUN WIZARD DATA PROCESS ............................................ 60
RUN WIZARD LOAD DEFAULT ............................................ 62
RUN WIZARD SAVE DEFAULT ............................................ 62
RUN WIZARD TEMPLATE SELECTION.................................... 59
S
SAMPLE FILE TREE .......................................................... 66
SAMPLE GROUPING ........................................................ 67
SAMPLE ILS ............................................................. 86, 90
SAMPLE INFORMATION .................................................... 67
SAMPLE SCORE .............................................................. 89
SAMPLE SEARCH OPTIONS ................................................ 67
SAMPLE SORTING OPTIONS .............................................. 67
SATURATED PEAK CORRECTION.......................................... 58
SATURATION CORRECTION ................................................ 56
SAVE AS NEW PANEL .................................................... 105
SAVE AS NEW SIZE STANDARD ........................................... 87
SAVE CHANGES.............................................................. 88
SAVE CHANGES TO PANEL .............................................. 106
SAVE CHANGES WITH SIGNAL INFO ................................... 106
SAVE PEAK TABLE ..................................................... 71, 79
SAVE PROJECT ........................................................ 74, 118
SAVE REPORT................................................................ 80
SAVE REPORT TABLE ....................................................... 73
SAVE RUN WIZARD PARAMETERS....................................... 76
SCF FILE .................................................................... 132
SCORE ......................................................................... 70
SECOND DERIVATIVE TRACE .............................................. 59
SERVER COMPUTER ........................................................... 7
SET AXIS ...................................................................... 79
SET CHANNELS ...............................................................77
SET SAMPLE TYPE ...........................................................76
SFP FORMAT ...............................................................118
SG1 FILE ....................................................................132
SGF FORMAT...............................................................118
SHOW 3D .....................................................................81
SHOW CHART/TABLE .......................................................79
SHOW COLOR ................................................................79
SHOW COLUMNS ............................................................69
SHOW CONTROL SAMPLES IN REPORT ..................................76
SHOW DISABLED SAMPLES IN REPORT ..................................76
SHOW GEL IMAGE...........................................................74
SHOW LADDER SAMPLES IN REPORT ....................................76
SHOW LAST EVENT ..........................................................78
SHOW NAVIGATOR .........................................................74
SHOW ONLY UNCERTAIN ALLELES .....................................112
SHOW REJECTED LOW SCORE ALLELES ................................112
SHOW REPORT ...............................................................74
SHOW TOGGLES .............................................................79
SHOW TYPE SYMBOL .....................................................113
SHOW/HIDE ICONS .........................................................66
SIZE CALIBRATION ..................................................... 79, 92
SIZE CALIBRATION CHARTS ................................................89
SIZE CALL......................................................................61
SIZE CALL METHODS ........................................................61
SIZE EDITOR ACTION HELP ................................................88
SIZE MATCH ..................................................................88
SIZE STANDARD...............................................................60
SIZE STANDARD ............................................................118
SIZE STANDARD LIST ........................................................84
SIZE STANDARD STATISTICS ...............................................90
SIZE TEMPLATE EDITOR ................................... 60, 77, 84, 88
SMOOTH ........................................................... 56, 57, 60
SOFTGENETICS WEBSITE....................................................79
SOFTWARE VERSION .........................................................79
SP = SATURATED (PULL- UP).............................................71
SPIKE REMOVAL ............................................ 56, 57, 58, 61
SR = SATURATED (REPAIRED) ............................................71
STANDARD COLOR ..........................................................60
START UP SETTINGS .........................................................74
START YOUR PROJECT ......................................................78
START/END...................................................................70
STUTTER .......................................................................99
STUTTER FILTER ..............................................................99
SYNTHETIC GEL IMAGE .....................................................68
SYSTEM REQUIREMENTS ..................................................... 5
T
TECHNICAL SUPPORT .......................................................79
TEMPLATE NAME ............................................................59
TRACE MODE ..............................................................106
TRACE OVERLAY ...........................................................106
U
UNIX ........................................................................... 5
UPDATE CALIBRATION ......................................................91
144
May 2013
Index
USE LAST TEMPLATE ........................................................ 59
USE SIZE STRING FOR LABEL .............................................. 74
USER ID .....................................................................7, 9
USER MANAGEMENT ............................................... 78, 134
USER MANAGER HISTORY .............................................. 135
USER MANAGER SETTINGS ............................................. 135
VIEW MODE..................................................................92
VIRTUAL OR VARIANT ALLELES IN PANELS .............................100
VIRTUAL PANEL ............................................................106
VPANEL_PANELNAME ...................................................106
V
ZOOM IN ......................................................................79
ZOOM IN/OUT ..............................................................68
ZOOM OUT ...................................................................79
VERTICAL REPORT TABLE................................................ 112
VIEW HISTORY ....................................................... 72, 135
Z
145
May 2013