1
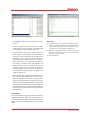
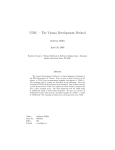
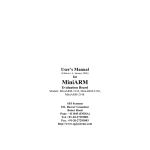
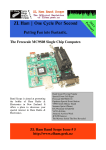
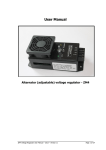
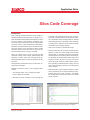
Application Note
Silos Code Coverage
Introduction
Code coverage analysis measures how thoroughly a
simulation testbench exercises parts of a design. It provides an indication of the quality of the testbench: if some
part of the design is not exercised by a testbench, then
a test case may be missing from the test specification
which was used to create the testbench. Alternatively,
perhaps it is expected that the section is unexercised because the design is more general than strictly needed
and some mode is unused. A section of code may also
be unexercised because of a bug in the design.
There are various kinds of code coverage including
statement coverage, path coverage, FSM coverage and
expression coverage. Silos code coverage reports behavioral lines that did not execute, and operators not fully
exercised.
This application note describes how to create a line coverage report using Silos.
Example Procedure for Using Line Coverage Feature
of Silos:
• The example project “code_coverage.spj” will be
used to explain the procedure.
• Start Silos. and open the project “code_coverage.spj”
.
Figure 1. Code Coverage Line Report.
Application Note 4-004
• To enable Code Coverage reporting, click on the Enable Code Coverage button if it is not already selected. If the Enable Code Coverage button is selected
after inputting the files for the design, Silos will display
a message box to allow the user to reload the design
and enable Code Coverage reporting.
• Click on the Go button to simulate the design.
• Select the Reports Code Coverage Line Report menu
selection to open the Code Coverage Line Coverage
report (Figure 1). This report is sorted by the number
of times each line is executed (“Hits”) in ascending order. Normally you are interested in which lines are not
executed (“0” Hits). However, the report can also be
used to see which lines have a high number of executions, indicating a possible flaw in the design. The sort
order can be changed by clicking on the desired sort
column heading.
• While viewing the Code Coverage Line Report, double
click on the first entry in the report that has zero “Hits”.
This will open the file “code_coverage.v”, and display
the line that did not execute with a red icon in the left
margin of the line.
Figure 2. Data Tip Showing Code Coverage Information.
Page 1
Figure 3. Code Coverage Line Report.
Figure 4. Data Tip Showing Code Coverage Information.
• Click the Main window to change the focus to the text
window.
References
• Place the mouse cursor over the red icon in the left
margin of the file “code_coverage.v”, and a data tip will
pop up stating “Line Not Executed” (Figure 2).
• A large number of hits in the Code Coverage Line
Report (Figure 3) may indicate a looping problem in
the design. To see an example of this, double click on
the last entry in the Code Coverage Line Report to
automatically go to that line of file “code_coverage.v”.
Notice that this line is in an “always” loop that triggers itself by recursively setting the variable in the
sensitivity list. To see how many times the line was
executed, change the focus back to the Main text
window, place the mouse cursor over the green text
box, and a data tip will pop up stating “Line Execution
Count=44” (Figure 4).
[1] VIS Group (1996), .VIS: A system for Verification and Synthesis., in proceedings of 8th International Conference on
Computer Aided Verification (CAV), pp428-432, Vol. 1102
Lecture Notes in Computer Science, Springer. July.
[2] Expression Coverability Analysis: Improving code coverage with model checking Graeme D. Cunningham,Paul
B.Jackson, Julian A.B. Dines
[3] Silos User Manual
• The Code Coverage results can be displayed in another program, such as Microsoft Excel. To demonstrate the exporting of the Code Coverage results,
select the Reports Export menu selection to open the
Export Code Coverage Data dialog box. Select a file
name and click the OK button to close the dialog box.
The file can be viewed in an editor window to verify the
export format, or import the file into a program such as
Microsoft Excel.
Conclusion
The Code Coverage of a given test pattern can easily be
measured using Silos. Reports in various formats can
be generated using this feature that list unexercised lines
and hit count for the behavioral source code of a Verilog
design.
Page 2
Application Note 4-004