1
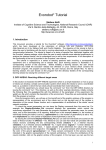
NCAR/TN-318+IA
NCAR TECHNICAL NOTE
I
I
July 1988
Integrated Analysis Package for Mk-lll
K-coronameter Observations: AUser's Manual
S. Archuleta, University of Colorado
R. Beutner, University of Colorado
HIGH ALTITUDE OBSERVATORY
I
NATIONAL CENTER FOR ATMOSPHERIC RESEARCH
BOULDER, COLORADO
CONTENTS
Forward
V
1.
INTRODUCTION
1.1 Integrated Analysis Package Description
1.2 User's Manual -- Getting Started
1
2.
lAP BASICS
2.1 Getting Started
2.2 Features and Options
2.3 On-line Help
3
3.
IAP MENU OPTIONS
3.1
Introduction
3.2 Exit Option
3.3 Setup of Parameters and Options
3.4 Image Input/Output
3.5 Line Scans
3.6 Radial Scans
3.7 Angle Scans
3.8 Positional Information
3.9 Line Lengths and Integration
3.10 Area Determination and Integration
3.11 Image Difference
3.12 Define Macro
11
APPENDIX
45
References
51
iii
FORWARD
The following document describes the use of the Integrated Analysis Package,
LAP, the primary software tool for visual, graphical, and quantitative numerical analysis
of solar coronal data acquired with the Mark III Coronameter. IAP was written for use
on a VAX 11-780 (haovax, HV) running Berkley Unix version 4.2, but it can easily be
ported to other Unix machines. As an accompaniment to this Technical Note, there also
exists an IAP Maintenance Manual, providing in house programmers a road map to the
code.
The opportunity to produce IAP, resulted from a request from Dr. Evi Nemethl
to provide realistic coding projects to students of her computer science course, Computer
Applications, CS 420/421, in the School of Arts and Sciences at the University of
Colorado. In response, the idea and specifications of lAP were devised at the High Altitude Observatory. Students Richard Beutner and Steven Arclluleta then developed and
completed the package as their Senior Project in the course.
Input to the IAP program is reformated Mlark III image data. These images are
the end result of processing with existing software tools written by Jay Chalmers, and
described in NCAR Technical Note NCAR TN-247- A.
Alice Lecinski
High Altitude Observatory
Boulder, Colorado
v
INTRODUCTION
Chapter 1
1.1
Integrated
Analysis Package
Description
The Integrated Analysis Package (IAP) is a program designed to
provide on-line, real-time analysis of data produced by the Mark III
K-Coronameter. The program integrates a variety of display and
analysis routines into one package and provides an interactive
environment through a menu-driven user interface. To facilitate
program operation, a genuine attempt has been made to keep options
and features as consistent as possible throughout the program. This
interface should allow the user to concentrate on data extraction
and analysis rather than program operation.
lAP is currently set up to run within the constraints of the
VAX750 HV system and all image displays are provided through the
use of the Grinnell display system. While image display is a vital
component of IAP, it should be noted that all analysis functions may
be run regardless of whether a Grinnell Display is used or not. Of
course, the value of this feature will be dependent on the user's
familiarity with the image data.
1.2
User's Manual
-- Getting Started
The purpose of this manual is to provide the user with a
detailed description of the setup and operation of the IAP program.
The manual assumes that the user has access to the IAP program and
is familiar with the basics of the Unix operating system. All users
should read chapter 2 and section 3.1 completely. Chapter 3 may
then be referred to as needed. Users may also wish to skim through
the APPENDIX for graphic examples of analysis routines presented in
chapter 3.
Chapter 2 provides all the details necessary to run IAP. This
includes program initialization, startup, general description of
features and options, and program exit. The user interface is also
covered along with information regarding input/output procedures.
Lastly, instruction for use of the on-line help is provided.
Chapter 3 provides a detailed account of each menu option
available in IAP. This includes a description of the routine,
I
available functions and options, input data constraints, output
details, and any special information regarding the routine.
The APPENDIX provides graphic examples of Grinnell image
displays for each analysis routine. These examples can be used in
conjunction with chapter 3 to provide the user with a better
understanding of program operation.
In the interest of clarity and brevity, the following
conventions have been adopted in writing this manual. Each term
listed is accompanied by the action or item which it represents.
< Return >
< Esc>
< Achar >
Depress the return key or other valid
carriage return.
Depress the escape key.
Hold down the control key while
pressing the char key ( two key
rollover). i.e. <
< Delete >
< Space >
c>,<
f>
Depress the delete key.
Depress the space bar.
Represents Unix command prompt
To separate user input from manual text, all user input shall be
printed in boldface. Also, since the majority of the input will be
numerical in nature, the user need only worry about upper and lower
case distinctions when typing in filenames.
2
IAP BASICS
Chapter 2
2.1
Getting
Started
A general outline of IAP program execution is given below. The
rest of this chapter will build upon this outline and fill in missing
details.
A.
B.
C.
D.
E
F.
A.
Accessing IAP Program
Allocation of Grinnell Display ( optional )
Starting IAP Program
Running IAP Program
Exiting IAP Program
Deallocation of Grinnell Display ( optional )
Accessing IAP Program
It is assumed that the user has logged on to the system and has
access to the IAP executable code. This code, named "lAP", is
located in the following directory: /u/henick/menu.dir
B.
Allocation of Grinnell Display
A Grinnell Display is used to display Mark III image data. Each
Grinnell Display consists of a monitor, memory channels, color
tables, and a joystick control unit. Memory channels are divided into
image and overlay channels. There are currently two Grinnell
devices available. These are labeled 0 and 1 and are located in room
288. Grinnell 0 contains three image channels labeled 0,1, and 2.
Grinnell 1 contains four image channels labeled 0,1,2, and 3.
Besides this difference, the two devices are virtually identical, and
the IAP program is fully supported on either device. For further
information on the Grinnell Display System, please see "Beginner's
Guide to Image Processing" by Rose Reynolds.
Before using a Grinnell Display, the device must first be
allocated. This allocation cannot be done within the IAP program.
Therefore, if a Grinnell Display is to be used, the user must allocate
the appropriate Grinnell before running the IAP program. If no
Grinnell is to be used, then the user may proceed to start the IAP
program. To allocate a Grinnell Display, the gall command is used
as follows:
3
% gall 0 < Return >
or
% gall 1 < Return >
The 0 and 1 refer to the Grinnell labels. While both Grinnell Displays
may be allocated at the same time and used by the IAP program, the
program was not designed to provide any benefits or advantages
from such a setup.
After issuing the gall command, no message is returned
unless the system is unable to allocate the Grinnell Display
specified. In that case, it is most likely that someone has
previously allocated the Grinnell Display and is still using it or has
forgotten to deallocate the device. If someone has forgotten to
deallocate the device, and the second Grinnell Display is not
available, the user may wish to refer to the greef program. This
command will deallocate the Grinnell display and send an
appropriate message to the person who left the Grinnell allocated.
The user may also wish to refer to the grtime program, which
provides a weekly schedule and signup sheet for Grinnell use. Users
should include /usr/local in their pathnames (.login file) to access
gall, greef, grtime, and the degall command mentioned below.
C.
Starting IAP Program
Before starting the IAP program, the user should be sure that
the settings are correct for the particular terminal being used.
Otherwise, the IAP menus will not be properly displayed on the
terminal screen.
Normally, this is taken care of automatically by
commands found in the user's .login file. Otherwise, the user may
use the Unix set term = vt100 command to set the correct
terminal characteristics.
To start the IAP program, input the following:
% lap < Return >
After a few seconds, the lAP main menu should appear on the
terminal screen ( see APPENDIX A.1 ). If the main menu screen is not
properly displayed on the terminal, simply hit the < Esc > key to exit
the program. The user may wish to check the terminal settings and
attempt to run the program once again.
4
D.
Running IAP Program
Once the IAP main menu is displayed on the terminal screen,
the program is ready for use. This section will not describe the
operating specifics of the IAP program; that will be left to section
2.2. This section will describe the overall IAP program flow.
Hopefully this will give beginning users a basic understanding of
how to approach the program.
The structure of the IAP user interface is based upon a menudriven style. The main menu constitutes the top level of this
system. All other menu options are sub-menus with respect to the
top level. These sub-menus run only one level deep; therefore, there
are no other sub-menus located within the first set of sub-menus.
Each and every menu is associated with a distinct, full terminal
screen display. That is, there will never be more than one menu
displayed at any one time on the terminal screen. Direct access
between sub-menus is not supported by IAP. Therefore, access
between sub-menus will involve switching back to the main menu as
an intermediary step. The exception to this is access to the on-line
help, although, technically, the on-line help is a feature rather than
a menu option.
While it may not be possible to define a rigid procedure for IAP
operation, the following steps approximate standard IAP operating
procedure:
1. Initialize Program
2. Load Image Data
3. Perform Analysis Routines
Step 1 involves defining a set of user preferences. This is achieved
through menu option 1 -- Setup of Parameters and Options. These
preferences include items such as whether a Grinnell Display is to
be used, whether reports should be produced, or how to determine
image intensities. See section 3.2 for more information. Once these
preferences have been set, they will be applied throughout the
program until program execution has been suspended. Of course, the
settings may be changed at any point during program execution.
While default settings are provided so that the user may skip this
step, it is likely that the user will want to perform this option
first.
5
The next step involves the specification of image files to be
analyzed. This is provided for by the use of menu option 2 -- Image
Input/Output. It should be clear that no analysis routines may be run
without first defining an image or list of images. With consistent
use of the Grinnell Display, it is easy to think of this option as an
image display routine. However, this option must be performed
independent of whether a Grinnell Display is used or not. While
additional images may be added at any point during program
execution, it is to the user's advantage to list all images to be
worked on at one time. This is due to a feature (< A f >, < A b >)
which will be explained in section 2.2.
The final step in the operating process is, of course, to
perform the analysis routines. These routines currently consist of
seven menu options and encompass a variety of data extraction and
reduction techniques. The specifics of each of these options is
described in chapter 3.
There are two menu options, Image Difference and Define
Macro, which do not fit neatly within the program procedure
described above. Image Difference is unique in that it is the sole
analysis routine which may be performed without first specifying
the image data to be utilized. In fact, since the routine's output is
an image file, there may be times when it will be necessary to run
this routine before the specification of an image file.
Define Macro is more of a utility routine than an analysis
routine. It can be thought of as a special recorder which records all
keyboard input. As a result, the user may start the program with
this option to attain a certain amount of program automation.
Please refer to chapter 3 for more information on both Image
Difference and Define Macro.
E
Exiting IAP Program
To exit the IAP program, the user may either type 0 < Return >
at the prompt of the main menu or hit the < Esc > key while at the
main menu. Other emergency exits are discussed in section 2.2.
F.
Deallocation of Grinnell Display
If the user is finished using the Grinnell Display, be sure to
deallocate the Grinnell so that other users may have access to the
device.
6
Use the degall command as follows:
% degall 0 < Return >
or
% degall 1 < Return >
The 0 and 1 refer to the Grinnell labels. Regular Grinnell users
should place the following commands in their .logout files. These
commands will deallocate the Grinnell Displays automatically at
system logout:
degall 0 > /dev/null
degall 1 > /dev/null
2.2
Features and Options
The following section describes the features and options of
the IAP program available to the user. Options defined in menu
option 1, Setup of Parameters and Options, are also included.
< Esc >
The escape key is used to move back one menu level. With the
exception of the help menus, the IAP program consists of only two
menu levels: the main menu and its respective sub-menus.
Therefore, primary use of the escape key will be to move from any
sub-menu back to the main menu. If the escape key is pressed at the
main menu, the program will be terminated. The special case of the
help menus will be discussed in section 2.3.
< Return >
The return key is used to confirm any data typed in by the user.
That is, the program will not respond to any input data until a return
signal has been received. Before the return has been pressed, the
user may edit the input data as needed. If a return is pressed with
no data before it, one of two things will occur. An error message
may be generated and the user directed to type in a valid input or a
default value will be assumed and filled in at the appropriate
prompt.
7
< Delete >, <
Au
>
As mentioned above, the user may edit any data entered before
a < Return > is pressed. The delete key and A u command are used to
edit the data. < Delete > deletes one character at a time, while
< u > deletes the entire line. After deleting the necessary
characters, the user simply retypes the correct information.
A r>
<<^r>
If an IAP
user may press
screen remains
different menu
menu is not properly displayed for some reason, the
the A r command to redraw the current screen. If the
abnormal, the user may wish to try switching to a
or consider restarting the program.
<A c>,<A>
The
A
c and
for the program.
A
z commands can be thought of as emergency exits
if the program should "freeze-up" ( not accept
normal input ) or if the user needs to stop the execution of a routine
before it is done, the user may try < A c >. This will prompt the user
for confirmation to end the program, and then exit the program if
confirmation is received. The IAP program process is terminated.
If the program will not even respond to < ^ c >, then the user
should try < A z >. This command will exit immediately to the Unix
prompt. However, the user should note that the IAP program process
is left running. To terminate the process, the user should type
ps -gx at the Unix prompt. This command will give a list of
process id numbers and descriptions. Locate the IAP process and
note its id number (pid).
Now type kill -9 pid < Return > at the Unix
prompt where pid is the id number of the IAP process. This
command will terminate the process. Be careful when using the kill
command not to terminate the wrong process.
<
g>
The A g command provides the user with an alternative to
keyboard input. This feature, available in the majority of the
analysis routines, is used in conjunction with the Grinnell Display to
input data to menu prompts. In example, assume the user is
8
prompted to enter the position angle of a desired point. The user
would then use the joystick control, located at the Grinnell
terminals, to move the Grinnell cursor to the desired position angle
on the image. The Grinnell cursor consists of two intersecting lines
(crosshairs) with the exact cursor position indicated by the point of
intersection. With the desired angle specified on the image, the user
hits the < A g > command. The position angle specified on the image
is then automatically input to the menu prompt. More information on
< A g > input is given in section 3.1.
<
f>,<
b>
When using the Image Input/Output option to specify which
image files are to be worked on, the user may specify more than one
image. Of course, only one image file at a time may be worked on.
However, the program keeps track of the other specified image files.
The < A f > and < Ab > commands can then be used to move back and
forth along this list so that the user can quickly change the current
image file being worked on. < A f > moves forward one image file,
with respect to the order in which the files were originally loaded,
and loads this file into memory. If a Grinnell Display is being used,
the image is also displayed. < A b > simply moves backward one
image file. Since there is no specific prompt for using the < A f > and
< A b > commands, the user is allowed to use the commands when the
cursor is at any input prompt.
To maximize the effectiveness of the < A f > and < A b >
commands, the image file list is set up as a circular list. This
allows repeated use of either < A f > or < A b > without ever reaching
an "end" file. Upon reaching the last input file when using < A f> to
move forward within the list, the program simply recycles back to
the beginning input file. Likewise, the program moves from the
beginning input file to the last when using < ^ b >. See sections 3.1
and 3.4 for more information regarding the < A f >, < A b > commands.
2.3
On-line Help
This section will describe the on-line help feature of the IAP
program. Upon accessing the help feature, the user will be provided
with information pertaining to the appropriate sub-menu. This
information is simply a synopsis of the information provided in
chapter 3 and, therefore, should not be considered a substitute for
9
the user's manual. For most analysis routines, this includes a
description of the routine, prompt input ranges, output report and
graph filenames (if any), and features unique to the routine.
To access the help feature, the user simply types ? at any
input prompt.
Note that no < Return > is needed after the question
mark. Specific operation of the help feature depends on whether the
user accesses help from the main menu or a sub-menu. If the user
accesses help from the main menu, then a help menu appears on the
screen. This help menu is very similar to the program main menu.
Therefore, the user simply types in the number of the option desired,
and an appropriate help screen is displayed. Upon exiting the help
screen, by hitting the space bar, the help menu is again displayed.
The user may now choose another option or type 0 < Return > or
< Esc > to exit back to the main menu.
If the user accesses help from a sub-menu, then the help
screen for that particular sub-menu is immediately displayed. Upon
exiting the help screen, the user is returned to the same point at
which help was first accessed. Furthermore, any data input before
help was accessed will be retained.
Since no < Return > is needed
after the question mark to access help, the user may even access
help in the middle of inputting data to a prompt.
10
CHAPTER 3
3.1
IAP MENU OPTIONS
INTRODUCTION
This section will provide a foundation for utilizing the IAP
routines and in describing the layout of the manual as it pertains to
each sub-menu. The items discussed are broken down into the
following topics:
A.
B.
C.
A.
Image Data Information
Sub-menu Information
User's manual sub-menu format
Image Data
Figure 3.1a illustrates a Markll image file as displayed on a
Grinnell Display. This illustration is useful in describing certain
properties and conventions as apply to image files. First note that
any image point may be described in either Grinnell coordinates or
solar coordinates. Grinnell coordinates are comprised of a 512 x
512 X-Y plane with the origin lying at the lower, left-hand corner of
the display. For reference, the exact center of a MarkIll image lies
at coordinate (263.5,263.5).
Solar coordinates are described by a solar radius and a
position angle. MarkIll image data lies between 1.0 and 2.18 solar
radii and 0 to 360 degrees. Note that the actual- inner radius of the
image tends to vary from image to image due to characteristics
found in the data recording instrument. It is important to note that
the position angle is defined with 0 degrees at the top of the image
or North cardinal point. The angle increases counterclockwise from
this point. The user should also note the respective positions of the
East and West cardinal points.
The image filename is located at the lower, left-hand corner
of the display and a vertical color bar is provided in the upper, lefthand area of the display. The color bar displays a color with respect
to the intensity it represents. The intensity represented increases
from the bottom to the top of the bar.
The user should also be aware that any image on the Grinnell
Display, at program exit, will be left displayed. This is normal
procedure in using the Grinnells. Therefore, do not be surprised,
11
when turning on the Grinnell Display, to see some type of image
present.
B.
Sub-menu Information
Figure 3.1b illustrates a generic sub-menu as displayed on the
terminal screen. The screen is divided into three windows: header
window, main window, and status window. The screen shown
represents the majority of the sub-menus, although a few do not
contain header windows. The header window is simply a reminder to
the user of the <
A
f >, < A b >, < Esc > and help ( "?" ) commands. The
presence of a header window may also be used as an indicator that
the < A f > and < A b > commands may be accessed. The < Esc > and "?"
commands, however, may be used in any sub-menu, regardless of
whether the sub-menu contains a header window or not.
The main window contains the name of the routine at the top,
a brief description of the routine, and any input prompts. It may
also contain a reminder of being able to use the
<
A
g > command to
input data, if applicable. Input prompts are numbered and the cursor
will usually appear at the end of the first prompt. If any data,
besides input data, is returned to the screen by the routine, it will
appear in the area below the input prompts. Procedural information,
such as pressing < Space > to continue, is displayed at the bottom of
the main window when appropriate.
Data entry is made either through the keyboard or as a result
of using the Grinnell cursor (joystick) and the < A g > command. If
the keyboard is used, then a < Return > at the end of the prompt will
enter the data and move the cursor on to the next prompt. The user
may edit the data anytime before pressing the < Return > key, but
may not move back afterwards.
When entering the last prompt, the
< Return > will enter the data and immediately start to execute the
routine.
If a Grinnell display is being used, then the user may enter
data by using the <
A
g > command. With the cursor at the appropriate
prompt, the user moves the Grinnell cursor (crosshairs) by using the
joystick located on top of the terminal. The intersection of the
crosshairs indicates the exact position which will be referred to by
the program. Once the cursor is in the appropriate location on the
image, in terms of referring to a position which answers the prompt,
the user may hit <
A
g >. The prompt will now be filled in with the
12
appropriate value in terms of either position angle or solar radius.
Note that <
A
g > may also return two values, a position angle and a
solar radius, so that a second prompt is automatically filled in. The
cursor will then move to the next appropriate prompt. If the prompt
being filled in happens to be the last prompt, then the routine will
be executed immediately. The absence of the Grinnell cursor on the
display indicates that
<
A
g > may not be used for that particular
prompt.
There are a few features concerning the
<
A
g > command which
the user should be aware of. Upon entering an analysis routine, the
Grinnell cursor is always located in the center of the display. If the
routine is executed more than once ( multiple scans ), then at the
beginning of each new scan, the Grinnell cursor will be located at
the last point specified in the previous scan. Also, in most cases,
the Grinnell cursor must be located somewhere on the image to be
used. This is not necessarily true for specifying angles however. To
input an angle only, the user may also position the Grinnell cursor in
the portion of the display which is less than one solar radius (the
black disk in the middle of the display). If the cursor is exactly in
the center, then 360 degrees will be returned for the angle. Any
offset from the center will simply represent the normal angle
specified by that point. Despite this fact, the user is encouraged to
move the cursor to a point which is actually on the image.
The status window is used to display any error or status
messages. Most error messages regard incorrect input data whether
it be input by keyboard or through use of <
A
g >. Status messages are
used to keep the user apprised of what the program is doing. This is
especially useful when there is no noticeable activity on the
terminal screen. For instance, the program might display a message
that it was working on creating a report file. In some cases, the
status window may also contain an initial prompt which must be
answered before moving on to the regular prompts.
The user should also be aware of one other status window
feature. If a program error should occur, an error message may be
returned by the program in the status window. The format of the
message is as follows:
error message |
procedure where error occurred
If the user can recall this information, it will be much easier for the
13
person debugging the program to find the problem. Of course, the
user should also try to remember what was being done when the
program error occurred.
C.
User's manual sub-menu format
The method of describing specific details for each sub-menu is
accomplished by dividing the routine into four parts: function, input,
output, and notes. If the < A g > command can be used, then the input
section is divided into keyboard input and < ^ g > input. Prompt
constraints, as explained below, are also included where
appropriate.
The function section simply describes what the routine is to
be used for. Keyboard input describes, prompt by prompt, what the
user is to type in. Besides the description, a range of appropriate
values is also listed for each prompt. The <
A
g > input consists of a
value table and comments if the table is unclear. Prompt
constraints are included to clarify the relationships between the
input prompts. These constraints specify whether the values for one
prompt will affect the ability to input a certain value for another
prompt. The output section includes information on files, graphs, or
terminal screen data output by the routine. The notes section
includes any other information about the routine that the user should
know.
The < A g > value table is used to avoid lengthy descriptions of
< A g > options which might be somewhat confusing. A column of the
table represents the prompt where < ^ g > is used. A row of the table
represents the prompt itself. Values within the table represent
conditions which are true about the prompts and/or the ability to
use < A g > at that prompt. The easiest way to explain the table is
through example. The following table represents the < A g > input for
the line scans menu option.
Prompt number where
<
1. Beginning solar radius? t
2. Beginning position angle? I
3. Ending solar radius?
I
A
g > is pressed.
1
2
3
4
5
V
V
-
K
V
-
V
K
-
14
4. Ending position angle?
|
-
-
V
V
5. Delta distance?
I
K
K
K
K
K/N
V - Value Returned, K - Keyboard Input, N - Not Applicable
The easiest way to read the table is columnwise. The first column
represents those conditions, regarding prompt input, which are true
or definite when
< Ag
> is used at the "Beginning solar radius?"
prompt. The first "V" in the column indicates that a value is
returned, as expected, for the "Beginning solar radius?" prompt. The
second "V" in the column indicates that a value is also returned for
the "Beginning position angle?" prompt. Therefore, when <
^
g > is
used at the "Beginning solar radius?" prompt, both the beginning
radius and the beginning position angle are returned at the same
time. The dashes following the second "V" indicate that nothing
definite can be said about the input to prompts 3 or 4. The last
value, a "K", indicates that the user must use the keyboard to input
data for the "Delta distance?" prompt.
The second column represents those conditions which are true
or definite when <
Ag
> is used at the second prompt, "Beginning
position angle?". The first value, a "K", indicates that the user must
use the keyboard to type in a value for the "Beginning solar radius?"
prompt. But why is this true? Well, if the user did not use the
keyboard for the first prompt, then the only other option would be to
use <
A
g >. However, as mentioned above, if <
Ag
> is used at the
first prompt, then values are returned for the first prompt and the
second prompt. Therefore, it would be pointless to discuss trying to
use the < A g > option at the second prompt, when it has already been
filled in. Consequently, the only way for the user to use < A g > at the
second prompt, is if the user types in the input to the first prompt
from the keyboard. Now, moving on to the next value in the column,
the "V" indicates that a value is returned for the "Beginning position
angle?" prompt as expected. As before, the only other definite
condition about the rest of the prompts is that the keyboard must be
used for input to the "Delta distance?" prompt.
The third column represents those conditions which are true or
definite when <
Ag
> is used at the third prompt, "Ending solar
radius?". The two beginning dashes indicate that nothing definite
can be said about the first or second prompts with regard to using
< A g > at the third prompt. The first "V" in the column indicates that
a value is returned for the "Ending solar radius?" prompt. The
15
following "V" indicates that a value is also returned for the "Ending
position angle?" prompt. The "K" indicates again, that the "Delta
distance?" input must be typed in from the keyboard. These
conditions are analogous to using <
^
g > at the first prompt.
The fourth column represents those conditions
or definite when < A g > is used at the fourth prompt,
angle?". These conditions are analogous to those for
prompt. Nothing definite can be said about the first
which are true
"Ending position
the second
two prompts.
The user must use the keyboard to input data to the "Ending solar
radius?" prompt. As expected, a value is returned for the "Ending
position angle?" prompt and, as before, the "Delta distance?" input
must be typed in from the keyboard.
The fifth column represents those conditions which are true or
definite when < ^ g > is used at the fifth prompt, "Delta distance?".
It has been noted in the previous prompt conditions that the "Delta
distance?" input must be typed in from the keyboard. Therefore, it
should be no surprise that the user is not allowed to use the
<
A
g
>
command at this prompt. The "K/N" value in the column indicates
that the keyboard must be used to fill in the delta distance and that
the <
Ag
> command is not applicable to this prompt.
Hopefully, the user now has a good idea of how the table is
used. The user should also be aware that although the input has been
separated into keyboard and
exclusive.
<
A
g > input, the two are not mutually
In fact, a good way to see all the possible combinations
of the two types of input, is to substitute all the dashes in a <
Ag
>
table with a "K".
The last item of discussion regards the output of graphs.
Depending on whether they have been specified in the Setup of
Parameters and Options menu, data graphs may be produced for Line,
Radial, and Angle scans. In general, these graphs will represent a
plot of image intensity versus data position. The following
information is relevant to any graph produced and is therefore
included in this section, rather than in the specific sub-menus.
For a graph to be produced, there must be a minimum of two
data points and a maximum of 1270. If graphs with a single curve
have been specified, then the graph will appear on the screen after
the scan is completed. If graphs with n curves have been specified,
then the graph will appear after n scans are completed. The user
16
has the option of saving either type of graph by typing y < Return >.
Although a message in the status window reminds the user of this
before the graph is displayed, the user should wait until the graph is
finished before deciding to save. The saved graph will be placed in a
file named imagefilename.meta, where imagefilename is the name
of the current image being worked on. The file will be located in the
same directory as the image file. If the user does not want to save
the graph, a simple < Return > will bring back the appropriate scan
menu.
17
3.2
Exit Option
Function:
Allows user to exit from IAP program.
Operation: User simply types 0 < Return > at main menu prompt.
User will be notified that program is ending through a message in
the status window.
Comments: Pressing < Esc > at main menu will also allow the user to
exit from the IAP program. < ^ c > and < A z > provide emergency exit
options. See section 2.2 for more information.
18
3.3
Setup of Parameters and Options
Function:
Allows user to setup various IAP program parameters.
Operation:
INPUT:
All boldface items located in parentheses are default values.
These values will be selected if nothing but a < Return > is issued at
the prompt.
Initial Prompt:
Read SETUP from a file? (y/n)
The user types y for yes, n for no to indicate whether or not setup
parameters should be read from a previously created file. The file is
initially created by responding positively to prompt number 11 in
this menu (See below). If the user chooses to read from a file, then
the filename will be prompted for in the status window. After the
user types in a valid filename, which may include a path, the
appropriate parameters will be set and the program will
automatically exit to the main menu. If the user chooses not to use
a file setup, then the program will proceed to the following prompts.
1. Will the Grinnell be used? (y/n)
User types y for yes, n for no. Indicates whether or not a Grinnell
display is to be used to display images. If user chooses not to use a
Grinnell, cursor skips to prompt number 6.
2. If so, which Grinnell? (0-1)
User types 0 if Grinnell 0 is being used or 1 if Grinnell 1 is being
used.
3. Which channel will be used for the image? (1-3)
User types 1, 2, or 3 to select the Grinnell memory channel to be
used in displaying the image. As the IAP program currently stands,
there is no functional difference between any of the channels.
4. Which channel will be used for overlay? (8-11)
User types 8, 9, 10, or 11 to select the overlay channel to be used.
This overlay channel will be used to display analysis scans on top of
the image. By simply erasing the overlay channels, the program
allows the user to perform a variety of analysis routines on the
same image without having to reload the image for each routine.
Each overlay channel is associated with a particular color as
19
follows:
8--Blue, 9--Green,10--Red, 11--White.
5. Erase overlay between? (s/cans or i/mages or n/either)
This option allows the user to select when the overlay channels
should be erased. If the user types s, the overlay channels will not
be erased until the user moves to a different analysis scan. If the
user types i, the channels will not be erased until a new image is
loaded. If n is typed, the overlay channels will not be erased at all.
6. Should graph(s) be produced on line, radial, and angle scans?
(y/n)
User types y for yes, or n for no to select whether or not graphs
should be produced when performing line, radial, or angle scans. If
yes, then a line graph will be plotted and displayed on the terminal
screen each time one of the mentioned scans is executed. The user
also has the option to save any of the graphs produced in a metacode
file. The abscissa and ordinate values and relationships are
dependent on the specific scan being performed. See sections 3.5
Line Scans, 3.6 Radial Scans, and 3.7 Angle Scans for specific graph
information. If user elects not to produce graphs, cursor will skip
to prompt number 9.
7. If so, do you want multiple curves per plot? (y/n)
User types y for yes, or n for no to select whether or not multiple
curves should be done per each plot. This option allows the user to
display the results of multiple scans upon a single graph. The user
will specify the number of curves to plot through prompt number 8.
In the case of multiple curves, the graph will not be produced on the
terminal screen until the specified number of scans are completed.
The user may still elect to save the produced graph to a metacode
file. The user should note that when using multiple curves, the delta
distance should be kept the same for each scan. The user will
probably want to use the same analysis routine for each of the scans
also. If the user chooses to switch between analysis routines, the
graph labels pertinent to the first scan will be used in the resulting
graph. If the user chooses not to use multiple curves, the cursor
will skip to prompt number 9.
8. If so, what is the maximum number of curves per plot? (2-6)
User types number between 2 and 6 inclusive. As mentioned above,
this option allows the user to specify how many curves per plot
should be done. Although the number specified is the maximum
number of curves allowed, it also represents the minimum number of
20
scans the user must perform before a graph is displayed on the
terminal screen.
9. Produce report files of the positions and intensities? (y/n)
User types y for yes, n for no to specify whether report files should
be produced. These report files allow the user to record results
from each analysis routine to a file. Each analysis routine, with the
exception of image difference, is associated with a distinct report
filename. This filename is derived by adding the image filename to a
distinct suffix. For example, a radial scan performed on the image
17:20.srq would produce a report file named 17:20.srq.rad. This file
would be produced in the directory where the image file is located.
As each scan is completed, the results are simply appended to the
report file. Therefore, multiple scans may be recorded without
having to specify a filename for each scan. Multiple scan results,
within the same analysis routine, are kept separate by a header line
placed at the beginning of each set of scan results.
The results recorded in the report files vary from routine to
routine, but in general the following items are included for each
scan data point: Grinnell x and y coordinates, actual image
coordinates in terms of degrees and solar radii, and intensity values.
Refer to specific analysis routine sections for more information on
report contents and filenames.
10. How are intensities to be displayed?
(n/earest pixel or w/eighted pixel)
User types n for nearest pixel calculation or w for weighted pixel
calculation. This option allows the user to specify how the
intensity for a particular data point will be calculated. The two
methods affect the exact location which will be used to determine
the intensity. If the user specifies nearest pixel intensities, then
the intensity of the pixel closest to the data point is used. If
weighted intensities are used, then the intensities of the four
nearest pixels are weighted according to their distance from the
desired data point. The summation of these weighted intensities is
then used as the final intensity value.
11. Should these parameters be saved for future use? (y/n)
User types y for yes, n for no to specify whether or not the
responses to the prompts found in this menu should be saved to a
file. By saving these responses, the user may quickly setup the
program in future uses of the program. The program will not prompt
for a filename until the < Esc > key has been pressed to exit from
21
this menu. At that time, the user may type in any valid Unix
filename including a path if so desired. The user may then use this
file on future occasions, or perhaps within the same running of the
program, to quickly initialize the setup parameters. This is
accomplished through the initial prompt which is described above.
It should be noted that when the file is created, it is written in
binary format. However, an ascii file is also created so that the
user may directly read the file. This file simply contains the
responses to the various prompts in this menu. The filename for
this ascii file will be composed of the original filename plus a .ascii
suffix. For example, if the user saved the responses to a file named
HAOsetup, then a file named HAOsetup.ascii would also be created.
12. Convert to physical mass density and pB? (y/n)
This option is not currently implemented within the lAP program. In
the future, calibration information located at the beginning of the
image file will be used to convert raw image data to real physical
parameters such as pB, density, and mass.
OUTPUT:
Output is limited to any binary file created through option
number 11. An ascii version of this same file is also created. These
files will be located in the user's current directory unless a path is
specified.
NOTES:
Use of the Setup menu can be divided into four situations
which are described below:
22
1. The user, at any point of program execution, moves to the
Setup menu and chooses to read the setup parameters from a
previously defined file. This is discussed in the input section under
initial prompt and option number 11. It is important to note that
once the filename and a < Return > have been input, the program sets
the appropriate parameters and immediately exits to the main menu.
2. The user moves to the Setup menu for the first time,
changes a few parameters, then hits the < Esc > key. In this case,
the program will retain any parameters which were typed in and
assume default values for the rest of the parameters which were
skipped. Since the < Esc > key was pressed, the program exits to the
main menu as expected.
3. The user moves to the Setup menu for the first time and
sets all the appropriate parameters through prompt number 12. At
this time, the cursor will move back to prompt number 1 and the
following message will be displayed in the status window:
Use < Return > to retain current value.
All SETUP values defined, < Esc > when finished.
The user may now, using the < Return > key, move through the list of
options as many times as needed and edit any previously input
values. Note that the cursor moves back to prompt number 1, not the
initial prompt. To get back to the initial prompt ( Read SETUP from
a file?), the user must < Esc > out of the Setup menu and then
reselect the Setup menu.
When all parameters are set correctly, the
user simply hits the < Esc > key to implement the options and move
back to the main menu.
4. The user moves to the Setup menu at some point during
program execution, after having used the Setup menu at least once
before. The menu no longer displays default values in boldface. The
same status message displayed in situation 3 is displayed once
again. Current values for the parameters will be those defined the
previous time the menu was used. That is the reason no default
values are highlighted. When the < Return > key is pressed at an
option, the current value will be typed next to the prompt.
To see
all of the current values then, the cursor must be moved through the
complete menu using the < Return > key. Upon reaching the end of the
menu, the cursor moves back to prompt number one. Operation is
now the same as in situation 3 above.
23
3.4
Image
Input/Output
Function: Allows user to specify which image file or image file
list is to be worked on.
Operation:
INPUT:
User should use the < Return > key to move between the two
prompts. The menu will not exit until the < Esc > key is pressed. No
default values are defined for either prompt.
1. Image filename?
User types in a single filename of a MarkIll image to be worked on.
The program will search for the file in the current directory unless
the user includes a specific path along with the filename. The user
may use this prompt repetitively to specify as many files as desired.
All files specified will be used to create an internal list. This list
can then be accessed using the <
^
f >, <
^
b > commands. The first
file specified will also be automatically loaded into memory and, if
a Grinnell is being used, displayed on the Grinnell. Successive files
will be added to the internal list, but not loaded into memory or
displayed until accessed through the <
A
f >, <
A
b > commands. Note
that the internal list created through this process is only kept
active through the execution of the program. There are currently no
provisions to save this list to a file.
2. Image list filename?
User types in a single filename of a previously created file
containing a list of MarkIll image filenames. The program will
search for the file in the current directory unless the user includes
a specific path along with the filename. This option allows the user
to compile a list of MarkIll image filenames into one file, and then
use this file to input all the images at one time. The creation of
this file must be done outside the IAP program using an editor or
other such source. The file itself should contain one image filename
per line and the filename may include a path.
The program will read through the file, adding each filename to
its internal list. This internal list can then be accessed through the
<
A
f >, <
A
b > commands. The first filename will automatically be
loaded into memory and, if a Grinnell is being used, displayed on the
Grinnell. If the program should encounter any unreadable files, it
will simply display a short warning message and move on to the next
file. Unlike prompt number 1, successive use of this option will
24
delete any previously created internal list. Therefore, the user may
not use this option to create an internal list of lists.
OUTPUT:
No output files are created through the use of this menu option.
NOTES:
The internal list, described above, is a crucial component of
the IAP program. Once this list is defined, the user may use the
<
A
f > and
<
A
b > commands to move forward and backward within the
list and thereby set the current image to be worked on. The value of
this feature lies in the fact that the user may use the < A f > and
< A b > commands within any analysis sub-menu. This eliminates the
need to constantly go back to the Image Input/Output sub-menu to
load a new image into memory. Of course, it is also possible to add
new image files to the list at any point during program execution.
There are currently no provisions to display the internal list, or to
save this list to a file.
To maximize the effectiveness of the <
A
f > and <
commands, the internal list is set up as a circular list.
A
b>
This allows
repeated use of either < A f > or < A b > without ever reaching an "end"
file. Upon reaching the last input file when using < A f> to move
forward within the list, the program simply recycles back to the
beginning. Likewise, the program moves from the beginning input
file to the last when using <
A
b >.
The user should be clear on one important distinction between
prompts number 1 and 2. Prompt number 2 always deletes any
previously defined internal list when it is used. Prompt number 1
does not delete previously defined lists, so this prompt should be
used when the user wants to expand an already defined list. The new
image file(s) will simply be added to the end of the list. The user
may make use of both prompts by starting with prompt 2 and then
adding successive files using prompt 1.
25
3.5
Line Scans
Function: An analysis routine which obtains the intensity of the
image as a function of position along an arbitrary straight line.
Operation:
KEYBOARD INPUT:
1. Beginning solar radius?
User types in solar radius of first line endpoint.
Range: 1.0 < x s 2.18
2. Beginning position angle?
User types in position angle of first line endpoint.
Range: 0.0 < x < 360.0
3. Ending solar radius?
User types in solar radius of second line endpoint.
Range: 1.0 < x < 2.18
4. Ending position angle?
User types in position angle of second line endpoint.
Range: 0.0 < x < 360.0
5. Delta distance?
User types in value for distance between each data point along the
line. This value will be in terms of solar radii. The intensity of the
image will be calculated at each of these data points.
Range: 0.0 < x < 2.0
<^g
> INPUT:
Prompt number where
<
1.
2.
3.
4.
5.
Beginning solar radius?
Beginning position angle?
Ending solar radius?
Ending position angle?
Delta distance?
I
I
|
|
I
g > is pressed.
1
2
3
4
5
V
V
K
K
V
K
V
V
K
K
V
K
K/N
V - Value Returned, K - Keyboard Input, N - Not Applicable
26
PROMPT CONSTRAINTS:
In keeping with the function specification of an arbitrary line,
there are no constraints on the prompt values besides the normal
range for each prompt. The following prompt values are valid:
1. The beginning solar radius may be greater than or less than
the ending solar radius.
2. The beginning position angle may be greater than or less
than the ending position angle.
OUTPUT:
If reports have been specified in the Setup option, a file named
imagefilename.line will be produced where imagefilename is the
current image file being worked on. This report file will be located
in the same directory as the image file. The file will contain
Grinnell x, y coordinates, solar coordinates, and pixel intensities for
each data point in the scan, written in table form. If more than one
line scan is performed, the successive data point information will
simply be appended to the file and separated from other scans by a
header line.
If graphs have been specified in the Setup option, then a graph
of image intensity versus distance along the line will be plotted.
The distance will be in terms of solar radii. Any resultant graph is
in accordance with the constraints and procedures described in
section 3.1.
27
3.6 Radial Scans
Function: An analysis routine which obtains the intensity of the
image as a function of position along an arbitrary radius.
Operation:
KEYBOARD INPUT:
1. Beginning solar radius?
User types in solar radius of beginning radial line endpoint.
Range: 1.0< x s 2.18
2. Ending solar radius?
User types in solar radius of ending radial line endpoint.
Range: 1.0
.
x < 2.18
3. Position angle?
User types in position angle of radial line.
Range: 0.0 < x < 360.0
4. Delta distance?
User types in value for distance between each data point along the
radial line. This value will be in terms of solar radii. The intensity
of the image will be calculated at each of these data points.
Range: 0.0 < x < 2.0
<^g > INPUT:
Prompt number where
<
A
g > is pressed.
1
2
3
4
V
-
K
V
-
K
K
K/N
1. Beginning solar radius?
2. Ending solar radius?
3. Position angle?
I
|
V
V
4. Delta distance?
I
K
V - Value Returned, K - Keyboard Input, N - Not Applicable
PROMPT CONSTRAINTS:
In keeping with the function specification of an arbitrary line,
there are no constraints on the prompt values besides the normal
range for each prompt. The following prompt values are valid:
28
1. The beginning solar radius may be greater than or less than
the ending solar radius.
OUTPUT:
If reports have been specified in the Setup option, a file named
imagefilename.rad will be produced where imagefilename is the
current image file being worked on. This report file will be located
in the same directory as the image file. The file will contain
Grinnell x, y coordinates, solar coordinates, and pixel intensities for
each data point in the scan, written in table form. If more than one
radial scan is performed, the successive data point information will
simply be appended to the file and separated from other scans by a
header line.
If graphs have been specified in the Setup option, then a graph
of image intensity versus distance along the radius will be plotted.
The distance will be in terms of solar radii. Any resultant graph is
in accordance with the constraints and procedures described in
section 3.1.
NOTES:
The user should note that regardless of the relative values of
the beginning and ending solar radii, the scan will always be
produced from the innermost radius to the outermost radius. The
outermost point of the specified radial line may or may not be
included in the scan, depending on whether or not there are an
integral number of delta units contained within the length of the
line.
29
3.7
Angle Scans
Function: An analysis routine which obtains the intensity of the
image as a function of position along an arbitrary arc held at a
constant solar radius.
Operation:
KEYBOARD INPUT:
To define an arc, the user must specify the beginning and
ending position angles of the arc endpoints and a solar radius at
which the arc will be drawn.
1. Solar radius?
User types in solar radius at which arc will be drawn.
Range: 1.0 < x< 2.18
2. Beginning position angle?
User types in position angle of first arc endpoint.
Range: 0.0 < x < 360.0
3. Ending position angle?
User types in position angle of second arc endpoint.
Range: 0.0 s x < 360.0
4. Delta distance?
User types in value for distance between each data point along the
arc. This value will be in terms of degrees. The intensity of the
image will be calculated at each of these data points.
Range: 0.1 < x
.
lending position angle - beginning position anglel
<^g > INPUT:
Prompt number where
< ^ g > is pressed.
1
2
3
4
1. Solar radius?
V
-
-
-
2. Beginning position angle?
-
V
-
-
3. Ending position angle?
I
-
-
V
4. Delta distance?
I
K
K
K
K/N
V - Value Returned, K - Keyboard Input, N - Not Applicable
30
PROMPT CONSTRAINTS:
In keeping with the function specification of an arbitrary arc,
there are no constraints on the prompt values besides the normal
range for each prompt. The following prompt values are valid:
1. The beginning position angle may be greater than or less
than the ending position angle.
OUTPUT:
If reports have been specified in the Setup option, a file named
imagefilename.ang will be produced where imagefilename is the
current image file being worked on. This report file will be located
in the same directory as the image file. The file will contain
Grinnell x, y coordinates, solar coordinates, and pixel intensities for
each data point in the scan, written in table form. If more than one
angle scan is performed, the successive data point information will
simply be appended to the file and separated from other scans by a
header line.
If graphs have been specified in the Setup option, then a graph
of image intensity versus distance along the arc will be plotted. The
distance will be in terms of degrees. Any resultant graph is in
accordance with the constraints and procedures described in section
3.1.
NOTES:
The user should note that regardless of the relative values of
the beginning and ending position angles, the scan will always be
produced counterclockwise from the specified beginning position
angle. In this way, the user is allowed to specify an ending angle
which is smaller than the beginning angle as is the case when
defining an arc which crosses the position angle of 0 degrees.
The point of the arc located at the ending position angle may or
may not be included in the scan, depending on whether or not there
are an integral number of delta units contained within the length of
the arc.
31
3.8
Positional
Information
Function: An analysis routine which allows the user to position the
Grinnell cursor on a feature (a pixel) and return the coordinates and
intensity of that pixel. Two sets of coordinates are returned, one in
terms of Grinnell x, y coordinates, and the other in terms of solar
radii and position angle.
Operation:
KEYBOARD INPUT:
While this particular routine is designed to take advantage of
the Grinnell cursor and
< Ag
> features, keyboard input is allowed.
The nearest pixel to the position specified will be chosen and solar
coordinates and intensity returned. If a Grinnell is used, the
Grinnell cursor will move to the specified pixel.
1. Position angle?
User types in position angle of desired point.
Range: 0.0 < x s 360.0
2. Solar radius?
User types in solar radius of desired point.
Range: 1.0 < x < 2.18
<Ag > INPUT:
Prompt number where
<
1. Position angle?
2. Solar radius?
I
I
Ag
> is pressed.
1
2
V
V
K/N
K/N
V - Value Returned, K - Keyboard Input, N - Not Applicable
Acknowledging that this table may be somewhat confusing, the
values indicate that < Ag > may only be used at prompt number 1 and,
in doing so, returns values for both prompts. Consequentially, the
only other option for entering information is to type in responses to
both
prompts.
32
PROMPT CONSTRAINTS:
There are no constraints on prompt values besides the normal
range for each prompt.
OUTPUT:
Besides prompt values (solar coordinates), Grinnell
coordinates and pixel intensity will be output to the terminal screen
for each positional routine executed. These values will be displayed
in the main window under the prompts.
If reports have been specified in the Setup option, a file named
imagefilename.pos will be produced where imagefilename is the
current image file being worked on. This report file will be located
in the same directory as the image file. The file will contain
Grinnell x, y coordinates, solar coordinates, and pixel intensity for
each data point analyzed, written in table form. If more than one
positional routine is performed, the successive data point
information will simply be appended to the file and separated from
other scans by a header line.
33
3.9
Line Lengths and Integration
Function: An analysis routine which returns the length of a
specified line in terms of solar radii. Optionally, the user may also
have the routine return the intensity as integrated along the length
of the line.
Operation:
KEYBOARD INPUT:
Initial Prompt:
Calculate integrated brightness? (y/n)
User types y for yes, n for no, or < Return > for default of no, to
indicate whether or not the integrated brightness of the line should
be calculated. This prompt will only appear when first entering the
menu option and will be located in the status window.
1. Beginning solar radius?
User types in solar radius of first line endpoint.
Range: 1.0 < x < 2.18
2. Beginning position angle?
User types in position angle of first line endpoint.
Range: 0.0 < x < 360.0
3. Ending solar radius?
User types in solar radius of second line endpoint.
Range: 1.0 < x < 2.18
4. Ending position angle?
User types in position angle of second line endpoint.
Range: 0.0 < x < 360.0
34
<Ag
> INPUT:
Prompt number where
<
1.
2.
3.
4.
Beginning solar radius? I
Beginning position angle? I
I
Ending solar radius?
I
Ending position angle?
A
g > is pressed.
1
2
3
4
V
V
-
K
V
-
-
-
V
V
K
V
V - Value Returned, K - Keyboard Input, N - Not Applicable
PROMPT CONSTRAINTS:
There are no constraints on prompt values besides the normal
range for each prompt. The following prompt values are valid:
1. The beginning solar radius may be greater than or less than
the ending solar radius.
2. The beginning position angle may be greater than or less
than the ending position angle.
OUTPUT:
Besides prompt values (solar coordinates), the line length and,
if calculated, integrated intensity will be output to the terminal
screen for each line length routine executed. These values will be
displayed in the main window under the prompts.
If reports have been specified in the Setup option, a file named
imagefilename.lin will be produced where imagefilename is the
current image file being worked on. This report file will be located
in the same directory as the image file. The file will contain
Grinnell x, y coordinates and solar coordinates of the line endpoints,
line length in terms of solar radii, and, if calculated, the integrated
intensity of the line. This data will be written in table form. If
more than one line length routine is performed, the successive line
information will simply be appended to the file and separated from
other scans by a header line.
35
3.10 Area Determination
and Integration
Function: An analysis routine which returns the area of a wedge in
terms of solar radius 2 and cm 2. Optionally, the user may also have
the routine return the image intensity as integrated within the
wedge.
Operation:
KEYBOARD INPUT:
Initial Prompt:
Calculate integrated brightness? (y/n)
User types y for yes, n for no, or < Return > for default of no, to
indicate whether or not the integrated brightness of the area should
be calculated. This prompt will only appear when first entering the
menu option and will be located in the status window.
1. Beginning solar radius?
User types in solar radius of first arc of wedge.
Range: 1.0
x < 2.18
2. Beginning position angle?
User types in position angle of first radial side of wedge.
Range: 0.0 < x < 360.0
3. Ending solar radius?
User types in solar radius of second arc of wedge.
Range: 1.0 < x < 2.18
4. Ending position angle?
User types in position angle of second radial side of wedge.
Range: 0.0 < x < 360.0
36
<^g > INPUT:
Prompt number where
<
1.
2.
3.
4.
Beginning solar radius? I
Beginning position angle? |
Ending solar radius?
|
Ending position angle?
g > is pressed.
1
2
3
4
V
V
-
K
V
-
V
V
K
V
V - Value Returned, K - Keyboard Input, N - Not Applicable
PROMPT CONSTRAINTS:
There are no constraints on prompt values besides the normal
range for each prompt. The following prompt values are valid:
1. The beginning solar radius may be greater than or less than
the ending solar radius.
2. The beginning position angle may be greater than or less
than the ending position angle.
OUTPUT:
Besides prompt values (solar coordinates), the area and, if
calculated, integrated intensity will be output to the terminal
screen for each area routine executed. These values will be
displayed in the main window under the prompts.
If reports have been specified in the Setup option, a file named
imagefilename.area will be produced where imagefilename is the
current image file being worked on. This report file will be located
in the same directory as the image file. The file will contain
Grinnell x, y coordinates and solar coordinates of the corner points
of the wedge, area in terms of solar radii squared and centimeters
squared, and, if calculated, the integrated intensity of the area.
This data will be written in table form. If more than one area
routine is performed, the successive area information will simply be
appended to the file and separated from other scans by a header line.
NOTES:
The user should note that regardless of the relative values of
the beginning and ending position angles, the wedge will always be
defined counterclockwise from the specified beginning position
angle. In this way, the user is allowed to specify an ending angle
37
which is smaller than the beginning angle as is the case when
defining a wedge which crosses the position angle of 0 degrees.
38
3.11 Image
Difference
Function: An analysis routine which takes the difference between
two existing image files. The resultant difference file may then be
used as any other image file might be.
Operation:
INPUT:
1. First image filename?
User types in existing image filename or < Return > to default to
currently loaded image. The file will be searched for in the current
directory unless a path is specified.
2. Second image filename?
User types in existing image filename or < Return > to default to
currently loaded image. The file will be searched for in the current
directory unless a path is specified. The image specified will be
subtracted from the image specified in prompt number 1.
3. Difference filename?
User types in new filename where the difference of the first two
images should be placed. The filename may be prefaced with a path.
This file may then be used as a normal image file.
OUTPUT:
Output consists of a new image
difference of two existing image files.
file is that specified in prompt number
the current directory, unless a path is
filename.
file which is the result of the
The filename of this new
3. The file will be located in
included along with the
NOTES:
This is the sole analysis routine which the user may use before
having specified an image file to work on. This is because the user
may wish to use the output file from this routine as the working
image file.
An important feature of this routine is that the output image
file is automatically added to the internal list described under
section 3.4 -- Image Input/Output. The user may then use the < A f >,
< A b > commands to load the file. If the file happens to be the first
file in the internal list, then it will be automatically loaded into
memory, and, if a Grinnell is being used, into the Grinnell display.
39
If the same filename is input for prompts 1 and 2, then a
warning message that the user is subtracting an image file from
itself will be displayed. Nevertheless, an output file will still be
created.
40
3.12 Define Macro
Function: Allows the user to record keyboard input while program
is being used. This recorded input, known as a macro, can then be
used as input to the program to achieve a certain level of program
automation.
Operation:
Input:
0.
1.
2.
3.
4.
Exit
Define macro
Execute macro
Save defined macro
Execute saved macro
Select MACRO option defined?
User types number between 0 and 4 inclusive to choose appropriate
option. The function of each option is as follows:
Exit
Option simply exits back to main menu.
Define Macro
When this option is chosen, a message will appear in the
status window indicating that the program is "remembering" or
ready to record keyboard input. The user may then use < Esc > to exit
back to the main menu. The user may now use the program as
normal* and the program will record all keyboard input. When all
routines to be recorded have been executed, the user should once
again select the Define Macro option. Upon selecting this option, a
message stating that a keyboard macro has been defined will appear
in the status window. This macro will be defined until the user
exits the program or defines a new macro. The user may then choose
options 2 or 3 to execute the macro or save it to a file.
Execute macro
This option is used to execute any macro which has been
defined since program startup. By executing a macro, the user is
telling the program that all input will now come from the recorded
information in the macro. Of course, one of the main benefits of
using a macro is the ability to execute the macro repeatedly.
41
Therefore, once this option has been chosen, the following prompt
will appear in the status window:
Number of times to execute macro? (1/100)
The user should enter a number between 1 and 100 inclusive or a
< Return > to default to 1, to indicate the number of times the macro
should be executed. Once this number is entered, the program will
simply use the recorded macro information for input. The same
routines used in defining the macro will be executed as many times
as the user has specified. Of course, it may be wise to execute the
macro a few times to be sure it is working as expected, before
specifying a large number.
Save defined macro
Recall that any defined macro is only valid until program end
or until a new macro is defined. However, the user may use this
option to save the defined macro to a file, so that it may be used in
the future. Assuming a defined macro exists, this option simply
displays the following prompt in the status window:
Save MACRO filename?
The user should type in a filename, including path if desired, which
macro will be saved to. The user may then use option 4 to execute
this saved macro in the future.
Execute saved macro
This option is used to execute any macro which has previously
been saved to a file. Upon choosing this option, the following
prompt appears in the status window:
Save MACRO filename?
The user should type in the filename, and path if necessary, of the
macro to be executed. Having entered a valid filename, operation
will proceed as described above for the execute macro option.
*
Note that <
A
g > input should not be used when defining a
macro. This is due to the fact that the program cannot keep track of
Grinnell cursor movement. Of course, the user can always run the
program, before defining the macro, using <
A
g > input and record all
values returned. Then the user can define a macro and simply type in
42
the values which were returned by the
<
A
g > command.
OUTPUT:
Output is limited to any file which is created through the use
of option 3, "Save defined macro."
NOTES:
Perhaps the greatest benefit of using a macro in the IAP
program, is the ability to perform identical analysis routines on
multiple images. The user can simply include a < f > or < A b >
command at the end of the analysis routines when defining the
macro. Each time the macro is run, a new image file will be loaded
at the end of the routines. This, of course, assumes that the user
has specified more than one image file in the Image Input/Output
option. The macro can then be run as many times as there are image
files to process.
If the user should need to stop the execution of a macro
sequence, < A c > should be used. The program will prompt the user
for confirmation to end the program and set the execution number
of the macro to zero. Therefore the user can then respond negatively
to the prompt and continue with the program. The user is advised to
try and hit the < A c > command at the end of a display menu. This is
to try and minimize any problems with the screen being improperly
displayed.
43
APPENDIX
45
MARK II Integrated Analysis Package
MAIN MENU
O. Exit
1. Setup of Parameters and Options
2. Image Input/Output
3. Line Scans
4. Radial Scans
5. Angle Scans
6. Positional Information
7. Line Lengths and Integration
8. Area Determi nation and Integration
9. Image Difference
10.Define Macro
Select the number of the option desi red?
Type '?'if you need
assistance.
IAP program main menu.
A.1
46
LINE SCAN
Two sample line scans. Note that data point
size has been exaggerated for illustration
purposes.
A.2
47
RADIAL SCAN
Two sample radial scans. Note that data point
size has been exaggerated for illustration
purposes.
A.3
48
ANGLE SCAN
Two sample angle scans. Note that data point
size has been exaggerated for illustration
purposes.
A.4
49
50
REFERENCES
Archuleta, S., and R. Beutner, "lAP MarkIII K-Coronameter Integrated Analysis Package Maintenance Manual." (July 1988)
Chalmers, J.W., "A User's Guide for the MK-III K-Coronameter Data System." (March
1985) NCAR Technical Note, NCAR/TN-247+IA.
51