1
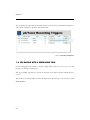
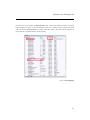
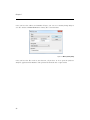
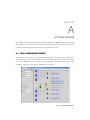
μC/Trace
TM
The RTOS Event Analyzer
User’s Manual
V1.0
Weston, FL 33326
Micriμm
1290 Weston Road, Suite 306
Weston, FL 33326
USA
www.micrium.com
Designations used by companies to distinguish their products are often claimed as
trademarks. In all instances where Micriμm Press is aware of a trademark claim, the product
name appears in initial capital letters, in all capital letters, or in accordance with the
vendor’s capitalization preference. Readers should contact the appropriate companies for
more complete information on trademarks and trademark registrations. All trademarks and
registered trademarks in this manual are the property of their respective holders.
Copyright © 2013 by Micriμm except where noted otherwise. All rights reserved. Printed in
the United States of America. No part of this publication may be reproduced or distributed
in any form or by any means, or stored in a database or retrieval system, without the prior
written permission of the publisher.
μC/Probe and the accompanying files are sold "as is". Micriμm makes and customer receives
from Micriμm no express or implied warranties of any kind with respect to the software
product, documentation, maintenance services, third party software, or other services.
Micriμm specifically disclaims and excludes any and all implied warranties of
merchantability, fitness for a particular purpose, and non-infringement. Due to the variety of
user expertise, hardware and software environments into which μC/Probe may be
subjected, the user assumes all risk of using μC/Probe. The maximum liability of Micriμm
will be limited exclusively to the purchase price.
600-uC-Trace-001
Table of Contents
Chapter 1
1-1
Introduction ............................................................................................ 5
μC/Trace System Overview ................................................................... 8
Chapter 2
2-1
2-1-1
2-1-2
2-1-3
2-1-4
2-2
2-3
μC/Trace Recorder Module ................................................................. 11
Including the μC/Trace Files in your C Project ................................... 13
Copy the μC/Trace files to your Micrium folder ................................. 13
Move the μC/Trace Configuration Template Files .............................. 13
Insert the μC/Trace files into your project .......................................... 13
Configure your Compiler’s Include Paths ........................................... 14
Including header files ........................................................................... 14
μC/Trace Functional Description ........................................................ 15
Chapter 3
3-1
3-1-1
3-2
3-2-1
Configuring μC/Trace ........................................................................... 19
Enabling or Disabling μC/Trace ........................................................... 19
os_cfg.h ................................................................................................ 19
Recorder Configuration Settings ......................................................... 19
trace_cfg.c/h ........................................................................................ 20
Chapter 4
Initializing μC/Trace ............................................................................. 25
Chapter 5
5-1
5-2
5-3
Instrumenting with μC/Trace ............................................................... 27
Kernel Service Calls ............................................................................. 27
Interrupt Service Routines ................................................................... 27
User-Defined Events ............................................................................ 28
Chapter 6
6-1
6-2
Recording with μC/Trace ..................................................................... 31
Start Recording with μC/Probe ........................................................... 31
Start Recording without μC/Probe ...................................................... 32
3
Chapter 7
7-1
7-2
Analyzing with μC/Trace ...................................................................... 33
Uploading with μC/Probe .................................................................... 33
Uploading with a Debugging Tool ....................................................... 34
Appendix A
A-1
A-2
A-3
A-4
A-5
μC/Trace Analysis ................................................................................ 37
Task Scheduling Events ...................................................................... 37
Semaphore Events ............................................................................... 38
Message Queue Events ....................................................................... 39
Mutex Events ....................................................................................... 40
Memory Partition Events ..................................................................... 41
Appendix B
Frequently Asked Questions (FAQs) ................................................... 43
Appendix C
Bibliography ......................................................................................... 49
4
Chapter
1
Introduction
μC/Trace is a set of runtime diagnostics tools for embedded systems based on μC/OS-III. By
simply including four C files into your project, μC/Trace gives you an unprecedented insight
into the runtime behavior, which allows for reduced troubleshooting time and improved
software quality, performance and reliability. Complex software problems which otherwise
may require many hours or days to solve, can with μC/Trace be understood quickly, often
in a tenth of the time otherwise required. This saves you many hours of troubleshooting
time. Moreover, the increased software quality resulting from using μC/Trace can reduce the
risk of defective software releases, causing damaged customer relations.
The insight provided by μC/Trace also allows you to find opportunities for optimizing your
software. You might have unnecessary resource conflicts in your software, which are "low
hanging fruit" for optimization and where a minor change can give a significant
improvement in real-time responsiveness and user-perceived performance. By using
μC/Trace, software developers can reduce their troubleshooting time and thereby get more
time for developing new valuable features. This means a general increase in development
efficiency and a better ability to deliver high-quality embedded software within budget.
μC/Trace provides more than 20 interconnected views of the runtime behavior, including
task scheduling and timing, interrupts, interaction between tasks, as well as user events
generated from your application as shown in Figure 1-1. μC/Trace can be used side-by-side
with a traditional debugger and complements the debugger view with a higher level
perspective, ideal for understanding the complex errors where a debugger’s perspective is
too narrow.
μC/Trace is more than just a viewer. It contains several advanced analyses developed since
2004, that helps you faster comprehend the trace data. For instance, it connects related
events, which allows you to follow messages between tasks and to find the event that
triggers a particular task instance. Moreover, it provides various higher level views such as
the Communication Flow graph and the CPU load graph, which make it easier to find
anomalies in a trace.
5
Chapter 1
μC/Trace does not depend on additional trace hardware, which means that it can be used in
deployed systems to capture rare errors which otherwise are hard to reproduce.
Figure 1-1 μC/Trace Analyzer Windows
The μC/Trace solution consists of three parts:
■
The PC application (μC/Trace Analyzer), used to analyze the recordings as shown in
Figure 1-1.
■
A trace recorder library (μC/Trace Recorder) that integrates with μC/OS-III, provided in
C source code.
■
Optionally, μC/Probe can be used to trigger and upload recordings from the target.
6
The μC/Trace Analyzer is a Windows application for the PC.
The μC/Trace Recorder stores the event data in a RAM buffer, which is uploaded on request
to the host PC using your existing debugger connection or μC/Probe.
And finally, you can use μC/Probe and a special control designed for μC/Trace called
μC/Trace Trigger Control, to trigger a recording and launch the μC/Trace Analyzer. The
μC/Trace Trigger Control is shown in Figure 1-2:
Figure 1-2 μC/Trace Trigger Control
μC/Probe is optional. If your platform is not supported by μC/Probe you can still use
μC/Trace.
7
Chapter 1
1-1 μC/TRACE SYSTEM OVERVIEW
μC/Trace is a set of tools designed to record and analyze trace data from an embedded
system. Figure 1-3 shows an overview of the entire system and data flow when used in
conjunction with μC/Probe.
Components surrounded by
the dotted line are OPTIONAL
Windows PC
ELF File
Running μC/Probe and
μC/Trace Analyzer
Symbol names
and addresses
(2)
ELF Header
Program Header
Table
.text
(3)
.rodata
...
(4)
.data
Section Header
Table
Trigger recordings
(6)
Memory
Dump
(7)
μC/Trace
Analyze recordings
Internet
[1]
TCP/IP
μC/Probe (optional)
RS-232
JTAG
(5)
(1)
Embedded System
Running μC/Probe-Target
and μC/Trace-Recorder
[2]
[1] Including LAN, WAN, etc.
[2] Target Resident Code is
only required if Triggers
enabled and with TCP/IP
and RS-232 interfaces
Figure 1-3 μC/Trace Data Flow Diagram
F1-3(1)
8
You start by creating trigger points in your embedded target application code.
Each part of your code that you want to record needs to call a single line
macro. μC/Probe is aware of all the trigger points you configured because you
will create a configuration table that lists all the available trigger points.
μC/Trace System Overview
F1-3(2)
You have to provide μC/Probe with an ELF file with DWARF-2, -3 or -4
debugging information. The ELF file is generated by your toolchain’s linker.
μC/Probe parses the ELF file and reads the addresses of each of the embedded
target’s symbols (i.e., global variables) including the memory address of the
buffer where the trace recording is stored. For more information on building
the ELF file, see the μC/Probe Target Manual.
Alternatively, you can also provide a chip definition file that contains the chip’s
peripheral register addresses or provide your own custom XML based symbol
file for those cases when your toolchain cannot generate one of the supported
ELF formats.
F1-3(3)
During design-time, you create a μC/Probe workspace using a Windows PC
and μC/Probe. You design your own dashboard by dragging and dropping
virtual controls and indicators onto a data screen. Each virtual control and
indicator needs to be mapped to an embedded target’s symbol by selecting it
from the symbol browser. However, for μC/Trace purposes, all you have to do
is drag and drop a μC/Trace Trigger control from the μC/Probe’s toolbox. Refer
to the document μC/Probe User’s Manual for more information on using the
μC/Trace Trigger control.
F1-3(4)
Before proceeding to the run-time stage, μC/Probe needs to be configured to
use one of the three communication interfaces: JTAG, RS232 or TCP/IP. In order
to start the run-time stage, you click the Run button and μC/Probe starts
making requests to read the value of all the memory locations associated with
each virtual control and indicator (i.e., all the trace trigger points you
programmed in the embedded target).
F1-3(5)
μC/Probe will display all the available trigger points and you can arm or disarm
each of them.
F1-3(6)
When the embedded application executes the part of your code delimited by
one of your armed trigger points, μC/Probe will take care of uploading the
recording and launching the analysis tools.
F1-3(7)
μC/Probe is optional. So, if your platform is not supported by μC/Probe, you
can still record and analyze traces with μC/Trace by creating a memory dump
file and loading it directly with the μC/Trace Analyzer.
9
Chapter 1
If you are unsure of which communication interface to use with μC/Probe, try the
communication options advisor in Figure 1-4:
J-Link is a USB-based JTAG emulator typically
available in-circuit or as an external probe for
debugging and flash programming purposes.
Do you have a J-Link available?
YES
J-Link allows you to run
μC/Probe without any
special embedded
target resident code.
It is also possible to run
μC/Probe concurrently
with your Debugger
Software by sharing the
J-Link connection.
NO
Do you have WiFi or an
ethernet port available
in your board?
YES
Download the
appropriate J-Link
drivers for your platform
from www.segger.com
YES
YES
Refer to the μC/Probe
Target Manual for
instructions on where to
download, include and
initialize the μC/Probe
target module for
μC/TCP-IP.
NO
Does your third-party
TCP/IP stack have
support for BSD
sockets?
YES
The μC/Probe target
module can be ported to
other TCP/IP stacks
including WiFi modules
very easily.
Refer to the μC/Probe
Target Manual for
instructions on how to
port the μC/Probe target
module for TCP-IP.
Is your embedded
development tool
Embedded Workbench
from IAR Systems?
YES
NO
You can purchase
Micriμm's μC/TCP-IP
stack. For more
information contact:
[email protected]
Is your TCP/IP
stack Micriμm's
μC/TCP-IP?
μC/TCP-IP comes
μC/Probe-ready.
All you need to do is
include a few C files
and call a function to
initialize the module.
This communication
interface yields one of
the fastest throughput
available.
NO
Do you have a running
TCP/IP stack in your
embedded target
code?
The Embedded
Workbench from IAR
Systems
is fully integrated with
μC/Probe
via a TCP/IP bridge
between C-SPY and
μC/Probe.
It is a great way to
expand the scope
level of your
debugging experience
from the C
implementation level
provided by C-SPY to
the system level
provided by μC/Probe.
NO
Does your board
include an
RS-232 port?
YES
Refer to the μC/Probe
User's Manual for
instructions on how to
use the C-SPY plugin
for μC/Probe.
Is your embedded
development IDE
based on Eclipse?
YES
There is an Eclipse
plugin for μC/Probe that
creates a TCP/IP
bridge between the
GDB debugger and
μC/Probe (unlike the
rest of communication
interface options this
interface is not
real-time and the
updates are only made
by halting the CPU).
NO
Unless you can
modify your TCP/IP
stack to provide
UDP sockets for
typical functions
such as open(),
read() and write(),
you cannot use your
ethernet port or WiFi
module with
μC/Probe.
NO
The μC/Probe
module can be
ported to any UART
and hundreds of
them are already
available from
Micriμm at no cost.
Refer to the μC/Probe
Target Manual for
instructions on where
to download, port,
include and initialize
the μC/Probe target
module for RS-232.
Download the Eclipse
plugin for μC/Probe
from www.micrium.com
NO
Unfortunately your
platform setup is not
supported by μC/Probe
at this time.
In order to have your
platform included in our
development schedule,
please send us an
e-mail to
[email protected]
Figure 1-4 Communication Options Advisor
This document will describe how to use μC/Trace by discussing the following topics:
■
Including the μC/Trace supporting code in your embedded target
■
μC/Trace Triggers Functional Description that includes the following topics:
10
■
Configuring and Initializing μC/Trace in your embedded target
■
Instrumenting your embedded target code with μC/Trace Triggers
■
Triggering and analyzing recordings from a μC/Trace Trigger control for μC/Probe.
Chapter
2
μC/Trace Recorder Module
The μC/Trace Recorder module is the set of C files that reside on the embedded target and
implement the events triggering and recording mechanism. The files are available at
http://micrium.com/trace and this chapter aims at providing a brief introduction to the files.
Micrium
ͷͻͻͻSoftware
ʹͻͻͻEvalBoards
ͱͷͻͻͻ[Sem
miconductorN
Name]
ͱͷͻͻͻ
ͻ[BoardReferenceNumber]
ͱͷͻͻͻ[ProjectName]
ͱos_
_cfg.h
ͱ
ͱ
ͷͻͻͻuCŞTrace
ʹͻͻͻRecorders
ͱͷͻͻͻ
ͻPercepio
ͱʹͻͻͻOS
ͱͱͷͻͻͻuCOSŞIII
ͱͱtrace_os.h
ͱͱ
ͱͷͻͻͻTraceRecorderLibrary
ͱͱtrcBase.c
ͱͱtrcHardwarePort.c
ͱͱtrcKernel.c
ͱͱtrcUser.c
ͱͱ
ͱʹͻͻͻCfg
ͱͱtrcConfig.h
ͱͱtrcHardwarePort.h
ͱͱ
ͱʹͻͻͻInclude
ͱͱtrcBase.h
ͱͱtrcKernel.h
ͱͱtrcKernelHooks.h
ͱͱtrcTypes.h
ͱͱtrcUser.h
ͱͱ
ͱͷͻͻͻKernelPorts
ͱͷͻͻ
ͻͻuCOSŞIII
ͱtrcKernelPort.c
ͱtrcKernelPort.h
ͱ
ʹͻͻͻSource
ͱtrace.c
ͱtrace.h
ͷͻͻͻCfg
trace_cfg.c
trace_cfg.h
FilesttoEdit
(1)
(2)
(3)
(4)
(5)
(6)
(7)
(8)
Figure 2-1 μC/Trace C Files
11
Chapter 2
F2-1(1)
Somewhere in your application level code (typically os_cfg.h) you have to
define the macro TRACE_CFG_EN as 1 to enable μC/Trace.
F2-1(2)
μC/Trace is designed to work with third-party trace recorders such as the one
developed by a Swedish company called Percepio AB. An OS layer defined in
trace_os.h allows you to use any of the supported third-party recorders
without any changes to your application code.
F2-1(3)
The core source files for the trace recorder library by Percepio.
F2-1(4)
A couple of files allow you to configure the size of the RAM buffer and the
hardware clock among other settings as described in Chapter 3, on page 20.
F2-1(5)
The core header files for the trace recorder library by Percepio.
F2-1(6)
The kernel port that implements how to record the kernel events.
F2-1(7)
The source files for μC/Trace and the optional μC/Trace Triggering mechanism.
F2-1(8)
The configuration files for μC/Trace and the optional triggering mechanism.
Typically you move these files to the same location where your application
level code is, as described in Chapter 3, “trace_cfg.c/h” on page 17.
12
Including the μC/Trace Files in your C Project
2-1 INCLUDING THE μC/TRACE FILES IN YOUR C PROJECT
μC/Trace requires μC/OS-III version 3.04.01 or newer and the files described in the previous
section and shown in Figure 2-1.
In case you have a μC/OS-III based project and want to include μC/Trace in it, the next
sections describe the steps involved.
2-1-1 COPY THE μC/TRACE FILES TO YOUR MICRIUM FOLDER
Download the μC/Trace files from http://micrium.com/trace and copy the entire
$/Micrium/Software/uC-Trace folder shown in Figure 2-1 into your own
$/Micrium/Software folder.
2-1-2 MOVE THE μC/TRACE CONFIGURATION TEMPLATE FILES
Move (Cut+Paste) the following files to the folder where you keep the rest of your
application level configuration files (i.e. app_cfg.h):
$\Micrium\Software\uC-Trace\Cfg\trace_cfg.c
$\Micrium\Software\uC-Trace\Cfg\trace_cfg.h
2-1-3 INSERT THE μC/TRACE FILES INTO YOUR PROJECT
Some IDEs such as Eclipse do not require you to specify which files to compile by inserting
each file in your project. But, other IDEs will require you to add the following files into your
project:
$\Micrium\Software\uC-Trace\Source\trace.c
$\Micrium\Software\uC-Trace\Source\trace.h
$\Micrium\Software\uC-Trace\Cfg\trace_cfg.c
$\Micrium\Software\uC-Trace\Cfg\trace_cfg.h
13
Chapter 2
2-1-4 CONFIGURE YOUR COMPILER’S INCLUDE PATHS
Configure your compiler’s include paths with the following:
$\Micrium\Software\uC-Trace\Source
$\Micrium\Software\uC-Trace\Recorders\Percepio
$\Micrium\Software\uC-Trace\Recorders\Percepio\OS\uCOS-III
$\Micrium\Software\uC-Trace\Recorders\Percepio\TraceRecorderLibrary
$\Micrium\Software\uC-Trace\Recorders\Percepio\TraceRecorderLibrary\Cfg
$\Micrium\Software\uC-Trace\Recorders\Percepio\TraceRecorderLibrary\Include
$\Micrium\Software\uC-Trace\Recorders\Percepio\TraceRecorderLibrary\KernelPorts\uCOS-III
2-2 INCLUDING HEADER FILES
Additionally, each C file that makes use of μC/Trace, whether it is for Initialization or
Instrumentation purposes (i.e. app.c), needs to include the following header files by using
the preprocessing directive #include:
#include
#include
"trace.h"
"trace_cfg.h"
Listing 2-1 Including μC/Trace header files
14
μC/Trace Functional Description
2-3 μC/TRACE FUNCTIONAL DESCRIPTION
Figure 2-2 shows the block diagram of the entire system including the trace recording
module in the target code and μC/Probe and μC/Trace in the host system. The entire
operation can be described in 10 steps.
(5)
(1)
(3)
(8)
(2)
(4)
(6)
(7)
(9)
(10)
Figure 2-2 μC/Trace Block Diagram
15
Chapter 2
F2-2(1)
The first step to get started with μC/Trace is enabling the module in the
configuration file for μC/OS-III (os_cfg.h) through the definition of the macro
TRACE_CFG_EN set to 1.
The second step is optional and available only if your platform is supported by
μC/Probe. If so, in this configuration stage you get to define the trigger points
in the table declared in trace_cfg.c as shown in Listing 2-2:
/*
********************************************************************************
*
UC/TRACE TRIGGERS IDS
********************************************************************************
*/
#define
#define
#define
TRACE_CFG_TRIG_ID_SW1
TRACE_CFG_TRIG_ID_SW2
TRACE_CFG_TRIG_ID_ISR_RS232_RX
1234u
1235u
1236u
/*
********************************************************************************
*
UC/TRACE TRIGGERS CONFIGURATION TABLE
********************************************************************************
*/
const TRACE_CFG_TRIG TraceCfgTrigTbl[] =
{
{TRACE_CFG_TRIG_ID_SW1,
"Task # 1 (SWITCH 1)",
3},
{TRACE_CFG_TRIG_ID_SW2,
"Task # 2 (SWITCH 2)",
3},
{TRACE_CFG_TRIG_ID_ISR_RS232_RX, "RS-232 Rx ISR (SWITCH 3)", 1}
};
Listing 2-2 μC/Trace Triggers Configuration Table
The first parameter is the trigger ID, the second parameter is the name of
trigger and the third parameter is the number of recordings you want to capture
before disarming the trigger automatically.
Once you have the trigger IDs configured, you can start instrumenting your
code by simply calling the macro TRACE_TRIG() with the trigger ID as a
parameter wherever you want to start recording.
F2-2(2)
16
You initialize the μC/Trace module by calling the macro TRACE_INIT().
μC/Trace Functional Description
If you are not planning to use μC/Probe to trigger recordings, then you will
also need to call the macro TRACE_START() to start recording.
F2-2(3)
You initialize the optional μC/Trace Triggers module by calling the function
TraceTrigInit() which is declared in trace.c.
F2-2(4)
The user interface for μC/Trace Triggers is μC/Probe. Once you get μC/Probe
communicating with your target as described in the μC/Probe documentation
you can create a workspace that contains the μC/Trace Trigger control found in
the μC/Probe toolbox. This control, allows you to not only arm and disarm the
recording triggers in your target but also upload the recording and launch the
μC/Trace Analyzer Windows application.
In this step, the user would arm one or more of the trigger points.
F2-2(5)
As soon as the part of your target code reaches the point where the
TRACE_TRIG() macro gets executed, the system will start recording.
F2-2(6)
All the kernel events will be recorded into RAM.
F2-2(7)
The events get recorded into RAM by using a special encoding that takes 4
bytes per event.
F2-2(8)
As soon as the recording gets stopped either because your application calls the
TRACE_STOP() macro or the RAM buffer gets full, the μC/Trace Triggers
module gets notified by the recorder.
F2-2(9)
In turn, the μC/Trace Triggers module notifies μC/Probe that the recording is
finished.
F2-2(10)
μC/Probe and its μC/Trace Triggers control in particular receive the notification
from the target and start reading the recording off the target’s RAM, dump the
raw bytes to a file and launch the μC/Trace Windows application to analyze the
trace.
17
Chapter 2
18
Chapter
3
Configuring μC/Trace
This chapter aims at providing a more detailed description of the tweaks you need to do to
your application level code and the recorder library to run μC/Trace.
3-1 ENABLING OR DISABLING μC/TRACE
3-1-1 OS_CFG.H
The first step to get started with μC/Trace is enabling the module in os_cfg.h through the
definition of the macro TRACE_CFG_EN set to 1, which is useful to disable tracing once your
embedded application gets deployed:
#define
TRACE_CFG_EN
1
/* Enable/Disable the uC/Trace Recorder.
*/
Figure 3-1 Enable/Disable μC/Trace
3-2 RECORDER CONFIGURATION SETTINGS
The configuration files for the recorder library are usually placed along with your
application level configuration files.
There is a configuration template in $\Micrium\Software\uC-Trace\Cfg.
You can make a copy of this template and place it along with the rest of your application
level configuration files.
19
Chapter 3
3-2-1 TRACE_CFG.C/H
These configuration files define a series of macros to select the hardware platform,
customize your recordings and configure the optional μC/Trace triggering system.
SELECTING YOUR HARDWARE PLATFORM
The recorder needs to have knowledge of the hardware platform your are running, the
timer/counter used for driving the system ticker in particular.
μC/Trace has been ported to the following hardware platforms:
■
ARM Cortex-M
■
ARM Cortex-A
■
Renesas RX600
If your platform includes one of the above, then all you need to do is configure the macro
TRACE_CFG_HW_PORT in trace_cfg.h as shown in the following code listing:
/*
*******************************************************************************************
*
HARDWARE PORT
*
* Note(s) : The recorder needs to have knowledge of the hardware platform your are running,
*
the timer/counter used for driving the system ticker in particular.
*
*
Select from one of the following supported platforms:
*
*
- ARM CORTEX-M
:
4u
*
- RENESAS RX600 :
5u
*
- ARM CORTEX-A
:
14u
*******************************************************************************************
*/
#define
TRACE_CFG_HW_PORT
5u
Listing 3-1 Selecting your Hardware Platform
If your hardware platform is not listed above, please contact Micriμm.
20
Recorder Configuration Settings
CUSTOMIZING YOUR RECORDINGS
Also in trace_cfg.h, the two settings you may want to edit are the maximum number of
events to store in RAM and the maximum number of kernel objects to record as shown in
the following code listing:
/*
********************************************************************************************
*
RECORDING BUFFER
*
* Note(s) : This defines the capacity of the event buffer,
*
i.e., the number of records it may store.
*
Each recorded event typically uses one record (4 byte in RAM).
*
Adjust to your application needs and memory resources.
********************************************************************************************
*/
#define
TRACE_CFG_MAX_EVENTS
2000u
(1)
/*
********************************************************************************************
*
RECORDED KERNEL OBJECTS
*
* Note(s) : These define the maximum number of kernel object types to record.
*
Adjust to your application needs and memory resources.
********************************************************************************************
*/
#define
#define
#define
#define
#define
#define
#define
TRACE_CFG_MAX_TASK
TRACE_CFG_MAX_ISR
TRACE_CFG_MAX_Q
TRACE_CFG_MAX_SEM
TRACE_CFG_MAX_MUTEX
TRACE_CFG_MAX_FLAG
TRACE_CFG_MAX_MEM
16u
8u
16u
32u
8u
2u
2u
(2)
Listing 3-2 Recorder Storage Settings
L3-2(1)
This defines the capacity of the event buffer, i.e., the number of records it may
store. Each registered event typically uses one record (4 bytes).
L3-2(2)
These define the maximum number of kernel object types to record. Adjust to
your application needs.
21
Chapter 3
CONFIGURING THE μC/TRACE TRIGGERING SYSTEM
The third step is optional and available only if your platform is supported by μC/Probe and
you want to trigger recordings from μC/Probe.
If so, in this configuration stage you get to enable the system and define the trigger points
as described in the following code listings.
/*
********************************************************************************************
*
UC/TRACE TRIGGERS MODULE
*
* Note(s) : The uC/Trace Triggering mechanism requires the hardware platform to be
*
supported by uC/Probe.
*
*
If your platform is uC/Probe-ready, then enable this module by setting
*
the macro below to 1.
********************************************************************************************
*/
#define
TRACE_CFG_TRIG_EN
1u
(1)
#if (defined(TRACE_CFG_TRIG_EN) && (TRACE_CFG_TRIG_EN > 0u))
/*
********************************************************************************************
*
UC/TRACE TRIGGERS SETTINGS
********************************************************************************************
*/
#define
#define
TRACE_CFG_TRIG_MAX_TRIGS
TRACE_CFG_TRIG_NAME_LEN
16u
32u
(2)
/*
********************************************************************************************
*
UC/TRACE TRIGGERS TASK SETTINGS
********************************************************************************************
*/
#define
#define
22
TRACE_CFG_TRIG_TASK_STK_SIZE
TRACE_CFG_TRIG_TASK_PRIO
128u
20u
(3)
Recorder Configuration Settings
/*
********************************************************************************************
*
UC/TRACE TRIGGERS IDS
*
* Note(s) : First you create a series of unique IDs for each of your trigger points.
*
In this example TRACE_CFG_TRIG_ID_SW1 is the trigger point executed when
*
you press the board's switch 1.
********************************************************************************************
*/
#define
#define
#define
TRACE_CFG_TRIG_ID_SW1
TRACE_CFG_TRIG_ID_SW2
TRACE_CFG_TRIG_ID_SW3
1234u
1235u
1236u
(4)
Listing 3-3 μC/Trace Triggers Configuration Table
L3-3(1)
As previously mentioned, the μC/Trace Triggering mechanism requires the
hardware platform to be supported by μC/Probe. If your platform is
μC/Probe-ready, then enable this module by setting the macro
TRACE_CFG_TRIG_EN defined in trace_cfg.h to 1.
L3-3(2)
The macro TRACE_CFG_TRIG_MAX_TRIGS declared in trace_cfg.h, defines the
maximum number of trigger points throughout your code.
In the same file, the macro TRACE_CFG_TRIG_NAME_LEN allows you to define
the maximum number of characters of each trigger point’s name, in case you
need to tweak the memory footprint.
L3-3(3)
The triggering mechanism uses a μC/OS-III task to trigger the recordings and
communicate with μC/Probe. The macros TRACE_CFG_TRIG_TASK_STK_SIZE
and TRACE_CFG_TRIG_TASK_PRIO define the task’s stack size and priority
respectively.
L3-3(4)
The first step to configure trigger points is to create a series of unique IDs for
each of your trigger points. In this example TRACE_CFG_TRIG_ID_SW1 is the
trigger point executed when you press switch 1 on the board.
23
Chapter 3
Once you have configured all the settings defined in trace_cfg.h, you switch to the file
trace_cfg.c where you take each of your trigger IDs and create a configuration table as
shown in the code listing below.
/*
********************************************************************************************
*
UC/TRACE TRIGGERS CONFIGURATION TABLE
*
* Example : { [Trigger ID], [Trigger Source Name], [Max # Files to Record Before Disarming] }
*
* Note(s) : Make sure the number of entries in this configuration table is
*
less than the value of TRACE_CFG_TRIG_MAX_TRIGS
*
otherwise, any other triggers in excess will be ignored.
********************************************************************************************
*/
const
{
TRACE_CFG_TRIG
TraceCfgTrigTbl[] =
{TRACE_CFG_TRIG_ID_SW1, "Signal Task # 1
(SWITCH 1)", 3},
{TRACE_CFG_TRIG_ID_SW2, "Post Q Task # 2
(SWITCH 2)", 3},
{TRACE_CFG_TRIG_ID_SW3, "Other Kernel Objs (SWITCH 3)", 1}
(1)
};
Listing 3-4 μC/Trace Triggers Configuration Table
L3-4(1)
24
The first parameter is the trigger ID, the second parameter is the trigger’s name
and the third parameter is the number of recordings you want to capture before
disarming the trigger automatically.
Chapter
4
Initializing μC/Trace
Initializing the μC/Trace recorder module is easy, the first thing you need to do is call the
macro TRACE_INIT() as shown in the following code listing:
int main(void)
{
OS_ERR err;
CPU_IntDis();
/* Disable all interrupts.
*/
#if (defined(TRACE_CFG_EN) && (TRACE_CFG_EN > 0u))
TRACE_INIT();
/* Initialize the uC/Trace recorder.
#endif
.
.
.
*/
Figure 4-1 Initializing the μC/Trace Recorder
The next step depends on whether or not your platform is supported by μC/Probe and you
want to trigger recordings from μC/Probe. Otherwise, you can still use μC/Trace without
μC/Probe.
25
Chapter 4
If you are using μC/Probe to trigger recordings then you need to call the function to
initialize the triggering module as shown in the following code listing:
static
{
.
void
AppTaskStart (void *p_arg)
.
.
#if (defined(TRACE_CFG_EN) && (TRACE_CFG_EN > 0u))
TraceTrigInit();
#endif
.
.
.
/* Initialize uC/Trace triggers.
*/
Listing 4-1 Initializing the μC/Trace Triggering Module
26
Chapter
5
Instrumenting with μC/Trace
There are three groups of events you can record with μC/Trace; Kernel Service Calls,
Interrupt Service Routines and User-Defined Events.
This chapter describes how to instrument your embedded application with each of those
three types of events.
5-1 KERNEL SERVICE CALLS
Because μC/OS-III has already been instrumented, every Kernel Service Call gets
automatically recorded as soon as you start recording.
5-2 INTERRUPT SERVICE ROUTINES
Unlike Kernel Service Calls, ISRs do not get automatically recorded. Instead, you need to
place three marcos for each ISR you want to record.
To register an ISR for recording, you call the macro TRACE_OS_ISR_REGISTER() with three
arguments: unique ISR ID, Name and Priority as shown in the code listing below:
#if (defined(TRACE_CFG_EN) && (TRACE_CFG_EN > 0u))
TRACE_OS_ISR_REGISTER(1, "RS-232 Tx ISR", 4);
#endif
/* Registering an ISR.
*/
Listing 5-1 Registering an ISR for Recording
27
Chapter 5
Additionally, you need to mark the beginning and end of the ISR by calling the macros
TRACE_OS_ISR_BEGIN() and TRACE_OS_ISR_END() as shown in the code listing below:
void BSP_Ser_ISR_Tx_Handler (void)
{
#if (defined(TRACE_CFG_EN) && (TRACE_CFG_EN > 0u))
TRACE_OS_ISR_BEGIN(1);
#endif
SCI2.SSR.BIT.TEND;
/* Mark the beginning of an ISR.
SCI2.SSR.BIT.TEND = 0;
BSP_OS_SemPost(&BSP_SerTxWait);
/* Post to the semaphore
#if (defined(TRACE_CFG_EN) && (TRACE_CFG_EN > 0u))
TRACE_OS_ISR_END();
/* Mark the end of an ISR.
#endif
}
*/
(1)
*/
*/
(2)
Listing 5-2 Tracing an ISR
L5-2(1)
The macro TRACE_OS_ISR_BEGIN() takes the unique ID (i.e. vector number) of
the ISR you want to record as an argument.
L5-2(2)
The macro TRACE_OS_ISR_END() takes no arguments.
5-3 USER-DEFINED EVENTS
The last group of events you can record with μC/Trace is the user-defined events. Similar to
ISRs, you first need to register a user-defined event by calling the macro
TRACE_USR_EVT_CREATE() with the name of the event as shown in the code listing below:
#if (defined(TRACE_CFG_EN) && (TRACE_CFG_EN > 0u))
CPU_INT16U
evt_hnd;
evt_hnd = TRACE_USR_EVT_CREATE("50 ms User Event");
#endif
/* Create a user-defined event.
*/
Listing 5-3 Creating a User-Defined Event
28
User-Defined Events
The macro to create the event returns an event handle and then, all you have to do is call
the macro TRACE_USR_EVT_LOG() with the event handle to record it as shown in the code
listing below:
#if (defined(TRACE_CFG_EN) && (TRACE_CFG_EN > 0u))
TRACE_USR_EVT_LOG(evt_hnd);
/* Recording a user-defined event every 50ms. */
#endif
Listing 5-4 Tracing a User-Defined Event
29
Chapter 5
30
Chapter
6
Recording with μC/Trace
There are two ways to start recording with μC/Trace. If your platform is supported by
μC/Probe, then you can use μC/Probe and a special control called μC/Trace Trigger control
to trigger and analyze recordings. If not, then you can still use μC/Trace without μC/Probe.
This chapter describes the two methods.
6-1 START RECORDING WITH μC/PROBE
Once you have the trigger IDs configured as described in Chapter 3, on page 17, you can
simply call the macro TRACE_TRIG() with the trigger ID as a parameter wherever you want
to start recording.
When the part of your code that calls this macro gets executed, the system will check if the
trigger has been armed from μC/Probe and will not only initiate recording but also notify
μC/Probe that the recording is ready for upload and analysis.
The code listing below shows an example of start recording whenever the user presses a
button:
AppSwitch1 = BSP_SwsRd(1);
/* Read the status of switch #1.
if (AppSwitch1 == DEF_ON) {
#if (defined(TRACE_CFG_EN) && (TRACE_CFG_EN > 0u))
TRACE_TRIG(TRACE_TRIG_ID_SW1);
/* Evaluate the recording trigger conditions.
#endif
.
.
.
*/
*/
Listing 6-1 Start Recording with μC/Probe
31
Chapter 6
6-2 START RECORDING WITHOUT μC/PROBE
If your platform is not supported by μC/Probe, you can still use μC/Trace. All you have to
do is call the macro TRACE_START() to start the recording and TRACE_STOP() to stop the
recording. You can also let the recording fill the RAM buffer until it gets full and μC/Trace
will stop the recording automatically.
It is not necessary to start μC/OS-III before starting the recording and you can even start
recording right from the embedded application’s main entry point as shown in the following
code listing:
int main(void)
{
OS_ERR err;
CPU_IntDis();
/* Disable all interrupts.
#if (defined(TRACE_CFG_EN) && (TRACE_CFG_EN > 0u))
TRACE_INIT();
/* Initialize the µC/Trace recorder.
TRACE_START();
/* Start recording.
#endif
*/
*/
*/
Listing 6-2 Start Recording without μC/Probe
32
Chapter
7
Analyzing with μC/Trace
The analysis of the trace is performed with a windows application in your host PC.
μC/Trace Analyzer is available for sale at http://percepio.com/tracealyzer/uctrace/
There is also a 30-day evaluation version that includes a demo trace, so you can try it
without even writing a single line of code for your embedded target.
There are two ways to upload your recordings to your host PC for analysis. You can use
μC/Probe or your debugging’s software memory dump function.
This chapter will describe the two methods.
7-1 UPLOADING WITH μC/PROBE
When the part of your code instrumented with your trigger gets executed, the system will
check if the trigger has been armed from μC/Probe and will not only initiate recording but
also notify μC/Probe that the recording is ready for upload and analysis.
33
Chapter 7
The recording gets uploaded by μC/Probe using one of the many communication interfaces
and is made available as shown in the figure below:
Figure 7-1 Uploading with μC/Probe
7-2 UPLOADING WITH A DEBUGGING TOOL
If your debugging tools include a memory dump utility, then you can use it to save the
μC/Trace recording to a binary file.
This type of utility typically asks you for the memory start address and the number of bytes
to save.
The μC/Trace recording buffer is stored in RAM and in the form of a data structure called
RecorderData.
34
Uploading with a Debugging Tool
Find out what is the address of RecorderData and calculate the number of bytes according
to the number of events. Or, if your debugger tools have a utility to watch expressions, then
add a watch for RecorderData and write down the address location and the number of
bytes from the filesize field as shown below:
Figure 7-2 Recording Buffer
35
Chapter 7
Once you have the address and number of bytes, you can use a memory dump utility to
save the contents of RecorderData to a binary file as shown below:
Figure 7-3 Memory Dump Utility
Once you have the file saved in your host PC, all you have to do is open the μC/Trace
Analyzer application for Windows and open the file from the File -> Open menu.
36
Appendix
A
μC/Trace Analysis
The μC/Trace Analyzer application gets installed with its own HTML based documentation
that describes each analysis tool in detail. This appendix is designed to be a quick reference
to analyze some of the most representative μC/OS-III kernel events.
A-1 TASK SCHEDULING EVENTS
The main trace view provides all recorded information on a vertical time line. This view is
complemented by over a dozen additional views providing high level overviews or focused
views from different perspectives. The task scheduling is presented using color coded
rectangles, where the color helps to identify the task or ISR.
Figure A-1 Task Scheduling Events
37
Appendix A
Notice in Figure A-1 that the ISR represented by the red rectangle does not have that dotted
pattern above its rectangle like the other tasks do. That is because μC/OS-III context
switches to the ISR immediately while the other tasks have to wait for μC/OS-III to schedule
their execution. In other words, that dotted pattern gives you an idea of how long your
tasks are waiting for their turn at the CPU.
A-2 SEMAPHORE EVENTS
μC/OS-III semaphores make their mark on the trace by logging the kernel service calls
OSSemPend() and OSSemPost() as shown in Figure A-2:
Figure A-2 μC/OS-III Semaphore Events
If the call to OSSemPend() results in a blocking call because the semaphore has not being
signaled yet, the viewer will display the event with a red rectangle and when the semaphore
finally gets signaled it will be displayed again as a green rectangle along with the blocking
time between parentheses as shown in the image above.
38
A-3 MESSAGE QUEUE EVENTS
μC/Trace records μC/OS-III message queue events such as OSQPend() and OSQPost() as
shown in Figure A-3:
Figure A-3 μC/OS-III Message Queue Events
Notice in the example illustrated above how the Switches Task posts 4 messages into the
Global Message Queue and notice how in turn Task #2 consumes each message.
The diagram helps you keep track of each message by making sure no message is being
dropped or the queue is overflowing.
39
Appendix A
A-4 MUTEX EVENTS
μC/Trace records μC/OS-III mutex events such as OSMutexPend() and OSMutexPost() as
shown in Figure A-4:
Figure A-4 μC/OS-III Mutex Events
Notice how the tool shows you which task owns the mutex and similar to semaphores, if
pending on a mutex results in a blocking call it will show you for how long it had to wait
for the mutex to be released. This is a great tool to identify possible resource starvation
cases.
40
A-5 MEMORY PARTITION EVENTS
μC/Trace records μC/OS-III memory partition events such as OSMemGet() and OSMemPut()
as shown in Figure A-4:
Figure A-5 μC/OS-III Memory Partition Events
The image above shows the example of a memory partition of 16 blocks of memory.
Because the tool keeps track of how many blocks of memory are left in the memory
partition, notice how Task #1 first acquires three blocks of memory and then releases just
one of them.
41
Appendix A
42
Appendix
A
Frequently Asked Questions (FAQs)
■
What is the difference between the Evaluation Edition and Professional Edition
of μC/Trace?
The Evaluation Edition of μC/Trace gives you the full functionality of the Professional
Edition but for a limited period of time of 30 days. The best way to experience the
differences is to download and try for yourself. You can easily switch between the two
editions using the “Demo” option on the Welcome screen and under the File menu.
■
Where do I find the Evaluation Edition?
Both editions are included in our single installer. The Evaluation Edition does not
require a license key. Just use the “Evaluate” option, and take the opportunity to
explore the premium features. The evaluation period ends after 30 days.
■
Is μC/Probe required to use μC/Trace?
No, μC/Probe is optional.
■
How difficult it is to include μC/Trace into my μC/OS-III embedded project?
It is very easy. If your embedded project is running μC/OS-III v3.04.01 or newer, all you
need to do is download the μC/Trace Recorder and include 4 C files into your project.
■
How do I get started with μC/Trace?
There is a comprehensive User’s Manual in the μC/Trace Downloads section of our
website. If you have any questions after reading this, do not hesitate to contact Micriμm
at [email protected].
■
What chips are supported by μC/Trace?
43
Appendix A
μC/Trace takes advantage of the generic, hardware-independent μC/OS-III code.
However, to get high resolution timestamping, it is necessary to read a hardware timer.
We provide official pre-configured solutions for some common chips, including the
ARM Cortex-M and Renesas RX600 architectures. However, if your hardware platform is
not listed, then the port is an easy task to accomplish yourself; it is a simple matter of
defining a set of four macros to match the timer features of your chip. Several corporate
users have done this themselves, to perform a proper evaluation.
■
How much RAM does the μC/Trace recorder library need?
The recorder RAM buffer can typically be adjusted to fit your system. A small buffer of
5-10 KB can often give a trace of 50-200 ms, depending on the application.
For example, in one demo project on a ARM Cortex-M4 MCU, we used 70 KB of RAM,
which allowed for 17,500 events. That gave about 7 seconds of trace history at 2500
events/second, which is a fairly normal rate (10 KB/s).
A buffer of 32KB may last for over ten seconds in a system with low average activity.
Note that you can always record continuously, for hours, days or weeks, even with a
small buffer, since the ring-buffer mode allows for keeping only the most recent events.
For example, when stopped at a breakpoint, the buffer would then contain the trace
leading up to the current state. You may also choose to stop the recording when the
buffer is full.
■
Which IDEs/debuggers are supported?
Most debuggers will work, as long as it can save the RAM buffer in “.bin”, “.hex” or
“.mch” (MPLAB) formats. In your debugger IDE, open the RAM memory view and use
the “save” option (there is usually such an option). Then just open the resulting file – it
will locate the trace data in the RAM dump automatically.
■
I included the μC/Trace code into my μC/OS-III project, but it does not
compile. The error message is: “Struct OS_TCB has no field TaskID”. What am
I doing wrong?
Make sure your project is running μC/OS-III version 3.04.01 or newer.
44
■
I included the μC/Trace code into my μC/OS-III project, but it does not
compile. The error message is: “Struct OS_TCB has no field NamePtr”. What
am I doing wrong?
Make sure your os_cfg.h enables debugging by setting the macro OS_CFG_DBG_EN to
1.
■
I included the μC/Trace code into my μC/OS-III project, but it does not
compile.
The
error
message
is:
“Duplicate
symbol
“_vTraceTaskInstanceIsFinished” in trace.o”. What am I doing wrong?
In order to make it easy to include μC/Trace, we have a C file that includes other C files.
This way you only have to insert 4 files into your project. To fix this issue you can either
make sure you only inserted 4 files into your project (trace.c/h and trace_cfg.c/h)
or go ahead and remove the appropriate #includes in trace.c.
■
What does the label “(startup)” mean?
This is displayed as a placeholder “task”, representing the initial time interval before any
task activation has been recorded.
■
My trace does not load, or is showing only a single task named “(startup)”.
What’s wrong?
Check the following things:
■
Is TRACE_INIT() called? This must be called early, before calling any kernel or
recorder function.
■
Is TRACE_START() called?
■
Double-check that you have enabled μC/Trace in os_cfg.h:
#define TRACE_CFG_EN 1
■
Are there any error messages from the recorder? This is displayed when opening a
trace file with the μC/Trace Windows application. The most common error message
is from insufficient allocation of object handles, i.e., for tasks, queues and other
kernel objects. This is configured in trace_cfg.h in macros named
TRACE_CFG_MAX_TASK, TRACE_CFG_MAX_MUTEX, etc. Using the debugger, add a
45
Appendix A
watch for RecorderDataPtr and check if the field internalErrorOccured is 0 or
1. If 1, then there has been an error and the systemInfo field then holds the error
message. Such error messages are stored by calls to vTraceError(), so placing a
break-point there is often a good idea.
■
Are you reading the right memory area when saving the RAM contents in your
debugger? Make sure that trace data block (RecorderDataPtr) is fully included.
■
Is your debugger output format supported? Currently, we support binary files (use
file suffix “.bin” or “.dump”), which can be generated by the GCC debugger (GDB),
by J-Link Commander and by Renesas HEW. It also supports the Intel Hex format,
which can be generated using IAR Embedded Workbench (use file suffix “.hex”).
We also support “.mch” files from MPLAB. If your debugger can provide RAM
dumps but only in other formats, please contact [email protected].
If you still have problems, please contact Micriμm support ([email protected]).
■
I get an error message “Object table lookup with invalid object handle or
object class!” when opening the trace. What’s wrong?
This error usually means the trace recording functions are been called before μC/OS-III
has been initialized.
Make sure to call TRACE_INIT() and TRACE_START() before OSInit().
■
I get an error message “Warning, Recorder reported error: …” when opening
the trace. What’s wrong?
Check the following things:
■
The most common problem: double-check that you have added the following line
in the very end of your os_cfg.h:
#define TRACE_CFG_EN 1
46
■
■
In case the message is “Not enough TASK handles…”, “Not enough QUEUE handles
…” or similar, you need to increase the value some of the constants in
trace_cfg.h (TRACE_CFG_MAX_TASK, TRACE_CFG_MAX_Q, etc.) to better reflect the
maximum number of tasks or queues used.
■
In other cases, you can get more details using your debugger. Put a break-point
inside vTraceError (where the error message is stored), and check the context in
which it is generated.
How do I enable tracing of interrupt handlers?
Interrupt handlers (or Interrupt Service Routines, ISRs) are not recorded by default. ISRs
using μC/OS-III functions, such as OSTaskQPost(), are however recorded automatically
but without the ISR identity, e.g., “ISR using Queue #1?. To record ISRs properly, you
need to add two calls in the interrupt handlers you wish to record. See
TRACE_OS_ISR_BEGIN() and TRACE_OS_ISR_END() for further information. Use
TRACE_OS_ISR_REGISTER() to set the name of the ISR.
■
What does the label “ISR #1? mean?
If you have not set a name for the ISR using TRACE_OS_ISR_REGISTER(), the ID stored
using TRACE_OS_ISR_BEGIN() is displayed.
■
What does the label “ISR using …” mean?
If you have interrupt handlers using μC/OS-III functions, such as OSTaskQPost(), but
are not calling TRACE_OS_ISR_BEGIN() and TRACE_OS_ISR_END(), the recorder
assumes that the μC/OS-III call was made from an interrupt handler, but does not know
the identity of the interrupt handler. In this case, the name is set to “ISR using “, with
the queue or semaphore used by the μC/OS-III call. To fix this, add
TRACE_OS_ISR_BEGIN() and TRACE_OS_ISR_END() calls to your interrupt handlers.
■
I’m not using μC/OS-III. Is there a way to use μC/Trace with RTOS XYZ?
No. μC/Trace is designed to work with μC/OS-III only. However, Percepio has versions
of the analyzer for several other RTOS. Please contact [email protected] for more
information.
■
What is the relationship between μC/Trace and μC/Probe?
47
Appendix A
μC/Trace and μC/Probe are part of the embedded systems tools offered by Micriμm.
You can use μC/Probe and a special control designed for μC/Trace called μC/Trace
Trigger Control, to trigger a recording from your PC, upload the recording to your PC
and launch the μC/Trace Analyzer, which is much nicer than using your debugger’s
memory dump utility.
■
What is the relationship between Micriμm and Percepio?
Percepio is a member of the Micriμm partner program, and has created a special
version of their recorder and analyzer for μC/OS-III under the name μC/Trace. The
name μC/Trace is a trademark of Micriμm.
■
What is the background of μC/Trace?
The first version of the tool was created by Percepio in 2004, during Dr. Johan Kraft’s
PhD work at Mälardalen University. A simple trace visualization tool was needed to
verify scheduling simulations, but when ABB Robotics began using the tool
systematically in 2005 (on VxWorks), the project started its evolution into something
much larger. Between 2005 and 2008, the tool evolved to version 1.31 and Percepio
learned a lot by implementing trace recorders for various real-time operating systems,
such as VxWorks, OSE, RTXC Quadros and FreeRTOS, on various industrial systems
spanning from small microcontrollers to large Intel-based systems. The second
generation of the tool was initiated in 2009 and released in 2011.
In 2013 Percepio and Micriμm entered into an agreement to develop and commercialize
a version of the product built into μC/OS-III under the name μC/Trace.
48
Appendix
B
Bibliography
■
Labrosse Jean. μC/OS-III The Real-Time Kernel. Micriμm Press,
ISBN 978-0-98223375-3-0, 2009.
49
Appendix B
50