1
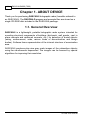
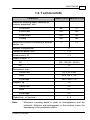
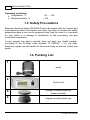
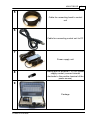
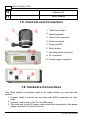
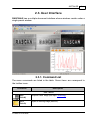
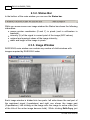
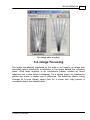
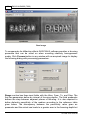
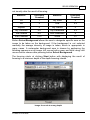
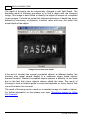
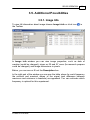
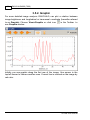
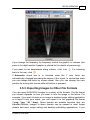
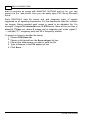
RASCAN-5/4000 (7000 )
DEVICE FOR SOUNDING OF BUILDING
STRUCTURES AND WORKS
USER'S MANUAL
© 1995-2015 RSLab
TABLE OF CONTENTS
1
TABLE OF CONTENTS
Chapter 1. ABOUT DEVICE
............................................................................................................ 2
1.1. General
........................................................................................................................
Overview
2
1.2. Technical
........................................................................................................................
Info
3
1.3. Safety........................................................................................................................
Precautions
4
1.4. Packing
........................................................................................................................
List
4
1.5. Controls
........................................................................................................................
and Connectors
6
1.6. Hardware
........................................................................................................................
Connections
6
1.7. Transport
........................................................................................................................
& Storage
7
Chapter 2. SOFTWARE
............................................................................................................ 8
2.1. Installing
........................................................................................................................
RASCAN-Q
8
2.2. File Types
........................................................................................................................
and Extensions
8
2.3. User ........................................................................................................................
Interface
9
2.3.1. Command
.............................................................................................................
List
9
2.3.2. Status
.............................................................................................................
Bar
12
2.3.3. Image
.............................................................................................................
Window
12
Chapter 3. DEVICE............................................................................................................
OPERATION
14
3.1. Scanning
........................................................................................................................ 14
3.2. Device
........................................................................................................................
Testing
16
3.3. Images
........................................................................................................................
Editing
18
3.3.1. Correcting
.............................................................................................................
Action
18
3.3.2. Cropping
............................................................................................................. 20
3.4. Image
........................................................................................................................
Focusing
21
3.5. Additional
........................................................................................................................
Possibilities
25
3.5.1. Image
.............................................................................................................
Info
25
3.5.2. Graphic
............................................................................................................. 26
3.5.3. Exporting
.............................................................................................................
Images to Other File Formats
27
© 1995-2015 RSLab
2
RASCAN-5/4000 (7000)
Chapter 1. ABOUT DEVICE
Thank you for purchasing RASCAN-5 holographic radar (hereafter referred to
as RASCAN-5). The RASCAN-Q program and example files are stored on a
single CD-ROM disk included in the RASCAN-5 package.
1.1. General Overview
RASCAN-5 is a lightweight, portable holographic radar system intended for
sounding structural components of buildings (brickwork, wall panels, cast in
place concrete and reinforced concrete, etc.) for detection of buried objects
(wiring, reinforcement, voids, various kinds of discontinuities and foreign
bodies). Software forms representation of the internal structure of examination
area.
RASCAN-5 produces plan view gray scale images of the subsurface objects
using five simultaneous frequencies. The images can be focused by special
algorithms for improving their resolution.
© 1995-2015 RSLab
ABOUT DEVICE
3
1.2. Technical Info
Parameter
Rascan-5/4000 Rascan-5/7000
Maximum sounding depth (depends on
medium properties), mm:
in concrete
90*
75*
in brick wall
180*
150*
in wall board
200*
180*
in wood
200*
180*
2
1.5
Resolution in plane of sounding at shallow
depths, cm
Number of frequencies
5
Transmitter power, mW
< 10
Power source, W
<3
Supply voltage, V:
AC
100…230 (50…60 Hz)
DC
12
Dimensions, mm:
Control unit
157 x 63 x 200
Head
95 x 148 x 119
In package
380 x 460 x 130
Weights, kg
1.9
Control unit
0.6
Head
0.7
In package
5.5
Productivity, m2 per hour
4…6
Note:
* Maximum sounding depth is given for homogeneous and dry
materials. Moisture and heterogeneity in the medium cause the
decreasing of the penetration ability.
© 1995-2015 RSLab
4
RASCAN-5/4000 (7000)
Operating conditions:
Temperature, °С
Relative humidity, %
+10 … +35
< 90
1.3. Safety Precautions
Being an electronic device, RASCAN-5 has to be treated with the caution and
care necessary when such devices are used. Any failure to observe the safety
precautions given or any use for purposes other than the ones it is conceived
for may result in a damage or destruction of the processing unit and
connected components.
If used properly the device normally does not pose any health hazards.
According to the All-Union state standard 12.1.006-84, i. 2.4, the highfrequency signals are not harmful to the human body on account of their low
power.
1.4. Packing List
1
Head
2
Control unit
3
4
Straight sounding head cap
(ships mounted)
Angular sounding head cap
© 1995-2015 RSLab
ABOUT DEVICE
5
5
Cable for connecting head to control
unit
6
Cable for connecting control unit to PC
7
Power supply unit
8
Mating part for external +12 VDC power
supply socket (connect internal
electrode to the positive terminal of the
power source)
9
Package
© 1995-2015 RSLab
6
RASCAN-5/4000 (7000)
10
Software CD
11
User's Manual
1.5. Controls and Connectors
1. "Start line" button.
2. Marching wheel.
3. Control unit connector.
4. Power-on switch.
5. Power-on LED.
6. Reset button.
7. Sounding head connector.
8. PC connector.
9. Power supply connector.
1.6. Hardware Connections
Only three simple connections need to be made before you can start the
system.
1. Connect head to control unit via cable with RJ45 connectors on both
ends.
2. Connect control unit to the PC via USB cable.
3. The male end of the DC power cable should be connected to the power
supply connector on the control unit.
© 1995-2015 RSLab
ABOUT DEVICE
7
NOTE:
Alternatively control unit can use external 12 VDC power source (find
mating connector in the package).
CAUTION:
Internal electrode should be connected to the positive terminal of the power
source.
After all other connections have been made connect the power cable
to the power source.
1.7. Transport & Storage
Convey by any transport in original packaging in following conditions:
Temperature, °C
-10…+ 50
Atmospheric pressure, atm
0.5…1.2
Relative humidity, %
< 90
Shock, g
10
Keep in dry hot storage.
© 1995-2015 RSLab
8
RASCAN-5/4000 (7000)
Chapter 2. SOFTWARE
RASCAN-5 is shiped with RASCAN-Q program intended for:
operation of the device;
receiving the images in the surface of survey for detection and
identification of hidden objects (scanning);
processing of the received images.
RASCAN-Q can be run on Windows XP, Vista, Seven.
2.1. Installing RASCAN-Q
1. Insert the RASCAN-Q CD into your computer’s CD drive (the control unit
should be turned off and disconnected).
2. Install USB driver from FTDI folder of the CD.
3. Restart the computer.
4. Connect the control unit to the PC and turn it on.
5. Run (with Administrator rights) Setup.exe from the CD and follow onscreen instructions.
2.2. File Types and Extensions
RASCAN-Q assigns *.dbi file extension as default to identify the data files.
© 1995-2015 RSLab
SOFTWARE
9
2.3. User Interface
RASCAN-Q has a multiple document interface whose windows reside under a
single parent window.
2.3.1. Command List
The menu commands are listed in the table. Some items are correspond to
the toolbar icons.
Com m and
Description
"File" m enu
Scan
(Ctrl+N)
Acquire a new image (see topic "Scanning").
Open
(Ctrl+O)
Open an existing image (data file).
© 1995-2015 RSLab
10
RASCAN-5/4000 (7000)
Com m and
Description
Save
(Ctrl+S)
Lets you save the image from the active w indow .
Save as
Lets you save the image from the active w indow under a new
name. The image may also be saved to many different file formats
(see topic "Exporting Images to Other File Formats").
Exit
(Ctrl+X)
Lets you exit the program.
"Edit" m enu
Copy
Lets you copy the image from active w indow to the clipboard using
bitmap format. After that this image can be used by any Window s
program (see topic "Image w indow ").
Crop
Lets you crop the image (see topic "Cropping").
"View " m enu
Zoom In
(Ctrl++)
Lets you increase the scale of the image by 25 percent. You can
also use the mouse w heel.
Zoom Out
(Ctrl+-)
Lets you decrease the scale of the image by 25 percent. You can
also use the mouse w heel.
Norm al size
(Ctrl+D)
Lets you display the image w ith original size (zoom factor equals
1).
Fit to
Window
Lets you choose, w ill (or not) the image be adjusted to the w indow
w hile this size is changed by mouse.
"Im age" m enu”
Info
Lets you see information about active image (see topic "Image
info").
Graphic
Lets you see image intensity distribution along any row or column
(see topic "Graphic").
"Device" m enu
Rascan5/4000
Lets you choose 4 GHz device (if you have it).
Rascan5/7000
Lets you choose 7 GHz device (if you have it).
Rascan5/15000
Lets you choose 15 GHz device (if you have it).
© 1995-2015 RSLab
SOFTWARE
Com m and
11
Description
"Window " m enu
Close
Lets you close current w indow .
Close All
Lets you close all w indow s.
Tile
Lets you see w indow s side by side.
Cascade
Lets you see w indow s stacked w hen the w indow s stack on top
of each other and each w indow is shifted dow n just enough so
you can see the name at the top of the w indow .
Next
Lets you move the focus to the next w indow .
Previous
Lets you move the focus to the previous w indow .
“Язык” m enu
Русский
Lets you choose Russian for program interface (restart is
required).
English
Lets you choose English for program interface (restart is required).
"Help" m enu
Help
Lets you see RASCAN-Q help system.
About
Lets you see information about RASCAN-Q program.
About Qt
Lets you see information about Qt library.
© 1995-2015 RSLab
12
RASCAN-5/4000 (7000)
2.3.2. Status Bar
In the bottom of the main window you can see the Status bar.
While you move mouse over image window the Status bar shows the following
information:
mouse pointer coordinates (X and Y) in pixels (and in millimeters in
brackets);
intensity (A) of the signal in current point of the image (ADC values);
minimal and maximal values of the image intensity;
width and height of the image in pixels.
2.3.3. Image Window
RASCAN-Q main window can contain any number of child windows with
images acquired by RASCAN-5 radar.
Each image window is divided into two parts: left side shows the real part of
the registered signal (I-quadrature) and right one shows the image part
(Q-quadrature). Left clicking on the image sets the image to active state (font
of the title of the active image become bold). While clicking Edit>Copy just
© 1995-2015 RSLab
SOFTWARE
13
the active image goes to the Clipboard. Also for copying the image you can
click on it with right button and choosing Copy from context menu.
There is a frequency switch in the top-left corner of the image window. You
can choose any frequency from multifrequency image. The switch displays
number of the frequency and its value.
By clicking Process button (top-right corner) the image processing procedure
is started (see topic "Image focusing").
© 1995-2015 RSLab
14
RASCAN-5/4000 (7000)
Chapter 3. DEVICE OPERATION
ATTENTION! After turning on the device please give it about 5 minutes for
warm-up.
3.1. Scanning
For scanning run RASCAN-Q program and choose File>Scan (or click icon
in the Toolbar). You will see a Device window.
If the device isn't connected to the computer or switched off, you will see
"Waiting for connection ..." text in the bottom of the window. After switching
on the device the text will be changed to "Ready ...". If the device is
connected to the computer or switched on the text will be "Ready ..." at once.
Different materials have different reflective properties. Therefore you have to
calibrate the device before work on each specific site. For calibration you
should press the device head to any place on scanning surface (supposedly
without subsurface objects) and click Calibration button. Calibration will take
a split second.
The following few parameters should be checked to ensure that they are
optimal for your specific site:
Image width in centimeters
Image height in centimeters
© 1995-2015 RSLab
DEVICE OPERATION
15
Step on 0X axis
Step on 0Y axis
Starting position. If it is planning that position of the first scan line will
not correspond to zero on a ruler for vertical marking, here you should
specify this nonzero value.
By clicking Start button the new window will appear. Each small blue
rectangle is correspond to the one pixel of the future image.
Place the head of the device onto the top-left corner (relative to operator) of
scan area. Press and release Start line button (on the head) and slide the
head smoothly along current scan line. When end of line is reached a beep
comes and the resulting line is appeared in the image. Relocate the head to
the beginning of the next line (one step from the previous). Press Start line
and repeat the same routine. Motion should be smooth and straight and not
too fast. A single line should be scanned for no less than 1...1.5 seconds.
Use ruler or mark out surface in advance to keep lines parallel and properly
spaced. You can check the number of current line in Current line at section
of the Device window.
When scanning uneven surfaces use thin (2...3 mm) plexiglass sheet.
If you don't want to scan all planned lines you can finish the scanning by
clicking Stop button. In this case the image height will be equal to the height
of the actually scanned area.
Operator could make mistakes while scanning. For example, he could press
the head to the surface too strongly or too faintly, move the head too fast or
make a mistake with initial position of the head. So, in RASCAN-Q it is
possible to replace last scan line. For replacing click Replace last line
© 1995-2015 RSLab
16
RASCAN-5/4000 (7000)
button in Replace line section. When scanning is finished it is possible to
replace any line in the image. To do this you should move the mouse pointer
to the line you want to replace and look at its number in the Status bar. Then
you have to specify this number in Replace line section, click Replace line
# button, move the head to the replaced line and do the scan. By clicking
Finish button you confirm that current image is complete. After that you can't
replace lines.
Data displayed on the computer screen will be lost when RASCAN-Q is
closed. To permanently save your data, you must click File>Save, locate the
folder in which you want to save the file, type a filename in the File name list
box and click Save button.
You can add short text (with experimental conditions or something else) to
the data file. Choose Image>Info (or icon
in the Toolbar) and write down
the text in the Description box. Then click Save button.
3.2. Device Testing
Rascan-Q provides an optional routine to test the radar. To enter the test
mode, open the window "Test" by choosing File>Scanning or by clicking
icon
in the Toolbar. Before testing the device calibration is required as it is
in the case of scanning (see topic "Scanning"). Also you can calibrate the
device by pressing "Calibrate" button in the bottom left corner of the window
"Test".
© 1995-2015 RSLab
DEVICE OPERATION
To start the test click
in the top-left corner, to stop the test click
17
.
The same window has graphic symbols depicting the states of the Start Line
Button and the Marching Wheel.
The amplitudes of registered signal quadratures are shown in the center of the
window as a strip chart. One can choose the displayed frequency by using
the spinner at the top right corner of the window. The value in spinner Delay
defines the sampling interval of incoming data. The default value of the
sampling interval is not required to be modified in most cases.
The testing is performed to check connections of the device and its operation.
This mode can also be used to estimate penetration capability into material at
hand. For example, one may place the sensor head on a sample pointing into
it and wave his hand on the opposite side to check if there are visible
oscillations of the signal. Oscillations with high amplitude evidence good
penetration into the medium and leave good chances of acquiring images with
visible subsurface objects at scanning. When signal oscillations are absent,
acquiring clear images is doubtful. Alternatively, by moving the radar head
within the area of interest, observable oscillations in test mode provide
information on present anomalies in the material.
The receiver of the device includes an amplifier with programmable gain factor
(possible values are: 1, 2, 4, 8, 16, 32, 64, 128). It is possible to set individual
gain factor for each frequency. Gain factor is programmed through "Gain
© 1995-2015 RSLab
18
RASCAN-5/4000 (7000)
factor" control in the bottom left corner. When you switch the frequencies, the
current gain factor for each frequency is displayed. After choosing the new
appropriate value you should store the new gain factor by pressing button
"Set".
If the test is started the gain factor is set only for active frequency. If the test
is stopped the equal gain factor is set for all frequencies.
By default the device has optimal gain factor. You can be faced with the need
to change the gain factor very seldom in case of off-scale reading.
3.3. Images Editing
3.3.1. Correcting Action
Sometimes acquired images contain some defects. They could be caused by
operator actions or (very rarely) by electromagnetic interference. If the defects
were not corrected during scanning (by "Replace line" procedure) you can
correct them at any time. It is possible to correct one pixel, whole row or
whole column.
Correction procedure is started by double clicking (left button) on wanted pixel
of the image. At that it is convenient to increase the size of the image. If you
want to edit the pixel, click exactly this pixel. If you want to edit row or
column you may click any pixel of this row or column.
After clicking, the window will be opened where you can choose the subject of
editing and action.
Edit pixel
As new value of the pixel you can choose:
© 1995-2015 RSLab
DEVICE OPERATION
19
Mean value of neighbor on the left and on the right
Mean value of neighbor on the top and on the bottom
Mean value of all neighbors.
Edit row
When editing the row you have the following possibilities:
Set new value of each pixel of the row as mean value of neighbor
on the top and on the bottom
Shift the row one pixel left
Shift the row one pixel left.
Last two possibilities is usually used to correct the effect of wrong
initial position of the head during scanning.
Edit column
When editing the row you have only possibility to set new value of each
pixel of the column as mean value of neighbor on the left and on the
© 1995-2015 RSLab
20
RASCAN-5/4000 (7000)
right.
3.3.2. Cropping
You can crop an image to remove unwanted areas. Cropping allows you to
select a rectangular area that you want to keep and discard the rest.
To crop an image:
1. Choose Image>Crop or click icon
in the Toolbar.
2. Drag to select an area on the image.
3. Press ENTER button on the keyboard.
Initial im age w ith selected area
© 1995-2015 RSLab
DEVICE OPERATION
21
The im age after cropping
3.4. Image Focusing
The image immediately registered by the radar is not exactly an image that
describes actual distribution of reflectors in the space behind the sounding
plane. What radar registers is an interference pattern created by these
reflectors that is also called a hologram. For a distant object its interference
pattern has a form of ripples due to diffraction. The diffraction effects, being
stronger for a more distant object than for a closer one, may prevent a
concealed object from identification.
© 1995-2015 RSLab
22
RASCAN-5/4000 (7000)
Raw im age
To compensate for diffraction effects RASCAN-Q software provides a focusing
procedure that can be relied on when sounding relatively homogeneous
media. Click Process button in any window with an acquired image to display
the following dialog with processing parameters.
Range section has three input fields with the titles: From, To, and Step. The
first two parameters define an interval of focusing depths. The third parameter
defines the step between adjacent planes of focusing. It is also required to
define dielectric permittivity of the medium according to the reference table
given below. The discrepancy between the permittivity value given as
parameter and the actual one leads to a greater error in the focusing depth but
© 1995-2015 RSLab
DEVICE OPERATION
23
not visually alter the result of focusing.
Material
Dielectric
Constant
Material
Dielectric
Constant
Air
1
Dry Sand
4
Ice
4
Coal
4.5
Asphalt
5
Dry Granite
5
Dry Concrete
5.5
Dry Limestone
5.5
Wet Granite
6.5
Wet Limestone
8
Wet Concrete
12.5
Water
81
Button Select Background allows the user to designate specific area on the
image to be taken as the background. If the background is not selected
manually the average intensity of image is taken, which is appropriate in
many cases. A rectangular background area is chosen by performing the
following sequence on an image: left mouse button press and hold->drag->left
mouse button release after pressing button Select Background.
The focusing starts at clicking Start button with displaying the result of
focusing to a minimum depth of the depth focusing interval.
Im age focused at w rong depth
© 1995-2015 RSLab
24
RASCAN-5/4000 (7000)
The depth of focusing can be interactively changed in edit field Depth. The
desirable result of focusing procedure is to find a depth with the sharpest
image. This image is best suited to identify the object of interest as compared
to raw images. It should be noted that obtained estimation of depth has errors
defined by inaccuracy of dielectric constant value and may not reflect the
actual depth of the object.
Im age focused at true depth
If the area of interest has several concealed objects at different depths, the
focusing may reveal several depths in a sequence where these objects
become focused. Stacked concealed objects present a difficulty to the radar
due to the fact that closer objects always shield the deep. The result of
focusing in such a situation prone to errors and depends on many factors that
can not be taken into account.
The result of focusing can be saved as a standard image of a table of values.
For further information on that please see topic "Exporting Images to Other
File Formats".
© 1995-2015 RSLab
DEVICE OPERATION
25
3.5. Additional Possibilities
3.5.1. Image Info
To view full information about image choose Image>Info or click icon
the Toolbar.
in
In Image info window you can view image properties, such as date of
creation (could be changed), steps on 0X and 0Y axes (for research purpose
could be changed), and image dimensions in pixels.
Below, you can see or fill out the Description box.
In the right part of the window you can see the table where for each frequency
the minimal and maximal values of the signal (and difference between
maximum and minimum in brackets) are appeared. You can estimate which
frequency is optimal for this experiment.
© 1995-2015 RSLab
26
RASCAN-5/4000 (7000)
3.5.2. Graphic
For more detailed image analysis RASCAN-Q can plot a relation between
image brightness and longitudinal or transversal coordinate (hereafter referred
to as Graphis). Choose View>Graphic or click icon
in the Toolbar to
see Graphis window.
Initially you see graphic along the first row of the image. Use arrows in the
top-left corner to choose another rows. Current line is marked on the image by
red color.
© 1995-2015 RSLab
DEVICE OPERATION
27
If you change the frequency by frequency switch the graphic is redrawn (the
same is for depth switch if graphic is plotted for the results of processing).
If you want to see dependance along column, click icon
back to the row, click
.
. For returning
If Autoscale check box is in checked state the Y axis limits are
automatically changed according the values of the signal. In unchecked state
you can change the limits by mouse wheel. Also you can change the zero
position by moving the mouse while left button is pressed.
3.5.3. Exporting Images to Other File Formats
You can export RASCAN-5 images to a variety of file formats. The file format
you choose depends on how you want to use the image in the future. For
example, if you want to work on an image in another image editing application
or to insert it into your report, you can export it to the graphical file format
(*.png, *.jpg, *.tif, *.bmp). These formats are suitable because they are
standard formats; images in these formats can be opened in most image
viewers and most image editing and desktop publishing applications. If you
© 1995-2015 RSLab
28
RASCAN-5/4000 (7000)
want to process an image with MathCAD, MATLAB and so on, you can
export it to the *.csv format. Also you can easily open CSV file by Microsoft
Excel.
Each RASCAN-5 data file stores real and imaginary parts of signals
registered on all operating frequencies. For five frequencies data file contains
ten images. Being exported each image is saved to an individual file. For
example, if original file wires.dbi save to JPG format, there will be ten files of
wires_X_YY.jpg sort, where X means real or imaginary part of the signal (1
— real part, 2 — imaginary part) and YY is frequency number.
To export an image to another file format:
1. Choose File>Save As.
2. Choose a file format from the Save as type list box.
3. Choose the folder where you want to save the file.
4. Type a filename in the File name list box.
5. Click Save.
© 1995-2015 RSLab