1
LONG TERM FINANCIAL PLANNING
30-YEAR MODEL
USER MANUAL
Page 2 of 57
CONTENTS
1.
Introduction.......................................................................................................................... 4
2.
User Pre-requisites.............................................................................................................. 4
3.
User Preparation.................................................................................................................. 4
4.
Disclaimer............................................................................................................................. 4
5.
User Instructions ................................................................................................................. 5
5.1 Main Menu.................................................................................................................... 6
5.2
6.
7.
Open the Model in Microsoft Excel............................................................................... 7
Recommended Modelling Approach ................................................................................. 9
6.1 Enter Base Year Data .................................................................................................. 9
6.2
Enter Assumptions for Modelling Period ...................................................................... 9
6.3
Reflect Completion of Existing Project Commitments ................................................ 10
6.4
Finalise Base Model Prior to Forecast Modelling ....................................................... 11
6.5
Modelling Scenario Hints............................................................................................ 11
Modelling Techniques ....................................................................................................... 12
7.1 Entering New Recurrent Activities via Manual Adjustments....................................... 12
7.2
Entering One-Off Activities via New Initiatives ........................................................... 15
8.
Model Customisation Settings ......................................................................................... 17
9.
General Extrapolation Assumptions................................................................................ 19
10.
Operating Revenue Assumptions & Build ...................................................................... 20
10.1 Operating Revenue Build – Source of $ Value Calculation ........................................ 23
11.
Operating Expenses Assumptions & Build..................................................................... 24
11.1 Operating Expenses Build – Source of $ Value Calculation....................................... 28
12.
Capital Revenue Build....................................................................................................... 29
13.
Capital Expenditure Build ................................................................................................. 30
13.1 Capital Expenditure Build – Source of $ Value Calculation........................................ 33
13.2 Leases Menu .............................................................................................................. 34
14.
Financing Activity Menu ................................................................................................... 35
15.
Reserve Transfers Build ................................................................................................... 39
16.
Balance Sheet Items Assumptions & Build .................................................................... 40
16.1 Current Assets & Liabilities Assumptions ................................................................... 42
16.2 Balance Sheet Items Build – Source of $ Value Calculation ...................................... 44
17.
New Initiatives Build.......................................................................................................... 46
18.
Model Manual Adjustments .............................................................................................. 47
19.
Long Term Financial Planning Outputs........................................................................... 48
20.
Key Performance Indicators ............................................................................................. 49
South Australian Local Government Financial Management Group
Long Term Financial Planning 30-Year Model User Documentation
January 2005
Page 3 of 57
21.
Frequently Asked Accounting Questions (FAAQs)........................................................ 55
21.1 Accounting for Assets Given Free of Charge ............................................................. 55
21.2 Accounting for Community Loans............................................................................... 56
21.3 Accounting for Depreciation ....................................................................................... 56
21.4 Accounting for Work-In-Progress ............................................................................... 56
21.5 Full Absorption Costing Implications .......................................................................... 56
21.6 Current and Non Current Loan and Lease Liabilities ................................................. 56
22.
Troubleshooting ................................................................................................................ 57
22.1 Exiting the Model Using ‘X’ in the Top Right Corner .................................................. 57
22.2 Entering New Loans and Leases Without Selecting the ‘Generate’ Button................ 57
South Australian Local Government Financial Management Group
Long Term Financial Planning 30-Year Model User Documentation
January 2005
Page 4 of 57
1. INTRODUCTION
This document has been developed to support Councils operating the Long term Financial
Planning Model, developed by Jigsaw Services on behalf of the SA Local Government
Financial Management Group (SALGFMG) and in association with the Office of Local
Government. The Model is designed to support the implementation of the Long term Financial
Planning framework by Council, ensuring consistent reporting and linkage to Councils’ strategic
management plans.
2. USER PRE-REQUISITES
It is assumed that all users of the Model have read the Long Term Financial Planning
Framework and have attended the Long Term Financial Plan Model Training Sessions.
It is assumed that all users of the Model are able to use a PC running Windows 95 or above
and are familiar with the functionality of Microsoft Excel 2000.
3. USER PREPARATION
The purpose of the Model is to provide a complete long-term financial plan for a Council to
ensure long term sustainability when implementing new plans and initiatives. In order to
achieve this, the user is required to prepare an end of year financial position as the base year
for input and an Infrastructure and Asset Management plan as a minimum. If any of this data is
missing or incomplete, the user risks an unsatisfactory result.
4. DISCLAIMER
The Long Term Financial Planning Model delivers forecasted financial information. Actual
results are likely to vary from the information presented, and these variations may be material.
This Model has been prepared for the purpose of building a Long Term Financial Planning
Model for Local Government in South Australia. The information contained in this Model may
not be appropriate for any other purpose.
Copyright: © South Australian Local Government Financial Management Group (SALGFMG),
2004. Neither the whole nor any part of this Model may be reproduced or transmitted, in any
form or by any means, electronic, mechanical, photocopying or otherwise, without the prior
written permission of the SALGFMG.
South Australian Local Government Financial Management Group
Long Term Financial Planning 30-Year Model User Documentation
January 2005
Page 5 of 57
5. USER INSTRUCTIONS
DATA ENTRY TOOL
ACTION
Drop Down Menu
The Drop Down Menu is used by clicking on the arrow and making a selection
by clicking on the data choice. Only the data displayed in the list is relevant.
Data Entry Field
The Data Entry Field is used by clicking on the white cell with a black border and
using the keyboard to type in data. This is a free text field.
Check Button
The Check Button is used by clicking on the white/empty circle to select the data
to the side of the button. Once selected, the circle will become shaded with
black. Only one selection in a range of choices can be made.
Check Box
The Check Box is used by clicking on the white/empty square to select the data
to the side of the box. Once selected, the square will contain a black tick.
Multiple selections in a range of choices can be made.
Blue/Shaded Cells
The Blue/Shaded Cells are either for display of headings/titles or are formula
driven and should not be directly changed by the user. Instead, use the Data
Entry Fields which will consequently alter the shaded cells as required.
Menu Selection
Menu Selection through the Model may only be made from those headings
where the mouse icon changes to the pointing hand. You may then select the
heading by a single mouse click.
South Australian Local Government Financial Management Group
Long Term Financial Planning 30-Year Model User Documentation
January 2005
Page 6 of 57
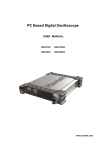
5.1 Main Menu
1
3
5
7
2
4
6
8
Reminder
The main menu buttons
should always be used
to close the model
rather than closing
Excel via the ‘X’
1. Main Menu button – this button is located on each screen within the Model. Clicking
on this button will return you to this ‘Main Menu’ screen.
2. Print Screen button – this button is present on the appropriate screens throughout the
Model. Clicking the button will automatically print the current screen using ONLY the
default printer for your computer. If you wish to print to a printer other than the default
printer, you must change the preferred printer to your default printer prior to selecting
the print option in this Model. If you do not have a printer installed this function will fail.
3. Disclaimer button – clicking here will display the disclaimer and copyright information
for the Model.
4. Save button - saves the Model, but leaves it open for continuing work. The Model will
be saved on your local drive.
5. Save As button - saves the Model to a location and file name specified by the user,
leaving it open to continue working.
6. Close Only button – closes the Model WITHOUT saving changes since the last save.
There is a confirmation pop-up window to guard against work being accidentally lost.
7. Save & Close button – closes the Model whilst simultaneously saving your work.
8. The list of screens available to build and report against with the LTFP Model.
South Australian Local Government Financial Management Group
Long Term Financial Planning 30-Year Model User Documentation
January 2005
Page 7 of 57
5.2 Open the Model in Microsoft Excel
STEP 1
Open Microsoft Excel from the Windows Start button.
From the Excel Tool Bar click on the TOOLS drop down menu
From the drop down menu click on the MACRO option
A second drop down menu will appear, then click the SECURITY option.
A box will appear in the middle of the screen. On the SECURITY LEVEL tab, select the
MEDIUM setting by clicking on the adjacent circle. This will allow you to enable macros for
the Model.
Click OK. This will close the box and you are ready to use the Model.
South Australian Local Government Financial Management Group
Long Term Financial Planning 30-Year Model User Documentation
January 2005
Page 8 of 57
STEP 2
From the FILE option on the Excel tool bar, click OPEN and click twice on the LTFP Model
from the drive location.
Click on the ENABLE MACROS button.
This screen below will appear.
User Tip
The Model will not operate
properly without the Enable
Macros option switched on in
Excel.
HOT TIP
To prevent you saving over the master copy or your existing versions of the
Model, create a new version each time the Model is opened. Click SAVE AS
from the FILE menu and rename the version.
South Australian Local Government Financial Management Group
Long Term Financial Planning 30-Year Model User Documentation
January 2005
Page 9 of 57
6. RECOMMENDED MODELLING APPROACH
6.1 Enter Base Year Data
•
SAVE the Model with a name easily identifying the Model as the start from which all
scenarios will be compared and the base year data used for Modelling.
•
In the Model Customisation Settings change the Council name
•
Also change the Model name to BASE DATA(yyyy) and the date in the “First Year Is
Ending Year” to the date of the BASE YEAR data entered.
•
Enter the values of the finalised end of year financial position for Council into the BASE
YEAR column of each BUILD SCREEN:
o
Operating Revenue Build
o
Operating Expenses Build
o
Capital Revenue Build
o
Capital Expenditure Build – Enter the Infrastructure & Asset Management Plan,
including Strategic Initiatives, for ALL future years
o
Financing Activity Menu – Existing Loan Data – Enter existing Loan
Commitments for ALL future years
o
Reserve Transfers Build
o
Balance sheet Items Build
TIP 1:
•
Ensure that all BASE YEAR entries reflect the level of detail you wish to
Model for. The Model requires a consistent level of detail for each line of
detail, year-on-year.
Print the reports to ensure the base year data in the Model agrees with the reported
end of year position for that year
•
SAVE the Model as LTFP BASE DATA(yyyy).
6.2 Enter Assumptions for Modelling Period
•
In the Model Customisation Settings change the “Model is for” to 30 years.
•
Enter the percentage assumptions for Council into the following ASSUMPTION
SCREENS:
o
General Extrapolation Assumptions
o
Operating Revenue Assumptions
o
Operating Expenses Assumptions
o
Balance sheet Items Assumptions
South Australian Local Government Financial Management Group
Long Term Financial Planning 30-Year Model User Documentation
January 2005
Page 10 of 57
TIP 1:
Reduce unnecessary complexity and uncertainty. If uncertain about future
assumption changes – assume no change.
Example: if CPI is forecast to 2008 as 2.1% and beyond is unknown, all
future years are assumed 2.1% from the known period
TIP 2:
Capital Expenditure Assumptions require an average % depreciation rate for
each class of asset. The BASE YEAR is known and manually input. The
Year 1 forecast should reflect the adopted budget for Council. This means
the “average depreciation” percentage will be the percentage that brings the
Year 1 depreciation figure in the Model closest to the adopted budget
depreciation value for each class of asset.
•
Review each BUILD SCREEN to ensure forecasts reflect expected outcomes.
•
Print all Assumptions Screens.
•
Re-SAVE the Model as LTFP BASE DATA(yyyy).
6.3 Reflect Completion of Existing Project Commitments
•
In the Model Customisation Settings change the “Model is for” to 5 years (10 years only
if required).
•
Using the New Initiatives and Manual Adjustments Screens ONLY, enter the following
type of information into the Model:
o
$ value effects of completing asset purchases outstanding in the Infrastructure
& Asset Management Plan, including Strategic Initiatives, beyond the base year
Model data.
o
$ value effects of ongoing asset maintenance excluded from the Infrastructure
& Asset Management Plan, including Strategic Initiatives, beyond the base year
Model data.
o
$ value effects of completing and maintaining new services/projects beyond the
base year Model data.
o
Reflect the effects of changes to non-current provisions and other balance
sheet commitments materially effecting cash movements.
•
Review each BUILD SCREEN to ensure forecasts reflect expected outcomes:
o
Year 1 is the first forecast year of the Model, this should be equivalent to the
adopted budget of the current financial year
•
Print all Build Screens.
•
SAVE the Model as LTFP MODEL DATA(yyyy).
South Australian Local Government Financial Management Group
Long Term Financial Planning 30-Year Model User Documentation
January 2005
Page 11 of 57
6.4 Finalise Base Model Prior to Forecast Modelling
•
In the Model Customisation Settings change the “Model is for” to 30 years.
•
Review each report to determine if the forecasts ensure long-term financial
sustainability for Council.
•
Print all Reports and amend assumptions, new initiatives and manual adjustments
accordingly until Council is confident that committing to the existing project timetable
reflected in the Model ensures long term sustainability and that all variables are
understood.
•
Print all KPI reports and presentations.
•
Note all amendments on the “Free Text Notes Page”
•
Re-SAVE the Model as LTFP MODEL BASE(yyyy) – this File becomes the base point
from which ALL comparative analysis is made for each scenario Modelled.
6.5 Modelling Scenario Hints
•
Utilise the New Initiatives functionality for one-off projects and events
•
Utilise the Manual Adjustments functionality for on-going financial commitments, such
as new services etc.
•
Utilise the Financing menu, consolidating Councils lending through one single loan
entry for each year.
•
Print all KPI’s, reports and build screens for each scenario.
•
Note all amendments on the “Free Text Notes Page”
•
SAVE the Model as the scenario name given in the Model Customisation Settings
Screen.
•
ALWAYS check the 30 year outlook to ensure long term financial sustainability when
completing a scenario.
South Australian Local Government Financial Management Group
Long Term Financial Planning 30-Year Model User Documentation
January 2005
Page 12 of 57
7. MODELLING TECHNIQUES
7.1 Entering New Recurrent Activities via Manual Adjustments
Manual adjustments affect recurring revenue and expenditure in future years. Free text
fields enable the localisation and detail specific types of revenue and expenditure lines that
materially impact the long term financial forecast sustainability of Council. These free text
fields feed through all build screens and reports.
Example:
Council currently operate two types of commercial activity and will launch recycling
schemes to start in the current budget year.
The planned revenue for this operation will be:
• 1st Year revenue target $10,000
• 2nd Year revenue target $25,000
• 3rd Year revenue target $75,000
The base year will not show any income although revenue will be earned in future years
and so a revenue line will be required (as shown above).
The detail entered into the Revenue Build screen feeds through into the Manual
Adjustments screen, which will be used to enter the forecast recurrent planned revenue
targets.
South Australian Local Government Financial Management Group
Long Term Financial Planning 30-Year Model User Documentation
January 2005
Page 13 of 57
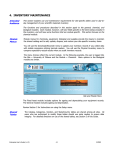
Navigate to the Manual Adjustments screen via the Main Menu.
The Manual Adjustments Screen refects all changes made in the free text fields of the
Build screens (shown below)
2
3
4
1
1. LIGHT BLUE CELLS – Light blue cells indicate the detail shown in the cell is fed
through from and manipulated in another part of the Model. Commercial Activity
Revenue is entered via the Free Text Field in the Operating Revenue Build screen.
The light blue cells cannot be edited or manipulated in the current screen.
2. RECURRENT REVENUE Year 1 – This will be the first revenue-earning year of
operation for the new scheme. The target revenue for this year is $10,000.
3. RECURRENT REVENUE Year 2 – This will be the second revenue-earning year of
operation for the new scheme. The target revenue for this year is $25,000. As Manual
Adjustments assume all activities are ongoing, only the year-on-year increase is to be
entered.
4. RECURRENT REVENUE Year 3 – This will be the third revenue-earning year of
operation for the new scheme. The target revenue for this year is $75,000. As Manual
Adjustments assume all activities are ongoing, only the year-on-year increase is to be
entered.
South Australian Local Government Financial Management Group
Long Term Financial Planning 30-Year Model User Documentation
January 2005
Page 14 of 57
Navigate to the Operating Revenue Build screen via the Main Menu.
The Operating revenue Build Screen will refect all changes made in the free text fields of
the Build screens (shown below)
2
3
4
1
1. FREE TEXT FIELDS – These fields feed through to the light blue cells in the
Manual Adjustments Screen screen.
2. RECURRENT REVENUE Year 1 – This will be the first revenue-earning year of
operation for the new scheme. The target revenue for this year is $10,000 and is
fed through from the Manual Adjustments screen.
3. RECURRENT REVENUE Year 2 – This will be the second revenue-earning year of
operation for the new scheme. The target revenue for this year is $25,000 plus the
effects of CPI and Operating Revenue Assumptions, year-on-year.
4. RECURRENT REVENUE Year 3 – This will be the third revenue-earning year of
operation for the new scheme. The target revenue for this year is $75,000 plus the
effects of CPI and Operating Revenue Assumptions, year-on-year.
South Australian Local Government Financial Management Group
Long Term Financial Planning 30-Year Model User Documentation
January 2005
Page 15 of 57
7.2 Entering One-Off Activities via New Initiatives
The New Initiatives screen enables Council to include $ values for one-off projects in the
Operating Revenue and Operating Expenditure Builds, as well as Capital purchases (by
class) in the Capital Expenditure Build. New Initiative revenue and expenditure only
affects the year in which the value is entered and does not effect future years.
The New Initiatives are not detailed by specific type of revenue or expenditure lines, but
appear as a single entry in the Build screens. The detail of the Initiatives can be printed
from the New Initiatives by using the print screen function.
Example:
Council plan to install internet facilities into the library at an estimated cost of $15,000 and
have a range of projects totalling a cost of $104,000.
2
1
1. CAPITAL EXPENSE COMPONENT – The free text field identifies the specific
project which requires the allocation of the Capital project to an asset class. The
value of $15,000 then feeds through to the Capital Expenditure Build Screen
against the asset class selected.
2. NEW INITIATIVE OPERATING EXPENDITURE – The total value of the individual
projects of $104,000 entered into the New Initiatives screen will feed through to the
relevant Build screen.
South Australian Local Government Financial Management Group
Long Term Financial Planning 30-Year Model User Documentation
January 2005
Page 16 of 57
Navigate to the Operating Expenditure Build screen via the Main Menu. The New
Initiatives expenditure line refects all projects entered into the New Initiatives Screen
(shown below) in light blue.
Navigate to the Capital Expenditure Build screen via the Main Menu. The New Initiatives
expenditure line refects all projects entered into the New Initiatives Screen under the
correct asset class (shown below) in light blue.
South Australian Local Government Financial Management Group
Long Term Financial Planning 30-Year Model User Documentation
January 2005
Page 17 of 57
8. MODEL CUSTOMISATION SETTINGS
STEP 1
To customise the Model to your specific Council:
Click on the MODEL CUSTOMISATION SETTINGS button on the main menu
The screen below will appear:
1
2
3
4
There are 4 options available to users to customise the Model as shown above.
1. COUNCIL NAME – Type in the name of your Council in the data entry field. Doing
so replicates the name throughout the Model screens and is included on the output
reports from the Model.
2. MODEL NAME – The default name is standard and can be changed. To reflect
specific internal version numbers type in the Model version reference in the data
entry field. The default cannot be edited; it must be retyped in full. This name
change will be automatically replicated throughout Model screens and reports.
HOT TIP
Save the Model version as the same FILE menu as the version name used in
the Model.
South Australian Local Government Financial Management Group
Long Term Financial Planning 30-Year Model User Documentation
January 2005
Page 18 of 57
3. FIRST YEAR IS YEAR ENDING – Use the drop down menus to select the correct
dates for the actual base year of the Model. All future year calculations will be
driven from the actual base year date. The base year data should be an actual end
of year financial position from which all assumptions are to be driven.
4. MODEL IS FOR – Click the check button alongside the length of time you desire
your Model to view and report on screen. Irrespective of this check box your Model
will always calculate for the full 30-year period. Changing this check button only
drives parameters and screen changes throughout the Model.
As the parameters and screen changes are made, a pop-up-box will appear to tell you
that Excel has completed the task.
Click OK in the pop-up-box window. This will complete your date selection for the
Model.
User Tip
The cursor may change to an
hour glass, indicating that the
model is recalculating. If the OK
button on the pop-up-box is
clicked, your selection will be
made.
Click on the MAIN MENU button to return to the main menu.
South Australian Local Government Financial Management Group
Long Term Financial Planning 30-Year Model User Documentation
January 2005
Page 19 of 57
9. GENERAL EXTRAPOLATION ASSUMPTIONS
STEP 1
The purpose of the General Extrapolation Assumptions is to apply CPI as a general
factor effecting Councils financial modelling. There is further functionality throughout the
Model where the user can determine if CPI is to be applied or not.
Year 1 is the actuals base year from which all assumptions are driven, and therefore does
not require a CPI factor to be entered. The year ending date entered in the customisation
screen will re-appear as Year 1 in the General Extrapolation Assumptions.
1. CPI CHANGE – Click on the drop down box for each subsequent year to be
calculated in the Model. CPI changes can be made between -5% and +20%. A CPI
estimate MUST be provided for each year of the Model, even if the year is not in
use for the Model calculation.
2. PRINT SCREEN – It is recommended that ALL General Extrapolation
Assumptions used in the Model are printed for reference.
2
1
Click on the MAIN MENU button to return to the main menu.
South Australian Local Government Financial Management Group
Long Term Financial Planning 30-Year Model User Documentation
January 2005
Page 20 of 57
10. OPERATING REVENUE ASSUMPTIONS & BUILD
STEP 1
The purpose of the Operating Revenue Build screen is to:
1. Enter the actuals base year revenue values in $(‘000) for each revenue line to be
used in the Modelling calculations.
2. Present all future years operating revenue information, year on year, showing the
effects of CPI, specific line item assumptions and manual adjustments made.
Reminder
By clicking the
assumptions button at the
top of the page you can
return to the assumptions
screen and update the
revenue parameters.
3
1
2
Enter the $ value in ‘000s for each revenue type to be used in the Model calculations.
1. BASE YEAR VALUES - The actuals base year $ values for each revenue type is to
be entered into the data entry field and becomes the basis upon which the growth
factors effecting the revenue items are applied.
2. FREE TEXT FIELDS – There is space provided to expand on the descriptions for
each of the 10 classifications of User Charges and Commercial Activity Revenue
available for use within the Model.
If Council does not need to use all 10 types of charge, click the field to be left blank
and click the DELETE button. This will clear each field not to be used by Council.
3. PLANNING PERIOD PROJECTIONS - The CPI assumptions, Operating Revenue
Assumptions and Manual Adjustments are used to calculate the following year’s
figures. The calculation is a rolling calculation year upon year.
Click the ASSUMPTIONS button to enter the Operating Revenue Assumptions screen.
South Australian Local Government Financial Management Group
Long Term Financial Planning 30-Year Model User Documentation
January 2005
Page 21 of 57
STEP 2
By using the Revenue Assumptions screen the user will drive increases and decreases
in addition to CPI in percentage terms. If users wish to drive increases and decreases in $
value, the Manual Adjustments screen should be used from the main menu.
There are 8 types of percentage driven Operating Revenue Assumption available for
use. The revenue types are consistent with the reporting requirements of Council. These
are:
1.
2.
3.
4.
5.
6.
7.
8.
Rates Growth
Rates Revenue Increase
Adjustments to Grants – Specific
Adjustments to Grants – General
Adjustments to Statutory Charges
Adjustments to User Charges
Adjustments to Commercial Revenue
Adjustments to Investment Income
Year 1 is the actual base year from which all assumptions are driven. The year ending
date entered in the customisation screen will re-appear as Year 1 in the Operating
Revenue Assumptions and Revenue Build screens.
To access each entry screen for each revenue type use the scroll bar to the right of the
screen. By clicking the Top of Page button the user returns to the top of the page.
South Australian Local Government Financial Management Group
Long Term Financial Planning 30-Year Model User Documentation
January 2005
Page 22 of 57
STEP 3
Enter the % increase for each revenue type to be used in the Model calculations. All
changes will have a cumulative effect over the planning period. Click on the drop down
box for incremental growth factor changes to be calculated for each subsequent year in the
Model.
1. RATES – GROWTH – This is a growth factor relating to the increase in value and
number of rateable properties, effecting the General Rates income calculation. It
refers to both residential and business rateable properties in percentage terms.
Changes can be made between -5% and +10%.
2. RATES REVENUE INCREASE – A standard assumption within the Model is that
rates revenue increases will be in line with CPI. By using the Rates Revenue
Increase table the user will affect a growth/reduction for rates above or below CPI
in percentage terms. Changes can be made between -3% and +20%.
3. ADJUSTMENTS TO GRANTS – SPECIFIC – This is a growth factor for Specific
Grants Income in percentage terms. Changes can be made between -100% and
+100%. Click on the drop down box for each subsequent year to be calculated in
the Model.
4. ADJUSTMENTS TO GRANTS – GENERAL – This is a growth factor for Other
Grants Income in percentage terms. Changes can be made between -100% and
+100%. Click on the drop down box for each subsequent year to be calculated in
the Model.
5. ADJUSTMENTS TO STATUTORY CHARGES – This is a growth factor for
Statutory Charges Income in percentage terms. Changes can be made between
-100% and +100%. Click on the drop down box for each subsequent year to be
calculated in the Model.
6. ADJUSTMENTS TO USER CHARGES – This is a growth factor for User Charges
Income in percentage terms. All 10 types of User Charges are calculated from this
parameter. Changes can be made between -100% and +100%. Click on the drop
down box for each subsequent year to be calculated in the Model.
7. ADJUSTMENTS TO COMMERCIAL REVENUE – This is an income growth factor
for Commercial Revenue in percentage terms. All 10 types of Commercial
Revenue are calculated from this parameter. Changes can be made between 100% and +100%. Click on the drop down box for each subsequent year to be
calculated in the Model.
8. ADJUSTMENTS TO INVESTMENT INCOME – This is a growth factor for
Investment Income in percentage terms. Changes can be made between -100%
and +100%. Click on the drop down box for each subsequent year to be calculated
in the Model.
Click on the REVENUE BUILD button to access the Operating Revenue Build screen.
South Australian Local Government Financial Management Group
Long Term Financial Planning 30-Year Model User Documentation
January 2005
Page 23 of 57
10.1
Operating Revenue Build – Source of $ Value Calculation
Operating Income
Year Ended 30 June:
General Rates
CPI Adjustment
Growth
Rates Revenue Increase
Rates
Year 1
2004
$('000)
Year 2
2005
$('000)
Year 3
2006
$('000)
Year 4
2007
$('000)
Year 5
2008
$('000)
$ Value brought forward from Prior Year
General Extrapolation Assumptions %
Operating Revenue Assumptions %
Operating Revenue Assumptions %
44,000
Increases by Total %
Special Rates
40
Increases by CPI % + Manual Adjustments
Other Rates
40
Increases by CPI % + Manual Adjustments
Statutory Charges
1,815
Operating Revenue Assumptions % + Manual
Adjustments
User Charges
Free Text Field
User Charges Total
178
1,783
Operating Revenue Assumptions %
$ Total of All User Charges
Commercial Activity Revenue
Free Text Field
Commercial Activity Revenue Total
100
1,000
Operating Revenue Assumptions %
$ Total of All Commercial Activity Revenue
Grants - Specific
2,165
CPI % + Operating Revenue Assumptions % incr
+ Manual Adjustments
Grants - General Purpose
2,165
CPI % + Operating Revenue Assumptions % incr
+ Manual Adjustments
Grants - Other
Grants Subtotal
1,784
6,114
CPI % + Operating Revenue Assumptions % incr
+ Manual Adjustments
$ Total of All Grants Revenue
Investment Income
395
Operating Revenue Assumptions % + Manual
Adjustments
Reimbursements
274
Increases by CPI % + Manual Adjustments
Profit on Disposal of Assets
227
Capital Expenditure Build Screen
New Initiatives Revenue
-
Other
369
Total Operating Revenues
New Initiatives Build Screen
Increases by CPI % + Manual Adjustments
56,057
South Australian Local Government Financial Management Group
Long Term Financial Planning 30-Year Model User Documentation
January 2005
$ Total of All Operating Revenue
Page 24 of 57
11. OPERATING EXPENSES ASSUMPTIONS & BUILD
STEP 1
The purpose of the Operating Expenses Build screen is to:
1. Enter the actuals base year expenditure values in $(‘000) for each expense line to
be used in the Modelling calculations.
2. Present all future years operating expenditure information, year on year, showing
the effects of CPI, specific line item assumptions and manual adjustments made.
Enter the $ value in ‘000s for each expenditure type to be used in the Model calculations.
The actuals base year $ values for each expenditure type is to be entered into the data
entry field and becomes the basis upon which the growth factors effecting the expenditure
items are applied.
Free text fields are provided to expand on the descriptions for each of the 10
classifications of Other Expenses available for use within the Model. If Council does not
need to use all 10 types of charge, click the field to be left blank and click the DELETE
button. This will clear each field not to be used by Council.
Click the ASSUMPTIONS button to enter the Operating Expenditure Assumptions
screen.
South Australian Local Government Financial Management Group
Long Term Financial Planning 30-Year Model User Documentation
January 2005
Page 25 of 57
STEP 2
By using the Operating Expenses Assumptions screen the user will drive increases and
decreases in addition to CPI in percentage terms. If users wish to drive increases and
decreases in $ value, the Manual Adjustments screen should be used from the main
menu.
There are 12 types of percentage driven Operating Expenditure Assumption available
for use. The expenditure types are consistent with the reporting requirements of Council.
These are:
1. Apply CPI to Expenses?
2. Salaries Increase
3. Wages Increase
4. TVSP’s
5. Contractors
6. Materials
7. Utilities
8. Workers Compensation
9. Catchment Levy
10. Insurance
11. Productivity Savings
12. Productivity Savings Drivers
Year 1 is the actual base year from which all assumptions are driven. The year ending
date entered in the customisation screen will re-appear as Year 1 in the Operating
Expenditure Assumptions and Expenditure Build screens.
To access each entry screen for each expenditure type use the scroll bar to the right of the
screen. By clicking the Top of Page button the user returns to the top of the page.
1. APPLY CPI TO EXPENSES? – Click on the tick box for each expenditure line that
is to be affected by the CPI value entered into the General Extrapolation
Assumptions screen. This option enables the user to determine if CPI is to be a
cost driver against each individual line item, in addition to the assumptions entered
and the Manual Adjustments.
The example below shows CPI will not be applied to Salaries & Wages type costs.
South Australian Local Government Financial Management Group
Long Term Financial Planning 30-Year Model User Documentation
January 2005
Page 26 of 57
2. SALARIES INCREASE – This is a growth factor for Salaries expenses (Inside
staff) in percentage terms. Changes can be made between zero and +10%. Click
on the drop down box for each subsequent year to be calculated in the Model.
3. WAGES INCREASE – This is a growth factor for Wages expenses (Outside staff)
in percentage terms. Changes can be made between zero and +10%. Click on the
drop down box for each subsequent year to be calculated in the Model.
If the percentage increase between inside and outside staff is the same, it is not
necessary to split this expenditure and a single line item can be used for both
Salaries and Wages. This will not affect any performance indicators or summary
reporting.
4. TVSP’s – This is a growth factor for Terminations and Voluntary Separation
Packages (TVSP) expenses in percentage terms. Entering values in this expense
line affects any Salaries and Wages related KPI’s and reporting. Changes can be
made between –100% and +200%. Click on the drop down box for each
subsequent year to be calculated in the Model.
5. CONTRACTORS – This is a growth factor for each Contractors expense (General,
Domestic Recycling, Dumping Costs, Collection Costs, Elections) in percentage
terms. Changes can be made between zero and +10%. Click on the drop down
box for each subsequent year to be calculated in the Model.
6. MATERIALS – This is a growth factor for Materials expenses in percentage terms.
Changes can be made between zero and +10%. Click on the drop down box for
each subsequent year to be calculated in the Model.
7. UTILITIES – This is a growth factor for Utilities expenses (Electricity, Water, Fuel,
Natural Gas) in percentage terms. Changes can be made between zero and
+10%. Click on the drop down box for each subsequent year to be calculated in
the Model.
8. WORKERS COMPENSATION – This is a growth factor for Workers Compensation
expenses in percentage terms. Changes can be made between zero and +10%.
Click on the drop down box for each subsequent year to be calculated in the Model.
9. CATCHMENT LEVY – This is a growth factor for Catchment Levy expenses in
percentage terms. Changes can be made between zero and +10%. Click on the
drop down box for each subsequent year to be calculated in the Model.
10. INSURANCE ANNUAL ADJUSTMENTS – This is a growth factor for Insurance
Annual Adjustments expenses in percentage terms. Changes can be made
between –100% and +200%. Click on the drop down box for each subsequent
year to be calculated in the Model.
11. PRODUCTIVITY SAVINGS – Click on the drop down box for each subsequent year
to be calculated in the Model. Productivity Savings changes can be made between
zero and +20%. The chosen percentage Productivity Saving will ONLY be
calculated against the expenditure lines ticked on the Productivity Savings
Driver.
South Australian Local Government Financial Management Group
Long Term Financial Planning 30-Year Model User Documentation
January 2005
Page 27 of 57
12. PRODUCTIVITY SAVINGS DRIVER - Click on the check button for each
expenditure type to be included in the productivity savings calculation in the Model.
The example below shows the 1.5% productivity savings target years 9 to 29 will not
be calculated on the following expense types:
• Salaries
• Wages
• TVSP’s
• Contractors – Elections
• Financing Lease Interest
• Depreciation
Reminder
The following links are
available for selection:
Print Screen Button,
navigation to the Build
Screen and the Top of
Page link.
Click on the MAIN MENU button to return to the main menu.
South Australian Local Government Financial Management Group
Long Term Financial Planning 30-Year Model User Documentation
January 2005
Page 28 of 57
11.1
Operating Expenses Build – Source of $ Value Calculation
Operating Expenses
Year Ended 30 June:
Year 1
2004
$('000)
Year 2
2005
$('000)
Year 3
2006
$('000)
Year 4
2007
$('000)
Year 5
2008
$('000)
Salary & Wages
16,224
Operating Expenses Assumptions % + CPI if ticked + Manual Adjustments
Superannuation
2,000
Operating Expenses Assumptions % + CPI if ticked + Manual Adjustments
10
18,234
Operating Expenses Assumptions % + CPI if ticked + Manual Adjustments
$ Total of All Employee Costs
8,535
Operating Expenses Assumptions % + CPI if ticked + Manual Adjustments
768
Operating Expenses Assumptions % + CPI if ticked + Manual Adjustments
Contractors - Dumping Costs
1,313
Operating Expenses Assumptions % + CPI if ticked + Manual Adjustments
Contractors - Collection Costs
1,562
Operating Expenses Assumptions % + CPI if ticked + Manual Adjustments
230
12,408
Operating Expenses Assumptions % + CPI if ticked + Manual Adjustments
$ Total of All Contractors
Materials
2,718
Operating Expenses Assumptions % + CPI if ticked + Manual Adjustments
Utilities - Electricity
1,000
Operating Expenses Assumptions % + CPI if ticked + Manual Adjustments
Utilities - Water
1,000
Operating Expenses Assumptions % + CPI if ticked + Manual Adjustments
Utilities - Fuel
1,000
Operating Expenses Assumptions % + CPI if ticked + Manual Adjustments
Utilities - Natural Gas
Utilities Sub-total
154
3,154
Operating Expenses Assumptions % + CPI if ticked + Manual Adjustments
$ Total of All Utilities
Financing Loan Interest
2,060
Financing Activity Summary
Leasing Interest
1,060
Leases Activity Summary
Interest - Other
Finance/Interest Sub-total
562
3,682
Operating Expenses Assumptions % + CPI if ticked
$ Total of All Finance/Interest
Depreciation
6,450
Capital Expenditure Build Screen
Loss on Disposal of Assets
-
Capital Expenditure Build Screen
Workers Comp Premium
650
Operating Expenses Assumptions % + CPI if ticked + Manual Adjustments
1,079
Operating Expenses Assumptions % + CPI if ticked + Manual Adjustments
TVSPs
Employee Costs Subtotal
Contractors - General
Contractors - Domestic Recycling
Contractors - Elections
Contractors Subtotal
Catchment Levy
Rate rebates/capping
476
% increase equal to Total Rates % increase + Manual Adjustments
Rate appeals
196
% increase equal to Total Rates % increase + Manual Adjustments
6
% increase equal to Total Rates % increase + Manual Adjustments
Rate expenses
Insurance
597
Operating Expenses Assumptions % + CPI if ticked + Manual Adjustments
Other Expenses
Free Text Field
Other Expenses Sub-total
330
3,345
3,345
Total Operating Expenses
51,373
53,146
Productivity Savings
Operating Expenses Net of Savings
Increases by CPI %
3,345
3,345
53,804
55,788
3,345
55,186
All ticked Spend Types contribute to % increase
51,373
53,146
South Australian Local Government Financial Management Group
Long Term Financial Planning 30-Year Model User Documentation
January 2005
53,804
55,788
55,186
Page 29 of 57
12. CAPITAL REVENUE BUILD
STEP 1
The Capital Revenue Build is slightly different from previous build screens as it is not
driven from drop down menu-based percentage assumptions. Instead, Capital Revenue
information is typed in using the data entry fields on an annual basis to be used for the
Model.
There are 6 types of Capital Revenue available for use in this Model. The Capital
Revenue entered in the Model is to be sourced form Councils Infrastructure & Asset
Management Plan, including Strategic Initiatives. The first year or base year date is driven
from the Customisation screen.
There are no assumption drivers available for Capital Revenue Build Items.
Enter the $ value in ‘000s for each capital revenue type to be used into the data entry field
for each plan year in the Model.
Click on the MAIN MENU button to return to the main menu.
South Australian Local Government Financial Management Group
Long Term Financial Planning 30-Year Model User Documentation
January 2005
Page 30 of 57
13. CAPITAL EXPENDITURE BUILD
STEP 1
The purpose of the Capital Expenditure Build screen is to:
1. Enter the actuals base year Asset values in $(‘000) for each Asset Class to be used
in the Modelling calculations.
2. Enter all future years asset replacement, renewals, revaluation and disposals
information as calculated in the Infrastructure & Asset Management Plan, including
Strategic Initiatives.
There are 18 Asset Classes available for use within the Capital Expenditure Build
screen. These Asset Classes are listed below:
1. Furniture & Fittings
2. Equipment: IT
3. Equipment: Plant
4. Equipment: Other
5. Infrastructure:
Roads
6. Infrastructure:
Footpaths
7. Infrastructure:
Stormwater Drainage
8. Infrastructure:
Reserves
9. Infrastructure:
Other
10. Buildings
11. STEDS
12. Airports
13. Marinas
14. Land
15. Land:
Land Held For Resale
16. Investments
17. Assets Under Lease (Amortisation)
18. Bridges
There are no assumption drivers for modelling the various Asset Classes. All entries are to
follow the Infrastructure & Asset Management plan and Strategic Initiatives over the
planning period. New Capital purchases are to be entered using the New Initiatives Build
screen.
Enter the $ value in ‘000s for each Asset Class to be used in the Model calculations.
1. ASSETS UNDER LEASE – Finance lease values are entered in via the Leases
Menu option (See section 13.2).
2. BOOK VALUE ON DISPOSAL – When entering a profit or loss on the sale of an
asset, the Model assumes the depreciation for the period does not include the
depreciation written-off when the sale is made. To ensure the Model remains in
balance, the depreciation written-off on the sale of an asset must be entered in
addition to depreciation for the period and the profit or loss as a result of the sale.
South Australian Local Government Financial Management Group
Long Term Financial Planning 30-Year Model User Documentation
January 2005
Page 31 of 57
The Capital Purchases, other than renewals and replacement assets, are to be entered via
the New Initiatives screen. These can be identified by the light blue colour on the Model.
Definition –
Replacement: To substantially improve or replace
(i.e. substantially improve an existing asset, including sale and purchase of a
like item to undertake the same operation or used for the same purpose)
Definition –
Renewal:
Definition –
New Capital Initiative: An Asset not previously owned or utilised by Council
To upgrade (i.e. new seal on a road surface)
Click on the MAIN MENU button to return to the main menu.
HOT TIP
Assets Under Lease are populated via the LEASING menu ONLY, and are
subject to a unique amortisation rate from all other assets.
South Australian Local Government Financial Management Group
Long Term Financial Planning 30-Year Model User Documentation
January 2005
Page 32 of 57
STEP 2
Navigating to the Balance Sheet Items Build, the non-current assets summary in the
Capital Expenditure Build screen feeds through to the Non Current Asset Items.
South Australian Local Government Financial Management Group
Long Term Financial Planning 30-Year Model User Documentation
January 2005
Page 33 of 57
13.1
Capital Expenditure Build – Source of $ Value Calculation
Asset Class
Year Ended 30 June:
Year 1
2004
$(‘000)
Year 2
2005
$(‘000)
Year 3
2006
$(‘000)
Year 4
2007
$(‘000)
Opening Balance
Replacement
Renewals
New Initiatives/CapEx
Manual Entry
Manual Entries
New Initiatives Screen
Revaluation
Manual Entry
Less Disposals
Manual Entry
Sub Total
Subtotal of above
Depreciation
Manual Entry
Closing Balance
Total of above
Profit/(Loss) on Disposal
Manual Entry
South Australian Local Government Financial Management Group
Long Term Financial Planning 30-Year Model User Documentation
January 2005
Year 5
2008
$(‘000)
Page 34 of 57
13.2
Leases Menu
STEP 1
There are 3 menu options under the Finance Lease menu available to users, which are
detailed below:
1. LEASES SUMMARY – This option provides a summary of all leasing information
that has been entered under the Leasing menu option for review, which will be
represented in the Capital Expenditure Build screen of the Model.
2. EXISTING LEASES DATA – This information is manually entered using the data
entry fields from schedules of payments relating to existing leases. When
combined with additional leases planned, they make up the summary reported in
outputs.
This menu option must be used if the user chooses to manually enter all new
leasing activities into the Model.
3. INDIVIDUAL LEASES – The Model allows for up to 20 new leases to be
introduced over the FUTURE planning period. This option can ONLY be used for
forecasting as the Model will produce unexpected results if individual loans are
entered into the base year.
1
2
3
The Leases menu option operates in the same way as the Financing Activity menu
(detailed instructions for this menu option are provided below).
South Australian Local Government Financial Management Group
Long Term Financial Planning 30-Year Model User Documentation
January 2005
Page 35 of 57
14. FINANCING ACTIVITY MENU
STEP 1
There are 3 menu options available to users, which are detailed below:
1. FINANCING ACTIVITY SUMMARY – This option provides a summary of all loans
and finance information that has been entered under the Financing Activity menu
option for review, which will be represented in the reporting function of the Model.
2. EXISTING LOAN DATA – This information is manually entered using the data
entry fields from schedules of payments relating to existing loans. When combined
with additional loans planned, they make up the summary reported in outputs (see
Existing Loans below).
3. INDIVIDUAL LOANS – The Model allows for up to 20 new loans to be introduced
over the FUTURE planning period. This option can ONLY be used for forecasting
as the Model will produce unexpected results if individual loans are entered into the
base year.
1
2
3
See the following page for further information on the entry of data.
HOT TIP
Calculate the level of borrowings required for each forecast year prior to
utilising the Financing Activity menu function.
Enter a SINGLE loan for each financial year of the Model to represent
borrowings and ALWAYS click the ‘Generate Loan’ button.
South Australian Local Government Financial Management Group
Long Term Financial Planning 30-Year Model User Documentation
January 2005
Page 36 of 57
STEP 2
Click on the EXISTING LOAN DATA button. This screen requires the user to prepare
schedules of payments relating to EXISTING loan liabilities in advance. These are to be
split between loans to finance Council activities, versus loans to external organisations
referred to as “community loans”.
This screen can also be used for manually entering all loans related values for the entire
period of the Planning Model if the user chooses not to use any other functionality provided
within the Models Financing menu.
Reminder
Data is entered
into these cells
as thousands
Enter the values for Existing Loans to be used in the Model calculations.
1. OPENING BALANCE – Ensure that the opening balance value shown in Year 1 is
equal to the closing balance of the Actuals Base Year figures. The Year 1 figures
should reflect the current year (adopted) budget movement.
2. NEW LOANS – If the user chooses to manually enter all new loans activities into
the Model, the full liability value of the new loans is to be entered into this line.
3. REPAYMENT OF PRINCIPAL – If the user chooses to manually enter all new
loans activities into the Model, this line must include both existing and future loans
principal repayment values.
4. INTEREST PAYMENTS – If the user chooses to manually enter all new loans
activities into the Model, this line must include both existing and future loans
interest repayment values.
Click on the FINANCING MENU button to return to the financing menu.
South Australian Local Government Financial Management Group
Long Term Financial Planning 30-Year Model User Documentation
January 2005
Page 37 of 57
STEP 3
Click on the LOAN 1 button to enter details of a future loan in the Loan Parameters Panel.
Reminder
Data is entered into the
Loan Amount data entry
field in whole dollars (not
thousands of dollars on
this occasion)
Use the data entry fields to type in the loan name.
Enter the Loan Amount in whole dollars.
Use the drop down menus to complete the remaining details of the loan.
This Model calculates both interest generating and interest only loans.
By ticking the Community Loans indicator means Council is entering into a loan on behalf
of other entities, such as charities and local sporting organisations. These loans became
assets as well as liabilities in the Statement of Financial Position.
ALWAYS click the GENERATE LOAN button to review the information and print a
summary if required. Please note the GENERATE LOAN button must always be triggered
to ensure a satisfactory calculation within the date ranges of the Model.
The loan information is automatically driven through to the Financing Activity Summary
and the Model reporting.
Click on the FINANCING MENU button to return to the financing menu.
Continue entering financing data for future loan details.
options available.
South Australian Local Government Financial Management Group
Long Term Financial Planning 30-Year Model User Documentation
January 2005
The model has 20 new loan
Page 38 of 57
STEP 4
Click on the FINANCING ACTIVITY SUMMARY button.
This option provides a summary of ALL loans information entered into the Model for
review.
By scrolling down, the financing activity represented in the reporting function of the Model
is available for users to review. Only active loans will appear in this screen
Click on the MAIN MENU button to return to the main menu.
South Australian Local Government Financial Management Group
Long Term Financial Planning 30-Year Model User Documentation
January 2005
Page 39 of 57
15. RESERVE TRANSFERS BUILD
STEP 1
Enter the values for the TRANSFERS TO RESERVES and TRANSFERS FROM
RESERVES to be used in the Model calculations.
Use the data entry fields to type in the values. This Model provides a facility to manually
type in transfers. Both debit and credit transfers should be keyed in as positive figures.
The reserves transfer information is automatically driven through to the Model reporting
and is not a mandatory menu option.
All transfers feed directly through to the AAS27 Statement of Changes in Equity report.
Click on the MAIN MENU button to return to the main menu.
South Australian Local Government Financial Management Group
Long Term Financial Planning 30-Year Model User Documentation
January 2005
Page 40 of 57
16. BALANCE SHEET ITEMS ASSUMPTIONS & BUILD
STEP 1
The purpose of the Balance Sheet Items Build screen is to:
1. Enter the actuals base year Balance sheet items values in $(‘000) for each Balance
sheet line to be used in the Modelling calculations.
2. Present all future years Balance Sheet Item information, year on year, showing the
effects of CPI, specific line item assumptions and manual adjustments made.
Enter the $ value in ‘000s for each Balance sheet line item to be used in the Model
calculations.
Click the ASSUMPTIONS button to enter the Balance sheet Assumptions screen.
South Australian Local Government Financial Management Group
Long Term Financial Planning 30-Year Model User Documentation
January 2005
Page 41 of 57
STEP 2
The Assumptions Drivers only affect the CURRENT assets and liabilities items. There are
2 types of assumption driver affecting current assets and current liabilities assumptions
available to users in the Balance Sheet Items Assumptions screen, which are detailed
below:
1. DROP DOWN % DRIVER – The drop down % drivers are used to determine the
percentage target to be applied across all years for a specific line item in the
Balance sheet.
2. CHECK BOX % DRIVER – The check boxes determine whether or not a CPI factor
is added to these line items.
1
2
South Australian Local Government Financial Management Group
Long Term Financial Planning 30-Year Model User Documentation
January 2005
Page 42 of 57
16.1
Current Assets & Liabilities Assumptions
STEP 1
Enter the % increase or check/uncheck the box for each current asset or liability balance
sheet item to be used in the Model calculations. The growth factor changes will be applied
and calculated for each subsequent year in the Model. The percentage parameter will be
applied to each individual year as detailed below:
Current Assets Assumptions
1. RECEIVABLES – PERCENTAGE OF RATES – This parameter drives a
calculation to determine the $value for Receivables - Rates (net) outstanding at the
end of a financial year. Click on the drop down box for the target percentage,
between zero and +100% to be applied. The percentage driver will calculate the
$value as a percentage of rates revenue. Each financial year is calculated
independently of the next.
If the percentage is set to 20% and the Total Rates Revenue is $400,000, Rates
debtors, Receivables - Rates (net), will be calculated for that year as $80,000.
2. RECEIVABLES – PERCENTAGE OF OTHER – Click on the check box if
Receivables - other is to be affected by the CPI value entered into the General
Extrapolation Assumptions screen. If checked, CPI is applied as a growth factor
for each subsequent year in the Model.
3. INVENTORY – Click on the check box if Inventory is to be affected by the CPI
value entered into the General Extrapolation Assumptions screen. If checked,
CPI is applied as a growth factor for each subsequent year in the Model.
4. OTHER – Click on the check box if Current Asset Items - Other is to be affected by
the CPI value entered into the General Extrapolation Assumptions screen. If
checked, CPI is applied as a growth factor for each subsequent year in the Model.
Current Liabilities Assumptions
1. CREDITORS – TRADE PERCENTAGE – This parameter drives a calculation to
determine the $value for Creditors - Trade outstanding at the end of a financial
year. Click on the drop down box for the target percentage, between zero and
+100% to be applied. The percentage driver will calculate the $value as a
percentage of contractors and materials costs. Each financial year is calculated
independently of the next.
2. CREDITORS – OTHER PERCENTAGE – Click on the check box if Creditors other is to be affected by the CPI value entered into the General Extrapolation
Assumptions screen. If checked, CPI is applied as a growth factor for each
subsequent year in the Model. Users can also add additional growth as a $value
via the Model Manual Adjustments screen.
South Australian Local Government Financial Management Group
Long Term Financial Planning 30-Year Model User Documentation
January 2005
Page 43 of 57
3. PROVISIONS – Click on the check box if Provisions is to be affected by the CPI
value entered into the General Extrapolation Assumptions screen. If checked,
CPI is applied as a growth factor for each subsequent year in the Model. Users
can also add additional growth as a $value via the Model Manual Adjustments
screen.
4. OTHER – Click on the check box if Current Liability Items - Other is to be affected
by the CPI value entered into the General Extrapolation Assumptions screen. If
checked, CPI is applied as a growth factor for each subsequent year in the Model.
Users can also add additional growth as a $value via the Model Manual
Adjustments screen.
Click on the B/SHEET BUILD button to return to the Balance sheet Build screen.
South Australian Local Government Financial Management Group
Long Term Financial Planning 30-Year Model User Documentation
January 2005
Page 44 of 57
16.2
Balance Sheet Items Build – Source of $ Value Calculation
Current Asset Items
Year Ended 30 June:
Year 1
2004
$(‘000)
Cash & Investments
Receivables – Rates (net)
Year 2
2005
$(‘000)
Year 3
2006
$(‘000)
Year 4
2007
$(‘000)
Statement of Cash Flows closing balance
Balance Sheet Items Assumptions % of Total Rates Revenue
Receivables – other
Prior Year + CPI% Increment if Ticked
Inventory
Prior Year + CPI% Increment if Ticked
Loans to Community Groups
Financing Activity
Other
Non Current Asset Items
Year Ended 30 June:
Prior Year + CPI% Increment if Ticked
Year 1
2004
$(‘000)
Year 2
2005
$(‘000)
Year 3
2006
$(‘000)
Year 4
2007
$(‘000)
Receivables
Prior Year + Manual Adjustments
Inventory
Prior Year + Manual Adjustments
Investments
Prior Year + Manual Adjustments
Land
Capital Expenditure Build Screen
Buildings
Capital Expenditure Build Screen
Infrastructure
Capital Expenditure Build Screen
Plant & Equipments
Capital Expenditure Build Screen
Furniture, Fixture & Fittings
Capital Expenditure Build Screen
Loans to Community Groups
Other
Year 5
2008
$(‘000)
Financing Activity
Prior Year + Manual Adjustments
South Australian Local Government Financial Management Group
Long Term Financial Planning 30-Year Model User Documentation
January 2005
Year 5
2008
$(‘000)
Page 45 of 57
Current Liabilities Items
Year Ended 30 June:
Year 1
2004
$(‘000)
Bank Overdraft
Year 2
2005
$(‘000)
Year 3
2006
$(‘000)
Year 4
2007
$(‘000)
Year 5
2008
$(‘000)
Statement of Cash Flows closing balance
Creditors – Trade
Balance Sheet Items Assumptions % of Contractors &
Materials costs
Creditors – other
Prior Year + CPI% Increment if Ticked + Manual Adjustments
Provisions
Prior Year + CPI% Increment if Ticked + Manual Adjustments
Loans – Financing
Financing Activity
Leases
Leasing Activity
Other
Prior Year + CPI% Increment if Ticked + Manual Adjustments
Non Current Liabilities Items
Year Ended 30 June:
Year 1
2004
$(‘000)
Year 2
2005
$(‘000)
Year 3
2006
$(‘000)
Year 4
2007
$(‘000)
Creditors
Prior Year + Manual Adjustments
Provisions
Prior Year + Manual Adjustments
Loans – Financing
Year 5
2008
$(‘000)
Financing Activity
Leases
Leasing Activity
Other
Prior Year + Manual Adjustments
Equity
Year Ended 30 June:
Year 1
2004
$(‘000)
Year 2
2005
$(‘000)
Year 3
2006
$(‘000)
Year 4
2007
$(‘000)
Accumulated Surplus
Statement of Changes in Equity
Asset Revaluation Reserve
Statement of Changes in Equity
Other Reserves
Statement of Changes in Equity
South Australian Local Government Financial Management Group
Long Term Financial Planning 30-Year Model User Documentation
January 2005
Year 5
2008
$(‘000)
Page 46 of 57
17. NEW INITIATIVES BUILD
STEP 1
The New Initiatives screen is based entirely upon manual input of data by using the data
entry fields.
Enter the $ value in ‘000s for both the Operating and Capital Expenses components to be
used in the Model calculations.
1. OPERATING COMPONENTS – All values for New Initiatives entered into the
Operating Income or Expense areas of this screen will be fed through to a single
New Initiative Revenue or Expense line in the Operating Build screens.
2. CAPITAL EXPENSE COMPONENTS – All values for New Capital Expense
Initiatives entered into the Capital Expense area of this screen required allocating
to an Asset Class. This is MANDATORY. When allocated, these values will be fed
through to a single New CapEx Initiative Expense line for each Asset Class in the
Capital Build screens. .
Suggestion
This area of the model
has been deliberately left flexible
in nature. You may list initiatives
as operating, capital or both
Reminder
Data is entered into the
New Initiatives data entry
fields as thousands of
dollars
Click on the MAIN MENU button to return to the main menu.
South Australian Local Government Financial Management Group
Long Term Financial Planning 30-Year Model User Documentation
January 2005
Page 47 of 57
18. MODEL MANUAL ADJUSTMENTS
STEP 1
The Manual Adjustments screen is based entirely upon manual input of data by using the
data entry fields.
Enter the $ value in ‘000s for both the Operating and Balance sheet components to be
used in the Model calculations.
1. RECURRENT VALUES – All values entered into the Manual Adjustments screen
are assumed to have an ongoing effect upon the financial activities of Council and
therefore are included in the brought forward value of all calculations within the
Model for each individual line.
An entry of $10,000 into the Grants – Specific line will assume these additional
grants funds will be available for all subsequent years and subject to the
assumptions applied to each individual year.
If a reduction is required then a negative value can be entered and this will be
reflected in subsequent years.
Reminder
Data is entered into the
New Initiatives data entry
fields as thousands of
dollars
Click on the MAIN MENU button to return to the main menu.
South Australian Local Government Financial Management Group
Long Term Financial Planning 30-Year Model User Documentation
January 2005
Page 48 of 57
19. LONG TERM FINANCIAL PLANNING OUTPUTS
The Long Term Financial Reporting menu offers three types of reports, each with the
option of viewing on screen, printing to a default printer or exporting to Excel. These are:
1. Summary Reports
2. AAS 27 Reports
3. Detailed Reports
The reporting period for each report will be driven by the Model Customisation Settings
selection of either 3, 5, 10,20 or 30 years.
Please note: New Initiative Revenue/Expenditure and Productivity Savings may appear
under “other” in certain reports.
Simply select the VIEW/PRINT button, then the PRINT button for the report to print at the
default printer.
Exporting to Excel
Click the EXPORT button of the report you wish to create in Excel. Save the file to the
required location and file name. The user will not be able to manipulate this file until
exiting from the Model.
Click on the MAIN MENU button to return to the main menu.
South Australian Local Government Financial Management Group
Long Term Financial Planning 30-Year Model User Documentation
January 2005
Page 49 of 57
20. KEY PERFORMANCE INDICATORS
STEP 1
The Key Performance Indictors menu offers two views to the following performance
indicators:
1. Operating Revenue Increase
2. Operating Expenses Increase
3. Rates to Operating Revenue
4. Employee Costs to Operating Expenses
5. Operating Surplus/(Deficit) to Operating Revenue
6. Capital Outlay to Total Expenditure (Net)
7. Renewal & Replacement of Assets to Depreciation Costs
8. Net Debt to Equity
9. Net Debt to Operating Revenue
10. Net Finance Costs to Rates Revenue
11. Net Finance Costs to Total Operating Revenue
1. Dash Board
The purpose of the Dashboard is to give a quick view, using “traffic-lights style”
presentation, of Council’s performance within given tolerance rules.
Choosing the Dashboard Setup Screen provides the options to determine upper and
lower parameters for the dashboard (see Dashboard Parameter Settings below).
Based upon the parameters entered, indicators on the dash board automatically turn
green, red or remain white if within the tolerance. Care must be taken when
interpreting the colours as the settings are specific to each performance indicator.
2. Graphs
The purpose of the graphs is to give a quick view, using an area graph presentation, of
Council’s performance against a given target.
Choosing the Performance Indicator to be viewed, the user must provide a target
performance level against which the Model activity for that KPI will be reported.
Click on the DASHBOARD SETUP SCREEN button to access the dashboard setup.
South Australian Local Government Financial Management Group
Long Term Financial Planning 30-Year Model User Documentation
January 2005
Page 50 of 57
Dash Board Parameter Settings
The Dashboard Setup Screen is used to determine upper and lower parameters for the
dashboard, indicating whether performance is within, above or below expectations.
Use the drop down menus to set the parameters.
interpretation is follows:
Dashboard Parameter Setting
Below
Minimum
Red
Above
Maximum
Green
Operating Expenditure Increase
Green
Red
Rates To Operating Revenue
Green
Red
Employee Costs To Operating Expenses
Green
Red
Operating Surplus/(Deficit) To Operating Revenue
Red
Green
Capital Outlay To Total Expenditure
Red
Green
Renewal & Replacement Of Assets To Depreciation Costs
Red
Green
Net Debt To Equity
Green
Red
Net Debt To Operating Revenue
Green
Red
Net Finance Costs To Rates Revenue
Green
Red
Net Finance Costs To Total Operating Revenue
Green
Red
Key Performance Indicator
Operating Revenue Increase
Click on the DASHBOARD button to access the KPI DASHBOARD screen.
South Australian Local Government Financial Management Group
Long Term Financial Planning 30-Year Model User Documentation
January 2005
Page 51 of 57
Key Performance Indicators – Interpretation
IMPORTANT NOTE
Interpretation of the meaning of a red indicator or a green indicator will be
dependent upon the financial strategy of the individual Council.
Click on the KPI MENU button to return to the KEY PERFORMANCE INDICATOR graphs
screen access.
Enter the performance target percentage for each of the KPI’s to be used to monitor
Council’s performance. Not ALL KPI’s are relevant to ALL Councils. The following has
been provided to guide Council in choosing and interpreting KPI performance results.
1. OPERATING REVENUE INCREASE (from previous year)
Calculated on the percentage increase of Total Operating Revenue year upon year,
expressed as a percentage
2. OPERATING EXPENSES INCREASE (from previous year)
Calculated on the percentage increase of Total Operating Expenditure (net of
Productivity Savings) year upon year, expressed as a percentage
3. RATES TO OPERATING REVENUE
Calculated by the Total of General Rates and Other Rates divided by Total
Operating Revenue, expressed as a percentage
This indicates the level of reliance on rates revenue as a proportion to other forms
of revenue. It is important to consider the risk associated with a high dependence
on rate revenue.
South Australian Local Government Financial Management Group
Long Term Financial Planning 30-Year Model User Documentation
January 2005
Page 52 of 57
4. EMPLOYEE COSTS TO TOTAL OPERATING EXPENSES NET OF
PRODUCTIVITY SAVINGS
Calculated by the Salaries, Wages & TVSP’s costs divided by Total Operating
Expenses Net of Productivity Savings, expressed as a percentage
This ratio compares the $ value of operations against the total $ value of people
working in the organisation.
The ratio can provide a useful service delivery measure, especially when shown
against FTE numbers.
It is worth considering the effects of resourcing capital projects and contracting
arrangements when comparing this ratio year upon year.
5. OPERATING SURPLUS/(DEFICIT) TO OPERATING REVENUE
Calculated by Operating Surplus/(Deficit) divided by Total Operating Revenue,
expressed as a percentage
If a Council achieves a zero operating result (ie operating revenues equal operating
expenses), it would be in a position whereby its operating revenues would be, over
time, sufficient to finance the renewal and replacement of assets at the same rate
as assets are depreciating.
Where an operating surplus is achieved, the amount of the surplus is available for
capital expenditure on additional renewal/replacement of assets or new assets
without the need to increase the level of a Council’s net debt. When such additional
capital expenditure is not required the amount of the operating surplus can be
applied to reduce debt levels.
Where this percentage measure is negative, and a Council’s recorded rates of
depreciation (asset consumption) are broadly accurate, then more Council services
are being enjoyed than are being paid for. The value of a negative percentage
measure represents the extent to which additional revenue needs to be raised or
operating expenditure needs to be reduced to achieve a zero operating result.
6. CAPITAL OUTLAY TO TOTAL EXPENDITURE (NET) OF PRODUCTIVITY
SAVINGS
Calculated by Total Renewal/Construction Expenditure plus New Capital Initiatives
Expenditure (including Leased Assets), divided by Total Expenditure Net of
Productivity Savings, expressed as a percentage
Indicates the level of investment into new and existing assets as a proportion of
total expenditure for the period.
This helps identify the level of expenditure on service delivery as against capital
investment expenditure.
South Australian Local Government Financial Management Group
Long Term Financial Planning 30-Year Model User Documentation
January 2005
Page 53 of 57
7. RENEWAL & REPLACEMENT OF ASSETS TO DEPRECIATION COSTS
Calculated by Renewal & Replacement of Assets divided by Depreciation,
expressed as a percentage
This measure can assist in identifying the potential decline or improvement in asset
condition and standards.
A percentage less than 100 on an ongoing basis indicates that non-current assets
may be depreciating at a greater rate than their renewal or replacement.
A preferred alternative measure would be to compare capital investment
expenditure on renewal and replacement of non-current assets with the optimal
expenditure levels for such expenditure shown in the Council’s Infrastructure and
Asset Management plan.
8. NET DEBT TO EQUITY
Calculated by Bank Overdraft, Loans and Leases less Cash & Investments less
Loans to Community Groups divided by Total Equity, expressed as a percentage
The relationship between equity and debt is used to evaluate risk.
This ratio provides a window into how strong a Councils finances are.
A high debt to equity ratio could indicate that Council may be over-leveraged, and
should look for ways to reduce its debt.
This ratio should be read in conjunction with Net Debt to Operating Revenue Ratio.
9. NET DEBT TO OPERATING REVENUE
Calculated by Bank Overdraft, Loans and Leases less Cash & Investments less
Loans to Community Groups divided by Operating Revenue, expressed as a
percentage.
This measure is considered the most relevant in assessing the burden of a
Council’s debt. The measure indicates the percentage of one year’s operating
revenue, which is required to service Council’s net debt. In assessing a Council’s
financial condition, it is important to distinguish between gross debt (i.e. the value
of short-term and long-term borrowings and other forms of debt outstanding) and
net debt (i.e. gross debt less financial assets such as cash and investments).
A Council’s cash and investments represent direct offsets to its financial obligations
from borrowings. They also earn interest which is equally an offset to interest costs
on borrowings. As the amount of cash and investments held by Council may be
very large, it is important that account be taken of looking at long-term trends and
short-term movements in a Council’s debt position.
There is no right or wrong answer on what is an appropriate level of net debt.
However, it is important that a Council can rationalise its policy on debt levels
relative to its circumstances and satisfy itself that its policy will support its ongoing
financial sustainability and desired revenue and service level targets over the
planning cycle.
South Australian Local Government Financial Management Group
Long Term Financial Planning 30-Year Model User Documentation
January 2005
Page 54 of 57
10. NET FINANCE COSTS TO RATES REVENUE
Calculated by Finance/Interest Expense less Investment Income divided by
General Rates and Other Rates, expressed as a percentage.
This measure assesses the degree to which rates revenue is committed to meet
net interest costs.
A smaller percentage indicates that net interest costs are less of a burden on rates
revenue.
A negative percentage indicates that a Council’s level of net debt is negative (i.e.
its level of cash and investments exceeds outstanding borrowings).
The measure also helps assess the success or otherwise in managing interest rate
risks inherent in carrying debt.
11. NET FINANCE COSTS TO TOTAL OPERATING REVENUE
Calculated by Finance/Interest Expense less Investment Income divided by Total
Operating Revenue, expressed as a percentage.
This measure assesses the degree to which Operating revenue is committed to
meet net interest costs.
A smaller percentage indicates that net interest costs are less of a burden on
Operating revenue.
A negative percentage indicates that a Council’s level of net debt is negative (i.e.
its level of cash and investments exceeds outstanding borrowings).
The measure also helps assess the success or otherwise in managing interest rate
risks inherent in carrying debt.
IMPORTANT NOTE
Key Performance Indicator percentages are expressed to two decimal places.
All financial reports and build screens display numbers rounded to a whole
number.
Users may experience rounding issues when verifying key
performance indicator percentages to the $ values reported and shown in the
build screens.
South Australian Local Government Financial Management Group
Long Term Financial Planning 30-Year Model User Documentation
January 2005
Page 55 of 57
21. FREQUENTLY ASKED ACCOUNTING QUESTIONS (FAAQS)
21.1
Accounting for Assets Given Free of Charge
The value of both Land and Infrastructure Assets received free of charge are to be
entered into the Capital Revenue Build using the following line entries:
•
•
Dev Contrib-Non-cash Open Space
Dev Contrib-Non-cash Infrast
These feed through to the Contributed Assets lines within the Capital Expenditure
Build.
These entries create assets in the Statement of Financial Position but do not effect
the cash position.
HOT TIP
Entering assets received free of charge will impact the depreciation for future
periods.
The user MUST ensure depreciation is adjusted in future months for the
depreciation $value of contributed assets.
South Australian Local Government Financial Management Group
Long Term Financial Planning 30-Year Model User Documentation
January 2005
Page 56 of 57
21.2
Accounting for Community Loans
Community loans are identified within the Model via a tick box on the loan
calculating facility and are identified separately on the summary screens.
When a Community Loan is created, it is recognised as an asset and a liability
within the Statement of Financial Position. The Model will assume the principal
repayment will be recovered at the time it becomes payable.
HOT TIP
The financial impact to the Statement of Financial Position by Community
Loans will be automatic within the Model.
The user MUST ensure the interest payable incurred through the Operating
Expense is offset by a $value entered by the user in the Operating Revenue.
21.3
Accounting for Depreciation
The actual depreciation for each class of asset MUST be entered into the Capital
Expenditure Build screen manually for each year of the Model.
The user MUST ensure that depreciation is adjusted for every new asset, asset sale
or asset received free of charge that is entered into the Model.
21.4
Accounting for Work-In-Progress
Capital Work-In-Progress expenditure is reflected in the renewal and replacement
lines of the Capital Expenditure Build screen for each class of asset.
21.5
Full Absorption Costing Implications
The base year actuals entered into the Model will reflect full absorption costing
principles in the assets WIP figure. The user must consider the material impact of
changing costs in the Operating Expenditure Build (particularly salaries and wages)
if the level of asset replacement and renewals varies over time. The Model will
assume consistency of cost type, line by line and cannot accommodate such
changes without manual intervention.
21.6
Current and Non Current Loan and Lease Liabilities
The split between current and non-current loan and lease liabilities is calculated
WITHIN the Model. The current liability is assumed to be equal to the payment to
be made in the following year. The user must enter loans or lease data for more
than one year to enable the Model to calculate the current and non-current split.
South Australian Local Government Financial Management Group
Long Term Financial Planning 30-Year Model User Documentation
January 2005
Page 57 of 57
22. TROUBLESHOOTING
22.1
Exiting the Model Using ‘X’ in the Top Right Corner
If you exit the Model by using the ‘X’ in the top right corner of the window in Excel
rather than through the “Save & Close” or “Close Only” buttons in the Main Menu of
the Model, minor Excel settings on your computer may be changed.
The Calculation may be changed from ‘Automatic’ to ‘Manual’. To correct this open
Excel, click Tools Æ Options, then select the Calculation tab and ensure the check
button labelled ‘Automatic’ is selected (see below).
22.2
Entering New Loans and Leases Without Selecting the ‘Generate’ Button
If you enter new loans or leases data into the Model you may be changing the date
and/or cost patterns in the Model.
The Model does not automatically recognise these changes throughout the Model
unless the ‘Generate’ button on each new loans or lease tab is selected. To ensure
these are reflected correctly in the Model, ALWAYS select the ‘Generate’ button
when the new data has been entered or changed.
South Australian Local Government Financial Management Group
Long Term Financial Planning 30-Year Model User Documentation
January 2005