1
Manual for PS-I, 4.0.4
Lustick, December 2005
46
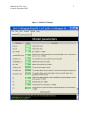
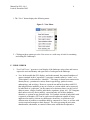
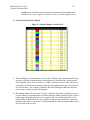
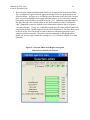
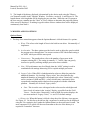
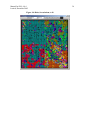
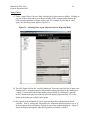
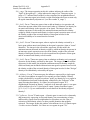
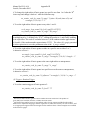
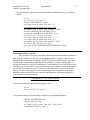
particular regions used in the creation of the model. Figure 26 shows the display that
appears when the “Statistics” button is clicked.
Figure 26: Diagrams, Statistics Display
31. Checking in the “Distribution box” will produce bias values, activated identity
prevalence, and other information for every time step for each identity. “Global
statistics” reports on the whole landscape. Different “Regional statistics” report on
particular regions. Checking the “Tension box” or the “Active agent count” box, without
checking the Distribution box, will result in statistics being displayed only for the total
tension or for the distribution of identity activation.
Generating the Model
32. The user can view or experiment with the model under construction by clicking
“Generate Model” and then using the “View” menu to click the “New Field Viewer”
button. When viewing and editing the model in this way it is important to remember that
PS-I remains in Diagrams mode. Most (though not all) of the observational and editing
tools available in PS-I itself are available in Diagrams mode to inspect and evaluate
landscapes viewable in Diagrams Mode. If the user wants to save the file in a form that
would permit continued work on it in Diagrams mode then the File button in the
Diagrams display should be clicked. If the “Save settings” button is clicked then those
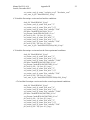
settings, with the name assigned by the user, will be available to be reloaded (using the
“load settings” button. These “in-progress” files have a “dia” extension assigned