1
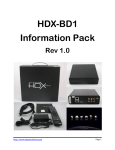
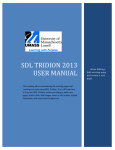
Cloud Control Panel User Manual v1.1
October 2010
Page: 1 / 43
Contents
1! Introduction ................................................................................................ 4!
2! Login procedure .......................................................................................... 5!
3! Using the Dashboard .................................................................................... 8!
3.1! Enabling the Detailed View ...................................................................... 9!
3.2! Stopping the component ....................................................................... 10!
3.3! Starting the component ........................................................................ 11!
3.4! Restarting the component ..................................................................... 12!
3.5! Editing the Description .......................................................................... 14!
3.6! Managing the Settings .......................................................................... 15!
3.7! Graphs & Billing Statistics...................................................................... 17!
3.8! Resizing the Volumes ............................................................................ 18!
3.9! Changing the Traffic Settings ................................................................. 21!
3.10! Managing the Resources ...................................................................... 22!
3.11! Stopping the Application ...................................................................... 24!
3.12! Starting the Application ....................................................................... 25!
3.13! Deleting the Application ...................................................................... 27!
4! Using the Job Console ................................................................................ 28!
5! Managing your account............................................................................... 32!
6! Using the Lamp application ......................................................................... 34!
6.1! Ordering a the LAMP application ............................................................. 34!
6.2! Configuring the LAMP application ............................................................ 38!
6.2.1! SSH access .................................................................................... 38!
6.2.2! FTP access ..................................................................................... 38!
6.2.3! MySQL settings .............................................................................. 38!
6.2.3.1! Creating the database and the user ............................................. 39!
6.2.3.2! Configuring the database ........................................................... 39!
Page: 2 / 43
7! Using the Basic Centos 64bit Server ............................................................. 40!
7.1! Ordering the Basic Centos 64bit Server ................................................... 40!
7.2! Configuring the Basic Centos 64bit Server ............................................... 42!
Page: 3 / 43
1 Introduction
This document is the user guide for the Cloud Control Panel. Each of the sections
contains detailed instructions on how to perform various tasks within the application.
Page: 4 / 43
2 Login procedure
In order to login to your Control Panel, type the account details you have received for
the Cloud Control Panel.
Figure 1: Logging into the Control Panel
Enter your username and password and click “Login”. The Control Panel interface will
be displayed.
Page: 5 / 43
Figure 2: The CCP Interface
Page: 6 / 43
The following options and parameters are available inside the Control Panel:
•
Dashboard – see section 3
•
Job Console – see section 3
•
Account – see section 3
•
Order new Cloud Server – see section 3
•
Help – the section with helpful information about the Control Panel
•
Logout – the option for logging out of the control panel i.e. ending your
session
Page: 7 / 43
3 Using the Dashboard
The “Dashboard” is the default screen displayed after logging into the “Control Panel”
and contains the most of the information and options you will frequently use.
Figure 3: Using the dashboard
The dashboard is organized so that it displays all applications you have purchased. In
the screenshot above there are two applications (virtual servers with software
installed based on a chosen type of the application).
The following information and parameters are available for each of the applications:
•
- this icon tells you the application (i.e. server) is running (note that you will
have the option “Stop” on the right to stop the application)
•
- this icon tells you the application has been stopped (note that you will
have the option “Start” on the right to start the application)
•
- use this button to toggle between detailed and regular view
(see section 3.1
•
Edit Description – the option for editing the basic information about the
application (see section 3.5)
•
Settings – the option for managing the application settings (see section 3.6)
•
Delete – the option for deleting the application (see section 3.13)
•
Graphs & Billing – the option for viewing statistics about the use of various
application components (see section 3.7)
•
Resize Volumes – the option for changing the volume size (see section 3.8)
•
Change Traffic – the option for managing the purchased traffic allowance (see
section 3.9)
•
Change Resources – the option for managing the resources (see section
3.10)
Page: 8 / 43
•
Stop – the option for stopping the application (see section 3.11)
•
Start – the option for starting the application (see section 3.12)
3.1 Enabling the Detailed View
In order to enable the detailed view of your components, click ”Toggle Details” button.
Figure 4: Enabling the detailed view (step1/2)
The components details will be displayed.
Figure 5: Enabling the detailed view
The following options and parameters are available:
•
Components – the name of the component
Page: 9 / 43
•
State – information about the status of the component as well as the option
for stopping, restarting or starting the component (depending on the current
state) – see section 0
•
Mem – the amount of memory used by the component
•
CPU - the amount of CPU resources used by the component
To display fewer details, just click the “Toggle Details” once again.
3.2 Stopping the component
In order to stop the component, click this option
, the menu will be opened.
Figure 6: Stopping the component (step 1/3)
Click
for the desired component and the following dialog will be displayed.
Figure 7: Stopping the component (step 2/3)
Click “OK” and the “Job Console” page will be displayed.
Page: 10 / 43
Figure 8: Stopping the component (step 3/3)
You will be able to monitor the progress of stopping the component by looking at the
status column.
The status will change from NEW to IN-PROGRESS and then to OK which denotes that
the action of stopping the component was success.
Note: See section 4 for further information about the Job Console.
3.3 Starting the component
In order to start the component, click this option
, the menu will be opened.
Figure 9: Starting the component (step 1/3)
Click “Start” to start the component and the following page will be displayed.
Page: 11 / 43
Figure 10: Starting the component (step 2/3)
Click “OK” and the “Job Console” page will be displayed.
Figure 11: Starting the component (step 3/3)
You will be able to monitor starting of the component by looking at the status column.
The status will change from NEW to IN-PROGRESS and then to OK which denotes that
the action of starting the component was success.
Note: See section 4 for further information about the Job Console.
3.4 Restarting the component
In order to restart the component, click this option
opened.
Page: 12 / 43
, the menu will be
Figure 12: Restarting the component (step 1/3)
Click “Restart” to start the component and the following page will be displayed.
Figure 13: Restarting the component (step 2/3)
Click “OK” and the “Job Console” page will be displayed.
Figure 14: Restarting the component (step 3/3)
You will be able to monitor restarting of the component by looking at the status
column. The status will change from NEW to IN-PROGRESS and then to OK which
denotes that the action of restarting the component was success.
Note: See section 4 for further information about the Job Console.
Page: 13 / 43
3.5 Editing the Description
The “Edit Description” option is used for changing basic application information. In
order to edit this information, click “Edit Description”.
Figure 15: Changing basic application information (step 1/2)
The following page will be displayed.
Figure 16: Changing basic application information (step 1/2)
The following parameters can b changed:
•
Name – change the name of the application
•
Description – change the application description
After changing the parameters, click "Update” to save the changes.
Page: 14 / 43
3.6 Managing the Settings
In order to start managing the important application parameters, click “Settings” in
the dashboard.
Figure 17: Managing the application parameters (step 1/2)
The following page will be displayed.
•
Important note: the contents of the actual page will depend on the
application you have chosen
Figure 18: Managing the application parameters (2/2)
The following options and parameters are available:
Page: 15 / 43
•
Primary DNS – enter our primary DNS
•
Secondary DNS – enter your secondary DNS
•
In IP – this is an incoming IP address, i.e. the address used for the application
incoming traffic
•
Out IP – this is the outgoing IP address, i.e. for the outgoing traffic
•
Mail Hostname – enter your mail hostname inside this field
•
Root Password – set the root password which is used for accessing certain
components via SSH
•
Webmaster Password – set the webmaster password which is used for FTP
access
Set the desired values for these options and click “Save Changes” to save the
changes.
Page: 16 / 43
3.7 Graphs & Billing Statistics
In order to view statistics about the use of different components in a desired time
interval click “Graphs & Billing” in the “Dashboard”.
Figure 19: Viewing the statistics (step 1/2)
The following page will be displayed.
Figure 20: Viewing the statistics (step 2/2)
The following options and parameters are available:
•
Date from/to – use these options to specify the time interval for the statistics
Page: 17 / 43
After specifying the time interval, click “Refresh” and the results will be displayed
below. The information is available:
•
CPU – the table displaying information on CPU use within the specified time
interval
•
RAM - the table displaying information on RAM use within the specified time
interval
•
VOLSIZE - the table displaying information on HDD use within the specified
time interval
3.8 Resizing the Volumes
The “Resize Volumes” option is used for changing the disk partition size. In order to
resize a volume, click “Resize Volumes” within the Dashboard.
Figure 21: Resizing the volumes (step 1/2)
The following page will be displayed.
Page: 18 / 43
Figure 22: Resizing the volumes (step 2/2)
The following options and parameters are available:
•
Volume – the information on the HDD
•
Component – information about the component installed on the HDD
•
Size – the column displaying information about the current volume size
•
New size - the input field for setting the new volume size; the values are
entered as number + a letter denoting the size which is either M for megabytes
or G for gigabytes (e.g. if you want to set a new size to 300 megabytes you
would enter “300M” into this field
•
Resize – once you enter the new volume size, click this button to make the
change
•
Filesystem – the column displaying information about the type of filesystem
Note:
•
You can only resize volumes which are not in use by a running component
•
If the volume you wish to resize does not have that option, you have to stop
the component it is assigned to first
•
Resizing volumes is a long operation.
After you enter the new size and click “Resize”, the “Job Console” will be displayed
where you will be able to monitor the progress of the initiated resize process.
Page: 19 / 43
Figure 23: Monitoring the resizing of the volumes
The status of the job will go from “New” to “In-Progress” to “OK”. Once the “Status”
column reads [email protected]; “OK” the job will be completed i.e. the
partition will be resized.
Note:
•
the status of the job is refreshed automatically. In other words you do not need
to refresh the page in order to see the changes
•
further information about the Job Console can be found in section 4
Page: 20 / 43
3.9 Changing the Traffic Settings
In order to change the traffic for your application, choose the “Dashboard” option from
the main menu and then click “Change Traffic”.
Figure 24: Changing the Traffic Settings (step 1/2)
The following page will be displayed.
Figure 25: Changing the Traffic Settings (step 2/2)
Enter the desired value for the monthly bandwidth allowance in the following form:
•
number + G (in case you want to set the value in gigabytes, e.g. 512G
•
number + M (in case you want to set the value in megabytes, e.g. 512M
Page: 21 / 43
After changing the monthly bandwidth, click “Save Changes” to complete the
procedure. The following confirmation page will be displayed.
Figure 26: Monthly bandwidth successfully changed
3.10 Managing the Resources
In order to change the resources for your application, choose the “Dashboard” option
from the main menu and then click “Change Resources”.
Figure 27: Managing the resources (step 1/2)
The following page will be displayed.
Page: 22 / 43
Figure 28: Managing the resources (step 2/
The following options and parameters are available:
•
Component Name – click on the component you wish to change the resources
for
•
Resources – this part of the screen contains the CPU and RAM sliders for
modifying the resources; the sliders are interconnected so that when you move
one the other is moved accordingly
•
Save & Restart Component – use this button to save the changes made to
the resources and restart the component
•
Save & Restart App – after setting the desired values for a component or
several components, click this button to save the changes and restart the
application
•
Cancel – click this button to cancel all changes and return to previous screen
Page: 23 / 43
3.11 Stopping the Application
In order to stop the application, which is required prior being able to make the
changes, click the “Stop” button.
Figure 29: Stopping the application (step 1/2)
The following dialog will be displayed.
Figure 30: Stopping the application (step 2/2)
Click “OK” to confirm that you wish to stop this application. The stopping” label will be
displayed.
Figure 31: Stopping the application (step 1/2)
Page: 24 / 43
Once the application has been stopped, you will see the stopped label.
Figure 32: Stopping the application (step 2/2)
Note: this process can be monitored from the Job Console (see section 4).
3.12 Starting the Application
Figure 33: Starting the Application (step 1/2)
The following dialog will be displayed.
Page: 25 / 43
Figure 34: Starting the Application (step 2/2)
Click “OK” to confirm starting of the application and the “starting” label will be
displayed above the “Toggle details” button denoting that the process has started.
Figure 35: Starting the Application (step 1/2)
After a couple of moments the “running” label will be displayed denoting that the
application has been successfully started.
Figure 36: Starting the Application (step 2/2)
Page: 26 / 43
3.13 Deleting the Application
In order to delete an application, click “Delete” within the desired application inside
the Dashboard.
Figure 37: Deleting the application (step 1/2)
The following dialog will be displayed.
Figure 38: Deleting the application (step 2/2)
Click “OK” to confirm the deletion and the application will be deleted.
Important note: The deleted applications will not be destroyed on the grid
immediately, but after some period of time. Returning the application to this control
panel after it was deleted requires help of support engineers and you should use this
option carefully.
Page: 27 / 43
4 Using the Job Console
The “Job Console” is the place where you can monitor the progress of all jobs you
have started i.e. commands you have issued.
Since some of the operations require certain amount of time in order to be completed
i.e. are not executed instantaneously, you can use the Job Console to overview their
status.
In order to start using the “Job Console”, click “Job Console” in the main navigation.
Figure 39: Managing the jobs
The following page will be displayed.
Page: 28 / 43
Figure 40: Managing the jobs
The following options and parameters are available:
•
Filtering results – use these pull down menus to filter the jobs based on the following criteria
o
From/To – define the desired time interval for displaying the jobs
o
Status – filter jobs based on their status:
o
•
!
IN-PROGRESS – displayed while the job is in progress
!
USER_CANCEL – displayed in case the job was cancelled by user request
!
RESUME – displayed in case the system administrator restarted the failed job
!
OK – displayed if the job was successfully completed
!
FAILED - – displayed if there was a problem with the job and it could not been completed
Get Jobs – click this to begin filtering the jobs after setting the desired criteria
Job List – this part of the page will list all available jobs (or jobs based on the criteria)
o
Page: 29 / 43
Executed on – the component the job is related to
o
Page: 30 / 43
Status – the status of the job
o
Submitted At – the time and date the job has been submitted
o
Started At – the time and date the job has been submitted
o
Finished At – the time and date the job has been submitted
o
Job Name – the field displaying the job description
Page: 31 / 43
5 Managing your account
In order to start managing your account information, click “Account” in the main
navigation.
Figure 41: Managing your account (step 1/2)
The following page will be displayed.
Figure 42: Managing your account (step 2/2)
The following parameters are available:
•
Support ID – this is your unique ID for reporting issues to our support
department
•
First Name
•
Last name
•
Email
•
Phone
•
Mobile
•
Has billing auth – displays the information on whether the user is allowed to
make a purchase or not
•
Current Password – enter your current password to confirm your identity
•
New Password – enter the new password
After setting the new password, click “Save Changes”.
33
6 Using the Lamp application
6.1 Ordering a the LAMP application
In order to order the LAMP application, first click the “Order New Cloud Server” in
the main navigation.
Figure 43: Ordering a new cloud server (step 1/3)
The following page will be displayed.
34
Figure 44: Ordering a new cloud server (step 2/3)
Choose the “LAMP cloud server” option and then click “Next”. The following page will
be displayed.
35
Figure 45: Ordering a new cloud server (step 3/3)
The following options and parameters are available:
•
Application: LAMP cloud server – general application settings
o
Cloud Server Name (End-User) – enter the desired name for this
application (note: this can help you differentiate it from other
applications of the same type)
36
o
•
Cloud Server Description – enter your short description for the
application
Volumes – set the size for the following volumes by entering the number of
MB or GB (note: the value is entered as a number followed by a letter M for
megabytes or G for gigabytes without the space, e.g. 100M in case you wish
to allocate 100 megabytes)
o
MySQL Database /dev/hda1 boot * - mysql component boot
volume ( / )
o
MySQL Database /dev/hda2 usr * - mysql component /usr volume
( /usr)
o
MySQL Database /dev/hda3 mysql * - mysql component data
volume (/mnt/data) – this is where the actual mysql data files reside
o
Web Server /dev/hda1 boot * - main.srv component boot volume
(/)
o
Web Server /dev/hda2 usr * - main.srv component usr volume
(/usr)
o
WebContent fs * - web content on NAS appliance -> here is actual
apache docroot
!
•
Note: Only recommended values should be specified.
Web Content, Web Server and MySQL Database – use the slider to
allocate the desired values for CPU and RAM memory; the sliders are
interconnected so only allowed (and therefore recommended) values can be
set
After setting the desired parameters, click "Save” and the “Thank you” page will be
displayed.
Figure 46: Ordering a new cloud server (step 3/3)
Note: On this page when an existing customer orders a new app there will be no PP
integration. The customer is charged for new applications on the next billing date.
New application orders are processed by the administrator who will have to approve
and process them.
37
6.2 Configuring the LAMP application
6.2.1 SSH access
The following are the parameters for SSH access by:
•
•
component webserver
o
port: 4101
o
ip: In ip
o
username: root
o
password: rootpassword
component mysql
o
port: 4201
o
ip: In ip
o
username: root
o
password: rootpassword
6.2.2 FTP access
The following are the parameters for the FTP connection used for transferring the
web files.
•
port: 21 (default)
•
ip: in ip
•
username: webmaster
•
password: webmaster_password
•
default apache docroot directory: default_site
Note: passive mode should be used.
6.2.3 MySQL settings
You can login to MySQL via MySQL console either from webserver or mysql, by:
1. logging via SSH to the main.srv via port 4101
2. logging to MySQL server with the following parameters:
•
dbname: db
•
username: root
•
password: webmaster_password
For example, once you are logged into the main.srv, you should issue the following
command:
main.srv# mysql -h db -u root -p
And then put the webmaster_password.
38
Alternatively, you can login to MySQL server from the main.dbase without using the
root password by issuing the following command:
main.dbase# mysql -h db
6.2.3.1 Creating the database and the user
Once logged in, you can create a new MySQL database and grant a database user:
•
create database wordpress;
•
grant
all
on
wordpress.*
'mysqluser_password';
to
'mysqluser'@'%'
identified
by
6.2.3.2 Configuring the database
After creating the user, you will need to configure your database by entering the
following values:
•
host: db
•
user: mysqluser
•
password: mysqluser_password
Important note: all of these values (names, disks, etc) are subject to change in
case the application design changes.
39
7 Using the Basic Centos 64bit Server
7.1 Ordering the Basic Centos 64bit Server
In order to order the Centos 64bit Server, first click the “Order New Cloud Server” in
the main navigation.
Figure 47: Ordering a Basic Centos 64bit Server (step 1/3)
The following page will be displayed.
Figure 48: Ordering a Basic Centos 64bit Server (step 2/3)
40
Choose the “Basic Centos 64bit Server” option and click “Next”. The following page
will be displayed.
Figure 49: Ordering a Basic Centos 32/64bit VGS application (step 3/3)
The following options and parameters are available:
•
•
General information – general application settings
o
Cloud server Name (End-User) – enter the desired name for this
application (note: this can help you differentiate it from other
applications of the same type)
o
Cloud Server Description – enter your short description for the
application
Volumes – set the size for the following volumes by entering the number of
MB or GB (note: the value is entered as a number followed by a letter M for
megabytes or G for gigabytes without the space, e.g. 100M in case you wish
to allocate 100 megabytes)
o
Server /dev/hda1 boot * - main.srv component boot volume
41
•
Server – use the slider to allocate the desired values for CPU and RAM
memory; the sliders are interconnected so only allowed (and therefore
recommended) values can be set
After setting the desired parameters, click "Save” and the following page will be
displayed.
Figure 50: Ordering a Basic Centos 64bit cloud Server
7.2 Configuring the Basic Centos 64bit Server
In order to start configuring the Basic Centos 64 Server, click “Dashboard” and then
click “Settings” within the application options.
42
Figure 51: Configuring the Basic Centos 64bit Server (1/2)
The following page will be displayed.
Figure 52: Configuring the Basic Centos 64bit Server (22)
The most important parameter of the application settings is the primary_ip. You
can login to this IP via SSH as a root and install all required services and applications
(ftp, httpd, mysql, server, etc.).
The only thing you cannot do is modify the Linux kernel.
Note: it is recommended that you immediately put up the iptables firewall, because
root sshd is allowed from out.
43