1
2.5 View Area
9
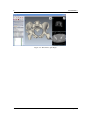
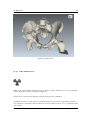
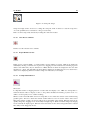
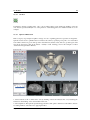
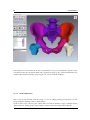
Intensity Projection view displays a projection of dataset voxels inside ROI onto a view plane. For each
pixel in display image ray is traced in view direction from the eye. Based on selected transfer function the
value for output pixel is calculated from voxels intersected by each ray as:
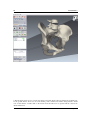
MIP Maximum Intensity Projection shows the maximum voxel intensity on ray path.
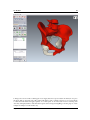
MinIP Minimum Intensity Projection shows the minimum voxel intensity on ray path.
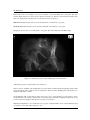
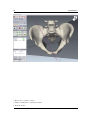
Integrate shows the sum of voxel intensities on ray path. The result obtained is 2D XRay image.
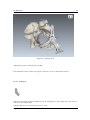
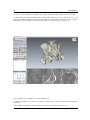
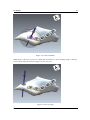
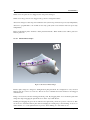
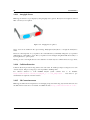
Figure 2.7: Intensity Projection View with Integrate transfer function
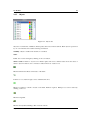
Additional properties for Intensity Projection View are:
Clip low level is available only with Integrate projection function. When checked integrating function will
ignore all sample values which are below specified low threshold value. Enabling this will display bone
fragments with better contrast.
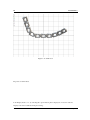
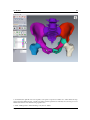
Overly Implants will overlay fixation plates and screws on top of the Intensity projection image. Since
the Intensity Projection always displays state as determined by examination, implants might be in wrong
location if the bone fragments have been moved after reconstruction.
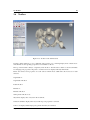
With Display Implants in color checked the color property of implant will be used to render implant instead
of value based on lookup table assigned to view.
Ekliptik EBS