1
Overcoming Non-determinism
in Testing Smart Devices: A Case Study
Peter Bishop1,2 and Lukasz Cyra2
1
Centre for Software Reliability, City University, London
Northampton Square, London, EC1V 0HB, United Kingdom
2
Adelard LLP
Northampton Square, London, EC1V 0HB, United Kingdom
{pgb,lc}@adelard.com
Abstract. This paper presents a case study in “black-box” assessment of a
“smart” device where, based only on the user manuals and the instrument itself,
we try to build confidence in smart device reliability. To perform the black-box
assessment, we developed a test environment which automates the generation of
test data, their execution and interpretation of the results. The assessment was
made more complex by the inherent non-determinism of the device. For example, non-determinism can arise due to inaccuracy in an analogue measurement
made by the device when two alternative actions are possible depending on the
measured value. This non-determinism makes it difficult to predict the output
values that are expected from a test sequence of analogue input values. The
paper presents two approaches to dealing with this difficulty: (1) based on
avoidance of test values that could have multiple responses, (2) based on consideration of all possible interpretations of input data. To support the second
approach we use advanced modelling and simulation techniques to predict all
the likely interpretations and check whether any of them is observed at the
smart device output.
Keywords: testing, non-determinism, smart instruments, safety.
1 Introduction
The justification of smart instruments has become an important topic in the nuclear
industry [1]. These instruments have operational and safety benefits as they are more
accurate and require less calibration, but since they are programmable devices, there
is a potential for software defects within the device, which could result in unpredictable behaviour.
Ideally some independent assessment of the development information and firmware should be performed to gain assurance that the behaviour is predictable. In practice, however, it may not be possible and independent “black-box” testing [2] may be
necessary to gain confidence in the device. “Black-box” testing is based solely on
publicly available artefacts—typically the user manuals (for operation and
maintenance) and the instrument itself.
E. Schoitsch (Ed.): SAFECOMP 2010, LNCS 6351, pp. 237–250, 2010.
© Springer-Verlag Berlin Heidelberg 2010
238
P. Bishop and L. Cyra
In this paper we describe the test environment we have developed to automate the
process of test data generation, test execution and result checking. This was used to
perform a range of automated black-box tests on a commercially available smart device. We found that a key difficulty in automating these tests was the
non-deterministic response of the smart device to certain input values. We describe
the strategies we have used to overcome this problem.
2 Non-determinism in Smart Devices
Smart instruments are physical devices to which we feed the input and read the corresponding output. For the purpose of this section we are assuming that a smart device:
• has an analogue input to measure some plant parameter
• has a configurable alarm, which is set on when the input value exceeds a certain
limit
• has a configurable deadband, to avoid “jitter” the alarm is only turned off when the
input value drops below the deadband
No matter what test environment we use to analyse such an instrument,
non-determinism is unavoidable. It arises from a number of different sources that are
inherent to smart devices. In particular:
• smart device accuracy
• smart device sample rates
• smart device response lags
In addition, the test harness can be a further source of uncertainty when checking the
correctness of the results.
2.1 Smart Device Accuracy
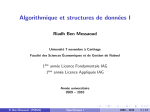
Inaccuracy in the measured input value leads to a non-deterministic output result
when the input value is close to some configured alarm limit as shown in Fig. 1.
Alarm state
On
Either
alarm
state
possible
Off
Time
Measured input
Alarm Limit
Deadband
Non-deterministic
value
Time
Fig. 1. Non-determinism due to smart device inaccuracy
Overcoming Non-determinism in Testing Smart Devices: a Case Study
239
The smart device measurement inaccuracy is represented by the thick grey line. If
the internally measured value could lie on either side of the alarm limit (due to smart
device measurement inaccuracy) then two alternative alarm states are possible. The
test results only become deterministic when the measured value ensures that only a
single alarm state is possible (e.g. when the measured value drops well below the
deadband).
2.2 Discrete Sampling Intervals
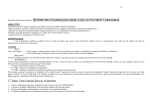
A similar non-determinism problem arises if smart device measurements are only
performed at discrete time points (see Fig. 2).
Alarm state
On
Either
alarm
state
possible
Off
Time
Measured input
Alarm Limit
Deadband
Smart device input
sample interval
Time
Fig. 2. Non-determinism due to discrete smart device sample intervals
It can be seen that the device will not “see” a short excursion above the alarm limit
if the measurement samples straddle the excursion (solid lines) but the device would
see the excursion if a sample coincided with the excursion (dashed lines). As we have
no way of knowing when the samples occur within the smart device, we cannot
determine which alarm state is expected even if the test equipment and smart device
were absolutely accurate.
2.3 Smart Device Lags
Even if the alarm activation decision is deterministic, there is still uncertainty about
when the expected response will appear at the smart device output. This is illustrated
in Fig. 3 below.
240
P. Bishop and L. Cyra
Alarm state
On
Output
response
lag(s)
Either
alarm
state
possible
Off
Time
Measured input
Alarm Limit
Deadband
Smart device input
sample interval
Time
Fig. 3. Non-determinism due to uncertain response times
This arises from:
•
•
•
•
uncertainty about when the smart device samples the input
lags introduced by internal filtering algorithms
uncertainty about the computation time taken to decide the alarm state
variation in the time needed to physically switch an alarm relay to another state.
2.4 Non-determinism in the Test Harness
The test harness is also a source of non-determinism due to:
• Finite accuracy. This increases the uncertainty in the measured value as seen by the
smart device.
• Lags in the test relays. Special test relays controlled by the PC can simulate events
like broken wires or power interruption. It can take a finite time to activate and deactivate a test relay, and this can extend the apparent time taken by the device in
responding to the event.
3 Testing Non-deterministic Systems
To test smart instruments we have to address all the types of non-determinism
described above. We can do it in the following way:
• smart device accuracy – by taking one of the approaches: (1) avoidance of inputs
which are “close” to an alarm limit (i.e. beyond the inaccuracies introduced by the
smart device and the test harness) or (2) detailed analysis of all the possible
interpretations of the inputs by the device to assess which outputs may be correct
Overcoming Non-determinism in Testing Smart Devices: a Case Study
241
• smart device sample rates – by holding the test value steady for a fixed “settling
time” before reading the result
• smart device response lags – by holding the test value steady for a fixed “settling
time” before reading the result
• test harness – by allowing for the operation of test relays in the “settling time”
(lags in the test relays) and taking the steps mentioned in bullet 1 (finite accuracy)
Avoidance of inputs which are “close” to an alarm limit should, in theory, ensure that
the smart device will respond in a deterministic way where each input measurement is
interpreted as being definitely above or below the decision point. So we should be
able to predict the alarm output values for each.
However this restricts the scope for realistic testing and may make the detection of
some bugs impossible, e.g. a device may enter erroneous state after receiving a value
which is interpreted as equal to the decision point. If we wish to simulate typical plant
operation we should allow any realistic sequence of input values, including
• continuously changing values
• inputs close to the alarm limit
If this is allowed, then analysis of the smart device outputs becomes much more
difficult. The test result checker has to:
• identify when input values can result in different responses (given the uncertainties
in accuracy and timing in the smart device)
• maintain different execution threads for the different input interpretations
• accept a set of output results that agree with any current thread.
This mechanism is illustrated in Fig. 4. If the actual result does not correspond with a
given thread, the thread is discarded. If all the threads are removed this way, the result
checker indicates a potential error.
Alarm state
One or more threads to represent
possible device states
On
Off
Time
Device input
value
Alarm Limit
Deadband
Non-deterministic input values
Time
Fig. 4. Handling non-deterministic test results
242
P. Bishop and L. Cyra
The figure shows a simplified version of the problem. Smart sensors often set an
alarm after a configurable delay (i.e. the input must stay above the limit for at least
certain time). If we remain “close” to a decision point for some time, assuming that a
delay is set, the number of threads may be thousands or millions rather than the two
shown in Fig. 4. The complexity of the analysis depends on the frequency with which
the device can change interpretation of a constant input being “close” to a decision
point. We can influence the complexity of the analysis by changing this assumption
and as a result obtaining more or less false positives (Section 6 gives an example).
4 Black-Box Testing Case Study
The smart device chosen for this study is a smart sensor alarm unit that can measure a
plant parameter and raise an alarm if a programmable limit is violated. The smart
sensor used in this study can monitor a wide range of plant measurements (via thermocouple, resistance, or 4-20mA input signals). The device controls four relay outputs to annunciate different alarm states.
The smart device can be configured to:
•
•
•
•
•
use different plant input sensors
trigger an alarm on high or low measured values
avoid alarm “jitter” by specifying latching, alarm delays and deadbands
detect rapid rates of change
raise an alarm if internal errors are detected
The device also has LED status indicators which reflect the current state of each
alarm relay. There is a push-button input that can be used to manually reset alarms
that are configured to latch to the “on” state. The device can be configured via front
panel pushbuttons and a display screen. It can also be programmed via configuration
software running on a PC connected to the device by a serial interface.
5 Test Harness
We implemented a test harness to support functional test definition, execution and
analysis of the results. The harness is composed of three parts (as shown in Fig. 5).
Offline
test data
generator(s)
Test data
file
On-line test
execution
Test
result file
Fig. 5. Test harness elements
Test result
checker
Discrepancy
reports
Overcoming Non-determinism in Testing Smart Devices: a Case Study
243
The harness comprises:
• An off-line test data generator. This produces test cases according to some strategy.
The results are stored in a test data file.
• An on-line test execution system, which reads the test data file, applies the test to
the smart device and records the result.
• An off-line result checker, which takes the test data file, computes the expected
results and compares this against the result generated by the smart device.
We chose to use off-line test generation and checking because this gives us additional
flexibility. If there are errors in the checker, the test result file is still valid, so we only
need to fix the checker.
5.1 Test Data Generator
We developed an application for test data generation. The application generates tests
using two different strategies:
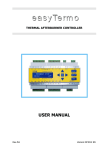
• Statistical tests. This is an approximation of plant transients where the input increases to some limit with random fluctuations. An example of a transient is depicted in Fig. 6.
Fig. 6. Simulated transient test sequence
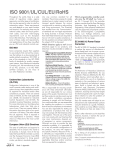
• Random tests. These are designed to maximise changes in the alarm outputs. An
example is depicted in Fig. 7.
Fig. 7. Random test sequence
244
P. Bishop and L. Cyra
5.2 On-Line Test Execution System
The on-line test execution system comprised:
• a PC with analogue and digital interfaces connected to the smart device
• a LabVIEW program to read the data file with test cases to the smart device and
record the results
Test value
feedback
Test relay control lines
Test value
from analogue
output
PC
Relay
Relay
Test
value
manual
reset
Smart
Alarm
device
Analogue
output
Alarm
relays
Alarm states
Measured value (smart device)
Fig. 8. Test harness schematic
The test environment (shown in Fig. 8) includes control of test relays to simulate
broken wire conditions, and the operation of a manual reset button. We were also
reading the output of the smart sensor to compare it with the test input and understand
if differences observed can influence interpretation of the results. We tried to read
back the test signal generated by the analogue interface by feeding it back to an analogue input so that it could be read by the PC. This however, affected the accuracy of
the other analogue interfaces. Therefore, after doing some experiments we decided to
remove this connection.
The test execution system is composed of:
• a personal computer, which runs a LabVIEW application controlling test execution
and another application for configuring the smart sensor
• a card with relays extending the PC interface (InLog PCX-4288)
• a data acquisition device extending the PC interface (National Instruments
USB-6008/6009)
• a smart sensor undergoing tests
• an analogue lab board providing voltage source for testing the state of the smart
sensor
In this configuration, the test signal error was about ±10mV (around 0.2% of the full
scale value).
Overcoming Non-determinism in Testing Smart Devices: a Case Study
245
The hardware was controlled by two Microsoft Windows application written in
LabVIEW [3]. We developed:
• a manually operated test-bench application
• an automated test execution application
The test-bench application was used to check out the hardware of our test execution system. It has a knob to adjust the input, diagrams, indicator lamps presenting the
state of the alarms, and switches to simulate “broken wire” and pressing the reset
button of the smart sensor. It also has four charts which display a diagram with the
output from the alarms.
Fig. 9. Test-bench application (GUI)
The test execution application performs a set of pre-defined tests stored in a file
created by the application for test data generation. The application has the following
functionality:
• It reads input from a data file (i.e. the voltage for the analogue input of the smart
sensor, the state of the reset button and the state of the “broken wire” relay).
• It provides input in a loop to the device acquisition card and sets the state of relays.
• It reads output (i.e. the state of the analogue output and the state of the alarms) in a
loop and writes it together with the corresponding input to a file.
The model of the application is given in Fig. 10.
Execution of one test takes 2s or 6s depending on whether a reset is part of the test.
We found that we needed 2s for simulating the input because with shorter delays
(e.g. 1s) behaviour of the smart sensor was unpredictable, i.e. many errors were recorded which could not be reproduced with the delay of 2s. We needed an additional
4s for simulating the reset button because the relay card we used is slow and with
246
P. Bishop and L. Cyra
yes
Set test value
Wait 2 secs
Reset on
Wait 2 secs
Reset off
Wait 2 secs
Reset?
no
Read results
Fig. 10. Test execution application model
shorter delays it would be hard to be sure that the reset operation was simulated properly. A timing accuracy of 2s is acceptable for the device we have been analysing, but
we plan to perform a more accurate response time analysis in subsequent research.
Apart from these two applications, we used another one developed by the manufacturer of the smart sensor in order to configure the smart device via a PC and read the
state of the process variable of the device.
5.3 Test Analysis
We implemented an off-line test results checker (an oracle) as an application. The
result checking process is identical no matter which test data generation procedure is
used. It takes the test result file comprising a sequence of smart sensor inputs and
outputs and then checks if they agree with the internal model of the device built into
the application. The model is a finite state machine defined based on the behaviour
specified in the user manual. As the documentation is not precise, the model must try
to take the weakest assumptions possible, i.e. permit all behaviours which do not
conflict with the manufacturer’s documentation. If the outputs of the oracle and the
actual result disagree, the checker generates a list of potential errors.
The result checker is highly configurable. It specifies the configuration of each
alarm relay (e.g. type, limit, deadband, latch mode, and relay delay). Its interface is
shown in Fig. 11.
Given the input data, smart device configuration and delay data, the oracle can
compute the result and compare it with the actual result. This is not as straightforward
as it may first appear, as discrepancies can be generated if the expected result is not
unique. Section 2 discusses the possible sources of non-deterministic results. The
result checker has to identify all the possible interpretations of the inputs, and based
on this data calculate all the possible states of the modelled device. If any of the
threads has output values that match the test result, the result is accepted. If none of
the states resulting from the inputs corresponds to the test result, a discrepancy is
identified.
Our non-deterministic model initially assumed that the test value measured by the
smart device is unchanged between test input changes. However, by monitoring the
smart device display, we established that the measured value does in fact differ on
successive internal measurements made by the device. This inherent variability due to
Overcoming Non-determinism in Testing Smart Devices: a Case Study
247
Fig. 11. Result checker interface
periodic internal sampling had to be included in the non-deterministic result checking
model by computing new threads at each potential sample point (using a configurable
sample rate).
6 Testing and Test Results
We applied three test strategies to derive test cases for the device:
• Statistical testing. We generated and executed 4600 simulated plant transient test
sequences. For realistic plant transients, this should give 99% confidence in 10-3
failures per demand if no discrepancies are detected by the result checker.
Execution of one set of transients takes 8 days of continuous execution by the testing harness.
• Random testing. We generated and executed 10 000 random tests. Execution of the
tests took 6 hours.
• Negative testing. We tested the device with:
− out of range inputs (20% above and below the accepted range)
− valid, equivalent inputs and checking for variation in the output
− testing functional independence (i.e. where changes in the device configuration
influence unrelated functionality)
− random testing (this time addressing independence and consistency of the behaviour of alarms)
− testing based on transients (this time addressing independence and consistency
of the behaviour of alarms)
Execution of the tests led to identification of a few potential discrepancies. Statistics
about the detection rates for each of the strategies are presented in Table 1.
248
P. Bishop and L. Cyra
Table 1. Discrepancy detection rates
Number of discrepancies for a sampling rate
Test strategy
non
1/sec
2/sec
30/sec
Statistical testing
25
13
10
10
Random testing
0
0
0
0
Negative testing
1
1
1
1
The table shows the number of discrepancies detected for each of the strategies in
the function of the assumed device sampling rate. We can see that the number of
discrepancies detected falls when we assume that the device may change interpretation of a constant input. The number of discrepancies becomes constant once the
sampling rate is increased to 2/sec, which may correspond to the actual sampling rate
of the device.
For each of the discrepancies detected we were able to identify the corresponding
inputs and outputs and present them in the context of adjacent inputs and outputs
using our analysis tool. An example is shown in Fig. 12.
Fig. 12. Discrepancy analysis
Analysis of the identified discrepancies revealed that all of the discrepancies occurred
at values close to the configured alarm limits. These discrepancies can be explained if
we change some the assumptions made about the behaviour of the device. Some of
the potential explanations are given below:
• We had assumed that all alarms use the same interpretation of the process variable.
The data captured seems to suggest however that each of the alarms may interpret
the input independently, e.g. an input value close to the limit may be interpreted by
one of the alarms as being above and by another as being below the limit.
• Our test automation system assumes 2 seconds is sufficient time to wait for a stable
response, however, for a small fraction of inputs, it seems this delay is insufficient.
• We might have assumed too small a range around a decision point where the
interpretation of inputs is considered to be non-deterministic.
Overcoming Non-determinism in Testing Smart Devices: a Case Study
249
7 Discussion
From our case study it is clear that black-box testing is a non-trivial task. The number
of discrepancies detected is very dependent on the accuracy of the model checker and
its coverage of all sources of non-determinism in the expected result. We have independent evidence for believing that the smart device does in fact implement its alarm
logic correctly, so the residual discrepancies are likely to be due to other sources of
non-determinism that have not been included in the model checker.
Clearly we can continue to refine the model checker of smart device behaviour to
reduce the discrepancies even further, but we need to consider whether this is a realistic approach. Effectively, we are inventing a smart device design that can explain the
observed discrepancies, but in a black-box context, we can never be sure the inferred
design is actually valid.
What we really need is a result checker that does not need to know about internal
details (such as the sampling rate of the device) but is based solely on the published
behaviour. One possible avenue that we intend to explore is the idea of defining a set
of “invariant behaviours” derived from the public documentation, e.g.:
Test_input >> alarm_lim Æ Alarm=ON
Test_input << alarm_lim_deadband Æ Alarm=OFF
Note that the >> operator is used to denote “definitely greater given the published
inaccuracy, and the condition has remained true for the smart device’s published
maximum response time”.
If we do this, we have to accept that there are points in the test sequence where
none of the invariants will apply and the model-checker simply has to ignore the results generated—discrepancies can only be checked when the invariant condition is
active. There could also be difficulties with this approach because it assumes test
points where the answer is unique, i.e. the possible states of the smart device converge
to a single state. This may not always be true. For example:
• An alarm is configured to latch permanently if the limit is exceeded
• The test sequence rises up to the limit then falls
In this case there are two possible responses so the smart device states will diverge for
any subsequent test values that stay below the alarm limit. A more complex
expression of expected behaviour over time would be needed like invariants
expressed in some form of timed temporal logic [4]. We hope to investigate the
feasibility of this approach in further research.
8 Conclusions
The paper presents a case study in which a test harness for a smart device was
developed and used to execute a set of black-box test cases defined using several test
strategies.
We showed that non-determinism of the smart device response makes the testing
significantly more difficult. We have sought to address this problem by designing the
result checker to explicitly allow for non-determinism. When a potentially
non-deterministic test condition is detected, the result checker creates different
250
P. Bishop and L. Cyra
“threads” representing alternative potential states of the device. Normally the threads
recombine at a later point in time, when the input leaves the area “close” to limits
because the threads will converge to an identical internal state. For example, after a
certain amount of time above a trip limit, all threads will be in the alarm state.
This strategy has proved to be quite successful, but there are still some residual
discrepancies that we suspect are false positives. These could probably be removed by
increasing the complexity of the non-deterministic model of the device, but it is difficult to justify the model given that the device is a black-box.
In the next stage of research we plan to investigate less strict forms of model
checking where we ignore all test cases where there is any uncertainty about the
expected results.
Acknowledgments. The authors wish to acknowledge the support of UK C&I
Nuclear Industry Forum (CINIF) who funded the research presented in this paper.
References
1. Bishop, P., Bloomfield, R., Guerra, S., Tourlas, K.: Justification of Smart Sensors for Nuclear Applications. In: Winther, R., Gran, B.A., Dahll, G. (eds.) SAFECOMP 2005. LNCS,
vol. 3688, pp. 194–207. Springer, Heidelberg (2005)
2. Alur, R., Henzinger, T.A.: A Really Temporal Logic. Journal of the ACM (JACM) 41(1),
181–203 (1994)
3. National Instruments, LabVIEW, http://www.ni.com/labview (visited on
24/02/2010)
4. Krichen, M., Tripakis, S.: Black-Box Conformance Testing for Real-Time Systems. In:
Graf, S., Mounier, L. (eds.) SPIN 2004. LNCS, vol. 2989, pp. 109–126. Springer, Heidelberg (2004)