1
APPENDIX F
REVIEW OF CONDITION ASSESSMENT
TOOLS AND TECHNIQUES
Introduction
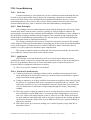
This Appendix presents summary reviews of 85 condition assessment tools and
techniques identified during the research.
As noted in Chapter 1 - Introduction of the report, a first pass assessment of the tools
and techniques used for condition and performance assessment in various sectors was made in
Phase 1 of the project. This was achieved through a review of literature and other information
sources relating to asset management and condition assessment tools and techniques. Draft
summaries of relevant tools were written and incorporated into the preliminary report.
The summaries were then sent out to a range of industry professionals for peer review
during Phase 2 of the project. A data collection spreadsheet that detailed all of the tools and
techniques identified in the project was also sent to each reviewer. The reviewers were asked to
use the spreadsheet to confirm the applicability of tools included on the list and to add any
additional tools that were used by or known to them.
The scope of this peer review exercise was entirely dependent on the goodwill of the
reviewers. Given this fact, the response was considerable, and the project team would like to
acknowledge the kind assistance of the following individuals:
Aidan O'Donoghue
Alan Watts
Alan Whittle
Ashok Sharma
Axel Konig
Balvantrai Rajani
Barry Allred
Bill Nadeau
Brian Mergelas
Dan Skorcz
David Alleyne
David Ellis
Doug Crice
Duncan Massie
Farshad Ibrahimi
Gerald Gangl
Gordon Burr
Greg Johnston
Greg Moore
Jayantha Kodikara
Jim Cull
John De Grazia
Kevin Laven
Leif Wolf
Marcus Hitzel
-
Pipeline Research Limited
South East Water Limited
Iplex Pipelines
CSIRO
SINTEF
National Research Council Canada
Ohio State University
Corvib
the Pressure Pipe Inspection Company
Pacific Tek Inc.
Guided Ultrasonics Ltd
South Australian Water Corporation
Wireless Seismic Inc.
Monash University
City West Water
Graz University of Technology
South East Water limited
Sensors & Software Inc.
South Australian Water Corporation
Monash University
Monash University
Melbourne Water
the Pressure Pipe Inspection Company
Universität Karlsruhe
Inspector Systems
Condition Assessment Strategies and Protocols for Water and Wastewater Utility Assets
F-1
Mark Heathcote
Matthew Poulton
Mike Lowe
Nicola Telcik
Philip Ferguson
Raimund Herz
Richard Bonds
Sveinung Sagrov
Tristan Day
Wayne Ganther
Yves Legat
F-2
-
PIPA
Cemagref
Imperial College London
YVW
Earth Tec
Technische Dresden Universität
Ductile Iron Pipe Research Association
SINTEF
Austeck Pty Ltd
CSIRO
Cemagref
Table of Contents
Introduction ..................................................................................................................................1
F1.0
Acoustic Emission ........................................................................................................5
F2.0
Active Acoustic Inspection...........................................................................................9
F3.0
Air Permeability .........................................................................................................11
F4.0
AQUA-Selekt .............................................................................................................15
F5.0
AQUA-WertMin.........................................................................................................17
F6.0
AwwaRF’s Manager Software ...................................................................................20
F7.0
Barcol Hardness Test..................................................................................................22
F8.0
Broadband Electromagnetic........................................................................................25
F9.0
Carbonation Testing and Petrographic Examination..................................................28
F10.0
CARE-S ......................................................................................................................31
F11.0
CARE-W ....................................................................................................................34
F12.0
CCTV Inspection ........................................................................................................37
F13.0
Concrete Electrical Resistance (Resistivity)...............................................................41
F14.0
Condition Assessment of Plastic Pipes.......................................................................44
F15.0
Core/Coupon Sampling ..............................................................................................47
F16.0
Corrosion Burial Testing ............................................................................................49
F17.0
Cover Meter - Reinforcement Location & Measurement...........................................51
F18.0
Crack Measurement Tools..........................................................................................53
F19.0
Current Monitoring.....................................................................................................55
F20.0
Cut-out Sampling........................................................................................................57
F21.0
Drop Test ....................................................................................................................59
F22.0
Ductor (Micro Ohm Resistance) Testing....................................................................61
F23.0
Electrical Potential (Half Cell) Measurement of Concrete Reinforcement ................63
F24.0
FailNet-Reliab ............................................................................................................67
F25.0
FailNet-Stat.................................................................................................................69
F26.0
Fiberscope Inspection .................................................................................................71
F27.0
Fracture Toughness (C-Ring) Testing ........................................................................74
F28.0
Ground Penetrating Radar (GPR)...............................................................................77
F29.0
Holiday Detector.........................................................................................................81
F30.0
Hydraulic Modeling....................................................................................................85
F31.0
Impact Echo Testing ...................................................................................................88
F32.0
Indirect Tensile Strength Testing ...............................................................................92
F33.0
Infiltration and Inflow – Sewer Flow Survey .............................................................94
F34.0
In-Pipe Acoustic Inspection Tools (Sonar) ................................................................97
F35.0
In-Pipe Hydrophones ................................................................................................101
F36.0
Insulation Test ..........................................................................................................103
F37.0
Intelligent Pigs ..........................................................................................................105
F38.0
KANEW ...................................................................................................................109
F39.0
KureCAD..................................................................................................................112
F40.0
Leak Detection..........................................................................................................114
F41.0
Linear Polarization Resistance of Soil (Soil LPR) ...................................................117
F42.0
Load Rejection Tests ................................................................................................119
F43.0
LPR for Corrosion Monitoring .................................................................................121
F44.0
Magnetic Flux Leakage ............................................................................................124
F45.0
Man Entry Inspection ...............................................................................................128
F46.0
Measurement of Strain..............................................................................................131
F47.0
Methylene Chloride Gelation Assessment ...............................................................136
Condition Assessment Strategies and Protocols for Water and Wastewater Utility Assets
F-3
F48.0
F49.0
F50.0
F51.0
F52.0
F53.0
F54.0
F55.0
F56.0
F57.0
F58.0
F59.0
F60.0
F61.0
F62.0
F63.0
F64.0
F65.0
F66.0
F67.0
F68.0
F69.0
F70.0
F71.0
F72.0
F73.0
F74.0
F75.0
F76.0
F77.0
F78.0
F79.0
F80.0
F81.0
F82.0
F83.0
F84.0
F85.0
F-4
Motor Circuit Analysis .............................................................................................139
Multi-sensor Pipe Inspection Robots........................................................................141
Oil Testing ................................................................................................................145
On-Line Leak Detection Systems.............................................................................149
PARMS-Planning .....................................................................................................151
PARMS-Priority .......................................................................................................154
Passive Acoustic Inspection of Pipes (Acoustic Emission)......................................157
Performance Testing of Rotating Machinery ...........................................................160
Phenolphthalein Indicator (Carbonation Testing) ....................................................163
Pipe Potential Surveys ..............................................................................................166
PiReP/PiReM............................................................................................................169
Pit Depth Measurement ............................................................................................171
Process Control Systems (Integrated).......................................................................174
Pull-off Adhesion Testing ........................................................................................176
Radiographic Testing................................................................................................180
Remote Field Eddy Current (RFEC and RFEC/TC Tools) ......................................183
Schmidt Hammer ......................................................................................................187
SCRAPS (Sewer Cataloging, Retrieval and Prioritization System).........................190
Slow Crack Growth Resistance of PE Pipes ............................................................193
Smart Digital Sewer Pipe Diagnostic System (VTT) ...............................................196
Smoke Testing ..........................................................................................................198
Soil Characterization ................................................................................................200
Soil Corrosivity.........................................................................................................204
Soil (Electrical) Resistivity.......................................................................................207
Thermographic Testing.............................................................................................210
Transformer Circuit Protection Coordination and Protection Relays.......................212
Transient Earth Voltage (TEV) ................................................................................215
Ultrasonic Emission Inspection ................................................................................217
Ultrasonic Measurements; Continuous (Guided Wave) ...........................................220
Ultrasonic Measurements; Discrete..........................................................................223
UtilNets.....................................................................................................................228
Valve Exercising.......................................................................................................231
Vibration Analysis ....................................................................................................234
Visual Inspection (Pipes)..........................................................................................237
WARP.......................................................................................................................239
WRc Sewer Rehabilitation Manual ..........................................................................242
WRc Trunk Main Structural Condition Assessment Approach ...............................246
Volumetric X-Ray or Radiographic Testing.............................................................249
F1.0 Acoustic Emission
F1.1 Overview
Acoustic emissions are transient elastic waves that are generated by the rapid release of
strain energy from within a material. A common source of acoustic emission is the sudden
appearance or propagation of a microscopic crack within a material under load.
Material defects such as cracks, pits and gas bubbles act as local stress concentrators
that promote crack propagation. Acoustic emissions indicate the presence of these material
defects. Frequent acoustic emissions are an indication that there are numerous points of high
stress concentration, and that the material is approaching failure. Other sources of acoustic
emission that do not involve material failure include active corrosion, cavitation of pumps, delamination of a composite material, turbulent flow through a leak in a pressure vessel and
phase transformation of a monolithic material.
Acoustic emissions can be detected by a sensor and recorded. In this way, acoustic
emission monitoring can be used as a non-destructive method of condition monitoring. The
frequency of acoustic emissions can be increased by placing a structure under a higher than
normal stress (load). Acoustic emission testing can thus be used to gather additional
information where a structure is tested under high loads for another reason, for example,
factory acceptance testing of pressure vessels.
F1.2 Main Principles
Acoustic emission testing is different to ultrasound testing (see reviews of ultrasonic
techniques for more information), which involves sending an ultrasound signal into a material
and measuring any echoes produced. In contrast, acoustic emission testing involves measuring
the signals that are generated from within the material itself. Each acoustic emission is a
unique real-time event, for example, caused by a crack expanding and cannot be exactly
repeated. Acoustic emission instrumentation typically includes the following items:
•
A sensor.
•
A preamplifier and/or a postamplifier.
•
Signal processing electronics for feature extraction and waveform capture.
•
A microprocessor and a digital signal processor.
•
Acoustic emission analysis software.
An acoustic emission sensor is a transducer, typically constructed of a piezoelectric
material. Most sensors measure in the ultrasonic frequency range between 20 kHz and
1 MHz. However, sensors outside this range are commercially available. Strongly attenuating
materials, such as concrete and masonry, are monitored at lower frequencies while metals,
polymers and composite structures are monitored at higher frequencies. Acoustic emission
sensors typically have a diameter and depth of approximately one inch. The sensors can be
attached to the material or structure under analysis using either magnetic hold-downs, a
couplant layer or thick glue.
Since the output voltage of an acoustic emission sensor is very small, a preamplifier or
a postamplifier should be connected to the sensor output. The amplifier output should be
connected to signal processing equipment, typically a computer with the relevant software or a
purpose-built hand held instrument for acoustic emission testing.
Condition Assessment Strategies and Protocols for Water and Wastewater Utility Assets
F-5
The intensity of an acoustic emission event will decrease as the distance from the
source increases. By setting up several sensors on the structure and by knowing the attenuation
properties of the material, the location of the acoustic emission source can be determined.
F1.3 Application
Acoustic emission testing is most commonly used for detecting and locating material
defects in pressure vessels, storage tanks, pipes, heat exchanges, aerial lift devices and welded
joints.
Many other applications for acoustic emission testing are currently being researched
and developed. One example is the local, long-term monitoring of civil engineering structures
such as bridges and pipelines. Acoustic emission testing of glass-fiber reinforced parts, such as
fan blades, is also becoming more common.
A number of standards reference this technique for a variety of products ranging from
small parts to pressure vessels.
•
ASTM-E1067-96, ASTM-E1106-86(1992)e1, ASTM-E1118-95, ASTM-E1139-97,
ASTM-E1211-97, ASTM-E1419-96, ASTM-E1781-98, ASTM-E1888-97, ASTME1930-97, ASTM-E1932-97, ASTM-E569-97, ASTM-E650-97, ASTM-E749-96,
ASTM-E750-98, ASTM-E751-96, ASTM-E976-98, ASTM-F1430-98, ASTM-F179798, ASTM-F914-98.
•
AAR Procedure for AE Evaluation of Tank Cars and IM101 Tanks.
•
ASME V, Article 12, Acoustic Emission Examination of Metallic Vessels During
Pressure Testing.
•
SPI Recommended Practice for Acoustic Emission Testing of Fiberglass Reinforced
Plastic Resin (RP) Tanks/Vessels.
F1.4 Practical Considerations
•
A trained operator is required to carry out acoustic emission inspections.
•
The equipment is commercially available.
•
In many applications, acoustic emission testing requires that a load be put on the asset.
For piping and tanks this is normally achieved by over pressurization by 10%.
F1.5 Advantages
•
The ability to observe the creation and growth of material defects within a material over
the entire load history of the structure (with permanently placed sensors).
•
Testing does not need to disturb the structure/specimen.
F1.6 Limitations
F-6
•
Only qualitative estimates of material damage and failure predictions are possible.
•
Environments are often noisy and the acoustic emission signals are weak so
distinguishing noise from the measurements can be difficult.
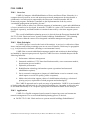
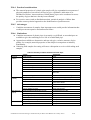
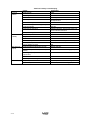
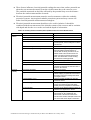
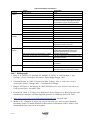
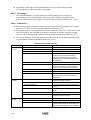
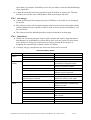
Table F-1. Summary Acoustic Emission.
Technical
selection
Criteria
Assets covered
Material
Service area
Access requirements
Limitations relating to asset condition
Limitations relating to asset size/geometry
Continuous/discrete
Destructive/non destructive
Interruption to supply/function
Technical
suitability
Assessment parameters
Integration with software tools
Commercialization of tool
Utility technical
capacity
Previous/existing use of the tool in sector
Accuracy/reliability
Ease of validation of results
Asset management sophistication required
Skills required (level of tool sophistication); usability
Technology required (level of tool sophistication)
Economic
factors
Documentation
Availability of technical support
Cost per inspection
Resource requirements
Assessment
Pipes, aerial lift devices, pressure vessels,
storage tanks.
Concrete, masonry, metals, polymers,
composites.
Potable and wastewater.
None.
None.
None.
Continuous in time and space.
Non-destructive.
Tests can be undertaken while the asset is online.
Material defects.
Acoustic emission remote monitoring equipment
is commercially available.
Commercially available acoustic emission
equipment is readily available from a limited
number of suppliers.
Widely used in other sectors.
Qualitative estimates.
Only through further inspection of components.
Generic approach.
A trained operator is required. Training and
certification courses are commercially available.
A straightforward acoustic emission instrument
hardware design includes a transducer,
preamplifier, bandpass filter, amplifier and
several digital signal processors.
Refer to the Standards listed.
Commercially available.
Depends on application.
Depends on application.
F1.7 Bibliography
1. AAR Procedure for AE Evaluation of Tank Cars and IM101 Tanks
2. ASME V, Article 12, Acoustic Emission Examination of Metallic Vessels During Pressure
Testing
3. ASTM-E1067-96 Standard Practice for Acoustic Emission Examination of Fiberglass
Reinforced Plastic Resin (FRP) Tanks/Vessels
4. ASTM-E1106-86(1992)e1 Standard Method for Primary Calibration of Acoustic Emission
Sensors
5. ASTM-E1118-95 Standard Practice for Acoustic Emission Examination of Reinforced
Thermosetting Resin Pipe (RTRP)
Condition Assessment Strategies and Protocols for Water and Wastewater Utility Assets
F-7
6. ASTM-E1139-97 Standard Practice for Continuous Monitoring of Acoustic Emission from
Metal Pressure Boundaries
7. ASTM-E1211-97 Standard Practice for Leak Detection and Location Using SurfaceMounted Acoustic Emission Sensors
8. ASTM-E1419-96 Standard Test Method (STM) for Examination of Seamless, Gas- Filled,
Pressure Vessels Using Acoustic Emission
9. ASTM-E1781-98 Standard Practice for Secondary Calibration of Acoustic Emission
Sensors
10. ASTM-E1888-97 STM for Acoustic Emission Testing of Pressurized Containers Made of
Fiberglass Reinforced Plastic with Balsa Wood Cores
11. ASTM-E1930-97 STM for Examination of Liquid Filled Atmospheric and Low Pressure
Metal Storage Tanks Using Acoustic Emission
12. ASTM-E1932-97 Standard Guide for Acoustic Emission Examination of Small Parts
13. ASTM-E569-97 Standard Practice for Acoustic Emission Monitoring of Structures During
Controlled Stimulation
14. ASTM-E650-97 Standard Guide for Mounting Piezoelectric Acoustic Emission Sensors
15. ASTM-E749-96 Standard Practice for Acoustic Emission Monitoring During Continuous
Welding
16. ASTM-E750-98 Standard Practice for Characterizing Acoustic Emission Instrumentation
17. ASTM-E751-96 Standard Practice for Acoustic Emission Monitoring During Resistance
Spot-Welding
18. ASTM-E976-98 Standard Guide for Determining the Reproducibility of Acoustic Emission
Sensor Response
19. ASTM-F1430-98 STM for Acoustic Emission Testing of Insulated Aerial Personnel
Devices with Supplemental Load Handling Attachments
20. ASTM-F1797-98 STM for Acoustic Emission Testing of Insulated Digger Derricks
21. ASTM-F914-98 STM for Acoustic Emission for Insulated Aerial Personnel Devices
22. SPI Recommended Practice for Acoustic Emission Testing of Fiberglass Reinforced Plastic
Resin (RP) Tanks/Vessels
F-8
F2.0 Active Acoustic Inspection
F2.1 Overview
This non-destructive technique uses the transmission of sound to assess defects in the
structure of pipes; generally of cementituous materials. A known force is imparted to the asset
and sensors measure the response. Cracks, delamination and other discontinuities affect the
transmission of sound. Generally damaged pipes will display lower wave speeds and propagate
less energy to the sensors. Depending on the response, the assessor can thus identify if the asset
has cracks and other defects.
F2.2 Main Principles
The active acoustic inspection tool consists of a means of imparting sound energy and
sensors to detect that energy.
An impact, generally from a steel ball, is used to impart sound energy which propagates
along the asset’s length. Sensors are placed to detect the sound propagated. Assets with defects
such as crack or voids will experience some reflection of the sound reducing the energy that
reaches the sensors.
F2.3 Application
Active acoustic inspection is applied to cementituous pipes to identify cracks,
delamination, or other defects. It can be used to assess wire breaks, delamination and cracks in
pre-stressed cylinder concrete pipe (PCCPs).
•
No ASTM or ISO standards were identified for this application.
F2.4 Practical considerations
•
The technique is also known as seismic pulse echo.
•
Active acoustic inspection is widely used in many industries for inspecting concrete
assets. As such it is fully commercialized. This method relies heavily on operator skill,
but is probably the most commonly used NDE inspection technique used for
cementituous pipes.
•
The tools are portable and the approach relatively easy to use. The output is a
qualitative assessment indicating the presence of pipe defects.
•
Manual inspection is most sensitive to defects near the inside diameter, and prone to
missing defects near the outside diameter of the pipe. This is a problem for inspecting
PCCPs, but is especially problematic when inspecting pre-cast, post-tensioned pipe, as
a common failure mechanism in this pipe type is failure of the tensioning metal by
outside diameter corrosion, and this damage is difficult to detect manually.
•
Both inside diameter and outside diameter defects can be more readily detected using
instrumented testing.
•
The asset must be exposed prior to inspection to allow access to points on the pipe
surface. Pipe assets can be inspected internally using man entry techniques.
•
The pipe should also be dewatered prior to inspection as the water will alter the sound
propagation properties.
F2.5 Advantages
•
This technique can be conducted quickly with results immediately available.
Condition Assessment Strategies and Protocols for Water and Wastewater Utility Assets
F-9
•
The results of this technique give information about the overall condition of the pipe.
F2.6 Limitations
•
Pipe assets must be dewatered before inspection.
•
Asset must be exposed prior to inspection. However, full exposure of the asset is not
required; exposure only need allow access to points on pipe surface.
•
This technique may not locate specific small defects).
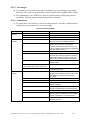
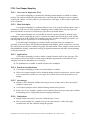
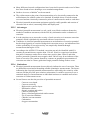
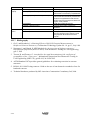
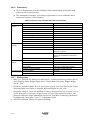
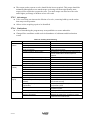
Table F-2. Summary Active Acoustic Inspection.
Technical
selection
Technical
suitability
Utility technical
capacity
Economic factors
Criteria
Assets covered
Material type
Service area
Access requirements
Limitations relating to asset condition
Limitations relating to asset size/geometry
Continuous/discrete
Destructive/non destructive
Interruption to supply/function
Assessment parameters
Integration with software tools
Commercialization of tool
Previous/existing use of the tool in sector
Accuracy/reliability
Ease of validation of results
Asset management sophistication required
Skills required (level of tool sophistication); usability
Technology required (level of tool sophistication)
Documentation
Availability of technical support
Cost per inspection
Resource requirements
Assessment
Pipe assets.
Cementituous, PCCPs
Potable and wastewater.
Access to asset surface is required.
None.
None (man entry for pipes).
Discrete.
Non-destructive test.
Inspection conducted while pipe is off-line and
dewatered.
Presence of defects.
None.
Approach is widely used and available from
numerous suppliers.
Widely used in civil industries.
Qualitative measure.
Results validated by exhumation of pipe.
Generic approach.
Training in tool use required.
Can be instrumented or manual.
Supplied with tool, no standards identified.
From suppliers.
Relatively low.
Man power sufficient to expose asset and for
confined spaces when applicable.
F2.7 Bibliography
1. Dingus, M., Haven, J. and Austin, R. Nondestructive None Invasive Assessment of
Underground Pipes, AwwaRF, USA, 2002
2. Makar, J. M. ; Chagnon, N. Inspecting systems for leaks, pits, and corrosion, National
Research Council of Canada, Institute for Research in Construction, NRCC-42802, 1999
(downloaded from www.nrc.ca/irc/ircpubs)
3. Lillie, K., Reed, C. and Rodgers, M. A. R., 2004, Workshop on Condition Assessment
Inspection Devices for Water Transmission Mains, AwwaRF, USA, 2004
F-10
F3.0 Air Permeability
F3.1 Overview
Air permeability is a non-destructive test that can be used to determine the permeability
and quality class of concrete. Concrete permeability is an excellent measure of the resistance of
concrete against aggressive media. The ingress of water and air into the concrete can cause
corrosion of steel reinforcement, which leads to a deterioration in the durability of the concrete.
Air permeability testing is also referred to as ‘gas’ permeability testing.
There are two main methods for testing air permeability: the Torrent method, which
measures the reduction of an applied vacuum over time, and the Cembureau method for
oxygen permeability. The Torrent method is described here due to its more extensive use as a
concrete durability assessment tool, and its widespread use on road, bridge and tunnel assets.
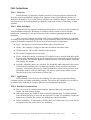
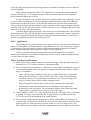
F3.2 Main Principles
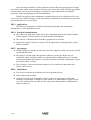
The Torrent method involves creating a vacuum at the surface of the concrete and
monitoring the rate at which the pressure in the test chamber increases after the vacuum pump
has been disconnected. The distinctive features of the method are a double chamber cell and a
pressure regulator that balances the pressure in both chambers during the test. A
microprocessor processes and stores test results.
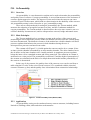
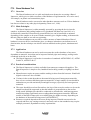
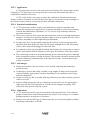
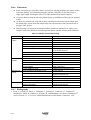
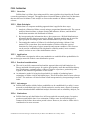
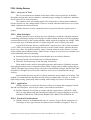
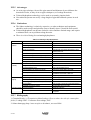
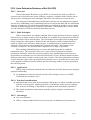
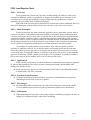
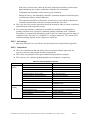
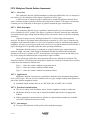
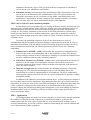
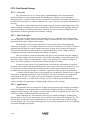
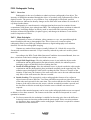
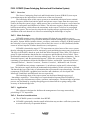
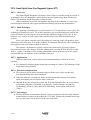
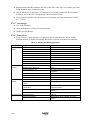
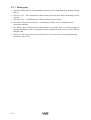
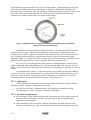
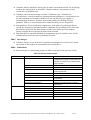
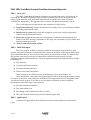
The vacuum cell (Figure F-1) is held against the concrete surface by a vacuum. It has
an inner circular chamber surrounded by an outer annular chamber. The outer chamber forces
the air inflow to the inner chamber to be virtually uniaxial. A membrane pressure regulator
brings the inner cell to a standard vacuum and is then turned off. The reduction in vacuum is
measured over a time period. The permeability coefficient kT and the depth of penetration of
the vacuum are calculated on the basis of a simple theoretical model and the permeability of
the concrete is determined.
In the case of dry concrete, the quality class of the concrete cover can be read from a
table using the kT value. In the case of moist concrete, kT is combined with the electrical
concrete resistance p (rho) and the quality class is determined from a numerical relationship.
Figure F-1. Torrent Permeability Tester (Mastrad, 2006).
F3.3 Application
Air permeability testing can be conducted on any concrete structure, including but not
limited to; buildings, tanks, slabs and other such structures.
Condition Assessment Strategies and Protocols for Water and Wastewater Utility Assets
F-11
Standards which reference this test method are:
•
DIN 28400 ‘Vacuum Technique’ Deutsches Institut fur Normung (DIN)
•
C497-05 Standard Test Methods for Concrete Pipe, Manhole Sections, or Tile
•
ASTM C204-05 Standard Test Method for Fineness of Hydraulic Cement by Air
Permeability Apparatus
F3.4 Practical Considerations
•
Instrumentation for carrying out air permeability testing is widely available from a
number of commercial providers.
•
The instrumentation is portable and does not require specialist skills to use. Individual
tests can be completed in less than five minutes and the results are reproducible.
•
Air permeability testing has been widely applied throughout both the water and other
industry sectors for evaluating the durability of concrete.
•
When testing is conducted on moist concrete, it should be complemented with the nondestructive determination of the electrical resistivity.
F3.5 Advantages
•
The testing method is suitable for both laboratory and onsite application. Testing is
non-destructive and allows a rapid and reliable comparison between laboratory samples
and site concrete.
•
Measurements taken in the field are usually in good agreement with laboratory methods
such as oxygen permeability, capillary suction, chloride penetration.
•
Capillary suction can also be estimated from permeability results obtained from testing.
Capillary suction is known to be related to permeability if the surface tension effects
are not disturbed by water repellents.
F3.6 Limitations
•
The concrete needs to be dry for accurate testing, as permeability times are influenced
by the moisture content of the concrete.
•
When concrete is moist, air permeability values are significantly lower than when it is
dry. This can result in a distortion in the evaluation of the quality of the concrete,
particularly when it is performed in-situ.
F-12
Table F-3. Summary Air Permeability.
Technical
selection
Criteria
Assets covered
Material type
Service area
Access requirements
Limitations relating to asset condition
Limitations relating to asset size/geometry
Continuous/discrete
Destructive/non destructive
Interruption to supply/function
Technical
suitability
Assessment parameters
Integration with software tools
Commercialization of tool
Previous/existing use of the tool in sector
Accuracy/reliability
Ease of validation of results
Utility technical
capacity
Economic
factors
Asset management sophistication required
Skills required (level of tool sophistication);
usability
Technology required (level of tool
sophistication)
Documentation
Availability of technical support
Cost per inspection
Resource requirements
Assessment
Concrete elements with a flat surface such as slabs,
beams, columns, walls and pavements
Coated and uncoated concrete.
Potable and wastewater.
Direct contact with surface of asset. If asset is buried
then it must be exposed. Surface coatings need to be
removed in order to test permeability of concrete.
Sufficient room is required for an operator where an
asset has been exposed for testing.
Concrete surface must be level and not be too porous
or rough as the chambers of the vacuum cell need to
seal effectively against the surface.
No limitations relating to size of concrete element.
Surface must be flat.
Discrete reading.
Non-destructive.
The asset can remain in use and does not need to be
taken off-line.
Permeability, quality class and capillary suction of
concrete.
Compatible with a RS 232 data interface gives a
printout of measured objects and can be transferred
to PC with MS Hyperterminal.
Equipment is fully developed, available from selected
commercial vendors.
Widespread use internationally on bridges, road, and
tunnel infrastructure. Limited application in the water
industry.
Accuracy better than 3% variation from reading.
Results are easily validated by conducting other
standard tests for permeability such as ASTM C
1202.
Generic approach.
Easy to use by following simple procedure.
Unqualified staff can take measurements.
Apparatus comes in a digital version, which calculates
and displays permeability. Quality class of concrete,
capillary suction and carbonation depth of concrete
can be estimated using supporting software by
exporting data. The data from up to 200 tests can be
stored and downloaded.
DIN 28400 Vacuum Technology.
Technical support available from distributors.
Low cost per inspection.
Resources required depend on asset being
inspected. Buried assets need to be exposed and
surface cleaned and made smooth to ensure a seal
with vacuum cell.
Condition Assessment Strategies and Protocols for Water and Wastewater Utility Assets
F-13
F3.7 Bibliography
1. Torrent, R. The gas permeability of high-performance concretes: site and laboratory tests.
ACI Special Publication 186. pp1-4, 1999
2. Papworths, Corrosion Monitoring Equipment, ‘TORRENT Water Permeability’ ‘Defelsko
Positest CarbonationTester for Concrete and Metal. Papworths Pty Ltd Concrete
Consultancy Service and NDT Equipment. 2005
3. DIN 28400 Vacuum Technology
4. C497-05 Standard Test Methods for Concrete Pipe, Manhole Sections, or Tile
5. ASTM C204-05 Standard Test Method for Fineness of Hydraulic Cement by Air
Permeability Apparatus
6. Mastrad, http://www.mastrad.com/torrent.htm, accessed 2006
F-14
F4.0 AQUA-Selekt
F4.1 Overview
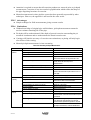
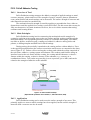
AQUA-Selekt is a software package developed in Germany, designed to assist
infrastructure managers forecast sewer condition using representative CCTV inspection data
(see CCTV Visual Inspection review). A qualitative condition inspection of a representative
sample is first assessed. This data is then used to forecast the condition of sewers that are not
inspected.
F4.2 Main Principles
AQUA-Selekt is a PC based software tool that is used to determine the condition of
assets within a sewerage network. The approach used is to infer the condition of the asset stock
from the known condition of a representative sample of assets.
The CCTV inspection strategy used is dependent on the size of the network, requiring
10-20% of the network to be inspected. As the size of the network increases, the percentage
inspection required decreases.
The condition of the inspected sample is used to extrapolate the condition trend of the
sewers that have not been inspected by means of statistical evaluation.
F4.3 Application
AQUA-Selekt is designed to assist with the forecasting of sewer condition using
representative CCTV-inspection data.
•
The selection strategy used by AQUA-Selekt is in accordance with DIN EN 752-5.
F4.4 Practical considerations
•
The software is readily available, commercialized, and used by several European
authorities with a handful of users in other areas. It uses a Windows Explorer-style
navigation structure.
•
The method has been successfully tested in Germany on the sewer systems at
Volkswagen plants in Wolfsburg, Emden and Brunswick, and is currently being
developed further within the scope of a research project supported by the Ministry of
Education and Research for various cities.
F4.5 Advantages
AQUA-Selekt allows the forecasting of sewer condition of an entire network based on
the CCTV data from a representative sample. This helps in the overall planning and
evaluation of sewer rehabilitation and maintenance and helps to target problem areas.
This method used is claimed to be efficient with clear cost benefits, particularly for
large sewer systems of 1000 km and over.
System sections that are in particular need of rehabilitation can be detected early and
given priority for complete inspection and rehabilitation.
PC based software that requires MS-Windows 95/98 and MS Access 2000 to be
installed as minimum requirements (software cannot be used on other operating
systems).
Condition Assessment Strategies and Protocols for Water and Wastewater Utility Assets
F-15
F4.6 Limitations
AQUA-Selekt was developed for the European context. Vendors only available in
Germany. Requires CCTV data of selected sewer sections in order for the forecasting
model to be effective.
Table F-4. Summary AQUA-Selekt.
Technical
selection
Technical
suitability
Criteria
Assets covered
Granularity
Service area
Focus of analysis
Scalability of tool/approach
Commercialization
Previous/existing use of the tool
Utility technical
capacity
Ease of validation
Flexibility with regard to analysis (asset types) and
granularity (system, asset level)
Integration with other tools/GIS
Asset management sophistication
In-house skills required
Technology required
Documentation
Data Requirements
Linking to asset data
Availability of software and technical support
Usability
Assessment
Sewer pipes.
System and asset level.
Wastewater.
Forecasting of sewer condition using
representative CCTV-inspection data.
Better suited to medium to large authorities
where CCTV data is available.
Commercial software available from Germany.
Used by several European authorities and has a
handful of users in other areas.
Validation is possible only through site surveys.
Wastewater only; system level only.
None.
Aimed at level of asset management where
CCTV data is available.
Professional asset manager/engineer
PC based tool. Windows based operating
system. Requires Microsoft Access 2000
On-line help and detailed documentation
provided.
CCTV data required and MS Access data files
used.
Exports and imports to/from Microsoft Access
database.
Technical support available. On-line forum.
Simple operation of the Windows 32-Bit
program using Explorer-style navigation
structure.
F4.7 Bibliography
1. Eisenbeis, P., P. Le Gauffre, and S. Saegrov, Water Infrastructure Management: An
Overview of European Models and Databases, AwwaRF Infrastructure Conference,
Baltimore MD, 2000.
2. Herz, Raimund K., Aging Processes And Rehabilitation Needs Of Drinking Water
Distribution Networks, Journal of Water, SRT-Aqua Volume 45, pp 221-231, 1996
3. AQUA-Selekt homepage, http://www.sewer-rehabilitation.com/, accessed 2006
4. DIN EN 752-5: 1997 Drain and sewer systems outside buildings - Part 5: Rehabilitation
F-16
F5.0 AQUA-WertMin
F5.1 Overview
AQUA-WertMin is a software package developed in Germany to assist infrastructure
managers with the planning of CCTV-inspection, rehabilitation and new construction strategies
for sewers networks.
AQUA-WertMin calculates the current market value of assets, forecasts the
deterioration of pipe condition and assesses future rehabilitation needs using inbuilt models
and CCTV inspection data. It enables users to compare the costs of different rehabilitation
strategies based on an economic analysis of costs and time of repair.
F5.2 Main Principles
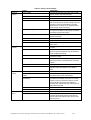
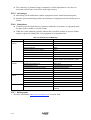
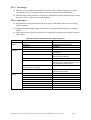
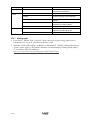
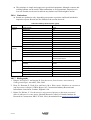
AQUA-WertMin is a PC based software tool. The user enters pipe and manhole (assets)
condition scores derived from CCTV inspections into the application. The software then
assigns one of the following six classifications to each asset in the network, as described in the
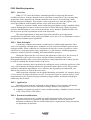
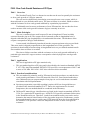
Table F-5.
Table F-5. Asset Condition Classification System.
Classification
Class 6
Description
Excellent condition – no observed defects.
Class 5
Good condition – few defects observed, repair as needed.
Class 4
Fair condition – minor defects observed that will require repairs in long-term plan.
Class 3
Poor condition – defects observed that will require major repairs, but no rehabilitation in the mid-term plan.
Class 2
Very poor condition – defects observed that require major rehabilitation, but not replacement in the nearterm plan.
Class 1
Pipe failed – needs immediate replacement.
The software calculates the probability of an asset (or group of like assets) transitioning
from one condition class to the next lower (worse) class. To determine the transitional
function, the software applies a survival model for groups of similar sewer sections. The
survival functions are calibrated using data collected from the network inspection records
including year of pipe installation, year of inspection, pipe diameter, and pipe condition.
Modules are also provided for the calculation of asset values, and
replacement/rehabilitation costs, which enables the user to compare the costs of different
rehabilitation strategies based on an economic analysis.
F5.3 Application
AQUA-WertMin is designed to assist with the planning of CCTV-inspection,
rehabilitation and new construction strategies for sewer network assets. The program follows
the guidelines for cost-minimizing maintenance of sewers by the Ministry of Environment and
Transport of the German federal state Baden-Württemberg of December 2000.
F5.4 Practical Considerations
The software is readily available, commercialized, and used by several European
authorities with a handful of users in other areas.
The software uses a simple Windows Explorer-style navigation structure.
Condition Assessment Strategies and Protocols for Water and Wastewater Utility Assets
F-17
All data can be selected using specific fields and exported to Microsoft Access 2000 or
97 databases.
F5.5 Advantages
Program installation is simple with step-by-step instructions.
AQUA-WertMin has a consistent and easy-to-use user interface with Explorer-style
navigation structure. On-line help is also available
Freely-configurable import function for Access databases from version 2.0 and
databases linked using ODBC.
All data can be selected using specific fields and exported to Microsoft Access 2000 or
97 databases.
F5.6 Limitations
AQUA-WertMin was developed for the European context.
Vendors are only available in Germany.
Table F-6. Summary AQUA WertMin.
Technical
selection
Technical
suitability
Criteria
Assets covered
Granularity
Assessment
Sewer pipes.
System and asset level.
Focus of analysis
Planning of CCTV-inspection, renovation and new
construction strategies for wastewater networks.
Better suited to medium to large authorities where
CCTV data is available.
Commercial software available from Germany.
Used by several European authorities and has a
handful of users in other areas.
Validation is possible only through site surveys.
Wastewater only; asset to system level.
Scalability of tool/approach
Commercialization
Previous/existing use of the tool
Utility technical
capacity
Ease of validation
Flexibility with regard to analysis (asset types)
and granularity (system, asset level)
Integration with other tools/GIS
Asset management sophistication
In-house skills required
Technology required
Documentation
Data Requirements
Linking to asset data
Availability of software and technical support
Usability
None.
Aimed at higher level of asset management where
CCTV data is available.
Professional asset manager/engineer.
PC based tool. Windows based operating system.
Requires Microsoft Access 2000.
On-line help and detailed documentation provided.
CCTV data required and Microsoft Access data
files used.
Exports and imports to/from Microsoft Access
database.
Technical support available. On-line forum.
Simple operation of the Windows 32-Bit program
using Explorer-style navigation structure.
F5.7 Bibliography
1. Herz, Raimund K., Aging Processes And Rehabilitation Needs Of Drinking Water
Distribution Networks, Journal of Water, SRT-Aqua Volume 45, pp 221-231, 1996
F-18
2. Eisenbeis, P., P. Le Gauffre, and S. Saegrov, Water Infrastructure Management: An
Overview of European Models and Databases, AwwaRF Infrastructure Conference,
Baltimore MD, 2000.
3. AQUA-WertMin homepage, http://www.sewer-rehabilitation.com/, accessed 2006
4. Stone, S., Dzuray, E. J., Meisegeier, D., Dahlborg, A-S., and Erickson, M. DecisionSupport Tools for Predicting the Performance of Water Distribution and Wastewater
Collection Systems, EPA, EPA/600/R-02/029, 2002
Condition Assessment Strategies and Protocols for Water and Wastewater Utility Assets
F-19
F6.0 AwwaRF’s Manager Software
F6.1 Overview
AwwaRF’s Water Treatment Plant Infrastructure Assessment Manager (Manager
Software) is a software based tool that allows the user to manage information relating to
treatment plant assets. The software provides procedures and instructions to gather information
on the condition and criticality of water treatment facilities and their components, and includes
financial accounting capabilities from the unit level through the facility level.
F6.2 Main Principles
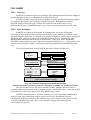
There are three parts to the Manager Software: the toolbar, tree and data viewer. The
tree allows the structure of the treatment plant facility to be input according to a consistent
asset hierarchy. For example, from the facility level, the plant is conceptually broken down in
terms of systems (e.g., raw water systems) and subsystems (e.g., raw water intake), units (such
as screening), and finally individual components such as bar screens and control panels. The
user can represent the treatment plant hierarchy using the options in the tree.
Once the tree has been set up, the user navigates throughout Manager Software by
clicking on different systems, subsystems, and units, and can then record information against
the assets detailed at that level in the hierarchy. The user can input the following data:
Criticality (to show relative importance of the plant item).
Condition assessment, a unit can have a condition grading/rating 0 (inoperable) through
to 4 (excellent), with a capacity to record ‘unknown’.
Safety impact to human health if it should fail.
Weighting and criticality; to give relative importance to an asset within the hierarchy.
Other information can be input such as, photos, assessment considerations, acquisition
cost, replacement cost, and so forth.
A condition scoring system is used to summarize condition. This incorporates both a
condition rating at the unit level and a weighting of the unit's importance to the plant's overall
ability to produce water. The Manager Software tabulates the scoring at the subsystem, system,
and facility levels and generates various reports.
F6.3 Application
AwwaRF’s Manager Software is designed to facilitate the management of condition
and asset data for water treatment works.
F6.4 Practical Considerations
The product is an output of a research project and is freely available through AwwaRF.
F6.5 Advantages
The Manager Software provides procedures and instructions to gather information on
the condition and criticality of water treatment facilities and their components.
Through the tree structure, the software organizes the assessment process around the
evaluation of systems rather than engineering/maintenance disciplines. A review of
non-destructive assessment methods is also included within the Manager Software.
F-20
The Manager Software allows for wide variations in the type and size of facilities and
in the experience of the staff who will perform the assessment.
It includes financial accounting capabilities from the unit level through the facility
level.
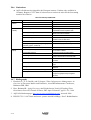
F6.6 Limitations
Functionality would ideally be integrated into corporate systems, rather than a standalone tool.
Table F-7. Summary AwwaRF’s Manager.
Technical
selection
Technical
suitability
Criteria
Assets covered
Granularity
Service area
Focus of analysis
Scalability of tool/approach
Utility technical
capacity
Commercialization
Previous/existing use of the tool
Ease of validation
Flexibility with regard to analysis (asset types)
and granularity (system, asset level)
Integration with other tools/GIS
Asset management sophistication
In-house skills required
Technology required
Documentation
Data Requirements
Linking to asset data
Availability of software and technical support
Usability
Assessment
Water treatment works.
System down to unit and component level.
Potable.
Representing asset and condition data within a
consistent framework.
Useable by any utility, but better suited to
utilities without equivalent functionality in
corporate systems.
Software available from AwwaRF.
Practical use is unknown.
N/A
System level, water treatment plants only.
None.
Aimed at level of asset management where
corporate systems have not been developed.
Professional asset manager/engineer.
PC based tool. Windows based operating
system.
Documented through AwwaRF report.
Asset hierarchy, cost and condition data.
Asset hierarchy embedded in software.
Supported in help files and through AwwaRF
report.
Simple operation of the Windows 32-Bit
program using Explorer-style navigation
structure.
F6.7 Bibliography
1. AwwaRF. Water Treatment Plant Infrastructure Asset Management: Users Manual,
prepared by L. Elliot et al, AWWA Research Foundation and American Water Works
Association, USA, 2001
Condition Assessment Strategies and Protocols for Water and Wastewater Utility Assets
F-21
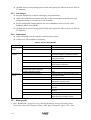
F7.0 Barcol Hardness Test
F7.1 Overview
The Barcol hardness test is a quick and simple non-destructive test using a Barcol
Impressor, which gives a relative measure of the hardness of rigid materials. It is can be used,
for example, on plastic and cementitious pipes.
Barcol hardness can be converted to other hardness measures such as Vickers hardness
but does not relate to any other physical quantity (Dorn et al., 1996).
F7.2 Main Principles
The Barcol Impressor is either manually operated by pressing the device into the
sample a set distance and reading hardness off a graduated dial between 0 and 100, or is
electronically controlled. Electronically controlled devices can be hand held or mounted
depending on the samples to be tested. Harder materials give a higher reading, with materials
that are either too hard or too soft not registering.
The Barcol hardness test provides a relative measure of material hardness. Barcol
hardness is most useful for cementitious pipes, as changes in hardness can indicate areas of
deterioration, but the technique can also be used on materials such as plastic, aluminum and
brass.
F7.3 Application
The Barcol hardness test can be used to measure the surface hardness of any asset
dependant on material. Asset that can be inspected include pipes and coatings, testing can be
conducted in the lab or in the field.
The Barcol Impressor is referred to in a number of standards ASTM D2583-95, ASTM
B 648-78, ASTM E140-97.
F7.4 Practical considerations
The Barcol Impressor is widely available from numerous commercial suppliers. The
Barcol Impressor is simple to use, hand held and readily portable, weighing less than 1
kg.
Manual testers require no power and the reading is taken from dial on tester. Hand held
digital versions are also available.
Variance in the results depends on the material being tested; homogenous materials
have a lower variance than heterogeneous materials. A large number of tests should be
undertaken to provide statistically meaningful averages, especially for heterogeneous
materials.
The tester should be used on flat surfaces; the legs of the tester do not have to be on the
sample but should be supported so that the indenter is perpendicular to the surface
being tested. Multiple tests should be conducted on all materials, with heterogeneous
materials needing significantly more readings than homogenous materials. Different
models of the Barcol Impressor are available that give higher accuracy depending on
the hardness of the material being tested (ASTM D2583).
Resources required depend on the assets being inspected. Buried assets need to be
exposed and have any coatings removed, man entry such as into manholes may require
multiple personnel, dependant on safety requirements.
F-22
The Barcol hardness test has been used to assess deterioration of AC and cementitious
pipes.
F7.5 Advantages
The Barcol Impressor is quick and easy to use and has repeatable measurements on
homogeneous materials. The test can be used on both cementituous and polymeric
materials (Dorn et al., 1996).
F7.6 Limitations
Due to the small area tested each time, the Barcol Impressor is used the results can
show a high degree of scatter in heterogeneous materials, requiring large numbers of
measurements to be taken.
Hardness measurement is an arbitrary scale and does not relate to any other physical
property such as strength (Dorn et al., 1996)
Table F-8. Summary Barcol Hardness.
Technical
selection
Criteria
Assets covered
Material type
Service Area
Access requirements
Limitations relating to asset condition
Limitations relating to asset size/geometry
Continuous/discrete
Destructive/non destructive
Interruption to supply/function
Technical
suitability
Assessment parameters
Integration with software tools
Commercialization of tool
Previous/existing use of the tool in sector
Accuracy/reliability
Utility technical
capacity
Ease of validation of results
Asset management sophistication required
Skills required (level of tool sophistication); usability
Technology required (level of tool sophistication)
Documentation
Assessment
Tester can be used on assets made from the
materials listed below.
Rigid Plastics, uPVC, ABS, mPVC, oPVC and
GRP and cementituous materials.
Potable and wastewater.
Portable hand held device, but requires access
to the asset surface.
Any coating applied to the surface of the asset
should be removed prior to testing.
Test should be preformed on a flat surface,
excessive curvature is an issue.
Discrete.
Non-destructive.
For man entry standard safety procedures
should be followed, otherwise the asset can
remain on-line.
This technique measures the Barcol hardness,
Barcol hardness can be converted to other
measurements of hardness such as Vickers
Hardness.
Stand alone; no integration with computerize
tools/equipment.
Barcol Hardness testers are available off the
shelf.
Some use in assessing deterioration of
cementitious materials.
Semi quantitative (relative) measure. Good
repeatability for homogeneous materials. High
variance for heterogeneous materials.
Indicative results only.
Generic approach.
Easy to use by following simple procedure.
Stand alone tool.
ASTM D2583-95, ASTM B 648-78, ASTM E14097.
Condition Assessment Strategies and Protocols for Water and Wastewater Utility Assets
F-23
Criteria
Availability of technical support
Economic factors
Cost per inspection
Resource requirements
Assessment
Technical support available from retailers and
from Internet.
Low cost per inspection.
Resources required depend on assets being
inspected. Buried assets need to be exposed
and have any coatings removed, man entry
such as into manholes may require multiple
personnel dependant on safety requirements.
F7.7 Bibliography
1. ASTM D2583 95, Standard test method for indentation hardness of rigid plastics by means
of a Barcol Impressor.
2. ASTM E140-97 Standard Hardness Conversion Tables for Metals E1842-96 Standard Test
Method for Macro-Rockwell Hardness Testing of Metallic Materials
3. ASTM B648-78 Standard Hardness Conversion Tables for Metals E1842-96 Standard Test
Method for Macro-Rockwell Hardness Testing of Metallic Materials
4. Dorn, R., Howsam, P., Hyde, R.A. and Jarvis, M.A. Water mains: Guidance on assessment
and inspection techniques, CIRIA Report 162, Construction Industry Research and
Information Association, London, England, 1996.
5. Randall-Smith, M., Russell, A. and Oliphant, R., Guidance manual for the structural
condition assessment of trunk mains, WRc, UK, 1992
F-24
F8.0 Broadband Electromagnetic
F8.1 Overview
The broadband electro magnetic (BBEM) technique is an eddy current method. In eddy
current methods, the thickness of a pipe wall is measured by inducing magnetic fields in the
material. While conventional eddy current inspection techniques use a single frequency (or a
narrow frequency bandwidth), BBEM induction techniques record data over a broad range of
frequencies. Since the depth of penetration is dependent on the frequency of excitation, this
allows information from a range of depths to be obtained.
The BBEM technique works by passing an alternating current through a transmitter coil
at the surface of the pipe, which generates an alternating magnetic field. Flux lines from this
magnetic field pass through the metallic pipe wall, generating a voltage across it. This voltage
produces eddy currents in the pipe wall that produce their own, secondary magnetic field. By
measuring the strength of this magnetic field or the eddy current that produces it, the remaining
metallic wall thickness can be detected.
The technique is non-destructive and commercial suppliers of BBEM state that signal
can be received through all forms of external coating, and in all ferrous materials.
F8.2 Main Principles
Eddy current methods measure the wall thickness of a pipe by sensing the attenuation
and phase delay of an electromagnetic signal that has passed through the pipe wall. Defects on
the pipe are detected because they change the distribution of the eddy currents in the objects
being examined. For example, if the pipe wall is cracked, the currents are forced to go round or
under the crack, causing the magnetic field produced by the eddy currents and the voltage in
the pick-up coil to change. Eddy current inspection techniques are most sensitive to cracks and
other abrupt changes in the metal, and are least sensitive to gradual changes to wall thickness
on the far side of the pipe wall from the coils. For these reasons, and the low frequencies
necessary to overcome the 'skin effect', the classical eddy current technique is not applied to
water pipelines.
While conventional eddy current inspection techniques use a single frequency (or a
narrow frequency bandwidth), BBEM induction techniques record data over a broad range of
frequencies and consequently have advantages over conventional techniques. The principle of
BBEM is to transmit a signal that covers a broad frequency spectrum (i.e., perhaps three
decades). The received signal resulting from a broadband transmission contains more
information, and allows detection and quantification of various wall thicknesses, as well as the
effective conductivity of the complex through-wall components of the pipe.
Tools based on BBEM techniques measure the full-wave secondary magnetic field
resulting from a transient input signal. By recording the full waveform response, it is possible
to obtain information on both the magnetic and the electrical properties of ferrous pipes. The
transient input signal generates multiple frequencies, typically 50 Hz to 50kHz. The wide
acquisition bandwidth negates the requirement for tuning or setting fixed frequencies
depending upon pipe wall thickness and composition.
Instruments for acquiring BBEM data are based on the time-domain electromagnetic
technique (TDEM), where the transient decay of the magnetic field is measured following the
interruption of current flow in the transmitter coil. The BBEM variant has been specifically
designed for the study and assessment of water supply systems.
Condition Assessment Strategies and Protocols for Water and Wastewater Utility Assets
F-25
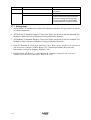
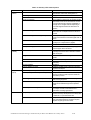
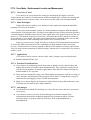
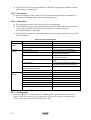
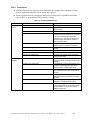
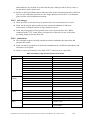
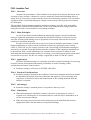
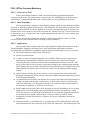
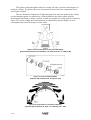
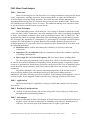
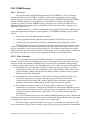
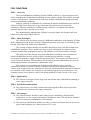
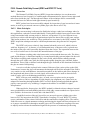
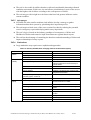
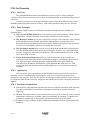
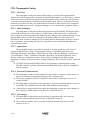
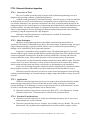
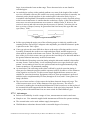
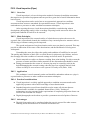
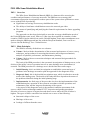
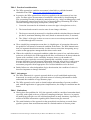
The technique can be used either internally or externally. Internal inspection requires
full-bore access. When used externally, the pipe is exposed at the site of investigation and the
BBEM tool scans the pipe outer surface. Results are reported graphically or as color contour
plots, as in shown Figure F-2.
Figure F-2. Color Contour Plot Representing Variations in Pipe Wall Thicknesses.
F8.3 Application
Broadband electromagnetic techniques can be used to assess ferrous pipe wall condition
and locate illegal tap-ins.
Tools are available for both external and internal use.
F8.4 Practical considerations
BBEM inspection tools and services are commercially available.
Practical use of this technique is reported in the literature and trade journals.
The tool gives quantifiable results in the form of contour plots.
The condition assessment (internal) probe can be winched or rodded through depressurized pipes.
F8.5 Advantages
Non-destructive condition monitoring techniques based on electromagnetic induction
principles can provide useful information to assist with pipeline replacement and
rehabilitation decisions for critical mains.
Pipe wall condition assessment is by means of an internal condition assessment probe;
this allows continuous data to be recorded along extensive lengths of pipeline.
The technique is able to survey through external coating and internal linings.
There is no upper limit on pipe diameter.
F8.6 Limitations
Use of the tool requires pipe to be depressurized during the assessment and full bore
access for internal inspections.
Internal inspection rate is reportedly only a few feet per day in large diameters.
F-26
Table F-9. Summary Broadband Electromagnetic.
Technical
selection
Criteria
Assets covered
Material type
Service Area
Access requirements
Limitations relating to asset condition
Technical
suitability
Limitations relating to asset size/geometry
Continuous/discrete
Destructive/non destructive
Interruption to supply/function
Assessment parameters
Integration with software tools
Commercialization of tool
Previous/existing use of the tool in sector
Accuracy/reliability
Ease of validation of results
Utility technical
capacity
Asset management sophistication required
Skills required (level of tool sophistication); usability
Technology required (level of tool sophistication)
Documentation
Economic factors
Availability of technical support
Cost per inspection
Resource requirements
Assessment
Water pipes.
Steel, cast iron, ductile iron.
Potable.
Internal: full bore access required;
external: exposure of pipe surface.
No limitations relating to asset condition
provided direct contact with the pipe wall is
available.
Minimum 3”.
Continuous.
Nondestructive.
Pipe must be depressurized.
Remaining wall thickness.
Fully integrated software for analysis of data.
Commercially available.
Commercial use of the tools reported in
literature and trade journals.
Quantitative assessment; but varied sensitivity
to defects.
Validation by other measurement is required,
though data collected can be recalibrated at any
time after the inspection.
Associated with high levels of asset
management sophistication.
Tool operation typically by a third party.
Specialized equipment and dedicated computer
software.
Use and development documented in the
literature.
Tool operation typically by a third party.
High cost associated with access and tool use.
Sufficient manpower to undertake enabling work
and inspection.
F8.7 Bibliography
1. Burn, L.S., Eiswirth, M., DeSilva D. and Davis P., Condition Monitoring and its Role in
Asset Planning, Pipes Wagga Wagga 2001, Charles Sturt University, Wagga Wagga,
N.S.W., 2001
2. Lillie, K., Reed, C. and Rodgers, M. A. R., 2004, Workshop on Condition Assessment
Inspection Devices for Water Transmission Mains, AwwaRF, USA, 2004
Condition Assessment Strategies and Protocols for Water and Wastewater Utility Assets
F-27
F9.0 Carbonation Testing and Petrographic Examination
F9.1 Overview
In normal high quality reinforced concrete, the steel reinforcement is chemically
protected from corrosion by the alkaline nature of the concrete. This alkalinity causes the
formation of a passive oxide layer around the steel reinforcement. However, over time the
concrete reacts with atmospheric carbon dioxide and sulfur dioxide to cause gradual
neutralization of the alkalinity from the outside surface inwards. This process is known as
carbonation and over time the concrete around the steel reinforcement is neutralized allowing it
to corrode, leading to the deterioration of the concrete through cracking and spalling.
Carbonation testing measures the depth of carbonation and can be determined using onsite or
laboratory based assessment techniques. Core samples are taken, but the technique is in
essence non-destructive.
F9.2 Main Principles
The depth of carbonation can be measured on a freshly exposed core section of
concrete by spraying with a phenolphthalein indicator spray solution. The indicator spray will
turn pink in color when the concrete is alkaline (pH ≥ 9.2). If the indicator spray remains
colorless then the concrete is found to be carbonated. The depth of carbonation exists in a more
or less even zone extending to a critical depth from the surface.
The rate at which carbonation occurs is a function of concrete quality, in particular the
water/cement ratio and compaction achieved during construction. It is generally accepted that
the rate in which carbonation occurs is inversely proportional to the square root of the age of
the structure. However, recent research suggests that the square root relationship is only
applicable for concretes which have been exposed to nominal humidity’s of 50%. As humidity
increases, the power function is found to decrease. As a result of this relationship, the
carbonation depth is found to be lower for concretes that have been continuously exposed to
higher humidity.
Assessments conducted in the laboratory such as petrographic examination, allow a
much more detailed assessment to be conducted on the concrete quality than can be undertaken
by other methods. Petrographic examination typically involves cutting a 20 mm thick slice
(plate) from a concrete core with the plate then polished to give a high quality surface that can
be examined with a microscope. The following characteristic properties of the sample are then
determined:
The size, shape and distribution of coarse and fine aggregate.
The coherence, color, and porosity of the cement paste.
The distribution, size, shape, and content of voids.
The composition of the concrete in terms of the volume proportions of coarse
aggregate, fine aggregate, paste and void.
The distribution of fine cracks and micro-cracks. Often the surface is stained with a
penetrative dye, so that these cracks can be seen. Micro-crack frequency is measured
along lines of traverse across the surface.
F-28
F9.3 Application
Carbonation testing is commonly undertaken on structures constructed from concrete
materials, to determine the existence and level of carbonation.
BS 8110 Structural use of concrete. Code of practice for design and construction
F9.4 Practical Considerations
Onsite analysis using phenolphthalein is a quick and simple method to obtain an
indication of carbonation without the need to obtain core samples.
More complex assessment techniques conducted in the laboratory require skilled
laboratory staff to prepare samples from cores for analysis and interpretation of
experimental results.
While the phenolphthalein test is a good indication the presence of free lime, it only
indicates a pH above 9, and passivation requires a pH ≥ 11.
F9.5 Advantages
•
Analysis techniques conducted onsite using phenolphthalein can, in some applications,
be undertaken without the need to take core samples.
F9.6 Limitations
A phenolphthalein test may return a positive result even if alkalinity has reduced to a
pH < 11, where passivation has been lost.
Materials that contain carbonation along micro-cracks and diffusion paths in poorly
compacted concrete may not be readily revealed by the phenolphthalein analysis
methods.
Laboratory based assessment techniques require skilled technical staff who have been
trained and have relevant experience in the preparation, analysis and interpretation of
experimental results.
Condition Assessment Strategies and Protocols for Water and Wastewater Utility Assets
F-29
Table F-10. Summary Carbonation Testing.
Technical
selection
Criteria
Assets covered
Material type
Service area
Access requirements
Limitations relating to asset condition
Limitations relating to asset size/geometry
Continuous/discrete
Destructive/non destructive
Interruption to supply/function
Technical
suitability
Assessment parameters
Integration with software tools
Commercialization of tool
Previous/existing use of the tool in sector
Accuracy/reliability
Ease of validation of results
Utility technical
capacity
Asset management sophistication required
Skills required (level of tool sophistication); usability
Technology required (level of tool sophistication)
Documentation
Availability of technical support
Economic
factors
Cost per inspection
Resource requirements
Assessment
Concrete assets in contact with air or soil. Can also
be used on dispersive soils and crushed stone
base materials.
Cementituous.
Potable and wastewater.
Direct contact with concrete surface. Surface
coatings should be removed.
No restriction.
No limitations relating to size.
Discrete readings.
A core is required to be removed.
The asset can remain in use and does not need to
be taken off-line.
Depth of carbonation in mm.
Stand alone tool.
Test methods are fully developed and are available
from a wide range of commercial vendors.
Widespread use throughout many sectors.
Qualitative or quantitative measurement of depth of
carbonation can be obtained.
Direct measurement.
Generic approach.
Easy to use by following simple procedure. Basic
training is recommended.
Low level of technological sophistication is needed
for hand held, manual tools.
AASHTO T-259 and AASHTO T-260.
BS 8110.
Technical support widely available from
distributors.
Low cost per inspection.
One operator required.
F9.7 Bibliography
1. BS 8110 Structural use of concrete. Code of practice for design and construction
2. Chemical Analysis’ article on MG Associates Construction Consultancy Ltd website.
http://www.mg-assoc.co.uk/serv04.htm Accessed 2006
F-30
F10.0 CARE-S
F10.1 Overview
CARE-S (Computer Aided Rehabilitation of Sewer and Storm Water Networks) is a
computer-based system for sewer and stormwater network management developed under a
collaborative research project supported by the European Commission under the 5th
Framework program, intended to contribute to the implementation of the key action
“sustainable management and quality of water.”
CARE-S aims to allow cost-efficient programs of maintenance, repair and rehabilitation
of sewer networks to be developed. In structure, CARE-S is a suite of PC based software tools
developed separately, and linked within a common framework by a decision support system
(DSS).
The overall rehabilitation planning process is derived from the European Standard; BS
EN 752-5:1998 “Drain and sewer systems outside buildings. Rehabilitation.” This planning
process is done within the context of an integrated catchment management approach.
F10.2 Main Principles
A CARE-S project is used as the basis of the analysis. A project is a collection of data
items, analyzes and results pertaining to an area or areas of interest, which may be geographic
(e.g., a city network) or thematic (flooding or environmental issues).
CARE-S has a central rehabilitation manager module and variations in data holdings
are handled by import/export protocols. Specific CARE-S tools are included that provide the
following functions:
1. Performance indicator management.
2. Structural condition (CCTV data classification models, sewer assessment models,
deterioration process models).
3. Hydraulic performance.
4. Rehabilitation technology information system (operational and structural
rehabilitation options).
5. Socio-economic consequences (impact of rehabilitation on socio-economic costs,
rehab impact on social life quality, public acceptance).
6. Multi-criteria decision support (choice of rehabilitation technology, selection of
priority projects, exploration of rehab programs and technologies).
The CARE-S approach can be used at a range of granularities. CARE-S is not intended
to bind together the external tools in a fixed and constraining way, but rather to allow the user
to use them individually or in a sequence appropriate to the data available for the analysis.
F10.3 Application
CARE-S is a flexible computer-based system for improving sewer and stormwater
network management. The overall rehabilitation planning process is derived
BS EN 752-5:1998 “Drain and sewer systems outside buildings. Rehabilitation”
Condition Assessment Strategies and Protocols for Water and Wastewater Utility Assets
F-31
F10.4 Practical considerations
The tools are PC based and run under the Windows operating system. While not
commercialized as yet, the CARE-S exists in prototype form. The use by third parties
should therefore be supported by some of the developers for the time being.
Several projects based on the CARE-S methodology are emerging in Europe and
Australia. These projects will serve to verify the suitability of CARE-S modules to
support management of wastewater networks, and are expected to show the pathway
towards full commercialization.
For full details on the CARE-S project and prototype tool see, http://care-s.unife.it/
and/or Saegrov (2006) (see Bibliography).
F10.5 Advantages
CARE-S has allowed the integration of tools for managing sewerage and stormwater
networks. The results can be presented by reports, in tables and graphically (GIS).
A significant effort has been made to allow companies to maintain their own data
formats, yet import them into CARE-S in the standard form required by the suit of
tools.
F10.6 Limitations
The software is still a prototype and thus in need of further development.
The adoption by water authorities is in an early stage and the practical results from
using CARE-S have not yet obtained.
Although the methodologies of CARE-S are generic and independent of worldwide
practice, there are some designs that are made in light of European practices (e.g.,
classification of CCTV inspection).
Approaches in the United States may differ from those adopted by the European
partners, which could affect relevance to the United States market.
F-32
Table F-11. Summary CARE-S.
Technical
Selection
Technical
suitability
Criteria
Assets covered
Granularity
Service area
Focus of analysis
Scalability of tool/approach
Commercialization
Previous/existing use of the tool
Ease of validation
Flexibility with respect to analysis (asset types) and
granularity (system, asset level)
Integration with other tools/GIS
Utility technical
capacity
Asset management sophistication
In-house skills required
Technology required
Documentation
Data Requirements
Linking to asset data
Availability of software and technical support
Usability
Assessment
Wastewater networks.
Spatially drainage area and below; thematic
analysis is also supported.
Wastewater.
Service levels, budget setting, environmental
impact, life cycle cost, rehabilitation planning.
Procedure and individual tools can be used by
any size company. However it should be noted
that the complete integrated package is dataintensive and has the associated cost issues.
Not commercialized.
Used during case studies for development of
tool and for succeeding projects.
Validity depends on models and data;
independent validation difficult.
Wastewater only; asset to system level.
Not integrated; but data interface (import/export)
provided.
Generic approach; intended to map onto
company specific systems. CARE-S provides a
suite of tools that compliment existing asset
management approaches.
Professional engineering skills required.
PC based.
A range of papers written on approach; help
files included in package.
Flexible, some tools can be used with limited
data, while other tools are data hungry.
Data import facilities are provided.
Software is not in a fully commercial format;
technical support is available from an
international networks of developers on a
consultancy basis.
Installation and help tools provided Support
from developers required.
F10.7 Bibliography
1. De Silva, D., Burn, S., Davis, P. and Moglia, M. Development of a Decision Support
System for Sewer Rehabilitation, Pipes Wagga Wagga 2003, Wagga Wagga, NSW,
Australia, 21–23 October 2003
2. BS EN 752-5:1998 “Drain and sewer systems outside buildings. Rehabilitation”
3. CARE-S homepage, http://care-s.unife.it/, accessed 2006
4. Saegrov, S. CARE-S – Computer Aided Rehabilitation of Sewer and Storm Water
Networks, IWA Publishing, London. 2006
Condition Assessment Strategies and Protocols for Water and Wastewater Utility Assets
F-33
F11.0 CARE-W
F11.1 Overview
CARE-W is a computer-based system for water network rehabilitation planning
developed under a collaborative research project supported by the European Commission under
the 5th Framework program. CARE-W is a suite of PC based software tools operated via a
decision support system (DSS).
F11.2 Main Principles
CARE-W is intended to enable a utility manager to manage water distribution assets in
a cost-effective manner and help to rehabilitate the right pipe at the right time, to avoid
premature rehabilitation (i.e. rehabilitation of the wrong pipe), minimize interruption of water
supply (i.e. due to unexpected pipe break), and resolve issues of poor water quality. Specific
CARE-W tools include:
1. A scenario writer for developing consistent scenarios.
2. A performance indicator tool to measure the performance of the network with a range
of key indicators.
3. A set of statistical tools to obtain probabilistic forecasts of pipe failures (bursts and
leaks).
4. An annual rehabilitation planning system that uses a multi-criterion selection and
ranking system that combines results from other CARE-W tools with additional
information supplied by the user. It provides recommendations for pipes or groups of
pipes that should be considered for rehabilitation in the short term.
5. A combined hydraulic/reliability model to analyze the loss of water supply due to
bursts and leaks.
6. A long-term planning module, which analyzes the necessary investment level in the
coming decades and how this is influenced by different rehabilitation strategies.
The CARE-W suite of tools is designed to be used together, though individual tools can
be used in isolation.
F11.3 Application
CARE-W is a PC based suite of tools to enable the effective use of water pipes,
including when to rehabilitate a pipe.
F11.4 Practical considerations
The tools are PC based and run under the Windows operating system. By the end of the
research project the tools were provided in a prototype form.
The use by third party should, until commercialization, be supported by at least one of
the developers.
Several projects based on the CARE-W methodology are emerging in Europe. These
projects also serve to verify of the suitability of CARE-W modules to support
management of drinking water networks, and are expected to show the pathway
towards full commercialization.
F-34
F11.5 Advantages
An attempt has been made to provide an integrated tool for managing water supply
networks. The results are presented by reports, in tables and in graphical/GIS format.
The methodologies of CARE-W are generic and not limited to European practices
worldwide, allowing implementation independent of location.
F11.6 Limitations
As noted above, the software is still in development and is not fully commercialized.
Adoption by water authorities is in an early stage.
Table F-12. Summary CARE-W.
Technical
selection
Technical
suitability
Criteria
Assets covered
Granularity
Service area
Focus of analysis
Scalability of tool/approach
Commercialization
Previous/existing use of the tool
Ease of validation
Flexibility with respect to analysis (asset
types) and granularity (system, asset level)
Integration with other tools/GIS
Utility technical
Capacity
Asset management sophistication
In-house skills required
Technology required
Documentation
Data Requirements
Linking to asset data
Availability of software and technical support
Usability
Assessment
Water networks.
Networks, pipe cohorts and pipe level.
Potable.
Service levels, budget setting, environmental
impact, life cycle cost, rehabilitation planning.
Scaleable; procedure and individual tools can be
used for any size company. The integrated
package is data-intensive and the cost of its use is
likely to be justified only by companies representing
more than 50.000 customers.
Not commercialized.
Used during case studies for development of tool.
Some European cities have started using the tools
for their water network management, in the first
stage to define management information needed.
Validity depends on models and data; independent
validation difficult.
Potable only; asset to system level.
Not integrated; though data interface
(import/export) provided.
Generic approach; intended to map onto company
specific systems. CARE-W provides a suite of tools
that compliment existing asset management
approaches.
Professional engineering skills required.
PC based.
A range of papers written on approach; help files
included in package.
Flexible, some tools can be used with small
amounts of data while others are data demanding.
Data import facilities are provided.
Software is not in a fully commercial format;
technical support is available from an international
network of developers on a consultancy basis.
Installation and help tools provided. Support from
developers required.
Condition Assessment Strategies and Protocols for Water and Wastewater Utility Assets
F-35
F11.7 Bibliography
CARE-W Homepage, http://care-w.unife.it/intro.html, accessed 2006
Undated papers from the CARE-W project CD reviewed include:
S Sægrov, What is CARE-W?
Algaard, E. and P. Campbell, Critical Needs for Rehabilitation Planning
P Conroy, P. Using CARE-W to manage water distribution pipes
H. Alegre; L. Tuhovcak & P. Vrbkova, Performance Management and Historical
Analysis: The Use of the CARE-W PI Tool by the Brno Waterworks Municipality
P. Eisenbeis; M. Poulton; K. Laffréchine,Technical Indicators for Rehabilitation: failure
forecast and hydraulic reliability tools
Le Gauffre, P & Laffréchine, K; Schiatti, M; Baur, R., Identifying priority projects for
annual rehabilitation planning
Hulance, J., The CARE-W Rehabilitation Scheme Developer
F-36
F12.0 CCTV Inspection
F12.1 Overview
CCTV inspection is the standard technology for the non-destructive assessment of the
internal condition of sewers and stormwater pipes and has been employed for over 20 years.
CCTV inspection is conducted by introducing a CCTV module into the pipe being inspected.
As the pipe is inspected, the operator records features of interest, which are used for condition
assessment of the pipe. This enables maintenance budgets to be allocated and provides value
by identifying problems before they become engineering and financial issues.
CCTV inspection can also be conducted on water pipes, but this use is less common.
However, CCTV is commonly used as part of water main rehabilitation processes such as in
situ lining.
F12.2 Main Principles
A typical CCTV module comprises of a color CCTV camera and lighting system
mounted on a wheeled carriage. Small modules are moved through the sewer by a winch and
pulley system. Larger pipes allow self propelled modules to be used, some with on-board
power. The larger modules all use an umbilical cord system. The umbilical cord systems
supply power, allows for communication to the control center and acts as a retrieval device
should the module become wedged in the pipe or lose power. The images captured by the
CCTV camera are sent to the control center to allow remote control of the module and for
image storage. Images are sent along coaxial or twisted pair cable in most units, with more
advanced units using optical fiber.
In most modules the CCTV camera can be panned and tilted for close up observation of
defects. The image captured from the CCTV camera is stored straight to hard drive (some
systems use DVD, or VHS tape in older systems). More advanced units such as the
PanaramoTM and Sewer Scanner and Evaluation Technology (SSET) systems have fish-eye
optics for 360° view of the pipe, coupled with digital image manipulation for an unfolded view
of the whole pipe circumference. The fish-eye lens allows a view of the whole pipe
circumference without needing to pan or tilt the camera. Condition assessment of connections
can also be made using axial/lateral inspection cameras which deploy from specially designed
modules.
Condition assessment is made by professionals, either during inspection or at a later
time using the recording. For wastewater pipelines, standards are available for qualitative and
quantitative grading of defects and a system for ‘condition grading’ commonly used on which
rehabilitation decisions can be based. A condition grade is allocated that represent the range of
conditions from “like new” to “collapsed” or “collapse imminent.” The accuracy of a condition
grading depends on an inspector’s experience.
CCTV inspection provides only an assessment of the internal surface, based on which
further inspection utilizing tools that provide specific information on the pipe wall could be
initiated.
Advances in digital imaging and computer software mean that progress is being made
in the development of automated defect recognition and defect size quantification systems. In
the future, when coupled with laser projection systems that provide quantitative data about the
pipe ovality and cross sectional area, this technology may eliminate the need for human
intervention in visual interpretation of the CCTV images.
Condition Assessment Strategies and Protocols for Water and Wastewater Utility Assets
F-37
F12.3 Application
CCTV inspection is used to view and record visual images of the internal pipe surface.
Generally CCTV inspection is used in gravity flow wastewater and stormwater pipes to
establish the condition of the asset.
CCTV is also used in water pipes to assess the condition of internal cement mortar
linings, evidence of internal corrosion in these lined pipes (corrosion shows up as staining on
the cement mortar), build up of corrosion products and other obstructions.
F12.4 Practical considerations
CCTV inspection is widely used by water authorities to inspect wastewater and
stormwater pipelines on a regular basis, for trouble shooting as well as for prioritizing
renewal and rehabilitation expenditure. CCTV services are provided by numerous
specialist contractors.
Tool access in gravity flow wastewater and stormwater systems is through maintenance
structures. Tool access in pressure pipelines requires cut-ins at regular intervals (100 m
to 500 m, depending on cable length and pipe alignment).
In some pipes, flow can potentially submerge the camera, for this reason inspection
should be performed during low flow times between midnight and 5 AM. Alternately,
sewers can be temporarily plugged to reduce the flow.
For optimum results, pipes should be flushed and cleaned prior to inspection to remove
surface encrustations and bio film layers, and expose the structure of the inner surface.
The visual image needs to be analyzed manually by an experienced operator, although
defect recognition software is being developed. The operators should be trained in order
to ensure consistency and uniformity of the inspection results. Accurate data on pipe
ovality is required.
F12.5 Advantages
Defects present above the flow surface can be located, identified and ranked by a
trained operator.
Technology is proven and widely available. Long lengths of mains can be inspected
relatively quickly (greater than 1 km/day, depending on site conditions, state of pipe
and flow conditions).
Greater coverage per day is possible with large diameter pipes when remotely operated
vehicles are used.
Systems which incorporate fish-eye technology record a full view of a pipe during a
single pass and allow full inspection to be done off-line using the recording. This
reduces the time spent in each pipe system.
F12.6 Limitations
CCTV inspection provides only an assessment of the internal surface. The results are
qualitative and require manual interpretation for analysis. The accuracy of a condition
grading depends on an inspector’s experience.
Storage of records on VHS tape is cumbersome (this is overcome by digital recording
and storage on hard drive or DVD).
F-38
Table F-13. Summary CCTV Visual Inspection.
Technical
selection
Criteria
Assets covered
Material type
Service area
Access requirements
Limitations relating to asset condition
Limitations relating to asset size/geometry
Continuous/discrete
Destructive/non destructive
Interruption to supply/function
Technical
suitability
Assessment parameters
Integration with software tools
Commercialization of tool
Previous/existing use of the tool in sector
Accuracy/reliability
Ease of validation of results
Utility technical
capacity
Asset management sophistication required
Skills required (level of tool sophistication); usability
Technology required (level of tool sophistication)
Documentation
Availability of technical support
Economic factors
Cost per inspection
Resource requirements
Assessment
Pipes; stormwater and wastewater pipeline
infrastructure, water mains, although less so.
Any pipe material.
Predominantly wastewater, but also potable.
Tool available for internal use only. Defects visually
observable. Access to tool and umbilical cord has
to be provided through manholes (wastewater) or
through cut-ins at regular intervals depending on
cord feed length and bends and obstructions on
pipeline.
No limitations relating to asset condition provided
obstructions do not impede forward movement of
camera.
Generally limited to pipes 90 mm and greater.
However axial cameras can traverse pipes down to
25mm.
Continuous recording of CCTV image on VHS tape
(analogue) or computer memory (digital).
Non-destructive.
Low flow conditions are required for gravity pipes.
Pressure pipes need to be off-line.
Visual image of pipe internal surface analyzed
manually. This can be used to allocate a condition
state for the pipe.
Software available for converting defect codes into
grades.
Commercialized, widely available.
CCTV inspection routinely used by water
authorities.
Qualitative.
Validation possible only by comparison with other
inspection techniques.
Generic approach.
Interpretation of results for consistent data requires
training. Professional skills required to utilize the
information provided.
CCTV camera and related accessories, together
with recording equipment.
Technique widely documented – generally only for
waste and stormwater though sewer inspection
codes.
Tech support for tool is widely available. Support
on analysis of results can be obtained from
specialized consulting organizations.
Varies depending on pipe size, accessibility and
purpose of survey. Can be priced on an hourly rate,
a meter rate, or a per observation rate.
Requires team to operate camera and provide
entry into pipeline. Extent of manpower required
depends on pipe type and flow levels.
Condition Assessment Strategies and Protocols for Water and Wastewater Utility Assets
F-39
F12.7 Bibliography
Dorn, R., Howsam, P., Hyde, R.A. and Jarvis, M.A. Water mains: Guidance on assessment
and inspection techniques, CIRIA Report 162, Construction Industry Research and
Information Association, London, England, 1996
Randall-Smith, M., Russell, A. and Oliphant, R, Guidance manual for the structural condition
assessment of trunk mains, WRc, UK, 1992
Ratliff, A., An overview of current and developing technologies for pipe condition assessment,
Pipelines 2003, Pipelines 2003, ASCE 2004.
F-40
F13.0 Concrete Electrical Resistance (Resistivity)
F13.1 Overview of Tool
Resistivity meters are used for measuring the electrical potential fields to evaluate the
corrosion rate of the reinforcing bars in the concrete. The influence of various concrete
components on the electrical resistance can be investigated.
The electrical resistance of the concrete is measured according to the Wenner fourpoint method. Resistivity measurements can be performed for measuring the permeability of
seal coats on concrete.
F13.2 Main Principals
The corrosion of steel in concrete is an electrochemical process which generates a flow
of current and can dissolve metals. The lower the electrical resistance, the more readily the
corrosion current flows through the concrete and the greater is the probability of corrosion.
Measurements of resistivity of concrete can provide an indication of the presence, and possible
amount, of moisture in a concrete structure and therefore evaluate the extent and rate of
corrosion of reinforcement indirectly.
Equipment consists of a resistivity probe with integrated electronics for resistivity
measurement by the four-point method, a control plate for resistance probe and a display unit.
F13.3 Applications
Resistivity meters can be used to investigate the influence of various concrete
components on the electrical resistance of reinforcement. Resistivity meters are used in
conjunction with corrosion analyzing instrument to evaluate the corrosion rate of the
reinforcing bars in the concrete.
•
There are no specific standards for concrete electrical resistance; however ASTM D257, ANSI/ESD STM11.11, and ANSI/ESD STM11.2 cover resistivity meters which
are specifically suited to the manufacturing industry and are used for making surface
and volume resistivity measurements.
F13.4 Practical Considerations
Before taking resistivity measurements the reinforcement grid is marked out and
electrical resistance measurements are taken between the bars to minimize the effect of
the reinforcement.
The results should be taken in the concrete’s natural state i.e. natural moisture content.
This value can be used to adjust the permeability measurements made using
permeability testing techniques. After completing permeability testing an additional
resistivity test can give the saturated (worst case) resistivity of the concrete.
F13.5 Advantages
•
Resistivity meters provide immediate on-site measurement of concrete resistivity.
F13.6 Limitations
Resistivity measurements are sensitive to the type of reinforcement, so assessment of
the condition of a structure and the likelihood of corrosion needs to be made with
careful reference to its construction.
Condition Assessment Strategies and Protocols for Water and Wastewater Utility Assets
F-41
Testing often requires that at least two holes in the order of 6.5mm to a depth of
approximately 10mm are drilled in order to insert probes.
Table F-14. Summary Concrete Electrical Resistance (Resistivity).
Technical Selection
Criteria
Assets covered
Material type
Service area
Access requirements
Limitations relating to asset condition
Limitations relating to asset size/geometry
Continuous/discrete
Destructive/non destructive
Interruption to supply/function
Suitability
Assessment parameters
Integration with software tools
Commercialization of tool
Previous/existing use of the tool in sector
Accuracy/reliability
Ease of validation of results
Utility technical
capacity
Asset management sophistication required
Skills required (level of tool sophistication);
usability
Technology required (level of tool sophistication)
Documentation
Economic factors
F-42
Availability of technical support
Cost per inspection
Resource requirements
Assessment
Reinforced concrete structures such as tanks,
pipes, walls, dams, buildings, channels, weirs.
Reinforced concrete.
Potable and wastewater.
Direct contact with surface of asset. If asset is
buried, it must be exposed.
Concrete surface must be fairly level.
No limitations relating to size of concrete
element. Surface must be flat.
Continuous reading.
Almost entirely non destructive, small drill holes
may be required for certain tests.
The asset can remain in use and does not need
to be taken off-line unless internal (water side)
surfaces need to be assessed.
Corrosion rate of reinforcement bars in
concrete.
Stand alone.
Equipment is fully developed, available from
selected commercial vendors.
Widespread use internationally on bridges and
road infrastructure. Limited application in the
water industry.
Quantitative measurement.
Results are indicative and can be validated by
using two other testing techniques: rebar linear
polarization resistance and rebar electrical
potential.
Generic approach.
Relatively easy to use by following simple
procedure. Trained staff can take
measurements.
Low level of sophistication.
No specific standards, although tool is well
documented by distributors. ASTM D-257,
ANSI/ESD STM11.11, and ANSI/ESD STM11.2
cover resistivity meters which are specifically
suited to the manufacturing industry and are
used for making surface and volume resistivity
measurements.
Technical support available from distributors.
Low cost per inspection.
One operator required. Battery powered. Probe
array, low frequency constant magnitude
alternating current drive to probes and LCD
display. The probes come in many types for
embedding in new infrastructure, retrofitting to
existing infrastructure, and a surface probe for
more impromptu inspection.
F13.7 Bibliography
ASTM D-257 Standard Test Methods for DC Resistance or Conductance of Insulating
Materials
ANSI/ESD STM11.11:2001—Surface resistance measurement of static dissipative planar
materials
ANSI/ESD STM11.2:2000—Volume resistance measurement of static dissipative planar
materials
Condition Assessment Strategies and Protocols for Water and Wastewater Utility Assets
F-43
F14.0 Condition Assessment of Plastic Pipes
F14.1 Overview
Assessing the condition of plastics pipelines requires different approaches to those used
for cementituous and ferrous pipelines. This is because the degradation of plastics pipes with
time is completely different from that of these other materials. The difficulty in assessing the
condition of plastics pipes arises because they do not lose material from the pipe wall. Instead,
fracture in plastic pipes occurs by crack initiation from defects either inherent in the pipe wall
or damage sites at the pipe outer surface.
Non-destructive condition assessment for plastic pipes requires that sub-critical crack
growth through the pipe wall be detected before ultimate fracture failure occurs. Currently no
non-destructive techniques are available to locate cracks in plastic pipes before failure occurs.
However, destructive condition assessment techniques can be used to assess the level of
resistance to this kind of failure.
F14.2 Main Principles
Failure of plastic pipes occurs by crack growth through the pipe wall. Depending on
conditions and material, this can result in failure by short cracks that grow slowly through the
pipe wall (the ‘leak before break’ scenario) or by brittle failure, where a whole pipe length can
be completely fractured.
Currently, no non-destructive techniques are available to detect this type of sub-critical
damage. However, several condition assessment techniques are available that use samples
extracted from the pipe to measure important fracture properties. Although such tests are
destructive and do not indicate the extent of sub-critical crack growth in the pipe wall, they do
indicate how well the pipe material would resist such damage should it be initiated. Condition
assessment techniques that can be used in this context are fracture toughness testing, gelation
testing and slow crack growth resistance testing; see reviews of these techniques for more
information.
The remaining service life of a specific asset can only be estimated based on the
expected size of inherent defects in the pipe wall and damage at the pipe outer surface. Such
estimates of inherent defects and damage size can be made from microscopic examination of
similar pipes that have previously failed by fracture in service. Extensive experimental fracture
property data has been published in the literature, which indicates the expected material
properties (strength etc) for well-manufactured and poorly manufactured plastic pipes.
Comparing measured values from pipe samples with this published data may indicate an
inferior section of pipe.
Material quality data can be used in conjunction with known service conditions to
predict the likely remaining life of pipes in a population of assets. Stochastic models can be
utilized in this analysis.
F14.3 Application
The current techniques used to assess plastic pipes are only able to assess the quality of
plastic pipes. The lifetime of a plastic pipe is dependant on a number of factors, such as
pressure and external loads, which can be measured, and on defect size, which cannot. As
defect size can only be measured after failure the remaining life predictions can only be applied
to a batch of assets using stochastic allocation of defect size and not to a specific asset.
F-44
F14.4 Practical considerations
The material properties of a plastic pipe sample will give a quantitative assessment of
physical parameters, but can only be used to give a qualitative indication of its
likelihood of failure. An assessment of failed plastic pipes can be conducted to assess
the quality of pipes that have already been exhumed.
For reactive assets (such as distribution mains), statistical analysis of failure data
provides a more practical approach to the identification of problem assets.
F14.5 Advantages
•
Condition assessment of samples from important assets could provide information that
would prevent an expensive and unforeseen failure.
F14.6 Limitations
Condition assessment of plastic pipes is currently very difficult, as no techniques are
available to give the remaining service life of an individual pipe.
Approaches available are destructive and can only give a relative measure of pipe
quality; for example, material properties of the sample in comparison to industry
benchmarks.
Gathering field samples for testing will cause a disruption to service while taking such
samples.
Table F-15. Summary Condition Assessment of Plastic Pipes.
Technical
selection
Technical
suitability
Utility technical
capacity
Economic factors
Criteria
Assets covered
Material type
Service area
Access requirements
Limitations relating to asset condition
Limitations relating to asset size/geometry
Continuous/discrete
Destructive/non destructive
Interruption to supply/function
Assessment parameters
Integration with software tools
Commercialization of tool
Previous/existing use of the tool in sector
Accuracy/reliability
Ease of validation of results
Asset management sophistication required
Skills required (level of tool sophistication); usability
Technology required (level of tool sophistication)
Documentation
Availability of technical support
Cost per inspection
Resource requirements
Assessment
Pipes.
Plastic.
Potable and wastewater.
Pipe samples must be exhumed for testing.
None.
None.
Discrete.
Currently all plastic assessment tests are
destructive.
Pipes must be exhumed for testing.
Material properties of pipe sample.
N/A
Tests are conducted to Standards; see specific
test review for details.
see specific test review for details.
Relative measure of pipe ‘quality’.
Direct measurements.
Could be used by any utility.
Specialized test house.
Specialized test house.
See specific test review for details.
See specific test review for details.
See specific test review for details.
See specific test review for details.
Condition Assessment Strategies and Protocols for Water and Wastewater Utility Assets
F-45
F14.7 Bibliography
References for the tools used for the condition plastic pipe can be found in their reviews:
Fracture Toughness C-Ring Testing
DSC Gelation Assessment
Methylene Chloride Gelation Assessment
Slow Crack Growth Resistance
F-46
F15.0 Core/Coupon Sampling
F15.1 Overview of Inspection Tool
Core/coupon sampling is a method for obtaining small samples on which to conduct
testing. The samples obtained by this method are small enough so that pipes can be repaired
using repair clamps. As such, while it is not destructive to the pipe, it does require repair work
to be conducted.
F15.2 Main Principles
Core/coupon sampling is conducted when a test is to be carried out that requires only a
small piece of the asset or asset material. Sampling can be conducted on any pipe type and
material with the exception of vitrified clay pipes due to its brittle nature.
If the required sample size is such that its removal can be repaired by normal repair
techniques, such as clamping, the pipe is exposed, the sample cut from the pipe wall, and the
pipe then repaired. If the sample size required is too large to allow clamping type repairs, cutout sampling may be required (see Cut-out Sampling review).
Core and coupon sampling are similar with the exception that core samples are
generally removed using a drill (cylindrical through wall sample), while coupons are cut from
the wall and can be any size without being fully circumferential. These samples can be used for
phenolphthalein testing, carbonation testing, pit depth measurement and other tests depending
on the pipe material.
F15.3 Application
Core/coupon sampling is used to obtain a sample from the wall of any pipe type. The
core/coupon removed can then be tested using techniques appropriate to the material. Core
sampling can also be undertaken on civil assets.
No standards are available to which reference this technique.
F15.4 Practical considerations
Core/coupon sampling is widely used and simple to conduct.
Often core/coupon samples can be obtained during normal work practice, such as when
a new connection is made to a water pipe; the section removed can be used as a core
sample.
F15.5 Advantages
Samples can be obtained without removing a section of pipe and so does not require
extensive repair work.
Core/coupon samples can be obtained during normal work practice.
In the case of core samples, samples can be obtained from water pressure pipes without
interrupting service using under pressure tapping techniques.
F15.6 Limitations
Samples taken can only be used for a limited range of tests.
Due to small sample size, samples may not be representative of the entire pipe
circumference nor the condition along the pipeline.
Condition Assessment Strategies and Protocols for Water and Wastewater Utility Assets
F-47
Table F-16. Summary Core/Coupon Sampling.
Technical
selection
Criteria
Assets covered
Material type
Service area
Access requirements
Limitations relating to asset condition
Limitations relating to asset size/geometry
Continuous/discrete
Destructive/non destructive
Interruption to supply/function
Technical
suitability
Utility technical
capacity
Economic factors
F-48
Assessment parameters
Integration with software tools
Commercialization of tool
Previous/existing use of the tool in sector
Accuracy/reliability
Ease of validation of results
Asset management sophistication required
Skills required (level of tool sophistication); usability
Technology required (level of tool sophistication)
Documentation
Availability of technical support
Cost per inspection
Resource requirements
Assessment
Pipes and civil assets.
All except VC.
Potable and wastewater.
Access to pipe surface is required and access
for tapping machine.
If pipe in poor condition, may not be suitable to
take coupon, this could induce a stress
concentrator.
None.
Discrete.
Sampling technique, not destructive to pipe but
does require repair work to be conducted.
Pressure pipes must be taken off-line before
sampling, unless sample (tapping) can be made
under-pressure.
N/A
None.
Contractor services could be used.
Industry collects coupons but these are
underutilized for analysis.
N/A
Direct measurements.
Generic approach.
Sample as required for installing pipe
connections and basic repairs.
Low.
WSAA under pressure tapping code.
N/A
Varies with the size of coupon and pipe.
Crew as required for installing pipe connections
and basic repairs.
F16.0 Corrosion Burial Testing
F16.1 Overview
Corrosion of metals in disturbed soils, such as occurs when pipes are laid in trenches, is
complex and not fully understood. Burial testing is used to give an indication of soil corrosivity
assessed over time, rather than as a snap shot as is obtained from most test methods.
This type of testing is conducted by burying multiple samples near a pipeline, which are
then exhumed incrementally over several years to give an indication of soil corrosivity that
takes into account the seasonal and other variations that the pipe is subject to. This method
allows corrosion measurements to be undertaken without destructive sampling from the
pipeline of interest.
F16.2 Main Principles
While tests such as soil resistivity (see Soil (electrical) Resistivity review) and pH are
useful for indicating the corrosivity of a soil, they do not capture the variation in corrosivity to
which a pipeline is exposed over time. In order to determine the corrosivity of a soil taking into
account these variations, burial testing can be used in which multiple samples are exposed to
the same corrosive environment as the pipe over extended time periods.
Burial testing is conducted for metallic pipes, generally ferrous materials, by burying
several samples of the same material as the pipeline. The samples are then exhumed over time
and examined to assess the level of corrosion.
By comparing samples exhumed over multiple years, an indication of corrosion and
pitting rates can be obtained. It should be noted that due to differences in geometry these
samples only indicate corrosion rate and do no give the actual corrosion the pipe is subject to at
its outer surface.
F16.3 Application
Burial testing is conducted to obtain an understanding of soil corrosivity over time,
rather than a ‘snapshot’ measurement technique. This testing can be conducted for any asset
type, however is generally limited to ferrous assets without protective coatings.
F16.4 Practical considerations
The samples should be buried near to and at a similar depth as the pipeline in an effort
to ensure that environmental conditions of the samples are as similar as possible to
those of the pipeline.
If the pipeline of interest includes welds, then the test samples should also include
welds so that the samples are representative of the pipeline.
When multiple samples are to be exhumed at the same time, they should be connected
with a polymeric rope to aid location.
F16.5 Advantages
As testing takes place in real time under real conditions, the results represent corrosion
conditions more accurately than tests which only provide a ‘snapshot’ of soil
conditions.
Condition Assessment Strategies and Protocols for Water and Wastewater Utility Assets
F-49
F16.6 Limitations
In the vast majority of pipelines where corrosion is causing problems, the nature of the
corrosion damage is not uniform along the pipeline. Often this is also true along a
single pipe length, limiting the value of results obtained from burial samples.
Corrosion burial testing needs to be planned prior to installation of the pipe for optimal
results.
As there are geometrical, time and location variations between the burial sample and
the actual pipe, results from the sample may not represent the actual corrosion rate at
the pipe outer surface.
Burial testing is a long term test method where results are obtained over many years;
samples need to be buried for extended periods before useable results can be obtained.
Table F-17. Summary Corrosion Burial Testing.
Technical
selection
Technical
suitability
Utility technical
capacity
Economic factors
Criteria
Assets covered
Material type
Service area
Access requirements
Limitations relating to asset condition
Limitations relating to asset size/geometry
Continuous/discrete
Destructive/non destructive
Interruption to supply/function
Assessment parameters
Integration with software tools
Commercialization of tool
Previous/existing use of the tool in sector
Accuracy/reliability
Ease of validation of results
Asset management sophistication required
Skills required (level of tool sophistication); usability
Technology required (level of tool sophistication)
Documentation
Availability of technical support
Cost per inspection
Resource requirements
Assessment
Pipe.
Generally ferrous.
Potable and wastewater.
None.
None.
Generally applicable to large diameter mains,
but no inherent restrictions.
Discrete.
Non-destructive.
Asset on-line.
Corrosivity of the soil environment.
None.
N/A
Not a common practice in the water sector.
Relative assessment.
Validation through assessment of pipe.
Generic approach.
Skills associated with evaluation of test piece;
depends on technique used.
Low.
N/A
N/A
Depends on technique used.
Samples must be exhumed.
F16.7 Bibliography
1. Korb, L., Olsom, D., Davis, J., Destefani, J., Frissell, H., Crankovic, G., Jenkins, D.,
Stedfeld, R., Mills, K., Johnson, J., Kiepura, R. and Humphries, D. Metals Handbook, 9th
edition Volume 13 – Corrosion, ASM International, United States of America, 1987
F-50
F17.0 Cover Meter - Reinforcement Location and Measurement
F17.1 Overview of Tool
Cover meters are a non-destructive means for determining the depth to concrete
reinforcement, the location of reinforcement at different depths up to 360mm, bar spacing and
anchor setting points in concrete assets. Cover meters use the eddy current testing method.
F17.2 Main Principles
Along with concrete quality, cover thickness is the single most important durability
parameter for concrete structures.
In the pulse current method, a pulse of current transmits a magnetic field through the
reinforcement. Following the pulse, an eddy current induced in the reinforcement bar produces
a second magnetic field that creates a decay time signal in the coils proportional to the bar size
and cover. Coils housed in the cover meter tool’s measuring head can be tuned for sensitivity
to bar spacing or cover depth. The pulse current method can be combined with a scan car that
measures the position of the measuring head relative to the concrete surface.
Some cover meters have a built-in facility to measure half-cell potential measurements
as well as the Eddy current method. The combination of both methods results in accurate
surveys of reinforcement in concrete structures. BS1881:242 stipulates accuracy requirements
for cover meters when measuring in different ranges. Advanced cover meters have an accuracy
within ±1 mm.
F17.3 Application
Cover meters can be used on concrete slabs, walls, columns, pipes and spiral mesh.
British Standard BS1881:242
F17.4 Practical Considerations
Cover meters are sophisticated tools that come in digital versions, and calculate and
display the location of reinforcement instantaneously. Their operation is menu driven
with on-screen guidance. Generally logged data is date and time stamped. Results are
downloadable to PC or printer.
Some tools are designed for large scale and detailed investigations, and have a range of
cover functions incorporated in their program. These allow a comprehensive range of
characteristics and logging of up to 30,000 measurements.
Many cover meters display the location of reinforcement in large black characters on a
LCD that can be backlit in poor light conditions.
F17.5 Advantages
Non-destructive methods for checking cover have become faster and more accurate in
recent years.
Cover meters are more accurate for determining the penetration depth of the
carbonation front than the traditional method of dye penetration where a freshly
fractured surface is sprayed with a pH indicator, such as phenolphthalein or
thymolphtalein.
Condition Assessment Strategies and Protocols for Water and Wastewater Utility Assets
F-51
F17.6 Limitations
Cover meters lose accuracy at greater depths. Even ‘long range’ cover meters can only
be relied upon to detect rather than measure bars at depths between 250 and 300mm;
and this is subject to bar size.
Table F-18. Summary Cover Meter – Reinforcement Location and Measurement.
Technical
selection
Criteria
Assets covered
Material
Service area
Access requirements
Limitations relating to asset condition
Limitations relating to asset size/geometry
Continuous/discrete
Destructive/non destructive
Interruption to supply/function
Technical
suitability
Assessment parameters
Integration with software tools
Commercialization of tool
Previous/existing use of the tool in sector
Accuracy/reliability
Ease of validation of results
Utility technical
capacity
Asset management sophistication required
Skills required (level of tool sophistication);
usability
Technology required (level of tool
sophistication)
Documentation
Economic
factors
Availability of technical support
Cost per inspection
Resource requirements
Assessment
Concrete elements such as slabs, beams, columns,
walls, pavements, tunnels, pipes and dams.
Reinforced concrete.
Potable or wastewater.
Direct contact with asset.
No limitations relating to asset condition.
No limitations relating to size/geometry: the maximum
thickness of concrete which can be tested is 300mm.
Cover meters measures to over 250mm depth and
detect to over 300mm, subject to bar size.
Continuous readings in time and space.
Non-destructive.
The asset can remain in use; needs to be taken off-line
only if an internal surface is required to be accessed.
Cover depth to reinforcement, location of reinforcement
at different depths up to 360mm, bar spacing and
anchor setting points.
Can be integrated with software tools.
Equipment is widely available from selected commercial
vendors.
Widespread use in the water and other sectors, and
acceptable to stakeholders.
Advanced cover meters have an accuracy within ±1mm.
Results can be validated. Some cover meters have a
built-in facility to measure half-cell potential
measurements as well as the Eddy current method. The
combination of using both methods results in accurate
surveys of reinforcement in concrete structures.
Generic approach.
Easy to use by following simple procedure.
Measurements can be taken by unqualified staff.
Cover meters are sophisticated tools which come in
digital versions which calculate and display the location
of reinforcement instantaneously.
Cover meters are thoroughly documented British
Standard BS1881:242.
Technical support widely available.
Low cost per inspection.
One operator required. Battery powered. Resources
required can also depend on asset being inspected.
Buried assets need to be exposed.
F17.7 Bibliography
1. BS 1881 Part 204:1988: Recommendations on the Use of Electromagnetic Covermeters.
2. BS1881:242 British Standard 1881
F-52
F18.0 Crack Measurement Tools
F18.1 Overview of Tools
Cracks in concrete structures can be measured with a range of tools. Crack
measurement tools and their corresponding measuring ranges and accuracies are listed below.
F18.2 Main Principals
Deformation Meters: Deformation Meters are used for measuring linear deformations,
cracks, settlements and shrinkage coefficients. Two base plates are attached to the concrete to
give fixed reference points approximately 300 mm apart. The gauge is then used to accurately
measure the change in length as the structure ages. Deformation meters can have a measuring
length of 300 mm. They are two versions of dial gauges: analog 5 mm x 0.001 mm and digital
25 mm x 0.001 mm. The meters include a setting and calibration bar, base plates and adhesive.
Measuring Magnifier: The measuring magnifier typically has a magnification of 8×.
Crack widths are normally limited to 0.2mm or 0.3mm in concrete structures. This crack width
measuring device enables accurate determination of whether cracks exceed this limit.
Crack Width Meter: The crack width meter is used as a comparator to give an
approximate crack size during visual surveys. Combined with 10 reduction scale rules.
Crack Monitor: The crack monitor is used on structures where the rotation at cracks is
also significant. The crack monitor gauge is specifically designed to measure rotation,
transverse and longitudinal movement. Special fittings are available to measure external and
internal corners.
F18.3 Application
Crack measurement tools can be applied to a wide range of substrates including steel.
They are most commonly used on concrete structures.
ASTM E1457-00 Standard Test Method for Measurement of Creep Crack Growth
Rates in Metals
F18.4 Practical Considerations
Crack measurement tools are widely used for the condition assessment of concrete
structures and can be purchased for a number of commercial suppliers. The tools are
easy to use and often handheld.
When measuring crack widths with deformation meters, it is important to measure
across the crack and across adjacent intact concrete so that adjustment to the crack
width movement can be made.
Table F-19 gives a summary of the tools.
Table 19. Summary of Tools.
CRACK MEASUREMENT TOOL
ACCURACY/ MEASURING RANGE
Deformation meter
Measuring magnifier
Crack width meter
Crack monitor
Accuracy ± 0.001mm.
Magnification 8x Measuring range 15 mm x 0.05 mm. Accuracy ± 0.05mm.
Graduations from 0.05 – 5 mm.
Measuring scale for horizontal and vertical measurements: horizontal ± 25
mm and vertical ±10 mm.
Reading accuracy of ±1mm on grid and ± 0.1 mm with a caliper.
Condition Assessment Strategies and Protocols for Water and Wastewater Utility Assets
F-53
F18.5 Advantages
Crack measurement tools are accurate, reliable, non-destructive, easy to use, relatively
inexpensive and very portable.
F18.6 Limitations
Results are likely to vary according to changes in parameters such as the water level in
concrete tanks and temperature of concrete due to exposure to sunlight and seasonal
variation.
Table F-20. Summary Crack Measurement Tools.
Technical
selection
Criteria
Assets covered
Material type
Service area
Access requirements
Limitations relating to asset condition
Limitations relating to asset size/geometry
Continuous/discrete
Destructive/non destructive
Interruption to supply/function
Technical
suitability
Assessment parameters
Integration with software tools
Commercialization of tool
Utility
technical
capacity
Previous/existing use of the tool in sector
Accuracy/reliability
Ease of validation of results
Asset management sophistication required
Skills required (level of tool sophistication);
usability
Economic
factors
Technology required (level of tool sophistication)
Documentation
Availability of technical support
Cost per inspection
Resource requirements
Assessment
Reinforced concrete structures such as dams, walls tanks,
large pipes, buildings, etc.
Most commonly used on reinforced concrete.
Potable or wastewater.
Direct contact with surface of asset. If asset is buried then
it must be exposed.
Generally no restriction. However surface may need
cleaning in order to accurately locate edges of cracks.
No limitations relating to size of concrete element.
Discreet readings.
Non-destructive.
The asset can remain in use and does not need to be
taken off-line.
Crack width. Rotational, transverse and longitudinal
movements at any point on a structure where there is
crack movement can also be measured.
The majority of tools are stand alone.
Equipment is fully developed, available from a wide range
of commercial vendors and can be used off the shelf.
Widespread use internationally in the water industry.
Quantitative.
Direct measurement easily validated.
Generic approach.
Relatively easy to use by following simple procedure.
Crack measurement tools do not require specialist
knowledge or training.
Range from low to moderate level of sophistication.
ASTM E1457-00.
Technical support widely available from distributors.
Low cost per inspection.
One operator required.
F18.7 Bibliography
1. ASTM E1457-00 Standard Test Method for Measurement of Creep Crack Growth Rates in
Metals
F-54
F19.0 Current Monitoring
F19.1 Overview
Current monitoring is a non-destructive on-line condition assessment method that can
be used on assets that contain electric motors. By monitoring variations in current flow the
onset of electrical faults can be identified before equipment breakdown occurs. Current
monitoring analysis can be used to detect electric motor problems such as broken rotor bars,
broken/cracked end rings, flow or machine restriction and machinery misalignment.
F19.2 Main Principles
This technique involves monitoring the current flowing through one of the power leads
located at the motor control center or starter, typically by using a clamp-on ammeter. By
measuring the electrical current variations and trending the recorded data over time, changes in
the equipment operating conditions and performance can be monitored and compared to the
design loads recorded during commissioning. The data can then be used for determining the
onset of electrical faults or equipment breakdown.
The clamp-on ammeter (also known as Tong Tester) measures current by the strength
of the magnetic field around it rather than by becoming part of the circuit. One modern method
uses a small magnetic field detector device called a Hall-effect sensor. Hall-effect devices
produce a very low signal level and thus require amplification.
The clamp on ammeter makes for quick and safe current measurements, because there
is no conductive contact between the meter and the circuit.
F19.3 Application
The technique of current monitoring can be used on electrical induction motors,
synchronous motors, compressors, pumps and motor operated valves, to determine changes in
the level of performance that occur over time and enable repair or replacement prior to
electrical faults or equipment breakdowns occurring.
There is no specific standard for test method.
F19.4 Practical Considerations
Current monitoring is a technique widely used for condition monitoring and can be
easily undertaken on all electrical motors by a trained electrical technician or engineer
using a hand held testing apparatus.
Clamp-on ammeters are widely available from numerous suppliers; older units can only
be used on AC equipment while newer equipment can measure both AC and DC. The
older probe consists of a core of ferromagnetic material, which when closed forms the
core of a transformer of which the wiring passing through the clamp is the primary
winding.
The least expensive clamp on ammeters use an average-detecting rectifier circuit that is
then calibrated to read in RMS units; it is assumed in their design that the current is a
sine wave of the local mains frequency, that is, either 50 or 60 Hz. When such meters
are used with non-sinusoidal loads such as electronic equipment, the readings produced
can be quite inaccurate. Meters that use true-RMS converters give accurate readings in
almost any situation.
Hall-effect sensor gives accurate readings over a wider frequency range from DC to
thousands of hertz.
Condition Assessment Strategies and Protocols for Water and Wastewater Utility Assets
F-55
The sensitivity of portable clamp-on ammeters is often dependant on cost, however
most units can measure current flow with high accuracy.
F19.5 Advantages
Monitoring can be undertaken with the equipment on-line with minimal disruption.
Routine current monitoring enables determination of equipment electrical faults prior to
failure.
F19.6 Limitations
Trained electrical technicians are required to undertake assessment, as equipment must
be under load to enable for reliable results.
While the results obtained typically indicate that a possible problem is present, further
analysis required to identify the exact equipment or component fault.
Table F-21. Summary Current Monitoring.
Technical
selection
Technical
suitability
Utility technical
capacity
Economic factors
Criteria
Assets covered
Material type
Service area
Access requirements
Limitations relating to asset condition
Limitations relating to asset size/geometry
Continuous/discrete
Destructive/non destructive
Interruption to supply/function
Assessment parameters
Integration with software tools
Commercialization of tool
Previous/existing use of the tool in sector
Accuracy/reliability
Ease of validation of results
Asset management sophistication required
Skills required (level of tool sophistication); usability
Technology required (level of tool sophistication)
Documentation
Availability of technical support
Cost per inspection
Resource requirements
Assessment
Any electrical load.
N/A
Potable or wastewater.
None.
None.
None.
Continuous in time.
Non-destructive.
Must be on-line with suitable precautions taken
against operator direct contact with live parts.
Current.
Stand alone.
Fully developed and off the shelf.
Standard industry practice.
Quantitative.
Direct measurement.
Generic approach.
Electrician will already be trained to use.
N/A
Well documented.
N/A
Low cost per inspection.
Low; one person no more than a few minutes
per load.
F19.7 Bibliography
1. Weschler instruments, http://www.weschler.com, accessed 2006
F-56
F20.0 Cut-out Sampling
F20.1 Overview
Cut-out sampling is a method for obtaining a short pipe ring sample on which a range
of tests can be undertaken. It is a destructive technique that can be applied to pipes of any
material, but is more generally used on smaller diameters.
F20.2 Main Principles
Cut-out sampling is conducted when a pipe asset is to be assessed with a test that
requires only a small section of the asset. The length of pipe removed is dependant on the test
to be conducted. Sampling can be conducted on any pipe type and material; however it is
unlikely to be conducted on vitrified clay pipes due to its brittle nature.
If the sample required is not a ring sample and is small enough so that the area could be
repaired using a clamp type repair, then core/coupon sample may be a better option (see
Core/Coupon Sampling review).
Samples obtained can be used in compressive strength testing, pit depth measurement,
fracture toughness testing and other tests depending on the pipe material.
F20.3 Application
Cut-out sampling is used to obtain a short pipe length for testing from the wall of any
pipe type. The cut-out removed can then be tested to assess the pipe it was removed from. It is
more generally used for assessment of water distribution pipes, but could be applied to
wastewater pipes. No Standards are available to which reference this technique.
F20.4 Practical considerations
Cut-out sampling is widely used and simple to conduct.
When obtaining samples from wastewater pipes the emptying of the pipelines and
storage of sewage during sampling are important considerations.
F20.5 Advantages
Samples can be obtained without removing a full pipe length section of pipe, thereby
minimizing repair work.
Most condition assessment tests can be conducted on cut-out samples.
F20.6 Limitations
The sample obtained may not be representative of the condition along the pipeline
entire pipe.
Pipes must be taken out of service and pressure pipes emptied to allow sampling.
Condition Assessment Strategies and Protocols for Water and Wastewater Utility Assets
F-57
Table F-22. Summary Cut-out Sampling.
Technical
selection
Criteria
Assets covered
Material type
Service area
Access requirements
Limitations relating to asset condition
Limitations relating to asset size/geometry
Continuous/discrete
Destructive/non destructive
Technical
suitability
Utility technical
capacity
Economic factors
F-58
Interruption to supply/function
Assessment parameters
Integration with software tools
Commercialization of tool
Previous/existing use of the tool in sector
Accuracy/reliability
Ease of validation of results
Asset management sophistication required
Skills required (level of tool sophistication);
usability
Technology required (level of tool
sophistication)
Documentation
Availability of technical support
Cost per inspection
Resource requirements
Assessment
Pipes.
All.
Generally potable.
Access to pipe surface is required. Pipeline to
be depressurized.
None.
None.
Discrete.
Sampling technique, which requires repair work
to be conducted. Destructive.
Pipes must be taken off-line.
N/A
None.
N/A
Technique has been widely used in industry.
Direct measurement.
N/A
Generic approach.
Sample as required for conducting pipe repairs.
Low.
N/A
N/A
Varies dependant on location, size, type, etc.
Crew as required for conducting pipe repairs.
F21.0 Drop Test
F21.1 Overview
Water loss control programs are widely used throughout the water industry (see Leak
Detection review). Drop tests are a simple non-destructive method for identifying areas of a
network containing significant leakage.
A drop test can be undertaken for individual pipelines both new (at the time of
installation) and old, small pipe network areas and larger areas. Drop tests work by isolating
the area of interest and observing either the level of water in a reservoir or water pressure. Loss
of water head/height (beyond normal use if all connections cannot be closed) indicates that
either the pipe(s) or valve(s) are leaking. Similar testing has also been used to measure
exfiltration in sewers.
Leak detection gives both an indication of condition and performance of the asset,
depending upon the amount of leakage on a section of pipe. However, it does not give detail
regarding the overall condition of the pipe.
F21.2 Main Principles
The drop test involves isolating a section of pipe or pipe network and observing
whether water is lost during the test. If the upper end of the pipeline is fed by a reservoir, as in
a gravity-fed system, the level in the reservoir can be monitored. If this level drops during the
test, the level of leakage can be determined by calculating the volume lost from the reservoir.
If the pipeline is not fed by a reservoir, leakage can be identified by monitoring the
pressure associated with the falling water level in the pipeline. When the section has been
isolated, a pressure monitor fitted below the uppermost water level will enable any drop in the
level of the water to be detected.
F21.3 Application
Drop tests are generally applied to detect leakage in large diameter transmission mains,
or area of a network. They can also be applied to sewerage assets to assess exfiltration.
There are no known Standards which reference drop testing.
Practical considerations
As a general approach to assessing water tightness, drop testing can be undertaken by
any utility. The simple nature of the test has let it to be widely used in the water and
other industry sectors. It has been used in the U.K. water sector as a low technology
approach to assessing leaks in transmission mains. It has also been used in research to
assess the level of exfiltration from sewers.
The accuracy of drop testing is limited by the type of method used to assess leakage
(level or pressure drop) and the size of the area being tested.
Advantages
Low tech approach for assessing leakage within pipelines. This technique can also be
applied to pipe sections.
The drop test can be used to gain a quantitative measure of leakage for a pipe or area of
the network.
Condition Assessment Strategies and Protocols for Water and Wastewater Utility Assets
F-59
F21.4 Limitations
The time involved in isolating pipe sections and monitoring the reservoir makes this
method impractical except on an annual basis.
Only the presence of leaks is indicated, no indication is given of location. Leaks can be
associated with the down stream valve.
The drop test requires assets to be taken off-line.
The test does not give detail regarding the overall condition of the pipe.
Table F-23. Summary Drop Test.
Technical
selection
Technical
suitability
Criteria
Assets covered
Material type
Service area
Access requirements
Limitations relating to asset condition
Limitations relating to asset size/geometry
Continuous/discrete
Destructive/non destructive
Interruption to supply/function
Assessment parameters
Integration with software tools
Commercialization of tool
Previous/existing use of the tool in sector
Utility technical
capacity
Economic factors
F-60
Accuracy/reliability
Ease of validation of results
Asset management sophistication required
Skills required (level of tool sophistication);
usability
Technology required (level of tool
sophistication)
Documentation
Availability of technical support
Cost per inspection
Resource requirements
Assessment
Pipelines.
Any.
Potable or wastewater.
Requires ability to isolate pipeline and access to
monitoring points and/or service reservoirs.
None.
Large diameter pipelines.
Discrete measurement in time.
Non-destructive.
Asset be taken off-line.
Water loss from pipe either due to exfiltration
(gravity sewers) or leakage (pressurized pipes).
Stand alone.
General approach.
Used in the UK for leak assessment on
transmission mains, used in Australia for
assessment of exfiltration.
Quantitative.
Direct measurement.
Generic approach.
Technical skills associated with pipeline
management .
Low tech.
No.
No.
Depends on test.
Depends on test.
F22.0 Ductor (Micro Ohm Resistance) Testing
F22.1 Overview
The Ductor (proprietary name) test is a non-destructive assessment to determine the
contact resistance in draw–out contacts such as circuit breakers on high current devices and bus
bar interconnections located in electrical power distribution boards and switchboards. The test
is normally carried out by applying a high current across the device which is being assessed,
allowing the detection and isolation of a poor connection so that corrective action can be
undertaken.
F22.2 Main Principles
Typically the four-wire Kelvin Bridge method is used consisting of two current and two
voltage wires. The two current leads are connected across the joint to be tested. A high current
(typically 0-600A) is passed through the joint or contact under assessment at a low voltage (04V DC). The two sensing leads measure the voltage across the joint. The resistance is
calculated from the test current and sense voltage, with the resistance measured in micro Ohms
(µΩ).
The voltage sensor leads are in parallel to the joint and only carry a miniscule current.
As such, the test lead resistance can be ignored.
The test can determine the condition of switch gear and circuit breakers, which can
deteriorate over time as a result of heat build up and the formation of carbon deposits during
operation. Surface contamination, overloading with resultant heat build up or incorrect torque
settings can also result in poor quality joints.
F22.3 Application
The Ductor assessment method is commonly undertaken to determine the condition of
electrical circuit breakers contacts, switchgear contacts, cable joints and bus bars joints where
high currents are encountered. It is commonly used on new installations for initial verification
and benchmarking, followed by periodic tests.
There is no specific standard for test method.
F22.4 Practical Considerations
Ductor test assessments should be conducted by trained electrical technicians or
engineers with experience in undertaking diagnostic analysis of electrical equipment
and components.
Auxiliary supply voltage to the test unit is typically 100 – 250V AC. The duration of
output current is limited (dependant upon manufacturer) but need only be long enough
to get a steady reading. For repetitive tests, cool off intervals may be required. Test
equipment with download facilities are available.
When assessing new equipment/joints, knowledge of the materials electrical properties
is required. This may be the manufacturer’s stated contact resistance or the conductivity
of the bus bar material.
For periodic testing, previous assessment results, typically those obtained during
commissioning, are required for comparison in order to determine the current condition
and likelihood of future equipment breakdown.
Condition Assessment Strategies and Protocols for Water and Wastewater Utility Assets
F-61
Access to epoxy resin filled cable joints is not possible. The equipment to be tested
must be electrically isolated and accessible.
A higher test voltage than that specified above is not required nor is it desired. Higher
voltages can break down the joint resistance.
F22.5 Advantages
Ductor test assessments are sensitive and provide measurements of micro Ohms (µΩ).
F22.6 Limitations
Prior to undertaking Ductor testing, the equipment being assessed must be isolated.
Previous test results are required to assess the current condition of the asset.
Table F-24. Summary Ductor (Micro Ohm Resistance) Testing.
Technical
selection
Technical
suitability
Utility technical
capacity
Economic
factors
Criteria
Assets covered
Material type
Service area
Access requirements
Limitations relating to asset condition
Limitations relating to asset size/geometry
Continuous/discrete
Destructive/non destructive
Interruption to supply/function
Assessment parameters
Integration with software tools
Commercialization of tool
Previous/existing use of the tool in sector
Accuracy/reliability
Ease of validation of results
Asset management sophistication required
Skills required (level of tool sophistication); usability
Technology required (level of tool sophistication)
Documentation
Availability of technical support
Cost per inspection
Resource requirements
Assessment
Electrical connections, busbars and contacts.
The conductor.
Potable and wastewater.
Access to normally livened parts which must be
made dead. Portable hand held equipment.
None.
None.
Discrete reading.
Non-destructive.
Off-line.
Resistance.
Stand alone.
Off the shelf.
Widely used.
Quantitative.
Direct measurement.
Generic approach.
Qualified electrician.
Test instrument only. Data requires no further
manipulation.
Well documented.
Commercially available.
Labor costs only.
One person, typically two hour
period/switchboard.
F22.7 Bibliography
1. T&R test equipment, http://www.trtest.com, accessed 2006
2. Transpower homepage, http://www.gridupgrade.co.nz, accessed 2006
F-62
F23.0 Electrical Potential (Half Cell) Measurement of Concrete Reinforcement
F23.1 Overview of Tool
Electrical potential measurement is a non-destructive technique that can be used to
identify areas of reinforced concrete in need of repair or protective treatment before corrosion
causes cracking and spalling. It does this by measuring the electrical potential between the
reinforcing and a reference electrode at the surface. By taking regular measurements, the
behavior of new and relatively new structures can be monitored and maintenance costs
minimized.
F23.2 Main Principals
Steel corrosion is an electrochemical process involving anodic (corroding) and cathodic
(passive) areas of the metal. To measure the electrical potential, an electrical connection is
made to the steel reinforcement of the asset to be assessed. This is connected to a high
impedance digital millivoltmeter, often backed up with a data logging device. A standard
reference electrode, either copper/copper sulfate or silver/silver chloride half cell, is also
connected to the millivoltmeter. The electrode used has a porous connection at one end that can
be touched to the concrete surface, see Figure F-3. The millivoltmeter will then register the
corrosion potential of the steel reinforcement nearest to the electrode’s point of contact. By
measuring results on a regular grid and plotting results as an equipotential contour map, areas
of corroding steel may readily be seen. Using 3D mapping techniques, a more graphical
representation of the corrosion can be shown.
Figure F-3. Electrical Potential Measurement Technique.
(Reprinted with permission from: Gu, P. and Beaudoin, J, 1998).
F23.3 Application
Electrical potential measurement is used to assess the corrosion potential of steel
reinforcement in civil concrete assets.
ASTM Standard C876 provides general guidelines for evaluating corrosion in concrete
structures. Electrical potential measurement is also referenced in BS 1881: Part 201.
F23.4 Practical Considerations
Equipment typically has a large digit display which is backlit for ease of reading in
poorly lit environments.
Extensible probe holders are available for remote surveying.
Condition Assessment Strategies and Protocols for Water and Wastewater Utility Assets
F-63
Many different electrode configurations have been tried in practice and several of these
have been found to have advantages over standard arrangements.
Surfaces in excess of 4000m2 can be measured.
The reinforcement at the point of measurement has to be electrically connected to the
millivoltmeter for reliable results to be obtained. If multiple sheets of reinforcement
were used and not electrically connected a point of contact must be made to each sheet.
Electrical potential measurement equipment typically readily portable and consists of
electrode rods or wheel, connecting cables and display unit.
F23.5 Advantages
Electrical potential measurement is a safe, rapid, cost-effective and non-destructive
method of condition assessment, which offers key information on the evaluation of
corrosion.
It is the simplest way to assess the severity of steel corrosion, as it measures corrosion
potential, which is qualitatively associated with steel corrosion rate.
Confidence in electrical potential measurement as an indication of corrosion potential
has developed greatly as a result of bridge deck corrosion surveys. An indication of the
relative probability of corrosion activity was empirically obtained through
measurements during the 1970s.
According to the ASTM C876 method, corrosion can only be identified with 95%
certainty at potentials more negative than -350 mV. However experience has shown
that passive structures tend to show values more positive than -200 mV and often
positive potentials. Potentials more negative than -200 mV may be an indicator of the
onset of corrosion. The patterns formed by contours on graphical representations of
corrosion can often be a better guide than single potential readings in these cases.
F23.6 Limitations
Electrical potential measurement does not directly indicate the rate of corrosion. There
are difficulties associated with making reliable quantitative measurements. The factors
influencing the electrical potential measurements are affected by the resistivity of the
concrete and the pH of the pore solution (carbonation). It could be necessary to use a
statistical analysis of measurements on individual structures to establish areas where
corrosion of reinforcement occurs.
Several factors can alter the precision of potentials measured:
−
−
−
−
−
−
−
−
−
−
−
F-64
Concrete cover depth
Concrete resistivity
High resistive surface layers
Polarization effects
Organic coatings and sealers
Concrete patch repair
Epoxy coated and galvanized reinforcement
Use of corrosion inhibitors
Chloride ion concentration
Carbonation
Oxygen concentration
These factors influence electrical potential readings because when surface potentials are
taken they are measured remotely from the reinforcement due to the concrete cover.
The potentials measured are therefore affected by the potential drop over the distance
between the reinforcement and the electrode.
Electrical potential measurement cannot be used on structures with active cathodic
protection systems. An energized cathodic protection system and stray current will
make electrical potential measurements meaningless.
Electrical potential measurement should never be used in isolation. It should be
combined with the measurement of the chloride content of the concrete and its variation
with depth and also the cover to the steel and the depth of carbonation.
Table F-25. Summary Electrical Potential (Half Cell) Measurement of Concrete Reinforcement.
Technical
selection
Criteria
Assets covered
Material type
Service area
Access requirements
Limitations relating to asset condition
Limitations relating to asset size/geometry
Continuous/discrete
Destructive/non destructive
Interruption to supply/function
Technical
suitability
Assessment parameters
Integration with software tools
Commercialization of tool
Previous/existing use of the tool in sector
Accuracy/reliability
Ease of validation of results
Assessment
All reinforced concrete assets.
Reinforced concrete.
Potable and wastewater.
Direct contact with asset. If asset is buried then it
must be exposed, surface coatings do not need
to be removed.
No limitations relating to asset condition.
No limitations relating directly to geometry.
There are limitations relating thickness of
concrete. With increasing concrete cover, the
potential values at the concrete surface over
actively corroding and passive steel become
similar. Thus the location of small corroding
areas becomes increasingly difficult.
Continuous readings in time and space.
Non-destructive.
The asset can remain in use and does not need
to be taken off-line unless an internal surface is
required to be accessed.
Detection of corrosion.
Can be integrated with software tools to produce
potential mapping: equipotential lines that allow
the location of the most corroding zones at the
most negative values.
Equipment is widely available from selected
commercial vendors.
Widespread use on bridge deck corrosion
surveys. Use increasing in the water sector,
gradually becoming acceptable to stakeholders.
Corrosion can be identified with 95% certainty at
potentials more negative than -350 mV.
For validation purposes, electrical potential
measurement can be combined with the
measurement of the chloride content of the
concrete and its variation with depth and also the
cover to the steel and the depth of carbonation.
Condition Assessment Strategies and Protocols for Water and Wastewater Utility Assets
F-65
Utility technical
capacity
Criteria
Asset management sophistication required
Skills required (level of tool sophistication); usability
Technology required (level of tool sophistication)
Documentation
Availability of technical support
Economic
factors
Cost per inspection
Resource requirements
Assessment
Generic approach.
Easy to use by following simple procedure.
Measurements can be taken by unqualified staff.
Sophisticated digital tools. For many tools,
measurements are automatically converted and
displayed as equipotential lines that allow the
location of the most corroding zones at the most
negative values potentials.
ASTM C876 and BS 1881:Part 201.
Technical support widely available from
distributors.
Low cost per inspection.
One operator required. Battery powered.
Resources required can also depend on asset
being inspected. Buried assets need to be
exposed.
F23.7 Bibliography
1. Gu, P. and Beaudoin, J., Obtaining Effective Half-Cell Potential Measurements in
Reinforced Concrete Structures, Construction Technology Update No. 18, pp1-3, July 1998
2. Naumann, J. and Haardt, P. NDT Methods for the inspection of highway structures’.
International Symposium (NDT-CE 2003). Non-Destructive Testing in Civil Engineering,
pp2-5, 2003
3. Torrent, R. and Frenzer, G. A method for the rapid determination of the coefficient of
permeability of the “Covercrete”. International Symposium Non-Destructive Testing in
Civil Engineering (NDT-CE). pp985-992, 26-28.09.1995
4. ASTM Standard C876 provides general guidelines for evaluating corrosion in concrete
structures
5. BS1881-201:1986 Testing concrete. Guide to the use of non-destructive methods of test for
hardened concrete
6. Technical brochures produced by MG Associates Construction Consultancy Ltd, 2006
F-66
F24.0 FailNet-Reliab
F24.1 Overview
FailNet-Reliab is a hydraulic reliability model for water pipelines developed by the
French research organization Cemagref. The approach is based on a hydraulic model (see
Hydraulic Modeling review) of the network coupled with reliability analysis. The output is an
assessment of the networks hydraulic performance expressed in terms of the ability to meet
demand.
F24.2 Main Principles
FailNet-Reliab is a computer modeling tool that can be used to assess the reliability of
water distribution networks. Reliability is considered in the context of water demand
satisfaction; essentially it is the quotient between the available consumption and the water
demanded.
After a specific hydraulic modeling study, where available consumption is computed
according to the pressure head at each node, several reliability indices are assessed and can be
used as performance indicators. Different scales of assessment are undertaken:
Pipes – the impact of a pipe break on all the nodes of the network.
Nodes – the reliability of supply at the node in relation with all the links.
Global network – the overall reliability of the network.
The model is implemented in two steps:
Firstly, a hydraulic model is constructed. This differs from a classical hydraulic model
because water consumptions are not fixed and depend on computed pressure heads and
water demands. The Newton-Raphson method is used to solve the hydraulic equations
and compute the outputs.
Secondly, reliability indices are assessed. The reliability indices depend on the results
of the hydraulic models (with or without pipe breaks), on the weight of each nodes
(quantity, vulnerability) and on pipe failure probabilities (which can be assessed with
probability models, such as Failnet-Stat). The indices represent the volume of nonsupplied water in the year because of failure risk.
F24.3 Application
FailNet-Reliab is used to assess the reliability for water supply networks utilizing
hydraulic models and failure probability estimates. This allows the reliability of a network to
be improved by modeling to compare different asset management strategies.
F24.4 Practical considerations
The tool is not fully commercialized and the approach has only had limited use in
France and with research groups.
Data requirements are similar to that of classical hydraulic data. For nodes, altitude,
water demand and type of water use are required. For pipes, the roughness, length and
diameter are required. The volume and altitude are required for tanks.
Failure probability, as calculated by FailNet-Stat (see FailNet-Stat review) can also be
incorporated into the model, but is not mandatory.
Condition Assessment Strategies and Protocols for Water and Wastewater Utility Assets
F-67
The software was to be reprogrammed in 2006/2007 to support all hydraulic features
and to improve functionality.
F24.5 Advantages
Provides engineers with a different view of the networks hydraulic performance by
factoring in reliability indices into the modeling process.
F24.6 Limitations
Has only had limited use in France and with research groups.
FailNet-Reliab requires additional information such as failure probability and mean
repair time to gain the full benefit from the package, and these have to be
developed/determined separately.
Some hydraulic features are not supported and may need to be replaced by equivalent
sources/demands.
Table F-26. Summary FailNet-Reliab.
Technical
selection
Technical
suitability
Criteria
Assets covered
Granularity
Service areas
Focus of analysis
Scalability of tool/approach
Commercialization
Previous/existing use of the tool
Ease of validation
Utility technical
capacity
Flexibility with regard to analysis (asset types) and
granularity (system, asset level)
Integration with other tools/GIS
Asset management sophistication
In-house skills required
Technology required
Documentation
Data Requirements
Linking to asset data
Availability of software and technical support
Usability
Assessment
Water pipes.
System and sub system level.
Potable
Hydraulic reliability for water pipelines.
Better suited to medium to large authorities
where good data is available.
Software available from Cemagref, France. Is
not full commercial version.
Only limited use in France and with research
groups.
As for hydraulic modeling and reliability tools;
independent validation is through field work.
Potable only; system or sub system level.
CARE-W manager.
Aimed at higher level of asset management.
Asset manager/engineer.
PC based tool.
Only limited documentation available.
Typical hydraulic modeling data is required.
Pipe IDs.
Software available from Cemagref, France
Not fully commercialized.
F24.7 Bibliography
1. Stone, S., Dzuray, E. J., Meisegeier, D., Dahlborg, A-S., and Erickson, M. DecisionSupport Tools for Predicting the Performance of Water Distribution and Wastewater
Collection Systems, EPA, EPA/600/R-02/029, 2002
F-68
F25.0 FailNet-Stat
F25.1 Overview
FailNet-Stat is a failure forecasting model for water pipelines developed by the French
research organization Cemagref. The approach uses historical data to define survival functions
that are then used in Monte-Carlo analysis to forecast the number of failures within pipe
cohorts.
F25.2 Main Principles
FailNet-Stat is a computer modeling approach that is applied in three steps:
1. Analysis of historical failure records using a proportional hazard model. The system
analyzes historical data, evaluates factors that influence failures, and identifies
factors that maximize the likelihood of failures.
2. By incorporating the information above, the system uses a Weibull distribution to
determine the time between successive failures. Separate models may be used for
pipes grouped according to their material and number of previous failures.
3. Forecasting the number of failures for a defined period using a Monte-Carlo
method. The system then forecasts the number of failures from the survival
functions for each group of pipes (materials and current condition). This forecast
can be used in combination with a hydraulic reliability model, in an economic
model, or alone as one of the rehabilitation criteria.
F25.3 Application
FailNet-Stat is designed to allow water authorities to establish failure probabilities for
the various pipe materials in their water distribution system.
F25.4 Practical considerations
The tool is not fully commercialized and the approach has only had limited use in
Europe and with research groups. It requires good quality asset data and failure history
data. Furthermore, optimum usage of the tool requires experience, particularly with
regards to the statistical significance of the results.
An alternative model is being developed which is capable of producing better
estimations of failure risk for individual pipes. This will form the basis of new software
in 2007. The software will also facilitate result interpretation by incorporating a benefit
index.
F25.5 Advantages
FailNet-Stat enables reliable failure probabilities to be established for a utility’s water
network (at individual pipe level), which can then be used to more effectively manage
the network and undertake additional analysis functions such as reliability analysis, etc.
F25.6 Limitations
FailNet-Stat has only had limited use in Europe and with research groups. It requires
good asset and failure data. Over-estimation of failure rates for individual pipes is
common if the failure observation period is short. However, the relative failure risk is
considered to be more accurate.
Condition Assessment Strategies and Protocols for Water and Wastewater Utility Assets
F-69
Table F-27. Summary FailNet-Stat.
Technical
selection
Technical
suitability
Criteria
Assets covered
Granularity
Service areas
Focus of analysis
Scalability of tool/approach
Commercialization
Previous/existing use of the tool
Utility technical
capacity
Ease of validation
Flexibility with regard to analysis (asset types) and
granularity (system, asset level)
Integration with other tools/GIS
Asset management sophistication
In-house skills required
Technology required
Documentation
Data Requirements
Linking to asset data
Availability of software and technical support
Usability
Assessment
Water pipes.
System and sub system level.
Potable
Failure forecasting model for water pipelines.
Better suited to medium to large authorities
where good data is available.
Software available from Cemagref, France. Is
not full commercial version.
Only limited use in Europe and with research
groups.
Statistical validation.
Potable only; system or sub system level.
Through CARE-W Manager.
Aimed at higher level of asset management.
Asset manager/engineer.
PC based tool.
Only limited documentation available.
Good asset and failure data is required.
Pipe ID.
Software available from Cemagref, France.
Not fully commercialized
F25.7 Bibliography
1. Stone, S., Dzuray, E. J., Meisegeier, D., Dahlborg, A-S., and Erickson, M. DecisionSupport Tools for Predicting the Performance of Water Distribution and Wastewater
Collection Systems, EPA, EPA/600/R-02/029, 2002
F-70
F26.0 Fiberscope Inspection
F26.1 Overview
Fiberscope inspection works similar to CCTV inspection (see CCTC Visual Inspection
review) but relies on optical fibers to gather images, which can be observed using an eyepiece.
This technique can be used to inspect small diameter pipes and valves. One important feature is
that fiberscope allows internal inspection of charged water mains. Fiberscopes are generally
used to visually inspect a main for corrosion or sediment build-up. A camera can be attached to
the eye piece of the fiberscope to record the inspection.
F26.2 Main Principles
A fiberscope consists of three parts: 1) a steerable end for capturing imaging; 2) a
viewing and control end; and 3) a flexible tube body.
The steerable end of the tool is manipulated by control wires that allow up to 120° of
movement (depending on the specific tool used) and contains optical fibers for both lighting
and image capture. The viewing and control end of the tool consists of an eye piece, which can
also be attached to a CCTV or similar device to record the images, and controls that allow the
tip to be manipulated and focusing.
Generally a 10 foot flexible tube will allow a pipe to be inspected for five feet on either
side of the inspection point for corrosion, sediment build-up or other features of interest.
The tool can be inserted into empty or charged water mains via fire hydrants, air valves,
tapping points and other similar access points.
The minimum size main that can be inspected is approximately 2½ inches. There is no
specific maximum size, however flow through the main can affect positional control of the
tool, and in larger diameter mains lighting may be insufficient for viewing the pipe internal
surface.
F26.3 Application
Fiberscope inspection is suitable for capturing visual images of the internal surface of
water mains, primarily small diameter mains, and can be used to assess the condition of
internal linings, the build up of corrosion products, and other features of interest. This
technique can also be used for in-service inspection of valves.
F26.4 Practical considerations
Fiberscope inspection technology is widely available, easy to use and readily portable.
It is used often in the aviation, power generation and other industries for inspection;
however it is not widely used by water authorities who generally favor other techniques
for obtaining data on the internal surface of pipes, such as physical inspection after
exhumation.
When conducting inspections in charged mains the flow through the main can affect
controllability of the tool.
The visual image needs to be analyzed manually, and so is dependant on image quality.
The presence of particulate matter or bubbles will reduce image quality, potentially to a
level that no useful information can be obtained.
Condition Assessment Strategies and Protocols for Water and Wastewater Utility Assets
F-71
F26.5 Advantages
Internal condition of water main assets can be inspected without exhumation.
Tool allows for in service inspection of valves.
Inspection can be conducted in charged mains; however the actual pressure allowable is
dependant on the pressure rating of the product.
F26.6 Limitations
Particulate matter in mains reduces visibility, potentially to a level that no useful
information can be obtained.
The limited observations achievable may not be representative of the rest of the pipe.
Maximum size of main that can be inspected is limited by the intensity of the available
light source.
Flow in charged mains can affect the controllability of the tool.
Table F-28. Summary Fiberscope Inspection.
Technical
selection
Criteria
Assets covered
Material type
Service area
Access requirements
Limitations relating to asset condition
Limitations relating to asset size/geometry
Technical
suitability
Continuous/discrete
Destructive/non destructive
Interruption to supply/function
Assessment parameters
Integration with software tools
Commercialization of tool
Previous/existing use of the tool in sector
Accuracy/reliability
Ease of validation of results
Utility technical
capacity
Asset management sophistication required
Skills required (level of tool sophistication);
usability
Technology required (level of tool sophistication)
Documentation
Availability of technical support
Economic factors
F-72
Cost per inspection
Resource requirements
Assessment
Water pipes and valves.
Any.
Potable.
An entry point into the asset is required such as a
fire hydrant or a tapping.
No restrictions based on asset condition.
The minimum size main that can be inspected is
approximately 2½ inches. Upper size limited by
light source.
Discrete.
Non-destructive.
Inspection can be undertaken on line or off line.
Visual image of pipe internal surface analyzed
manually for features such as sediment build up,
corrosion products, etc.
None.
Fiberscopes are widely available.
Tool not widely used.
Qualitative/visual assessment of pipe surface or
internal condition of valves.
Validation possible only by comparison with
manual /direct observation.
Generic approach.
Interpretation of results for consistent data requires
training. Utility should have the competence to
utilize the information provided by the tool operator.
Fiberscope and related accessories.
No Standards found or other.
Technical support should be available from
manufacturer.
Relatively low cost per inspection.
Requires team to operate camera and provide
entry into pipeline.
F26.7 Bibliography
1. Dorn, R., Howsam, P., Hyde, R.A. and Jarvis, M.A., Water mains: Guidance on
assessment and inspection techniques, CIRIA Report 162, Construction Industry Research
and Information Association, London, England, 1996
2. Randall-Smith, M., Russell, A. and Oliphant, R., Guidance manual for the structural
condition assessment of trunk mains, WRc, UK, 1992
Condition Assessment Strategies and Protocols for Water and Wastewater Utility Assets
F-73
F27.0 Fracture Toughness (C-Ring) Testing
F27.1 Overview
Fracture toughness testing gives an indication of the materials resistance to fracture
failure. Many standards require PVC pipes to achieve a minimum “short term” fracture
toughness value.
Fracture toughness testing is a destructive test where a specimen is statically loaded and
the time to failure measured. It is generally used for quality control testing, but it could be
applied to the testing of samples taken from in service PVC pipes. Fracture toughness can be
measured on many materials, including steel and polystyrene. However, this review focuses on
the fracture toughness testing of PVC used for pressure pipe.
F27.2 Main Principles
C-ring fracture toughness testing allows the susceptibility of a PVC pipe to fracture
failure to be determined. A section of (exhumed or new) pipe is marked with a line along the
pipe axis. Several rings approximately 13/16 inches (30mm) in width are then cut from one end
of the section.
The remaining length is subjected to the methylene chloride test (see Methylene
Chloride Gelation Assessment review). If the results from this test are either type 1 or 2 then
the ring is notched at the inside surface of the pipe parallel to the line drawn earlier. If however
the test result is type 3, then the location of greatest attack is marked on all of the rings. The
ring is then notched at the inside surface at this location.
A section is removed from the ring opposite to the notch to create a “C-ring”. A static
force is then applied, as shown in Figure F-4. The mass applied depends on the requirements of
either a standard or the utility.
Figure F-4. Schematic of C-Ring Fracture Toughness Testing.
Testing can be conducted to either establish if the PVC pipe material meets a minimum
15 minute standard for which a single test is needed (although multiple tests are
recommended), or multiple tests using a range of applied masses to establish fracture
toughness behavior over time; including instantaneous fracture toughness via extrapolation. A
typical requirement for PVC 15 minute fracture toughness is 4.5 MPa/m2.
F-74
F27.3 Application
C-ring fracture toughness testing is used to determine if a section of PVC pressure pipe
exceeds a minimum fracture toughness set by the relevant standard or water utility (user).
Standards which describe this test are as follows: ISO 11673, AS/NZS 1462.19:2006.
F27.4 Practical considerations
This test is widely used in the plastic pipe industry by both manufacturers and users. It
should only be conducted in a laboratory by qualified personnel.
If the notch is not located at the point of lowest gelation (point of greatest attack during
methylene chloride testing), the test results cannot be considered reliable.
F27.5 Advantages
This test gives an indication of the pipe susceptibility to fracture failure.
The test can be extended to obtain information about the probable lifetime of a pipe
section.
F27.6 Limitations
The test is destructive and requires exhumation of pipe samples.
The test is subject to variation, so a number of tests may need to be performed.
The test must be conducted at the location of lowest gelation.
The test only relates to the toughness properties of the material and not its susceptibility
to failure due to point loading.
Table F-29. Summary Fracture Toughness (C-Ring) Testing.
Technical
selection
Criteria
Assets covered
Material type
Service area
Access requirements
Limitations relating to asset condition
Limitations relating to asset size/geometry
Continuous/discrete
Destructive/non destructive
Interruption to supply/function
Technical
suitability
Utility technical
capacity
Assessment parameters
Integration with software tools
Commercialization of tool
Previous/existing use of the tool in sector
Accuracy/reliability
Ease of validation of results
Asset management sophistication required
Skills required (level of tool sophistication); usability
Assessment
Pipes.
uPVC or unplasticised poly(vinyl chloride).
Potable and wastewater.
Pipe sample test.
None.
None on commonly used pipe sizes, specialized
equipment may be required for testing of larger
diameter pipes.
Discrete results.
Destructive test.
If pipe to be tested is in service it must be
exhumed; supply will therefore be interrupted.
Fracture toughness.
Stand alone.
Test houses can supply testing capacity.
Tool is widely used by plastic pipe industry.
Quantitative. Multiple measurements may need
to be taken to ensure a reliable result.
Results can be validated by repeated testing.
Generic testing procedure.
Operator should be suitably trained in the
procedure.
Condition Assessment Strategies and Protocols for Water and Wastewater Utility Assets
F-75
Criteria
Technology required (level of tool sophistication)
Documentation
Availability of technical support
Economic factors
Cost per inspection
Resource requirements
F-76
Assessment
Test requires specialized notching tool.
ISO 11673, AS/NZS 1462.19:2006.
Test can be conducted by test houses if
required.
Low cost. Cost will vary depending on the time
taken to complete testing.
Test requires a stable temperature environment
and equipment to measure time to failure.
F28.0 Ground Penetrating Radar (GPR)
F28.1 Overview
Ground Penetrating Radar (GPR) is a technique for acquiring subsurface information.
GPR works by emitting short bursts of electromagnetic radiation into the ground and recording
the radiation reflected to locate buried assets of any material.
The amplitude of each emitted pulse received by the GPR unit is recorded on a time
scale (distance if wave velocity is known) giving a vertical plot for each pulse (called a trace).
As the unit is moved along the ground, a series of traces are taken and colors or grey scale
allocated to the amplitudes of each. The ‘colored’ traces are then placed along a distance scale
and the 2D profile created (Ground Penetrating Radar, 2005).
The depth to which assets can be located is dependant on soil type and the size of the
asset. The location of assets is achieved quickly in the field, though accurate interpretation of
the results requires a skilled operator.
F28.2 Main Principles
The GPR unit is moved across the ground surface to create a 2D profile of the area
directly beneath its path. The profile can then be interpreted by the operator to identify features
of importance. In order to locate buried assets, a series of profiles are taken, which can be used
to find the boundaries of assets such as tanks, or their direction in the case of pipes. A series of
profiles can also be used to create a 3D representation of an area.
GPR uses short bursts of VHF-UHF electromagnetic radiation, between 100 MHz and
1000 MHz, directed into the ground to acquire subsurface information. The actual frequency
used varies but is a compromise between the depth of penetration and the accuracy required.
By using longer wavelengths, increased penetration into soil can be achieved but there is a
corresponding loss of resolution.
The depth of penetration is also dependant on soil type. Soils with low electrical
conductivity provide the deepest penetration. In soils with high electrical conductivity,
penetration is limited by the attenuation of the wave pulse by its conversion into thermal
energy. Also, soils with large numbers of discontinuities will cause signal scattering, reducing
the penetration of the pulse deeper into the subsurface.
The wave pulse emitted by the GPR is reflected from areas where there is an interface
between two materials with different electrical properties, including objects, soil type
interfaces and ground water (Ground Penetrating Radar, 2005). The depth at which these
interfaces are located is calculated using the time it takes for the emitted pulse to travel into the
ground, reflect and travel back to the receiver and the wave velocity. The velocity of the wave
is dependant on the electrical permittivity or dielectric constant of the host material and a range
of standard values is generally supplied with the GPR unit.
F28.3 Application
GPR can be used to locate buried assets of any material type, but because of its cost,
complexity, and limitations, GPR is usually the method of choice only for targets not locatable
by other means, such as plastic or clay pipe.
ASTM D6432-99 Standard Guide for Using the Surface Ground Penetrating Radar
Method for Subsurface Investigation
Condition Assessment Strategies and Protocols for Water and Wastewater Utility Assets
F-77
F28.4 Practical considerations
GPR units are available from a number of suppliers world wide. A trained operator is
required to use the device effectively.
The depth accuracy of GPR assessments is influenced by the knowledge of wave pulse
velocity in the soil; where this is known, accuracy is quite high (usually within 10% of
total depth). Where wave pulse velocity is unknown or estimated the accuracy can vary
by a significant percentage of total depth. The horizontal accuracy is not affected by the
wave pulse velocity, thus the surface location of the asset can be found within inches
even though the depth may not be known with great accuracy.
The repeatability of measurements is very high when there has been no change in soil
conditions; variations in soil conditions will affect the results due to the change in the
soil’s wave pulse velocity and signal attenuation. Exact depth calculation is dependant
on the quality of wave velocity information.
The best results are achieved when the GPR unit is as close to the ground as possible,
as any air gap will reduce the penetration and can induce interference at ground level.
F28.5 Advantages
GPR is quick and gives immediate results. Skilled operators can interpret data in the
field or can it can be post processed.
Unlike other location techniques GPR is able to locate polymer and clay assets.
F28.6 Limitations
Penetration into soils with high electrical conductivity, like mineralogical clays, can be
limited to less than one meter (Ground Penetrating Radar, 2005).
The ability to detect an asset below the water table is reduced by signal loss due to
scattering at water table boundary and signal attenuation due to the high electrical
conductivity below the water table.
Uneven ground may require the unit to be raised off the ground, reducing the
penetration depth and accuracy of the results.
The equipment can be difficult to move on steep slopes.
Skilled operators required for interpretation of data in the field.
F-78
Table F-30. Summary Ground Penetrating Radar (GPR).
Technical
selection
Criteria
Assets covered
Material type
Service area
Access requirements
Limitations relating to asset condition
Limitations relating to asset size/geometry
Continuous/discrete
Technical
suitability
Destructive/non destructive
Interruption to supply/function
Assessment parameters
Integration with software tools
Commercialization of tool
Previous/existing use of the tool in sector
Accuracy/reliability
Ease of validation of results
Utility
technical
capacity
Asset management sophistication required
Skills required (level of tool sophistication); usability
Technology required (level of tool sophistication)
Documentation
Availability of technical support
Economic
factors
Cost per inspection
Resource requirements
Assessment
Environmental survey (buried assets).
All materials.
Potable and wastewater.
GPR needs clear space at ground level, obstacles
and very uneven ground can prevent use.
No restrictions.
Assets of any size can be located. However small
assets may be difficult to locate depending on their
depth and the wavelength used. Rule of thumb is
objects with a depth to size ratio of 12:1 to 24:1 are
usually detectable with GPR, providing the signal
can penetrate down to them before being
attenuated.
Discrete. GPR uses sets of readings over a short
distance gathered at a number of locations to locate
assets. More advanced systems can use sets of
images to create a 3D map of the subsurface.
Non-destructive.
Inspection does not cause an interruption to supply.
Location of buried assets.
Depending on the model used, GPR equipment can
be fed into computer programs to extract more data
from the results obtained.
Equipment is available from a number commercial
vendors.
GPR has been available for over 20 years, but has
begun to be adopted by the utility locating industry
only in the last 10 as more convenient, user friendly,
and economical units have become available.
Quantitative, though the accuracy of depth
measurements is dependant on frequency and
knowledge of soil properties and so can vary by
several percent of depth. Claims on horizontal
readings accuracy vary from inches to a foot. Ability
to detect assets varies with material.
Results can be validated only through exposure of
the asset.
Generic.
Use of GPR requires a skilled operator to gather
useful information.
Depending on the amount of data processing
desired, computing can be done onsite by the unit
or post processing can be done on to obtain more
information including 3D plots.
ASTM D6432-99.
Training courses are offered by the equipment
manufacturers.
US$1,000 – $2,000 per day with a skilled operator.
GPR can be undertaken by a single person.
Condition Assessment Strategies and Protocols for Water and Wastewater Utility Assets
F-79
F28.7 Bibliography
1. Burn, L.S., Eiswirth, M., DeSilva D. and Davis P., Condition Monitoring and its Role in
Asset Planning, Pipes Wagga Wagga 2001, Charles Sturt University, Wagga Wagga,
N.S.W., 2001
2. Dingus, M., Haven, J. and Austin, R. Nondestructive None Invasive Assessment of
Underground Pipes, AwwaRF, USA, 2002
3. Dolphin, L., A brief background on ground penetrating radars,
http://www.ldolphin.org/GPRbkgnd.html , accessed 2005
4. Eiswirth, M., Burn, L.S. New Methods for Defect Diagnosis of Water Pipelines, 4th
International Conference on Water Pipeline Systems, 28-30, York, UK, March 2001
5. Ground Penetrating Radar, http://fate.clu-in.org/gpr_main.asp , accessed 2005.
6. Trenchless technology Network Underground Mapping, Pipeline Location Technology and
Condition Assessment, (downloaded from
http://www.ttn.bham.ac.uk/Final%20Reports/Pipe%20Location%20and%20Assessment.pd
f accessed 2006), 2002
7. ASTM D6432-99 Standard Guide for Using the Surface Ground Penetrating Radar Method
for Subsurface Investigation
F-80
F29.0 Holiday Detector
F29.1 Overview of Tool
This is a non-destructive method used to detect flaws such as pin holes, air bubbles,
thin points and porosity in non-conductive (insulation type) coatings on conductive substrates
and on concrete (for some detectors).
The substrate of the asset being inspected is connected to a current and a conductive
brush is passed over the coating surface. Flaws are located when the brush moves over a flaw,
which completes the electrical circuit.
Holiday detectors are also commonly known as porosity detectors, spark testers or
jeepers.
F29.2 Main Principles
Holiday detectors can be used on any asset which has a conductive substrate and nonconducting (insulating) coating, from DI pipes to tanks. Holiday detectors work by applying a
constant current source to the coating substrate, which results in an applied test voltage. There
are two main types of holiday detectors: 1) high voltage DC and 2) electric pulse units.
A typical DC detector delivers a stabilized DC output of up to 30kV with a resolution
of 10V. Flaws are located by moving the detector over the coated surface; when the detector
moves over a flaw, the applied potential ‘jumps’ from the substrate to the detector. A visual
and/or audible alarm indicates when a fault is found. A range of accessories are available to be
used with holiday detectors including:
Internal pipeline disc and spiral wound brushes up to two meters diameter.
External pipeline coil electrodes up to 1420 mm diameter.
Flat brass wire brushes up to 600 mm long, fan brushes.
Pulse models can be used for determining porosity and location of pinholes in carbon
impregnated coatings such as carbonated rubber, thick coatings such as rubber linings and on
‘plastic’/fiberglass type coatings likely to become electrostatically charged. Models with 20kV
and 40kV are designed for use in moist conditions and on wet or contaminated coating
surfaces.
Some holiday detectors use the wet sponge method to detect pinholes in coatings. This
method is recommended for thin film porosity testing (coatings under 150 µm), or in favor of
high voltage testing, particularly when working with coatings in corrosive environments.
F29.3 Application
Holiday detectors are useful for detection of flaws in coatings and wrappings on both
flat and curved surfaces, such as pipes, tanks, valves and steel structures.
Holiday detectors are required to comply with the requirements of AS3894.1-2002.
They are also addressed in the National Association of Corrosion Engineers (NACE)
Standards: TM0186-94; TM0384-94; RP0490-2001; RP0274-98 & RP0188-99
F29.4 Practical Considerations
Holiday detectors are handheld and come in a variety of types for the inspection of a
wide range of asset types and can be obtained from a number of suppliers. They are
Condition Assessment Strategies and Protocols for Water and Wastewater Utility Assets
F-81
used widely in industries where the integrity of coating is important and can detect
cracks, blow holes, burrs, air bubbles and inclusions (Figure F-5).
Figure F-5. Defect Types Detectable by Holiday Testing
(Reprinted with permission from: Buckleys, 2006).
A holiday detector should be used as soon as time and conditions permit after the
coating has been applied and properly cured and, if possible, again prior to final project
completion. When electrical inspection is conducted at the time of coating application,
voids in the coating can be readily located and repaired, plus, it allows the applicator
the opportunity to develop better coating application techniques.
Electrical inspection prior to project completion is recommended as the protective
coating may have been damaged during construction.
Proper grounding of the holiday detector to the coated concrete substrate is essential in
order to complete the electrical circuit of the holiday detector.
Test voltage adjusted at the job site takes into consideration every aspect of the output
circuit in relation to; ground resistance, structure resistance, coating thickness,
capacitance losses, barometric pressure and electrode configuration.
An alternative to setting test voltages in the field is to use the formula developed by the
NACE and incorporated into several standards. The formula for the voltage to be
applied to thin film coatings applied up to 30 mils (0.76 mm) thickness is
,
where T is the coating thickness in mils.
Example: A coating 25 mils (0.64 mm) thick would work out to an inspection voltage
of 2600V. For thicker applied coating the constant changes to 1250. Example: a coating
125 mils (3.175 mm) thick would work out to an inspection voltage of 14,000V.
Care needs to be taken to not exceed the coating manufacturer’s recommendations of
test voltages. Manufacturers of the protective coating should always be consulted by the
consumer with regards to dielectric strength of properly cured coatings and
recommendations of maximum test voltages to be used on every formulated coating.
It is not recommended that electric pulse (low voltage) detectors be used for the
electrical testing of protective coating having a dry film thickness in excess of 0.51
mm.
DC Pinhole/Holiday Detectors are far more efficient and accurate at finding pinholes,
in coatings than AC spark testers.
F29.5 Advantages
Holiday detectors can be used to rapidly test the quality of a coating, including defects
that cannot be detected by visual inspection.
F-82
F29.6 Limitations
Holiday detectors can only be used to find flaws in coatings whose substrate is made
from a conductive material such as metal and concrete.
Pulse type detectors are completely ineffective for inspection of prefabricated films
such as PVC or polyethylene (PE) protective linings.
Table F-31. Summary Holiday Detector.
Technical
selection
Criteria
Assessment
Assets covered
Material type
Coated assets.
Corrosion protection coatings on concrete and
steel substrates.
Potable and wastewater.
Direct contact with coating. If external coating is
buried then it must be exposed. Tool comprises
of several components and is hand held.
Sufficient room is required for an operator and
electrical isolation area where an asset has
been exposed for testing.
No specific restriction related to asset condition.
Testing cannot be conducted during rainfall.
No limitations relating to size of concrete
element.
Continuous readings.
Non-destructive.
The asset must be taken off-line if an internal
coating is to be tested.
Location of pin holes, air bubbles, thin points
and porosity on non-conductive (insulation type)
coatings.
Compatible with an RS 232 data interface gives
a printout of measured objects and can be
transferred to PC with MS Hyperterminal.
Equipment is fully developed, readily available
from commercial vendors and can be used off
the shelf.
Widespread use internationally on bridges, road
infrastructure in the petrochemical in the water
industries.
Accuracy is typically 2% at high resolution when
calibrated on a known thickness location.
Certified high voltage DC and pulse crest
meters can be used to verify the output voltage
and the calibration of DC and crest holiday
detectors respectively.
Service area
Access requirements
Limitations relating to asset condition
Limitations relating to asset size/geometry
Continuous/discrete
Destructive/non destructive
Interruption to supply/function
Technical
suitability
Assessment parameters
Integration with software tools
Commercialization of tool
Previous/existing use of the tool in sector
Accuracy/reliability
Ease of validation of results
Condition Assessment Strategies and Protocols for Water and Wastewater Utility Assets
F-83
Utility technical
capacity
Criteria
Assessment
Asset management sophistication required
Skills required (level of tool sophistication); usability
Generic approach.
The technique does not require specialist
knowledge. Requires minimal training. Operator
will need to know be aware of safety procedures
associated with the use of holiday detectors.
Apparatus digitally displays applied voltage,
constant test current, and fully adjustable
voltage and sensitivity controls.
AS3894.1-2002 and NACE Standards: TM018694; TM0384-94; RP0490-2001; RP0274-98 and
RP0188-99.
Technical support available from distributors.
Low cost per inspection.
One operator required. Battery powered.
Technology required (level of tool sophistication)
Documentation
Economic
factors
Availability of technical support
Cost per inspection
Resource requirements
F29.7 Bibliography
1. Buckleys, A Guide to Using DC Holiday Detectors at
http://www.buckleys.co.uk/holidayguide.htm, accessed 2006
2. Byerley, D. D. Electrical Inspection of Protective Coatings Applied to Concrete Surfaces,
at http://www.tinker-rasor.com/tech/concrete.html
3. AS3894.1-2002 Site testing of protective coatings - Non-conductive coatings - Continuity
testing - High voltage ('brush') method
4. NACE Standard Test Method TM0186-94. Holiday Detection of Internal Tubular Coatings
of 250 to 760 µm (10 to 30 mils) Dry Film Thickness
5. NACE Standard Test Method TMO384-94. Holiday Detection of Internal Tubular Coatings
of Less Than 250 µm (10 mils) Dry Film Thickness
6. NACE Standard Recommended Practice RP0490-2001 - Holiday Detection of FusionBonded Epoxy External Pipeline Coatings of 250 to 760 um (10 to 30 mils
7. NACE Standard Recommended Practice RPO274-93. High Voltage Electrical Inspection
of Pipeline Coatings Prior to Installation
8. NACE Standard Recommended Practice RP0188-99 Discontinuity (Holiday) Testing of
New Protective Coatings on Conductive Substrates
F-84
F30.0 Hydraulic Modeling
F30.1 Overview
Many commercially available software packages are available that model the hydraulic
behavior of pressure and gravity pipelines or networks. Hydraulic models are calibrated against
measured values of pressure and/or flow. Calibration is further fine tuned by adjusting
parameters like friction factors until the model reproduces the measured system response under
a range of conditions.
Once calibrated, the hydraulic model can be used to identify hydraulic issues within the
pipeline or network. When identified, asset inspection and other survey techniques can be used
to investigate further.
F30.2 Main Principles
Hydraulic models represent mathematically the relationships between flow parameters
such as pressure, diameter, roughness and slope, and service demand. Hydraulic models are
used at different stages of a pipe networks life which can include the following stages:
Master planning – hydraulic models are used to predict the improvements and additions
to the system which may necessary to accommodate future customers. In this situation
models focus at a macro level with emphasis placed on larger transmission mains,
pump stations and storage tanks.
Preliminary design – hydraulic models are used to identify the facilities required to
serve a particular area. In this situation modeling is usually focused to a limited portion
of the network.
Subdivision layout – hydraulic models determine the capacity requirements for the
subdivision.
Rehabilitation – hydraulic models are used to ensure that adequate capacity is
maintained after rehabilitation of a pipeline. This is a very important consideration.
For stormwater and combined sewers, a verified model can be used to simulate network
performance with respect to various performance indicators such as surcharge/flooding
conditions. To do this, a verified model is run for storms of a range of intensities and durations
to establish that each pipeline and overflow achieved the appropriate performance criteria (e.g.,
onset of surcharge).
F30.3 Application
Hydraulic modeling is used for the analysis and design of pressure and gravity pipelines
and networks.
There are no Standards which require the use of hydraulic models.
F30.4 Practical considerations
Hydraulic models are widely used in the water industry so there are a large number of
hydraulic modeling packages available, from both private vendors and public domains.
Some are designed to undertake a specific hydraulic modeling task, while others are
capable of a range of modeling processes.
Most of the packages available enable network design, simulation and optimization. In
addition many packages also incorporate water quality analysis and link to GIS.
Condition Assessment Strategies and Protocols for Water and Wastewater Utility Assets
F-85
Costs of models vary dramatically, models such as EPANET (analysis only) and Netis
are free, while other commercial packages are costly. However, the commercial
packages come with more advanced features and better user interfaces than those freely
available.
Models require good data to be effective and collecting and assembling the data can be
time consuming. In order to preserve their usefulness, the underlying input data must be
maintained.
Model calibration through adjustment of friction factors gives some indication of the
pipe’s internal condition. Where issues relating to service are predicted, asset inspection
and other survey techniques can be used to investigate further.
F30.5 Advantages
Hydraulic models relieve engineers from tedious, iterative calculations and are able to
take account of much more of the complexity of real world systems.
Optimization tools/modules attached with the analysis module help in obtaining least
cost solutions.
They enable alternatives to be explored under a wide range of conditions resulting in
more cost effective and robust interventions.
F30.6 Limitations
Hydraulic modeling software can be expensive to purchase for small companies and
requires the training of staff to use the models.
The majority of costs are mainly related to model development and the benefits are not
realized until later in the form of quicker calculations and better decisions.
Some packages have limitations on the number of network nodes they are able to
handle, while others have limitations on their ability to link to a GIS system.
Table F-32. Summary Hydraulic Modeling.
Technical
selection
Technical
suitability
Criteria
Assets covered
Granularity
Service area
Focus of analysis
Scalability of tool/approach
Commercialization
Previous/existing use of the tool
Ease of validation
Flexibility wrt analysis (asset types) and granularity
(system, asset level)
Integration with other tools/GIS
F-86
Assessment
Water and wastewater networks.
System and sub-system level.
Potable and wastewater.
The relationships between flow, pressure,
roughness, capacity and service.
Better suited to medium to large authorities
where good asset data is available, but simple
models available for small authorities.
Many commercial and public domain software
models are available.
Widely used worldwide. Majority of large
authorities would have some form of modeling
software.
Validation through data collection and
comparison to network response.
Designed for both network level modeling and
sub network level modeling. Models are
generally specific to water or wastewater service
area (pressurized v open channel).
Can link directly to GIS.
Utility technical
capacity
Criteria
Asset management sophistication
In-house skills required
Technology required
Documentation
Data Requirements
Linking to asset data
Availability of software and technical support
Usability
Other
IT integration
Tools costs (license and maintenance)
Assessment
Generic approach.
Asset manager/hydraulic engineer.
Computer based tool. Many systems link to GIS
data.
Depends on software being used. Most come
with detailed documentation.
Good quality asset data required, calibration
data is necessary.
Through asset IDs.
Widely available through many vendors. Some
models can be freely downloaded from the
Internet.
Depends on software. Most systems have an
graphical user interface (GUI) that greatly
improves the usability of the model.
PC based software.
Varies depending on package. Some models
are free, while some commercial packages are
thousands of dollars. Many also have an annual
license fee.
F30.7 Bibliography
1. Dorn, R., Howsam, P., Hyde, R.A. and Jarvis, M.A. Water mains: Guidance on assessment
and inspection techniques, CIRIA Report 162, Construction Industry Research and
Information Association, London, England, 1996
2. EPANET, http://www.epa.gov/ORD/NRMRL/wswrd/epanet.html, accessed 2005
3. SWMM, http://www.epa.gov/ednnrmrl/models/swmm/index.htm, accessed 2005
4. Stone, S., Dzuray, E. J., Meisegeier, D., Dahlborg, A-S., and Erickson, M. DecisionSupport Tools for Predicting the Performance of Water Distribution and Wastewater
Collection Systems, EPA, EPA/600/R-02/029, 2002
Condition Assessment Strategies and Protocols for Water and Wastewater Utility Assets
F-87
F31.0 Impact Echo Testing
F31.1 Overview
The impact echo testing method is a non-destructive method primarily used for
assessment of concrete assets. However, impact echo testing can also be performed on stone,
plastic, masonry materials, wood and some ceramics. Application suitability depends on the
properties and internal structure of the material being tested. Testing is conducted by impacting
the asset surface, recording the signal reflected back to a transducer and analyzing that signal.
Impact echo tests are most often used to find the thickness of plate-like concrete
elements from one side. Another major use is for locating and diagnosing internal flaws such
as voids, honeycombing, delaminating, depth of surface opening cracks, and other damage in
concrete.
If the member thickness is known, impact echo testing can also be performed to predict
the strength of early age concrete. Impact echo testing can also be used to determine relative
concrete quality for test cylinders and other samples with known thickness. This is achieved by
measuring the concrete compression wave velocity.
F31.2 Main Principles
Impact echo testing detects flaws in concrete based on reflection of compression waves
from the bottom of the structural member or from any hidden discontinuity within the member.
Concrete element thickness is determined by measuring waves that reflect off the backside of
the concrete.
The waveform resulting from an impact to the asset is measured. The resulting time
versus amplitude data includes energy from the initial impact as well as energy from echoes
that have traveled through the concrete and echoed off of the back side or any discontinuity
parallel to the test surface.
Impact echo testing apparatus consists of three main components:
Impact source, often referred to as an impactor.
Receiving transducer, often referred to as a displacement transducer.
Waveform analyzer.
The selection of the impact source is important for successful impact echo testing. The
size of the impactor is selected based on the depth and size of flaw that is to be detected. Steel
spheres on spring rods are commonly used as the impact source.
The receiving transducer needs to be capable of accurately measuring surface
displacement. A conically tipped transducer is often used in impact echo testing. Receiving
transducers are secured in a special housing so that they can be used on vertical surfaces. A
thin lead strip is used to provide acoustic coupling between the transducer and the test surface.
A waveform analyzer, or computer with high-speed digital data acquisition hardware, is
used to capture the transient output of the displacement transducer, store the digitized
waveforms, and perform signal analysis. The waveform analyzer needs to have a minimum
high sampling frequency of 500 kHz. The receiving transducer should preferably be a
broadband displacement transducer. Accelerometers have been used but they must not have
resonant frequencies in the range of those measured during impact echo testing and additional
signal processing is required.
F-88
Specialist software allows the data acquisition parameters to be set up and performs the
data analysis.
F31.3 Applications
The impact echo technique is most extensively used on flat areas but can also be used
for tests on other geometries. Impact echo testing can be used, but is not limited to, the
following asset types:
Concrete slabs, pavements
Concrete slabs consisting of two layers, including slabs with asphalt overlays
Bond quality at internal interfaces
Circular columns
Square and rectangular beams and columns
Walls
Dams
Hollow cylinders such as pipes and tunnels
Post-tensioned structures for instance locating voids in grouted tendon ducts
Depth of surface-opening cracks
In 1998, ASTM adopted a standard test method on using the Impact echo testing
method to measure the thickness of concrete members:
ASTM C 1383 ‘Standard Test Method for Measuring the P-wave Speed and Thickness
of Concrete Plates Using the Impact echo testing Method’.
The standard test method involves two procedures. The first procedure determines the
P-wave speed in the concrete by measuring the travel time between two surface receivers
separated by a known distance. The second procedure measures the thickness using impact
echo testing. The method is applicable to plate-like structures in which the smallest lateral
dimension is at least six times the thickness of the member.
F31.4 Practical Considerations
The impact echo technique does not require specialist knowledge or training. Thickness
measurements can be taken by unqualified staff. However experienced persons are
required to check for flaws such as delamination.
A telescoping pole can be used on flatwork or overhead.
Generally impact echo testing instruments have built-in default concrete parameters.
However for greater accuracy some instruments can be calibrated by testing at a point
of known concrete thickness as a calibration reference.
Impact echo testing equipment typically has a thickness range of 66mm up to 1.8m.
The technology has the capability to be able to measure a minimum thickness of 38mm
and a maximum thickness of 3.0m. However the ratio of width to thickness must be at
least three. Accuracy is typically 2% at high resolution when calibrated on a known
thickness location.
If the thickness of the concrete being tested is not known, and two sides of the concrete
element cannot be accessed, a second receiving transducer will need to be added in
order to enable Spectral Analysis of Surface Wave (SASW) testing. This second
Condition Assessment Strategies and Protocols for Water and Wastewater Utility Assets
F-89
receiving transducer is often mounted on a detachable arm. In combination with the
impact echo technique, SASW can be used for correlating strength vs. velocity in the
field to laboratory tests of concrete specimens (cubes, beams or cylinders). SASW can
also be combined with ultrasonic pulse velocity measurements for this purpose. The
combination of impact echo thickness and internal flaw detection with SASW velocity
measurement results in the most powerful and accurate way of determining the location
and nature of defects.
An underwater impact echo testing apparatus for point by point testing is also available.
F31.5 Advantages
Impact echo testing measures the thickness of concrete slabs and walls without the need
for drilling, coring, or other destructive means.
Only one side of the structure needs to be accessible for testing.
The impact echo testing method can be used on existing coated structures. It works
through paints, coatings and tiles.
Additional analysis of the echo data allows multiple cracks and other complex internal
flaws to be detected.
F31.6 Limitations
Impact echo testing is restricted in terms of the thickness and geometry of elements to
be measured. The minimum thickness of concrete which can be tested is 38mm.
Naumann and Haardt (2003) argue that there is a need for improved quantification of
capabilities for measuring thickness, mapping or sizing layers of reinforcement,
detecting and mapping of delaminations and cracks parallel to the surface for the
impact echo method. This is especially the case where there is reinforcement
congestion.
Table F-33. Summary Impact Echo Testing.
Technical
selection
Criteria
Assets covered
Material type
Service area
Access requirements
Limitations relating to asset condition
Limitations relating to asset size/geometry
Continuous/discrete
Destructive/non destructive
Interruption to supply/function
Technical
F-90
Assessment parameters
Assessment
Concrete slabs, beams, columns, walls,
pavements, tunnels, pipes, dams and other
plate-like structures.
Concrete, stone, plastic, masonry materials,
wood and some ceramics.
Potable and wastewater.
Direct contact with asset. If asset is buried then
it must be exposed, surface coatings do not
need to be removed.
No limitations relating to asset condition.
Some limitations relating to size/geometry: the
minimum thickness of concrete which can be
tested is 38mm and a maximum thickness of
3.0m. However the ratio of width to thickness
must be at least three.
Discrete reading.
Non-destructive.
The asset can remain in use and does not need
to be taken off-line.
Thickness of concrete element, location and
suitability
Criteria
Assessment parameters
Integration with software tools
Commercialization of tool
Previous/existing use of the tool in sector
Accuracy/reliability
Ease of validation of results
Utility technical
capacity
Asset management sophistication required
Skills required (level of tool sophistication); usability
Technology required (level of tool sophistication)
Economic
factors
Documentation
Availability of technical support
Cost per inspection
Resource requirements
Assessment
diagnosis of internal flaws, strength of early age
concrete, and relative concrete quality.
Can be integrated with software tools.
Equipment is available from selected
commercial vendors.
Widespread use.
Accuracy is typically + 2% at high resolution
when calibrated on a known thickness location.
Results can be easily validated. For instance
Spectral Analysis of Surface Wave testing
(where a second receiving transducer is added
when conducting echo impact testing) can be
combined with ultrasonic pulse velocity
measurements for determining concrete
strength.
Generic approach.
Easy to use by following simple procedure.
Thickness measurements can be taken by
unqualified staff. However experienced persons
are required to check for flaws such as
delaminations.
Apparatus comes in digital versions which
calculate and display a graph concrete
thickness along the member length. Thickness
data table importable into popular spreadsheet
programs. The data from up to 300 tests can be
stored and downloaded. Some tools have a
super thin concrete and surface wave analysis
options built in. Velocity calibration at known
thickness locations.
ASTM C 1383.
Technical support available from distributors.
Low cost per inspection.
One operator required. Battery powered.
Resources required can also depend on asset
being inspected. Buried assets need to be
exposed.
F31.7 Bibliography
1. Naumann, J. and Haardt, P. NDT Methods for the inspection of highway structures.
International Symposium (NDT-CE 2003). Non-Destructive Testing in Civil Engineering,
pp2-5, 2003
2. ASTM C 1383 ‘Standard Test Method for Measuring the P-wave Speed and Thickness of
Concrete Plates Using the Impact echo testing Method’
Condition Assessment Strategies and Protocols for Water and Wastewater Utility Assets
F-91
F32.0 Indirect Tensile Strength Testing
F32.1 Overview
The tensile strength of cylindrical cores (see Core/Coupon Sampling review) taken
from concrete or asbestos cement pipes is used as a measure of the residual tensile strength of
the pipe. Once extracted, the cores are compressed to failure. The compressive stress at failure
can be used to indirectly obtain the residual tensile strength of the pipe from which the core
was taken.
The testing of the cores is itself destructive. Since only cores are taken, the pipe itself
must be repaired. If only one core is extracted, the pipe can be clamped. However, a common
practice is to remove a section of pipe from which multiple cores are then taken. In this case,
the pipe section must be replaced.
F32.2 Main Principles
The tensile strength of a concrete or asbestos cement pipe reduces over time due to
leaching of free lime; in a pipe where all the free lime has been leached, the residual tensile
strength of the pipe will have been significantly reduced.
The tensile strength of the core can be used to determine the residual tensile strength of
the pipe. A solid cylindrical core is cut from either a concrete or asbestos cement pipe section.
The core is then subjected to a compressive load along its axis while the ends are constrained.
By constraining the ends, the stress state in the core can be resolved in 2D allowing the
residual tensile strength of the core to be calculated. The core is tested to failure.
By measuring the current tensile strength of the core and comparing that to values for
virgin pipe, the rate of deterioration of the cement matrix can be estimated and applied to
predict the time to failure of the pipe under known operating and installation conditions.
The phenolphthalein and carbonation tests can be used prior to this test to give an
indication of the depth of free lime depletion through the pipe wall (see Phenolphthalein
Indicator review).
F32.3 Application
Indirect tensile strength testing is a method for obtaining the residual tensile strength of
cementituous pipes in water and wastewater networks. The test procedure for this tool is based
on the following standard;
AS 1012.10 – 2000 “Determination of indirect tensile strength of concrete cylinders
(‘Brazil’ or split test) and ASTM C-496-96 “Standard Test Method for Splitting Tensile
Strength of Cylindrical Concrete Specimens”
F32.4 Practical considerations
This is a new test method and had yet to be adopted widely by industry.
F32.5 Advantages
•
Tool can be used to predict the remaining life of a cementituous pipe asset.
F32.6 Limitations
This is a new test that is not widely used. The pipe must be exhumed for removal of test
sample, and the pipe repaired or pipe section replaced.
F-92
Testing of asbestos cement pipe samples is subject to health and safety considerations.
Table F-34. Summary Indirect Tensile Strength Testing.
Technical
selection
Criteria
Assets covered
Material type
Service area
Access requirements
Limitations relating to asset condition
Limitations relating to asset size/geometry
Continuous/discrete
Destructive/non destructive
Interruption to supply/function
Technical
suitability
Assessment parameters
Integration with software tools
Commercialization of tool
Previous/existing use of the tool in sector
Utility technical
capacity
Accuracy/reliability
Ease of validation of results
Asset management sophistication required
Skills required (level of tool sophistication); usability
Technology required (level of tool sophistication)
Documentation
Availability of technical support
Economic factors
Cost per inspection
Resource requirements
Assessment
Pipe.
Asbestos cement, concrete.
Potable and wastewater.
Need access to pipe surface to remove core
sample.
No restrictions due to asset condition, pipe
lining /coatings need to be removed prior to
testing.
No restriction.
Discrete.
Destructive.
Pipe must be taken off-line to extract core
sample.
Tensile strength.
None.
Technique is new and only provided by
specialized consulting groups.
Limited; utilized in condition assessment of
several AC wastewater pressure mains.
Quantitative.
Direct measurement.
Generic approach.
Service is provided by specialized consulting
groups.
Low tech.
AS 1012.10 – 2000 and ASTM C-496-96.
Service is provided by specialized consulting
groups.
Depends on level of analysis required.
Personnel and equipment required to remove
cores. Test and lab equipment.
F32.7 Bibliography
1. Davis, P., De Silva, D., Gould, S. & Burn, L.S. Condition assessment and failure
prediction for asbestos cement sewer mains, presented to Pipes Wagga Wagga 2005 Conf.,
Charles Sturt University, Wagga Wagga, NSW, Australia, 17–20 October, 2005
2. AS 1012.10 – 2000 “Determination of indirect tensile strength of concrete cylinders
(‘Brazil’ or split test)
3. ASTM C-496-96 “Standard Test Method for Splitting Tensile Strength of Cylindrical
Concrete Specimens”
Condition Assessment Strategies and Protocols for Water and Wastewater Utility Assets
F-93
F33.0 Infiltration and Inflow – Sewer Flow Survey
F33.1 Overview
Sewers flow surveys are often used to calibrate hydraulic models (see Hydraulic
Modeling review), but they can also be used to determine where infiltration of groundwater or
inflow of water (other than infiltrated groundwater such as rain water) into the system is a
problem. Specialized flow surveys can be used to locate the areas of the system where the
flows originate and estimate their magnitude.
The aim of a flow survey is to obtain actual flows in the sewer system during both dry
and wet weather conditions. A calibrated hydraulic model can also be used to analyze scenarios
for reducing infiltration through various interventions.
F33.2 Main Principles
Infiltration and inflow (I&I) are important because water from these extraneous sources
reduces the available capacity of sewer systems and capability of treatment facilities to treat
waste waters. Infiltration occurs when existing sewer lines are poorly designed and
constructed, or undergoes material and joint deterioration allowing groundwater to enter.
Inflow may occur when rainfall enters the sewer system through direct connections such as
drains, sump pumps, manhole covers and indirect connections with storm sewers.
Flow surveys can be used to identify parts of the system where I&I flows originate and
estimate their magnitude. To do this, the utility must first identify if the sewerage system has
problems through review and analysis of existing flow records such as treatment plant influent
data, pump run time data, overflow locations and estimated amounts, customer complaints, etc.
The system is then divided into subsystems and the key manholes located at the outlet
of each subsystem. Flows to these key manholes are monitored and compared to the expected
sewer flows from the subsystems.
Once the problem subsystems are identified, physical inspection, rainfall data, and
rainfall simulation are used to further define the I&I problem. Smoke testing, visual and CCTV
inspections (see Smoke Testing, Visual Inspection and CCTV Visual Inspection reviews
respectively) can then be undertaken to provide to identify and prioritize the repair and/or
rehabilitation if an intervention is deemed appropriate.
F33.3 Application
I&I sewer flow surveys are used to obtain a better understanding of I&I issues in
wastewater networks. There are no Standards which require the use of I&I flow surveys
F33.4 Practical considerations
Flow surveys have a wide application in the water sector and can be undertaken either
in-house or through specialist contractors/consultants.
Groundwater maps can be constructed for high, medium and low water levels and
overlaid with asset depth data to help isolate areas of interest.
Flow meters should be selected that record both the depth and velocity of flow. Once
data is collected it should be analyzed to give several flow parameters including
average dry-day flow, maximum and minimum diurnal flow, inflow, rainfall-induced
infiltration, seasonal infiltration, etc.
A calibrated hydraulic model can also be used to analyze scenarios for reducing I&I
through various interventions strategies.
F-94
F33.5 Advantages
I&I flow surveys allow the detection of excessive flows and the targeting of capital
investment to solve operational issues in sewer networks and treatment plants.
Identification of I&I problems can allow for rehabilitation and/or replacement to reduce
the stress of pipe systems and treatment plants.
F33.6 Limitations
Identification of the problem through flow surveys and analysis does not necessarily
lead to solutions.
Reduction in I&I though capital investment in sewerage infrastructure has a variable
impact.
Other interventions and drivers need to be considered in conjunction with the results of
I&I studies.
Table F-35. Summary Infiltration and Inflow – Sewer Flow Survey.
Technical
selection
Technical
suitability
Criteria
Assets covered
Granularity
Service area
Focus of analysis
Scalability of tool/approach
Commercialization
Previous/existing use of the tool
Ease of validation
Flexibility with respect to analysis (asset types) and
granularity (system, asset level)
Integration with other tools/GIS
Utility technical
capacity
Asset management sophistication
In-house skills required
Technology required
Documentation
Data Requirements
Linking to asset data
Availability of software and technical support
Usability
Assessment
Wastewater networks.
Spatially drainage area and below.
Wastewater
I&I.
Scaleable; survey approach can be used for any
size company.
Framework approach; commercial survey
services could be contracted.
Wide application.
Validity depends on the quality of hydraulic
models and, in turn, the quality of flow and other
data; independent validation difficult.
Wastewater; asset to sub-system level.
Flow data could be analyzed in GIS framework
as well as hydraulic models.
Generic approach.
Professional engineering skills required.
PC based analysis; modern flowmeters.
A range of papers written on approach.
High; data is needed to identify areas.
N/A
N/A
N/A
Condition Assessment Strategies and Protocols for Water and Wastewater Utility Assets
F-95
F33.7 Bibliography
1. Vass, R. Pugh, A, Inflow and Infiltration Study, Ozwater 2003, Proceedings AWA 20th
Convention, Perth, April 2003
2. Ellis, J. B Sewer inflitration/exfiltration and interactions with sewer flows and
groundwater quality. 2nd International Conference Interactions between sewers, treatment
plants and receiving waters in urban areas – Interurba II 19-22 Feb. 2001, Lisbon, Portugal,
311-319, 2001
3. Joannis, C., Commaille, J-F and Dupasquier, B. Assessing infiltration flow-rates into
sewers, Proceedings 9th ICUD, Global Solutions for Urban Drainage, Portland, USA, 2003
4. Berthier, E., Andrieu, H, Fasquel, M and Creutin, J-D. Generation of flows in urban
stormwater drainage systems: The role of soil, 2001
http://www.lcpc.fr/en/sources/blpc/pdf/bl231-079-en.pdf
F-96
F34.0 In-Pipe Acoustic Inspection Tools (Sonar)
F34.1 Overview
CCTV inspection is the industry standard technology for measuring the internal
condition of sewers and stormwater pipes. However, this technique is limited in that it only
allows inspection above the flow line – interpretable CCTV images can not be obtained below
the flow line due to the turbidity of sewage (see CCTV Visual Inspection review).
An alternative technique, sonar, also provides pictorial evidence of sewer condition.
Unlike CCTV, sonar can be used in full sewers, or to inspect the sewer beneath the flow line.
Sonar can also be used to give an image of the sewer above the flow line. However, different
transducers and electronics are required for operation in air and water. As such, sonar suitable
for below the flow line can not give an image of the sewer above the flow and vice versa.
During the survey, a sonar head is introduced into the sewer on a suitable module (a
tractor, crawler, float, etc.). The head transmits ultrasonic signals that are reflected from the
surface of the sewer; the reflected signals are detected by the head. The time delay associated
with the reflected signal is used to generate a profile of the pipe surface.
Sonar can generate a real time 360-degree outline of the interior of a full pipe, or the
outline of the wetted area in a partially full pipe (or the non-wetted area for air sonar).
In the case of a partially full pipe, sonar can be used in conjunction with CCTV to
allow inspection of the entire sewer, with sonar being used to provide information about the
sewer condition below the flow line.
Sonar inspection has been utilized mainly in sewer pipelines. In water mains, the
resolution of the inspection technique is not sufficient to detect small defects that are
significant in pressure applications. Furthermore, other competing inspection technologies
(including leakage detection) can provide the required information. Nevertheless, the principle
of sonar inspection can still be used to measure the distance to the pipe wall.
Acoustic systems for flaw detection are also available that are based on detecting
vibrations and other phenomena caused by the spreading of mechanical sound waves, and are
suitable for detecting cracks and for determining the state of connections and pipe bedding.
F34.2 Main Principles
Sonar technology involves the emission of an acoustic pulse from a transducer and the
subsequent detection of the pulse echo reflected from a surface. The time between the
transmission and reception of the acoustic signal can be used to determine the distance from
the transducer to the surface that reflected the pulse.
Sonic pulses are reflected from any acoustic impedance boundary. The greater the
difference in the impedance of two materials, the more sonic energy is reflected. The
impedance mismatch between water and the wall of a pipe, between air and the pipe wall, or
the interface between air and water are all excellent sonic reflectors.
In the case of sewer inspection, the sonar transducer is mounted in an appropriate
housing and towed (or propelled) through the sewer. An acoustic signal is transmitted radially
toward the sewer wall using a rotating transducer. By analyzing the received echo, the distance
from the transducer to the wall can be calculated.
As the inspection progresses, the signal is analyzed to generate images of the sewer’s
interior perimeter in real time. The profile is displayed on a monitor and allows features such
Condition Assessment Strategies and Protocols for Water and Wastewater Utility Assets
F-97
as the pipe wall, displaced bricks and silt/growths to be identified. Results can be recorded on
video or digitally.
When used in conjunction with CCTV equipment, the sonar tool is suspended in the
sewage below the rig. CCTV images are taken of the sewer above the flow line, and sonar
allows inspection below the flow line.
In some applications (for example, inspection of furnace tubes), this technology is used
to give a measure of both the internal pipe geometry and the thickness of the wall. Thickness
measurement is achieved because, on arrival at the tubing wall a portion of the sound pulse
energy reflects back towards the transducer, while a fraction of the energy propagates into the
steel tube wall. At the outer tube surface a similar reflection occurs, sending energy back in the
direction of the inner wall and transducer.
On-board digital signal processing of the returned echoes determines the ‘time of flight’
in the tubing wall. The time between the transmission and reception of the acoustic signals are
then used to compute the tubing wall thickness and radial measurement based on the known
acoustic propagation properties of the tubing material.
F34.3 Application
The primary use for sonar equipment is to inspect and assess the structural condition of
otherwise inaccessible or flooded sections of large diameter sewers. The technology is applied
to inspection of pipes in the process industry and could be adopted for inspection of water
mains, though competing technologies are available for this application.
Acoustic systems based on detecting vibrations and other phenomena caused by
mechanical sound waves, are suitable for detecting cracks as well as for determining the state
of connections and pipe bedding.
F34.4 Practical considerations
Sonar inspection is a commercially developed technology, which provides a practical
alternative to CCTV in large diameter or surcharged mains.
The precision of sonar inspection is a function of several factors including the speed of
movement through the sewer, the quantity of suspended solids in the sewage, and the
degree of turbulence:
−
−
−
Under ideal operating conditions using slow forward advancement, sonar could
indicate small openings or cracks, around 5 mm wide. Under normal operating
conditions, however, very small defects may not be seen. The sonar image will,
however, identify those defects clearly requiring action.
Heavy suspended solids and debris in the sewage can block the sonar signal.
Incoming flow from connections causes air entrainment in the main sewer
downstream of the connection. The entrained air bubbles tend to block the sonar
signal, and as a result interference may be seen in the image.
When combined with CCTV, sonar allows an inspection of the entire sewer, with sonar
providing the images below the flow line. A large number of combined sonar and
CCTV surveys have been undertaken in North America.
The ultrasonic calliper and the rotating sonic calliper rotator (RPC) are examples of
commercially available tools. The RPC has been used to inspect plastic, concrete, brick
and clay pipes. It can be operated in pipes as small as 0.5 m or as large as 4 m. The
RPC cannot operate in both air and water simultaneously, because different electronics
F-98
and transducers are needed. It records only the part of the pipe that is above water, or
the part that is below water level.
Studies in the United States showed that air sonar used for measurement above the flow
line was not sufficiently accurate over the larger distances involved in 3.6 m diameter
pipes to allow valid condition assessment.
F34.5 Advantages
Sonar provides a convenient way to measure the cross-sectional area of a sewer.
Sonar can be used to inspect and assess the structural condition of otherwise
inaccessible or flooded sections of large diameter sewers.
Sonar allows inspection of the portion of the sewer below the flow line. When
combined with CCTV, sonar allows an inspection of the entire sewer, with sonar
providing images below the flow line.
F34.6 Limitations
The technique requires specially trained personal to undertake the inspection and
interpret the results.
Sonar can not be operated in air and water simultaneously, as different transducers and
electronics are required.
Sonar is a more specialized service than CCTV, with less service providers.
Table 3-36. Summary In-Pipe Acoustic Inspection Tools (Sonar).
Technical
selection
Technical
suitability
Utility technical
capacity
Economic
factors
Criteria
Assets covered
Material type
Service area
Access requirements
Limitations relating to asset condition
Limitations relating to asset size/geometry
Continuous/discrete
Destructive/non destructive
Interruption to supply/function
Assessment parameters
Integration with software tools
Commercialization of tool
Previous/existing use of the tool in sector
Accuracy/reliability
Ease of validation of results
Assessment
Pipes.
Any.
Potable and wastewater.
Access to sewer interior is required.
Sewer must be passable.
Limited to large diameter pipes.
Continuous.
Non-destructive.
Inspection can be undertaken on-line.
Sewer defects and geometry.
Software used to process signals.
Fully commercialized.
Wide use, especially in conjunction with CCTV.
Semi-quantitative indication of defects.
Validation through direct observation required.
Asset management sophistication required
Skills required (level of tool sophistication); usability
Technology required (level of tool sophistication)
Documentation
Availability of technical support
Cost per inspection
Generic approach.
Highly skilled.
Highly technical.
Service likely to be provided by third party.
Service likely to be provided by third party.
Varies depending on pipe size, accessibility and
purpose of survey.
Requires team to operate equipment and provide
entry into pipeline.
Resource requirements
Condition Assessment Strategies and Protocols for Water and Wastewater Utility Assets
F-99
F34.7 Bibliography
1. ASCE, Sanitary Sewer Overflow Solutions, American Society of Civil Engineers, EPA
Cooperative Agreement CP-828955-01-0, April 2004
2. McDonald, S.E.; Zhao, J.Q. Condition assessment and rehabilitation of large sewers,
National Research Council of Canada, Institute for Research in Construction, NRCC44696, 2001 (downloaded from www.nrc.ca/irc/ircpubs)
3. Ratliff, A., An overview of current and developing technologies for pipe condition
assessment, ASCE 2004
4. Zhao, J. Q. Trunk Sewers in Canada, APWA International Public Works Congress
NRCC/CPWA Seminar Series “Innovations in Urban Infrastructure,” 1998
F-100
F35.0 In-Pipe Hydrophones
F35.1 Overview
Water loss control programs are widely used throughout the water industry and a major
phase of these programs is leak detection. Leak detection is used to determine the exact
location of a leak. Repair of the leak saves revenue and conserves water and energy.
To locate a leak precisely, a hydrophone can be inserted directly into a pipe. Leaks are
identified by the noise they create. Once a leak is identified, it can be located by moving the
hydrophone to the position where the noise is clearest, then determining the location of the
hydrophone at this point.
F35.2 Main Principles
Hydrophones are used to detect leaks due to the noise created as the water is forced out
under pressure through the pipe wall. Leaks generally make three sounds, a medium frequency
sound, 500-800 Hz, associated with the water passing through the orifice/leak, and two low
frequency noises, 20-300 Hz, associated with the water stream impacting the soil and
circulating outside of the pipe (Burn et al, 1999). The sound of the leak is also able to give an
indication of leak magnitude.
Hydrophones are generally tethered systems, although some free swimming
technologies are also available. In either case, an underwater microphone is inserted into a pipe
and moves along the pipe with the flow. The hydrophone is introduced to the pipe via a valve
and tapping made for the purpose of the inspection. There is also potential to utilize existing
access points provided by hydrants or fittings.
F35.3 Application
Hydrophones are used for the detection of leaks in water distribution and transmission
pipelines. Research has also been undertaken into the use of the technology for pressurized
sewers (force mains).
There are no a standards for In-Pipe Hydrophone use.
F35.4 Practical considerations
A tethered system offers the least risk of inspection systems getting stuck, zero or
minimal supply disruption, and requires a single access point for entry and recovery of
the hydrophone.
A new system is also available where the hydrophone and recording equipment is
encapsulated into a single unit that is inserted into the main without a tether and
collected down stream. The recorded data can then be downloaded and analyzed.
Non-tethered or free-flying systems have the potential to cover much greater range of
the pipe network during each use; however there is a risk of losing the tool. Tethered
hydrophones can become fouled in valves and have limited range, and require a
minimum flow rate to pull them along the main.
For tethered systems, when a leak is detected the hydrophone can be moved back along
the pipeline in order to pinpoint the leak.
Currently, the most widely used commercial system is SaharaTM. This tool has been in
operation within North America since 2004. It was developed by the Water Research
Centre (WRc) in the United Kingdom.
Condition Assessment Strategies and Protocols for Water and Wastewater Utility Assets
F-101
F35.5 Advantages
As an in-pipe technique, factors like pipe material and diameter do not influence the
detection of leaks, as they do in on-pipe techniques (see Leakage Detection).
Tethered hydrophone technology can be used to accurately pinpoint leaks.
Non-tethered systems can survey a large length of pipe than tethered systems in each
use.
F35.6 Limitations
The Sahara technology is relatively expensive, so other techniques and equipment
should be used to target and prioritize area to identify where it would be most useful.
Tethered hydrophones can become fouled in valves and have limited range, and require
a minimum flow rate to pull them along the main.
There is a risk of losing free swimming hydrophones.
Table F-37. Summary In-Pipe Hydrophones.
Technical
selection
Technical
suitability
Utility technical
capacity
Economic factors
Criteria
Assets covered
Material type
Service area
Access requirements
Limitations relating to asset condition
Limitations relating to asset size/geometry
Continuous/discrete
Destructive/non destructive
Interruption to supply/function
Assessment parameters
Integration with software tools
Commercialization of tool
Previous/existing use of the tool in sector
Accuracy/reliability
Ease of validation of results
Asset management sophistication required
Skills required (level of tool sophistication); usability
Technology required (level of tool sophistication)
Documentation
Availability of technical support
Cost per inspection
Resource requirements
Assessment
Pipelines.
Any.
Potable.
Hydrophones need special assemblies to allow
entrance into main.
None.
Restricted to large diameter mains.
Continuous.
Non-destructive.
Inspection be undertaken on-line.
Presence and location of leaks.
Software used to analyze data.
Fully commercialized service.
Used in the United States since 2004.
Quantitative assessment of location, semiquantitative assessment of leak size.
Only through excavation at leak site.
Generic approach.
Specialist service.
Sophisticated tool.
Use reported in the technical and trade literature.
Via specialist service providers.
Relatively expensive.
Team to undertake survey and patented
equipment.
F35.7 Bibliography
1. Chastain-Howley, A Transmission Main Leakage: How to reduce the risk of a catastrophic
failure, Leakage 2005 - Conference Proceedings, 2005
2. Sahara homepage, http://www.wrcplc.co.uk/sahara/, accessed 2006
F-102
F36.0 Insulation Test
F36.1 Overview
Overtime the performance of the insulation in an electrical circuit may deteriorate with
exposure to heat, moisture, vibration or corrosive materials. Deteriorated insulation allows a
steady flow of electricity to escape from the electrical circuit during operation. This can lead to
equipment failure. Potentially dangerous voltages can become present if protective measures
are inadequate.
The procedure for determining equipment insulation resistance is widely used and readily
understood by trained electrical technicians, can be easily undertaken by using a hand held
testing device and is a non-destructive assessment technique.
F36.2 Main Principles
As part of an electrical and conditioning monitoring program, electrical insulation
testing is commonly undertaken to determine the insulation resistance of electrical circuits,
since the efficiency and running costs of equipment are increased when electrical circuits
exhibit poor insulation properties.
In order to assess an electrical circuit for its electrical insulation performance, a hand
held megaohmmeter is used to test the insulation resistance by applying a known voltage
(500V or 1000V DC for low voltage systems) to the circuit being assessed and measuring the
current flow to ground. From this measurement the resistance of the equipment insulation can
be determined, with a result exhibiting a low resistance between phases or phase to earth
indicating that insulation breakdown may be occurring, or moisture ingress and/or partial short
circuits may be present. The DC test voltage is applicable to both AC and DC circuits.
F36.3 Application
Electrical insulation testing is a commonly used and recognized technique for assessing
electrical circuits and equipment insulation performance in motor windings, cables,
switchboards and motor control centers.
Insulation testing is referred to in AS/NZS 3000-2000.
F36.4 Practical Considerations
Insulation testing to determine the condition of electrical equipment and circuits should
be undertaken by trained electrical technicians and engineers, since knowledge and
experience of electrical circuits and interpretation of the readings obtained from the
analysis is required.
F36.5 Advantages
Insulation testing is common practice, inexpensive and easy to use.
F36.6 Limitations
When determining the insulation resistance, the piece of equipment or circuit is
required to be isolated prior to assessment and as a result can not be undertaken as an
on-line assessment technique.
When assessing electrical motors, minor faults may not be identified and sensitive
equipment must be disconnected to avoid possible damage.
Condition Assessment Strategies and Protocols for Water and Wastewater Utility Assets
F-103
Table F-38. Summary Insulation Test.
Technical
Selection
Criteria
Assets covered
Material type
Service area
Access requirements
Limitations relating to asset condition
Limitations relating to asset size/geometry
Continuous/discrete
Destructive/non destructive
Technical
suitability
Utility technical
capacity
Economic factors
Interruption to supply/function
Assessment parameters
Integration with software tools
Commercialization of tool
Previous/existing use of the tool in sector
Accuracy/reliability
Ease of validation of results
Asset management sophistication required
Skills required (level of tool sophistication); usability
Technology required (level of tool sophistication)
Documentation
Availability of technical support
Cost per inspection
Resource requirements
Assessment
Motor winding, cables, switchboards, motor
control centers.
Electrical insulation.
Potable and wastewater.
Access to conductor and insulation.
None.
None.
Discreet readings.
Non-destructive (providing electronic
components isolated).
None.
Insulation strength.
Stand alone.
Fully developed and off the shelf.
Standard sector practice.
Good accuracy.
Direct measurement.
Generic approach.
Electrician will already be trained to use.
None.
Well documented. Electric motor.
N/A
Low cost per inspection
One man no more than half an hour per motor
(allows for disconnection/reconnection).
F36.7 Bibliography
1. AS NZS 3000-2000 Electrical Installations (known as wiring rules)
F-104
F37.0 Intelligent Pigs
F37.1 Overview
Intelligent pigs use different technologies to locate defects or gather other information
about large diameter pipelines. Several non-destructive inspection technologies can be
integrated into these tools:
The Magnetic Flux Leakage technique, used to detect corrosion or thin walls.
Ultrasonic sensors, used to detect coating delamination, cracks, dents and gouges.
Global Positioning System (GPS) technology is being adapted to obtain the exact
location of any problem in the pipe or to map the pipe itself.
Geometry tools, which use mechanical arms or electro-mechanical means to measure
the bore of pipe. In doing so, the tool identifies dents, deformations, and ovality. It can
also sense changes in girth welds and wall thickness. In some cases, these tools can also
detect bends in pipelines.
F37.2 Main Principles
A pig is a device inserted into a pipeline that travels freely driven by the flowing media
to do a specific task within the pipe, such as cleaning. An intelligent pig carries complex
monitoring technologies that provide information on the condition of the pipe and/or its
contents. With a few exceptions, intelligent pigs simply gather data, which is then analyzed by
engineers to determine and report on the condition of the pipe.
Intelligent pigs are inserted into the pipeline at a location that has a special
configuration of pipes and valves where the tool can be loaded into a receiver. The receiver can
then be closed, sealed, and the flow of the pipeline product directed to launch the tool into the
main line of the pipeline.
A similar setup is located downstream, where the tool is directed out of the main line
into a receiver. The tool is then removed and the recorded data retrieved for analysis and
reporting.
The two most common requirements are for tools that can undertake geometry/diameter
measurement and detect metal-loss/corrosion. However, the information that can be provided
by these tools covers a much wider range of inspection and troubleshooting needs, including:
Diameter/geometry measurements
Curvature monitoring
Pipeline profile
Temperature/pressure recording
Bend measurement
Metal-loss/corrosion detection
Photographic inspection
Crack detection
Wax deposition measurement
Leak detection
Product sampling
Mapping
Condition Assessment Strategies and Protocols for Water and Wastewater Utility Assets
F-105
Three common technologies incorporated into smart pigs are described further below.
Geometry Tools: Geometry tools use mechanical arms or electro-mechanical means to
measure the bore of pipe. In doing so, the tool identifies dents, deformations, and other
variation is cross-section. It can also sense changes in girth welds and wall thickness. In some
cases, these tools can also detect bends in pipelines.
Ultrasonic Tools: There are two types of tools commonly used for inspections of
hazardous liquid pipelines based on ultrasonic measurements.
Compression Wave Ultrasonic Testing (UT) tools measure pipe wall thickness and
metal loss. The first commercial application of UT technology used compression
waves. These tools are equipped with transducers that emit ultrasonic signals
perpendicular to the surface of the pipe. An echo is received from both the internal and
external surfaces of the pipe and, by timing these return signals and comparing them to
the speed of ultrasound in pipe steel, the wall thickness can be determined.
Shear Wave Ultrasonic Testing (also known as Circumferential Ultrasonic Testing, or
C-UT) is the non-destructive examination technique that most reliably detects
longitudinal cracks, longitudinal weld defects, and crack-like defects (such as stress
corrosion cracking). Because most crack-like defects are perpendicular to the main
stress component (i.e., the hoop stress), UT pulses are injected in a circumferential
direction to obtain maximum acoustic response.
Magnetic Flux Tools: There are two types of tools commonly used for inspections of
pipelines based on magnetic flux measurements (for more information see Magnetic Flux
Leakage review).
Magnetic Flux Leakage (MFL) tool: an electronic tool that identifies and measures
metal loss (corrosion, gouges, etc.) through the use of a temporarily applied magnetic
field. As it passes through the pipe, this tool induces a magnetic flux into the pipe wall
between the north and south magnetic poles of onboard magnets. A homogeneous steel
wall – one without defects – creates a homogeneous distribution of magnetic flux.
Anomalies (i.e. metal loss (or gain) associated with the steel wall) result in a change in
distribution of the magnetic flux, which, in a magnetically saturated pipe wall, leaks out
of the pipe wall. Sensors onboard the tool detect and measure the amount and
distribution of the flux leakage. The flux leakage signals are processed, and resulting
data is stored onboard the MFL tool for later analysis and reporting.
A Transverse MFL/Transverse Flux Inspection tool (TFI) identifies and measures metal
loss through the use of a temporarily-applied magnetic field that is oriented
circumferentially, wrapping completely around the circumference of the pipe. It uses
the same principal as other MFL tools except that the orientation of the magnetic field
is different (rotated 90°). The TFI tool is used to determine the location and extent of
longitudinally-oriented corrosion. This makes TFI useful for detecting seam-related
corrosion. Cracks and other defects can be detected also, though not with the same level
of reliability. A TFI tool may be able to detect axial pipe wall defects – such as cracks,
lack of fusion in the longitudinal weld seam, and stress corrosion cracking – that are not
detectable with conventional MFL and ultrasonic tools.
F37.3 Application
Intelligent pig technology is generally used for inspection of large diameter steel
pipeline assets in the oil and gas sector.
F-106
These tools only have limited applicability to the water/wastewater industry, although
some critical steel mains may be candidates for intelligent pig technology.
F37.4 Practical considerations
In selecting the tools most suitable for in-line inspections, pipeline operators must know
the type, thickness and material of the pipe being measured; the types of defects that the
pipe might be subject to (e.g. internal corrosion, external corrosion, weld cracks, stress
corrosion cracks); and the risk presented by the pipe section being measured.
Intelligent pigs are expensive devices that require specialized insertion and retrieval
arrangements. These are commonly designed into oil and gas pipelines, but are not
incorporated into the design of water transmission mains.
Intelligent pigs are commercialized and widely used in the oil and gas sector. It is
unlikely that there will be widespread use of pigging in the water sector because of the
high capital cost of pig launch/recovery equipment, discoloration problems caused by
abrasion as the pig passes along the line, and the obstructions in many transmission
pipes due to corrosion, valve construction, and changes in size.
Pigging would also require the main to be taken out of service for some hours.
Some of the new pigs are able to alter size to allow them to be used for multi-diameter
pipes (Willke, 1998).
F37.5 Advantages
High resolution intelligent pigs can accurately detect, size, and locate corrosion or any
other anomalies in pipelines. Once the problem is detected the information can be used
to develop a pipeline de-rating schedule, implement a repair or replacement program,
determine if re-inspection is necessary, and evaluate effectiveness of a corrosion
inhibitor program (Jones et al, 1995).
F37.6 Limitations
Intelligent pigs are expensive devices that need specialized insertion and retrieval
structures. Traditionally they have been used in the gas and oil industry and will only
have only limited applicability to the water/wastewater industry.
Condition Assessment Strategies and Protocols for Water and Wastewater Utility Assets
F-107
Table F-39. Summary Intelligent PIGS.
Technical
Selection
Criteria
Assets covered
Material type
Service Area
Access requirements
Limitations relating to asset condition
Limitations relating to asset size/geometry
Continuous/discrete
Destructive/non destructive
Interruption to supply/function
Technical
suitability
Assessment parameters
Integration with software tools
Commercialization of tool
Previous/existing use of the tool in sector
Accuracy/reliability
Ease of validation of results
Utility technical
capacity
Economic factors
Asset management sophistication required
Skills required (level of tool sophistication);
usability
Technology required (level of tool
sophistication)
Documentation
Availability of technical support
Cost per inspection
Resource requirements
Assessment
Pipelines.
Large diameter pipes of rigid material; more suited to
welded steel.
Potable.
Require specialized insertion point (pig traps) to avoid
interruption to flow.
Asset needs to be in relatively good condition to avoid
the pig getting stuck.
Pigs are generally designed for large diameter pipes.
Changes in diameters, including those associated
with valves and other fittings, can be an issue
Smart/intelligent pigs provide continuous readings for
a variety of factors.
Non-destructive technique.
Pigs are propelled by the product flow, so no
interruption is required. However, likely to cause
quality issues in water mains. Also, there must be
appropriate launch facilities for uninterrupted function.
Most common requirements are for
geometry/diameter measurement and for metalloss/corrosion.
Specialized software tools used to interpret data.
Large number of commercial providers.
Originally developed to remove deposits in pipes.
Now used for a wide variety of purposes. Limited use
in water sector.
Quantitative assessment.
Only through visual assessment; though calibration of
tools is done.
Associated with high levels of sophistication
Smart pigs require trained specialists.
Highly sophisticated tool that requires specialized
technology.
Large range of product information available.
Large number of providers all offering support.
Relative high cost.
More advanced pigs require specialists to deploy.
F37.7 Bibliography
1. http://www.ppsa-online.com/about-pigs.php, accessed 2005
2. Willke, T. Five technologies expected to change pipe line industry, Pipe line & gas
industry, vol. 81, No 1, pp. 36-37, 1998
3. Jones, D.G., Dawson, S.J., and Brown, M. Smart Pigs Assess Reliability of Corroded
Pipelines, Internal Pipeline Corrosion Assessment, Pipeline & Gas Journal, March 1995
F-108
F38.0 KANEW
F38.1 Overview
KANEW is a software tool used in strategic asset management that estimates lengths of
water distribution mains to be rehabilitated or replaced each year.
KANEW contains a network inventory module, a failure and break forecasting module,
an economic data module and a strategy comparison module. Through these modules,
KANEW predicts when select pipe sections will reach the end of their service lives,
differentiated by date of installation and by type of pipe sections with distinctive life-spans.
F38.2 Main Principles
KANEW is a cohort survival model for infrastructure developed at Karlsruhe
University, used to predict future rehabilitation needs for water infrastructure. Based on this
approach, Dresden University of Technology developed a Windows based software application
called KANEW, which was tested in an AwwaRF Research Project "Quantifying Future
Rehabilitation and Replacement Needs of Water Mains" (Arun et al, 1998). Essentially,
KANEW evaluates groups of pipes of the same material and diameter (i.e., cohort groups) and
estimates the percentage of pipes in each group requiring replacement or rehabilitation each
year.
The general framework of the KANEW approach is shown in Figure F-6.
Failure statistics
Network
Inventor
y
Pipe types
Pipe lifetimes
Ageing functions
Cohort survival model
Options of rehabilitation
Decision
crite
for
rehab
strategies
ri
a
Economi
input
c
data
Choice of best rehabilitation strategy
Figure F-6. Framework for Exploring Network Rehabilitation Strategies
(Adapted with permission from Stone, S., Dzuray, E. J., Meisegeier, D., Dahlborg, A-S., and Erickson, M., 2002).
The tool assumes service-life to be a random variable, starting after some time of
resistance and being characterized by a median age and a standard deviation, or age that would
be reached by a certain percentage of the most durable pipe section.
KANEW allows the user to calculate residual service lives and annual rehabilitation
needs of water pipes on the basis of their specific service life distributions. Specific
rehabilitation programs, defined for the medium term, can be analyzed with respect to their
economic and other long-range effects. An acceptable strategy is found through an
iterative/heuristic process.
Condition Assessment Strategies and Protocols for Water and Wastewater Utility Assets
F-109
F38.3 Application
KANEW is a Windows based software package, used to predict the future rehabilitation
needs for water pipeline networks.
F38.4 Practical considerations
KANEW has been used by water authorities in Germany and the United States to assess
and develop water main replacement and rehabilitation programs.
Data availability is a problem in some water utilities. The biggest issue is when there is
a data gap in historical water main rehabilitation and replacement. This data is required
for estimation of survival functions. As a result, a lack of data would introduce
considerable uncertainty into the survival functions for each category of water main.
Due to this and other sources of uncertainty, the software uses optimistic and
pessimistic assumptions to predict an upper and lower range of miles to be rehabilitated
or replaced for each category of water mains.
Version 1.0 is available with user manual for AwwaRF subscribers free of charge and
requires Microsoft Access 97 to run. It allows calculation of residual service lives and
annual rehabilitation needs of types of water main on the basis of their specific service
life distributions.
The current commercial version is an extended version allowing specific rehabilitation
programs to be defined for the medium range and to forecast their economic and other
effects on the long range.
F38.5 Advantages
KANEW can be used for planning water main rehabilitation and replacement strategies.
The model can be used both for pipeline renewal planning and for budgeting for future
renewals.
Windows based system that will run on a standard PC
F38.6 Limitations
KANEW is a macro model that estimates a broad range of lengths of water mains to be
rehabilitated or replaced each year. The model does not predict specific water mains
that should be rehabilitated or replaced each year.
The methodology adopted means that factors such as soil and pressure are not taken
into account.
F-110
Table F-40. Summary KANEW.
Technical
selection
Technical
suitability
Criteria
Assets covered
Granularity
Service areas
Focus of analysis
Scalability of tool/approach
Commercialization
Previous/existing use of the tool
Utility technical
capacity
Ease of validation
Flexibility with regard to analysis (asset types)
and granularity (system, asset level)
Integration with other tools/GIS
Asset management sophistication
In-house skills required
Technology required
Documentation
Data Requirements
Linking to asset data
Availability of software and technical support
Usability
Assessment
Water pipes.
System and sub-system level only.
Potable
KANEW is a cohort survival model for infrastructure
to predict future rehabilitation needs for water
infrastructure.
KANEW can be used for planning water main
rehabilitation and replacement strategies. The
model is useful both for older utilities having an
urgent need for renewal plans, and younger utilities
budgeting for future renewal plans.
Commercial software available through AwwaRF.
Used by authorities in the United States and in
Germany.
Difficult to validate except by statistical means.
Potable only; cohort to system level.
None.
Since good data is required, more associated with
higher levels of asset management sophistication.
Professional engineer.
PC based, version 1.0 requires MS Access 97.
Tool fully documented.
Comprehensive data on pipe assets.
Linkage through database.
Available through AwwaRF and commercially.
KANEW has GUIs and is capable of providing 13
different sets of graphical and tabular outputs.
F38.7 Bibliography
1. Baur, R. and R. Herz Proceedings of the 13th European Junior Scientist Workshop held at
Dresden University of Technology on “Service life management of water mains and
sewers”. ISBN 3-86005-238-1, 1999
2. Deb, A.K., Hasit, Y.J., Grablutz, F.M. and Herz., RK. Quantifying future rehabilitation and
replacement needs of water mains. AwwaRF Research Report, 1998
3. Stone, S., Dzuray, E. J., Meisegeier, D., Dahlborg, A-S., and Erickson, M. DecisionSupport Tools for Predicting the Performance of Water Distribution and Wastewater
Collection Systems, EPA, EPA/600/R-02/029, 2002
Condition Assessment Strategies and Protocols for Water and Wastewater Utility Assets
F-111
F39.0 KureCAD
F39.1 Overview
KureCAD was developed by the Viatek Group in Finland and uses a GIS to assist in the
management of sewer pipe network rehabilitation. The system can store information on all
infrastructure assets, prioritize the rehabilitation of pipes, and provide the necessary documents
to implement rehabilitation.
F39.2 Main Principles
Once the KureCAD system contains all the necessary data, it enables managers to
assess system conditions and prioritize work. For each pipe section, the system enables users to
record three basic types of data:
Structural condition (strength and shape).
Functional condition (its ability to transport water).
Leakage rates (estimated leakage from the pipe).
Users can employ data from internal inspections or maintenance records to summarize
the pipe’s condition by assigning a score from 1 (good, no repairs required) to 4 (very bad,
needs to be repaired immediately). Users can also rate each pipe using other factors.
The system records whether the entered data is based on estimates or actual inspections.
The KureCAD system then combines all of the condition scores into one condition index
which is displayed via the GIS.
F39.3 Application
KureCAD is used to assist asset managers in identifying and prioritizing the
repair/rehabilitation of sewer pipes.
F39.4 Practical considerations
KureCAD is still under development but has been trialed in Europe. As the user
interface is based on GIS, a digital map of the network is required.
The KureCAD system provides instruction to ensure consistency for data collection
during field inspections and maintenance.
F39.5 Advantages
GIS approach to managing data and providing decision support.
The KureCAD software is able to generate the paperwork necessary to initiate
repair/rehabilitation work, including detailed maps specifications.
F39.6 Limitations
The tool is still in its development stages and at this point in time has only been trialed
in Europe.
If GIS data is not available then maps have to be manually digitized.
F-112
Table F-41. Summary KureCAD.
Technical
Selection
Suitability
Criteria
Assets covered
Granularity
Service area
Focus of analysis
Scalability of tool/approach
Commercialization
Utility technical
capacity
Previous/existing use of the tool
Ease of validation
Flexibility with respect to analysis (asset types) and
granularity (system, asset level)
Integration with other tools/GIS
Asset management sophistication
In-house skills required
Technology required
Documentation
Data Requirements
Linking to asset data
Availability of software and technical support
Usability
Assessment
Sewer pipes.
System and asset level.
Wastewater
Uses GIS to manage sewer pipe rehabilitation.
Prioritizes the rehabilitation of pipes and
provides the necessary documents to
implement the rehabilitation.
Better suited to medium to large authorities
where good GIS data is available.
Commercial software available from Viatek
Finland.
Used by several Scandinavian authorities.
Difficult to validate except by statistical means.
Wastewater; asset to system level.
Integrates with GIS system.
Aimed at higher level of asset management
where GIS data is available.
Professional asset manager/engineer.
PC based tool. Windows based operating
system.
Product in development.
GIS data required.
Through pipe IDs.
Unknown.
Still under development.
F39.7 Bibliography
1. Stone, S., Dzuray, E. J., Meisegeier, D., Dahlborg, A-S., and Erickson, M. DecisionSupport Tools for Predicting the Performance of Water Distribution and Wastewater
Collection Systems, EPA, EPA/600/R-02/029, 2002
Condition Assessment Strategies and Protocols for Water and Wastewater Utility Assets
F-113
F40.0 Leak Detection
F40.1 Overview
Water loss control programs are widely used throughout the water industry and a major
phase of these programs is leak detection. Leak detection is used to determine the exact
location of a leak in a pipeline. The repair of leaks saves revenue and conserves water and
energy.
Leak detection is currently undertaken using a number of techniques, including acoustic
techniques, tracer gas and infrared photography. Drop tests and in-pipe hydrophones are also
used and are discussed in separate reviews (see Drop Test and In-Pipe Hydrophones reviews).
Leak detection gives an indication of condition and performance of a network or asset,
depending upon the amount of leaks found.
District metered areas (DMA) are used to aid with leak detection of the distribution
system. Also, because DMAs can encompass portions of the transmission system, this
approach is also used as an aid to locating transmission system leaks.
F40.2 Main Principles
Leak detection is generally conducted after primary and secondary surveys that assess
areas of a network to determine their level of leakage, which is used to identify specific areas
in need of further investigation. Once small areas of the network have been identified as
containing significant leaks (through the use of various techniques, including data logging,
district meter area data audits, and monitoring of night flows), these are surveyed in more
detail to determine the exact location of the leaks.
A common technique to determine the location of leaks uses acoustic sensors to detect
the noise/vibration made by water escaping the pipe under pressure. Leaks generally make
three sounds, a medium frequency sound, 500-800 Hz, associated with the water passing
through the orifice/leak and two low frequency noises, 20-300 Hz, associated with the water
stream impacting the soil and circulating outside of the pipe (Burn et al, 1999). Acoustic
techniques can not detect very small leaks such as weeping and seepage from cracks and joints,
commonly referred to as background leaks.
There are two principal methods of detecting sounds from leaks; noise correlators and
data loggers:
Noise correlators are computer controlled systems that measure noise at either side of
the suspected leak location and locate the leak automatically.
Data loggers consist of units containing audible leak detection hardware coupled with a
data logger, radio transmitter and extended life battery (10+ years). These units are
installed at multiple locations around a pipe network for extended periods (from
overnight to indefinitely) and the data collected by the inspection team at regular
intervals.
While leak detection by this method can be conducted regardless of the pipe material,
plastic pipe materials tend to be “quieter” than metallic or cementituous materials and so make
it harder to detect leaks using acoustic methods.
Techniques such as the tracer gas are not yet widely used in the water industry. The
tracer gas technique involves the introduction of a non-toxic water-insoluble lighter-than-air
gas such as hydrogen or helium into the pipe system. These tracer gases escape at leaks and
F-114
permeate through the cover soil and pavement to be located by specialized gas detectors above
the leak.
The infrared photography technique or thermography is more commonly used and is
based on water having different thermal characteristics to the surrounding soil and in turn act
like a heat sink relative to the soil. Infrared scanners are the used to detect thermal anomalies
outside of the pipes. Devices used for this can be either hand held or vehicle mounted (Burn et
al 1999).
The use of thermography from fixed or rotary wing aircraft can identify potential areas
of leakage from water mains. The technique detects ground water anomalies (water escaping
from the main creates ‘wet’ patches on the ground) through infrared thermography. Arial
thermography can potentially cover large areas relatively quickly. The technique is limited by
ground conditions (it is not recommended in urban areas), the line of the main, the local ground
temperatures (compared to the water temperature), and local drainage.
Arial thermography can potentially cover large areas relatively quickly. In practice, the
aircraft has to fly a straight line along the main. At every change in course of the pipeline, a
fixed wing aircraft has to circle in order to obtain a level approach to the new line. Helicopters
are not limited as much because they can fly at lower levels and execute level turns, but unit
cost for helicopters are higher.
F40.3 Application
Large leaks in water distribution networks can be identified quickly as the amount of
water flowing from the pipe has noticeable affects at ground level. However, pipe assets which
contain small leaks do not release enough water for surface affects to be seen at ground level.
Leak detection techniques are used to locate these leaks.
There are no a standards for Leak Detection.
F40.4 Practical considerations
Leakage testing is widely used, both in the water and many other industries, although
techniques used vary.
Generally all techniques require some level of operator skill to obtain reliable results.
F40.5 Advantages
Active leak detection allows leaks that would otherwise have gone unnoticed to be
found.
Data logging techniques can be used to focus the search for leaks.
Arial thermography can potentially cover large areas relatively quickly.
F40.6 Limitations
Noise correlators and data loggers are less suited for use on non-metallic pipe materials
due to the pipe’s low sound propagation properties.
Detection success is sensitive to background noise levels.
Acoustic detectors do not detect weeping type small leaks.
Condition Assessment Strategies and Protocols for Water and Wastewater Utility Assets
F-115
Table F-42. Summary Leak Detection.
Technical
selection
Technical
suitability
Utility technical
capacity
Criteria
Assets covered
Material type
Service area
Access requirements
Limitations relating to asset condition
Limitations relating to asset size/geometry
Continuous/discrete
Destructive/non destructive
Interruption to supply/function
Assessment parameters
Integration with software tools
Commercialization of tool
Previous/existing use of the tool in sector
Accuracy/reliability
Ease of validation of results
Asset management sophistication required
Skills required (level of tool sophistication); usability
Technology required (level of tool sophistication)
Documentation
Availability of technical support
Economic factors
Cost per inspection
Resource requirements
Assessment
Pipes.
All, effectiveness depends on technique used.
Potable.
Noise correlators require access to the pipe; fire
hydrants are sufficient. Data loggers may need
to be located ‘on’ pipes, requiring excavation.
None.
None.
Continuous readings can be achieved.
Non-destructive.
Assessment should be conducted on-line.
Locates leaks.
Software packages used to interpret data
Tools are widely available in industry.
Techniques and tools are widely used.
Quantitative or semi-quantitative; accuracy is
dependant on the technique used.
Validated by exhuming the asset.
Higher levels of asset management
sophistication will generally result in more
efficient inspections but it is not required.
Operator needs to trained.
The level of technology required depends on the
technique to be used.
Techniques widely documented
Tools are supported by suppliers and by
consultants.
Depends on technique.
Requires teams to conduct surveys, actual
manpower depends on technique to be used.
F40.7 Bibliography
1. Burn. L. S., DeSilva. D., Eiswirth. M., Hunaidi. O., Speers. A. and Thornton. J. Pipe
Leakage – Future Challenges & Solutions, Pipes Wagga Wagga, 1999
2. Chastain-Howley, A (2005) Transmission Main Leakage: How to reduce the risk of a
catastrophic failure, Leakage 2005 - Conference Proceedings
3. Dingus, M., Haven, J. and Austin, R. (2002) Nondestructive None Invasive Assessment of
Underground Pipes, AwwaRF, USA
4. Eiswirth, M., Burn, L.S. (2001) New Methods for Defect Diagnosis of Water Pipelines, 4th
International Conference on Water Pipeline Systems, 28-30 March, York, UK, 2001
5. http://www.owue.water.ca.gov/leak/leaktech/leaktech.cfm, accessed 2005.
6. Makar, J. M. ; Chagnon, N. Inspecting systems for leaks, pits, and corrosion, National
Research Council of Canada, Institute for Research in Construction, NRCC-42802, 1999
(downloaded from www.nrc.ca/irc/ircpubs)
F-116
F41.0 Linear Polarization Resistance of Soil (Soil LPR)
F41.1 Overview
Linear Polarization Resistance of soil (LPR) is a characteristic used to predict the
corrosion rate of buried ferrous assets. LPR has a negative correlation with corrosion rate in
ferrous assets, meaning that soils with high LPR values will exhibit low corrosion rates.
The empirical relationship between LPR and corrosion rate was initially investigated
for cast iron, establishing a base relationship between corrosion rate and LPR. In a subsequent
study for wrought iron, a much weaker relationship was established, and there was too much
variation in measurements to fully establish a correlation. Consequently there is some debate
over the usefulness of LPR for materials other than cast iron.
F41.2 Main Principles
LPR is measured for soil samples obtained from near the location of interest, usually a
buried asset or its future location. Several methods are available for measurement of LPR, the
simplest of which will be described here. The soil samples are brought to their wilting point
before testing (the wilting point is defined as the soil moisture content at which plants are
unable to extract water and varies with soil type). A small potential is applied across two
‘identical’ electrodes in a cell containing the prepared soil sample. The current at each
electrode is measured. This measurement is repeated over a range of potentials.
The resulting relationship between current and applied potential is called the
polarization curve. The reciprocal of this curve at the corrosion potential is called the
polarization resistance, where the corrosion potential is the potential that exists between a
metal and its environment (see Soil (electrical) Resistivity review). Different metals can have
different polarization resistance values in the same soil type. The linear polarization resistance
is taken from the region where the polarization resistance curve is considered to be linear and
can be applied to numerous metals without specific knowledge of their corrosion potential in
the soil being tested.
F41.3 Application
LPR is used to indirectly determine the corrosion rate of buried ferrous assets using an
empirical relationship.
No standards are known to directly reference this technique; however AS/NZS
2280:2004 does mention its use.
F41.4 Practical considerations
Equipment that can be used for determining LPR (probes) is widely available and come
with two or more probes. Additional probes are intended to reduce error in readings.
The accuracy of readings is dependant on equipment used and sample preparation.
The sample preparation requirements generally require testing be conducted in a
laboratory.
F41.5 Advantages
Low cost technique.
LPR is a simple method which can be used to give an indication of corrosion rate.
Condition Assessment Strategies and Protocols for Water and Wastewater Utility Assets
F-117
F41.6 Limitations
There is disagreement as to the reliability of the method and the relationship with
corrosion rate is empirical only.
The assumption of linearity is not always representative of real conditions and so
reduces the accuracy of the technique.
Table F-43. Summary Linear Polarization Resistance of Soil (Soil LPR).
Technical
selection
Technical
suitability
Criteria
Assets covered
Material type
Service Area
Access requirements
Limitations relating to asset condition
Limitations relating to asset size/geometry
Continuous/discrete
Destructive/non destructive
Interruption to supply/function
Assessment parameters
Integration with software tools
Commercialization of tool
Previous/existing use of the tool in sector
Accuracy/reliability
Utility technical
capacity
Economic factors
Ease of validation of results
Asset management sophistication required
Skills required (level of tool sophistication); usability
Technology required (level of tool sophistication)
Documentation
Availability of technical support
Cost per inspection
Resource requirements
Assessment
Environmental survey (pipeline assets).
Results relate to ferrous assets.
Potable and wastewater.
Access to soil at point of interest.
None.
None.
Results are discreet.
Non-destructive.
Test does not affect assets.
Soil linear polarization resistance (LPR).
None.
Equipment is widely available.
Currently being used in Australia as a screening
approach to corrosion.
Information on accuracy of the technique is
varied and can depend on measurement
method.
Validation by assessment of the asset.
Generic approach.
Operator training is required.
Specialized equipment required.
Technique described well in literature.
Information available in literature.
Low cost.
Measurements undertaken by a single person.
F41.7 Bibliography
1. Burn, L.S., Eiswirth, M., DeSilva D. and Davis P., Condition Monitoring and its Role in
Asset Planning, Pipes Wagga Wagga 2001, Charles Stuart University, Wagga Wagga,
N.S.W., 2001
2. Heathcote, M. and Nicholas, D., Life Assessment of Large Cast Iron Watermains, Urban
Water Research Association of Australia, Research Report No 146, 1998
3. Moglia M., Davis P., Farlie M. and Burn S. Indirect Measurements of Corrosion rates in
buried Wrought Iron pipelines: an application of Linear Polarization Resistance, 6th
National Conference of the Australasian Society for Trenchless Technology, Melbourne
Exhibition and Convention Centre. 27-29 September 2004
4. AS/NZS 2280:2004, Ductile iron pipes and fittings
F-118
F42.0 Load Rejection Tests
F42.1 Overview
Power generation systems can experience sudden changes in load as a result of an
emergency shutdown, failure of equipment or changes in consumer power demand. Load
rejection tests or models are intended to analyze and predict the performance of power
generation systems under these sudden load changes.
Either full load rejection tests or partial load rejection tests can be conducted. However,
many tests attempt to examine full load rejection since this is the worst case scenario.
F42.2 Main Principles
Load rejection tests are most commonly applied to power generation systems such as
hydro-power plants, wind turbines and steam turbine power plants. When undertaking load
rejection assessment, analysis may either be carried out on the actual plant or modeled using
commonly available computer software programs developed for undertaking load rejection
analysis. In order to create a computer model, an adequate amount of information and data on
the operating characteristics of the plant needs to be collected, such as turbine characteristic
curves, penstock construction details and any available hydraulic transient test data.
An example of a load rejection event would be if the load on a hydro-powered
generator is suddenly removed, as a result the turbine will rapidly accelerate the generator
before the turbine governor has time to correct the turbine speed. The occurrence of such an
event could have a catastrophic impact, if sufficient controls are not in place to deal with this
type of load rejection. Within a hydro-power station, a relief penstock is usually available to
divert water away from the turbine in the case of load rejection event.
F42.3 Application
Load rejection assessments are often conducted or simulated using computer programs,
to gain an understanding of the effects of power station performance when sudden load
changes are found to occur.
Load rejection tests are covered in the National Grid Code, United Kingdom and the
Transmission Code 2003, Germany.
F42.4 Practical Considerations
Technical staff that are trained and have experience in undertaking, assessing and
simulating load rejection events are required.
F42.5 Advantages
By undertaking load rejection tests, the risks and consequences associated with the
event of sudden load rejections of power generation systems can be determined.
F42.6 Limitations
When modeling load rejection events using computer simulation programs, the time in
setting up a computer model is often time consuming.
Condition Assessment Strategies and Protocols for Water and Wastewater Utility Assets
F-119
Table F-44. Summary Load Rejection Tests.
Technical
selection
Technical
suitability
Criteria
Assets covered
Material type
Service area
Access requirements
Limitations relating to asset condition
Limitations relating to asset size/geometry
Continuous/discrete
Destructive/non destructive
Interruption to supply/function
Assessment parameters
Integration with software tools
Commercialization of tool
Previous/existing use of the tool in sector
Accuracy/reliability
Ease of validation of results
Utility technical
capacity
Asset management sophistication required
Skills required (level of tool sophistication); usability
Technology required (level of tool sophistication)
Documentation
Availability of technical support
Economic
factors
Cost per inspection
Resource requirements
Assessment
Generators.
N/A
Potable and wastewater.
Access requirements will be site specific.
Before a load rejection test is performed on an
actual plant, a hazard identification and risk
assessment is carried out. This will be site
specific and should take into consideration the
condition of the plant.
No restrictions.
Continuous.
Non-destructive.
On-line.
Turbine overspeed, penstock pressures,
structural adequacy of surge tanks, pipelines,
penstocks, etc.
Load rejection tests would usually be carried out
as stand alone tests.
Tests need to be developed so that they are site
specific.
Commonly used in the power generation
industry; limited use in water sector.
Dependent on the instruments used to record
data.
Computer models can be calibrated using
hydraulic transient test data.
High level of AM sophistication.
Usually a team of engineers would be required
to design and carry out the tests.
Reasonably high powered computers are
required to run the computer software models.
No current ASTM standards.
There are suitable software packages available
with customer support.
Expensive.
Usually a team of engineers would be required
to design and carry out the tests.
F42.7 Bibliography
1. Rebizant, W. & Terzija, V. Asynchronous Generator Behavior after a Sudden Load
Rejection, http://zas.ie.pwr.wroc.pl/wr_bpt03-2.pdf, accessed 2006
2. Tzuu Bin Ng, Walker, G.J. and Sargison, J.E. Modeling of Transient Behavior in a Francis
Turbine Power Plant, The University of Tasmania, Hobart,
www.aeromech.usyd.edu.au/15afmc/proceedings/papers/AFMC00084.pdf
F-120
F43.0 LPR for Corrosion Monitoring
F43.1 Overview of Tool
Linear polarization resistance (LPR) corrosion monitoring equipment measures
corrosion rate directly. The probes come in many types for embedding in new infrastructure,
retrofitting to existing infrastructure and a surface probe for more impromptu inspection.
F43.2 Main Principles
Linear polarization resistance is measured by passing a small current from the auxiliary
electrode to shift the potential of the steel by a fixed amount. The polarization resistance is the
potential shift divided by the current applied. It is inversely proportional to the corrosion rate.
Faraday's Law can be used to convert the corrosion rate current in µA/cm2 to steel section loss
in microns per year. A section loss rate of approximately100 microns will cause cracking and
spalling of concrete.
Probes measure the polarization resistance, which approximately relates to actual
corrosion rate of steel reinforcement in existing concrete structures.
F43.3 Application
Linear polarization resistance has been used in tunnels, bridges and road decks in the
United Kingdom, Singapore and India since 1998. Often linear polarization resistance
measurements are obtained in conjunction with electrical potential and/or concrete resistivity.
The LPR technique is described in ASTM G59.
Practical considerations.
A range of corrosion monitoring probes are available. Probes can be located in core
holes that are retrofitted into existing structures. Probes use silver/silver chloride
reference half cells with mixed metal oxide coated titanium auxiliary electrodes. The
probe is fitted into a core hole and a connection is made to the reinforcement using the
probe flying lead. An electronic identification chip within the probe identifies the probe
and its physical location to the corrosion rate meter or to an automated data logging
system.
Other corrosion monitoring probes include: a rack of probes that can be embedded
during the construction of new concrete structures; hand held probes that allow surfaces
to be monitored manually.
An embedded rack of probes can measure the corrosion rate and corrosion potential for
a single element probe and the reinforcement, as well as the concrete resistivity and
concrete temperature. It is designed to monitor new structures where deterioration of
the structure or initiation of corrosion is of interest.
Multi condition rack probes have been designed to provide information over a varying
depth profile. Four independent linear polarization resistance electrodes at varying
levels of concrete cover allow the determination of corrosion rate and half potential for
the element probes and the reinforcement. Concrete resistivity at three points,
temperature, and the derivable rate of ingress of corrosive substances can also be
determined.
Working similar to a potentials survey, a connection to the reinforcement is made and
then measurements can be taken up to 25m from the connection. The mobile probe uses
Condition Assessment Strategies and Protocols for Water and Wastewater Utility Assets
F-121
conductive foam to control the spread of current. Probes come in a range of sizes. Small
probes are useful for tight fitting areas; however large probes give greater accuracy.
It is useful to measure the temperature in different areas of a concrete structure in order
to determine differential temperature gradients and their affect on a concrete structure’s
long-term performance.
F43.4 Advantages
Hand held mobile probes allow linear polarization resistance measurement to be carried
out at any position on the structure chosen by the user.
Surveys of structures can readily be made in dry and wet situations to model best and
worst-case scenarios.
LPR data loggers can be integrated with corrosion data management software. By
inputting rebar alloy density, dimensions and exposure data, the software can calculate
metal loss and corrosion rate.
F43.5 Limitations
Testing often requires that at least two holes in the order of 6.5mm to variable depths
drilled in order to insert probes.
It is important that sufficient time is allowed for a current value to stabilize at a certain
potential (or vice versa). For example, in certain LPR techniques such as potentiostatic,
it will typically take several minutes for the current to reach a stable level after the
polarizing voltage is applied. Shorter times could lead to significant measurement
errors.
Some LPR testing technologies such as testing apparatus with a guard ring do not allow
quick assessing of large concrete surface areas. To reduce evaluation times to
acceptable, practical levels, the corrosion potential values can be mapped, followed by
a selective application of such testing apparatus to critical areas.
Table F-45. Summary LPR for Corrosion Monitoring.
Technical
Selection
Criteria
Assets covered
Material type
Service area
Access requirements
Limitations relating to asset condition
Limitations relating to asset size/geometry
Continuous/discrete
Destructive/non destructive
Interruption to supply/function
Technical
suitability
Assessment parameters
Integration with software tools
F-122
Assessment
Reinforced concrete structures such as tanks, pipes,
walls, dams, buildings, channels, weirs.
Reinforced concrete.
Potable and wastewater.
Direct contact with surface of asset. If asset is buried
then it must be exposed.
No restriction.
No limitations relating to size of concrete element.
Continuous reading.
Almost entirely non destructive, small drill holes
required.
The asset can remain in use and does not need to be
taken off-line unless internal (water side) surfaces
need to be assessed.
Concrete temperature that in turn allows differential
temperature gradients and their affect on a concrete
structure’s long-term performance to be determined.
The data can be transmitted to a central location
using telemetry.
Criteria
Commercialization of tool
Previous/existing use of the tool in sector
Accuracy/reliability
Ease of validation of results
Utility technical
capacity
Asset management sophistication required
Skills required (level of tool sophistication);
usability
Technology required (level of tool sophistication)
Documentation
Economic
factors
F43.6
Availability of technical support
Cost per inspection
Resource requirements
Assessment
Equipment is fully developed, available from selected
commercial vendors and can be used off the shelf.
Widespread use internationally on bridges and road
infrastructure. Growing application in the water
industry.
Quantitative.
Results are indicative and can be validated by using
two other testing techniques: concrete electrical
resistance and rebar electrical potential.
Generic approach.
Relatively easy to use by following simple procedure.
Trained staff can take measurements. Linear
polarization resistance meters do not require
specialist knowledge or training.
Range from moderate to high level of sophistication.
Many automatic corrosion transmitters are capable of
measuring and transmitting data from all types of
corrosion probes. Optional technology includes
programmable alarm circuits.
ASTM G59. Further guidelines specifically for on-line
in-plant corrosion monitoring are given in ASTM G96.
Technical support available from distributors.
Low cost per inspection.
One operator required. LPR uses a series of
electrodes, a voltmeter, an ammeter and a current
source.
Bibliography
1. ASTM G59-97(2003) Standard Test Method for Conducting Potentiodynamic Polarization
Resistance Measurements
Condition Assessment Strategies and Protocols for Water and Wastewater Utility Assets
F-123
F44.0 Magnetic Flux Leakage
F44.1 Overview
A magnetic flux leakage (MFL) tool is an electromagnetic tool that identifies and
measures metal loss due to corrosion, physical damage, and so forth through the detection of a
temporarily applied magnetic field. The tool provides a non-destructive means of assessing
ferrous pipes. Tools using the same principle are available for inspecting tank floors.
As illustrated in Figure F-7, as the tool moves along the pipe, it induces a magnetic flux
in the pipe wall. A homogeneous steel wall – one without defects – creates a homogeneous
distribution of magnetic flux. Anomalies such as metal loss associated with corrosion of the
pipe wall result in a change in distribution of the magnetic flux, which, in a magnetically
saturated pipe wall, leaks out. Sensors onboard the tool detect and measure the amount and
distribution of the flux leakage. The flux leakage signals are processed, and resulting data is
stored onboard the MFL tool for later analysis and reporting.
PERMANEN
MAGNET
T
BLACK IRON
COMPLETE
(TO
MAG.
CIRCUIT
)
PIP
WAL
E
L
STEE
BRUSHE
L
S
MAGNETI
FLUX
C
LINES
CORROSIO
MAGNETI N PI
C SHIEL
T
D
LEAKAG
E FIEL
D
MAGENTI
C SENSO
R
Figure F-7. Schematic Representation of MFL Internal Detection Device.
A transverse MFL/transverse flux inspection (TFI) tool uses the same principal as other
MFL tools with the exception that the magnetic field is oriented perpendicular to that used in
the other techniques.
F44.2 Main Principles
Typically, an MFL tool consists of two or more bodies. One body is the magnetizer
with the magnets and sensors and the other bodies contain the electronics and batteries. On the
very rear of the tool are wheels that travel along the inside of the pipeline to measure the
distance and speed of the tool.
A strong magnetic field is established in the pipe wall; brushes typically act as a
transmitter of magnetic flux from the tool into the pipe. High field MFL tools saturate the pipe
wall with magnetic flux until the pipe wall can no longer hold any more flux. The remaining
flux leaks out of the pipe wall and strategically placed sensor heads measure the leakage field.
Damaged areas of the pipe can not support as much magnetic flux as undamaged areas,
resulting in an increase in the flux field at the damaged areas. An array of sensor around the
circumference of the tool detects the magnetic flux leakage and notes the area of damage.
Magnetic flux leakage is a vector quantity and the sensors can only measure in one
direction. As such, three sensors must be oriented within a sensor head to accurately measure
the axial, radial and circumferential components of an MFL signal (earlier MFL tools recorded
only the axial component).
F-124
With large diameter pipes, space is available for multiple magnet arrays that can
saturate the entire pipe circumference. However, since the mass of the magnets and backing
steel need to be greater than the pipe wall, it has not been possible to develop internal tools to
suit small diameter distribution pipes.
Direct contact with the pipe wall is required. As such, the pipe surface must be clean.
The tool is mounted on a wheeled carriage and connected to an umbilical cord. Larger units
have onboard computers and power; an umbilical cord is not required.
Access has to be provided by cut-ins at regular intervals depending on the umbilical
length, as well as bends and obstructions in the pipeline.
The TFI tool is used to determine the location and extent of longitudinally-oriented
corrosion. This makes TFI useful for detecting seam-related corrosion. Cracks and other
defects can be detected also, though not with the same level of reliability. A TFI tool may be
able to detect axial pipe wall defects – such as cracks, lack of fusion in the longitudinal weld
seam, and stress corrosion cracking – that are not detectable with conventional MFL and
ultrasonic tools. External units are available for small diameter pipes.
F44.3 Application
MFL tools detect corrosion in ferrous pipelines. MFL detectors are generally used in the oil
and gas industry, incorporated into intelligent pigs for metal loss detection in steel pipelines
(see intelligent pigs review). The MFL probes are bulky and heavy and not suitable for internal
use in small diameter pipes.
Although commonly used in internal inspection, they have been adapted for external inspection
of pipes including water pipes. The external units are available for small diameter pipes.
Tools using the same principle are available for inspecting tank floors.
F44.4 Practical considerations
This technique is used in the oil and gas industry for large diameter pipelines.
Sophisticated electronics on board allow this tool to accurately detect features as small
as 1 cm by 1 cm.
To more accurately predict the dimensions (length, width and depth) of a corrosion
feature, extensive testing is performed before the tool enters the pipeline. Using a
known collection of measured defects, tools can be trained and tested to accurately
interpret MFL signals.
There is limited data available from the water industry as the degree of detail and
accuracy achievable with these tools is not generally warranted for water pipelines.
F44.5 Advantages
When used in the oil sector, accurate assessment of pipeline defects improves decision
making within an Integrity Management Program. Excavation programs can then focus
on required repairs instead of calibration or exploratory digs.
Units used on the pipe external surface can be used without supply interruption.
Wall thickness reductions detected with a high degree of accuracy.
F44.6 Limitations
The magnetic flux leakage techniques used in oil and gas pipe inspection have proven
ineffective for water pipes.
Condition Assessment Strategies and Protocols for Water and Wastewater Utility Assets
F-125
Internal inspection requires pipe cleaning prior to inspection. Pipe has to be off-line and
dry.
Cost is significantly high corresponding to the accuracy, which is not generally
warranted in the water sector.
As MFL techniques require good magnetic contact with the pipe wall internal
inspection is not possible for cement lined pipelines unless the lining is removed.
Table F-46. Summary Magnetic Flux Leakage.
Technical
selection
Feature
Assets covered
Material type
Service area
Access requirements
Limitations relating to asset condition
Limitations relating to asset size/geometry
Continuous/discrete
Destructive/non destructive
Technical
suitability
Interruption to supply/function
Assessment parameters
Integration with software tools
Commercialization
Previous/existing use of the tool
Accuracy/reliability
Ease of validation
Utility technical
capacity
Asset management sophistication
Skills required (level of tool sophistication);
usability
Technology required
Documentation
Economic factors
F-126
Availability of technical support
Cost per inspection
Resource requirements
Assessment
Pipes and tank floors.
Iron and steel.
Potable and wastewater.
Tool available for internal and external use.
Direct contact with pipe wall required. Access to
tool has to be provided by cut-ins at regular
intervals depending on umbilical cord feed length
and bends and obstructions on pipeline.
Regularly spaced cut-ins not required for larger
units with on-board computers and power.
No limitations relating to asset condition provided
direct contact with the pipe wall is available;
when used internally, pipes can not be lined.
Pipe surface must be clean.
Internal tools: generally limited to pipes 250 mm
and greater. External tools: 150 mm and larger.
Continuous readings.
Non-destructive, though tool access requires cutins at regular intervals (100 m to 500 m,
depending on cable length, pipe alignment).
Internal requires pipe to be off-line.
Metal loss due to corrosion or physical damage.
Computerized software is used for data
interpretation.
Commercialized, but availability through
specialized companies engaged in this work.
Commercial use of the MFL probes reported in
literature and trade journals.
Accurate quantitative assessments possible.
Validation possible only by comparison with
manual /direct measurements.
More suited to sophisticated utilities.
Utility should have skills to interpret output data.
Tool operation typically by a third party.
Specialized equipment and dedicated computer
software.
Tool principles and description of reports
generated by tool will be available.
Service provided by special operator.
Greater than US$10,000 per site, plus civil costs.
Typically three person crew.
F44.7 Bibliography
1. Burn, L.S., Eiswirth, M., DeSilva D. and Davis P., Condition Monitoring and its Role in
Asset Planning, Pipes Wagga Wagga 2001, Charles Sturt University, Wagga Wagga,
N.S.W., 2001
2. Eiswirth, M., Burn, L.S. New Methods for Defect Diagnosis of Water Pipelines, 4th
International Conference on Water Pipeline Systems, 28-30 March 2001, York, UK, 2001
3. Makar, J. M. ; Chagnon, N. Inspecting systems for leaks, pits, and corrosion, National
Research Council of Canada, Institute for Research in Construction, NRCC-42802
(downloaded from www.nrc.ca/irc/ircpubs), 1999
4. Trenchless Technology Network Underground Mapping, Pipeline Location Technology
and Condition Assessment, (downloaded from
http://www.ttn.bham.ac.uk/Final%20Reports/Pipe%20Location%20and%20Assessment.pd
f accessed 2006), 2002
5. Makar, J. M. ; Chagnon, N. Inspecting systems for leaks, pits, and corrosion, National
Research Council of Canada, Institute for Research in Construction, NRCC-42802
(www.nrc.ca/irc/ircpubs, 1999
Condition Assessment Strategies and Protocols for Water and Wastewater Utility Assets
F-127
F45.0 Man Entry Inspection
F45.1 Overview
While CCTV is now the industry standard approach for inspecting the internal
condition of sewers, in larger diameter sewers it becomes economical to carry out man entry
inspections. In this approach, the internal condition of the asset is assessed using a walkthrough inspection technique. This requires a team of operatives to enter the pipeline, and
assess the condition of the manhole and the sewer walls above the flow line.
Defects are assessed visually and recorded along with distance using a standard coding
system. Photographs of features of interest can also be taken. When this is done, the picture
reference should ideally be cross-referenced with the survey distance. Hand held videos can
also be used to provide a permanent record of the inspection.
The safety implications of man-entry inspections should be given appropriate
consideration. In particular, when entering a manhole sewer line, it is very important to observe
the appropriate confined space regulations.
F45.2 Main Principles
A man entry condition assessment is conducted as a walk through inspection. Since
sewers are hazardous confined spaces, manholes are first vented and tested for gases such as
hydrogen sulfide. When conditions are confirmed as being safe, a team of operatives carries
out the survey using appropriate safety equipment (e.g., gas detectors, breathing apparatus,
harnesses, winches, protective clothing, and communication systems).
During the inspection, the crew assesses the appearance of the sewer, the presence of
flow disturbances, the extent of corrosion, and the structural condition of the sewer.
Photographs should be taken of any observed defects, and a hand-held video camera can also
be used to videotape the internal surface of the sewer.
Acoustic tests may also be performed by striking the crown, sidewalls, and invert of the
sewer with a hammer and noting whether the generated sound is dull or solid. This provides
qualitative information regarding the sewer structure and, depending on construction, can
indicate the presence of voids in the sewer wall.
Other inspection techniques can be applied depending on material; for example, the use
of cover meters in reinforced concrete sewers. To assess the extent of corrosion activity, field
measurements of pH, dissolved oxygen, ambient hydrogen sulfide, and dissolved hydrogen
sulfide may also be taken.
F45.3 Application
Man-entry inspections are performed on large-diameter sewer pipelines and tunnels.
This kind of inspection can also be undertaken on large diameter water pipelines.
A number of systems are used for sewer condition grading, a Standard version of which
is EN 13508-2:2001 (CEN 2001).
F45.4 Practical considerations
•
F-128
Man entry inspections are a commonly applied technique in the water sector, and
inspection services are supplied by specialist contractors. However, due to the
hazardous conditions in the sewer and confined space requirements, safety precautions
are paramount, in particular:
−
−
−
−
If the flow of wastewater cannot be diverted, inspections should be performed at
night and during dry weather conditions so that the flow is minimal.
Ventilation fans should be used to ensure good ventilation.
During the survey, the atmosphere should be constantly monitored and emergency
evacuation procedures strictly adhered to.
The inspection should be performed by at least two persons and they should have
constant communication with the personnel outside the sewer line.
The crew who carry out the inspection should be trained in order to ensure consistency
and uniformity of the inspection results.
For wastewater pipelines, standards are available for qualitative and quantitative
grading of defects and a system for condition grading commonly used. Condition
assessment is performed by allocating a grade to the sewer that represents the range of
conditions from “like new” to “collapsed” or “collapse imminent.” The accuracy of a
condition grading depends on the inspector’s experience.
F45.5 Advantages
•
Man entry inspection is cost-effective for the inspection of large diameter pipelines.
F45.6 Limitations
There are significant health and safety issues associated with the inspection; all
operatives must be fully trained in safety requirements.
The results are qualitative and require manual interpretation for analysis.
The accuracy of a condition grading depends on an inspector’s experience.
Table F-47. Summary Man Entry Inspection.
Technical
selection
Technical
suitability
Criteria
Assets covered
Material type
Service area
Access requirements
Limitations relating to asset condition
Limitations relating to asset size/geometry
Continuous/discrete
Destructive/non destructive
Interruption to supply/function
Assessment parameters
Integration with software tools
Commercialization of tool
Previous/existing use of the tool in sector
Accuracy/reliability
Ease of validation of results
Assessment
Pipelines.
Any.
Potable and wastewater.
Man entry access required.
Must be safe to access.
Man entry access required.
Continuous.
Non-destructive.
Flow must be minimized, but inspection can be
undertaken on-line.
Pipeline defects.
None.
Service is provided by specialized contractors.
Common approach.
Qualitative assessment of condition.
Direct observations.
Condition Assessment Strategies and Protocols for Water and Wastewater Utility Assets
F-129
Utility technical
capacity
Criteria
Asset management sophistication required
Skills required (level of tool sophistication); usability
Technology required (level of tool sophistication)
Economic factors
Documentation
Availability of technical support
Cost per inspection
Resource requirements
Assessment
Generic approach.
Inspectors must be trained in confined spaces
and condition assessment.
Low tech inspection, but high tech safety
equipment.
No.
No.
High personnel and mobilization costs.
Team size in line with confined spaces
regulations.
F45.7 Bibliography
1. ASCE, Sanitary Sewer Overflow Solutions, American Society of Civil Engineers, EPA
Cooperative Agreement CP-828955-01-0, April 2004
2. European Committee for Standardization EN 13508-2:2001 Condition of Drain and Sewer
Systems Outside Building – Part 2: Visual Inspection Coding System, CEN Brussels, 2001
F-130
F46.0 Measurement of Strain
F46.1 Overview
Several techniques are used to measure strain of assets; electrical resistance strain
gauges and photoelastic techniques are discussed herein.
F46.2 Principles
Electrical Resistance Strain Gauge
The electrical resistance strain gauge is the most common type of strain gauge used
today. This simple strain gauge consists of a very fine wire filament (a resistor) arranged in a
long zig-zag pattern, with the long lengths parallel to the measured strain. The fine wire is
bonded to the strained surface by a thin layer of epoxy resin. As the surface and hence the wire
filament is strained, the wire will become elongated and the diameter will reduce. The
reduction in diameter will cause the resistivity of the wire to increase. An electrical signal
passed through the filament will vary depending on the strain.
‘Gauge Factor’ is a parameter equal to the fractional change in electrical resistance
divided by the actual strain. Since the magnitude of strain rarely exceeds the order of 10-3 and
the Gauge Factor is often about 2, the fractional change in electrical resistance can be
extremely small. This means that the measurements need to be extremely accurate to avoid
errors. To improve the accuracy of the measurements, the strain gauge is inserted into an
electric circuit such as the Wheatstone bridge.
Photoelastic Strain Gauge
A birefringent material is a transparent material such as calcite crystal that exhibits two
different refractive indices. The polarization of the light traveling through the material
determines the extent each refractive index plays.
A photoelastic material is a material that only exhibits the property of birefringence
when the material is under stress. A polarized light beam traveling through a stressed
photoelastic material will be resolved into two components such that the electric field vector in
each component is aligned with one of the two principal stress axes in the material. Each
component of the light beam will experience a different refractive index, causing the two
components to travel at different speeds and thus be out of phase with each other when they
exit the photoelastic material. Photoelastic strain analysis equipment generally consists of the
following:
A polarized source of light.
A model made of a photoelastic material or the actual body covered in a photoelastic
coating.
A polariscope to detect the refracted or reflected light.
The projector emits polarized light onto either the actual body (Figure F-8) or a model
of the actual body (Figure F-9). Models are made of a photoelastic material so the polarized
light travels through the model and the refracted light travels to the analyzer. Coatings applied
to the actual body consist of a layer of photoelastic material (paint or adhesive sheets) with a
reflective layer underneath. The incident light is diffracted through the photoelastic layer and
then reflected back through the photoelastic layer by the reflective layer.
Condition Assessment Strategies and Protocols for Water and Wastewater Utility Assets
F-131
The light traveling through the model or coating will only experience birefringence at
locations of stress. The greater the stress concentration, the more the two component waves
will be phase shifted.
The two diffracted components of light emerging from either the model or the coating
are then bought together in a polariscope, which determines the relative phase shifts by
analyzing the interference “fringe” patterns created. An example of a fringe pattern is shown in
Figure F-10. Areas of high stress concentration are identified by thinner fringes, as stress
concentration decreases the fringes become wider.
Figure F-8. Use of a Photoelastic Coating on the Actual Body.
(Reprinted with permission from: Brad Boyce, VP, Stress Photonics, Inc., Madison, WI)
Figure F-9. Use of a Photoelastic Model.
(Reprinted with permission from: D. Roylance, 2001)
Figure F-10. Fringe Pattern on a Centrally Loaded Arch.
(Reprinted with permission from: Doyle, J.F. and Phillips, J.W. , 1989)
F-132
F46.3 Application
Electrical resistance strain gauges are used for:
Crack width measurement/monitoring in concrete structures.
Small deflections in machines or structures.
Photoelastic strain gauges can be used in any components made of a homogeneous material,
such as a motor shaft.
Standards which reference electrical resistance strain gauges;
ISO 4965:1979 Axial load fatigue testing machines - Dynamic force calibration - Strain
gauge technique.
BS 6888:1988 Methods for calibration of bonded electrical resistance strain gauges.
Standards which reference photoelastic strain gauges;
ASTM D4093-95(2005)e1 Standard Test Method for Photoelastic Measurements of
Birefringence and Residual Strains in Transparent or Translucent Plastic Materials.
ASTM C978-04 Standard Test Method for Photoelastic Determination of Residual
Stress in a Transparent Glass Matrix Using a Polarizing Microscope and Optical
Retardation Compensation Procedures.
ASTM C1279-05 Standard Test Method for Non-Destructive Photoelastic
Measurement of Edge and Surface Stresses in Annealed, Heat-Strengthened, and Fully
Tempered Flat Glass.
F46.4 Practical Considerations
Variations in temperature can affect the accuracy of measurements with electrical
resistance strain gauges. For instance, errors may arise due to thermal expansion of the
object under analysis and also from the change in resistance of the electrical strain
gauge. Errors due to temperature fluctuations can be minimized but not completely
eliminated.
A practical consideration of the photoelastic strain gauge is that either a model of the
object needs to be made using a birefringent material, or the actual object needs to be
coated in a photoelastic layer. This may not be feasible in many situations.
F46.5 Advantages
•
Electrical resistance strain gauge:
−
Relatively inexpensive.
−
Overall fractional errors can be less than ± 10%.
−
Possible to measure different types of strain, for example, shearing strain, poisson
strain and torsional strain.
Photoelastic strain gauge:
−
−
−
−
−
−
Can provide full-field displays of the strain distribution.
Can be applied to parts with complicated geometry and/or complicated loading
conditions.
Sensitive and accurate.
Can measure residual stresses in materials.
Can be used to determine areas of critical stress and stress concentration factors.
Can measure dynamic strains.
Condition Assessment Strategies and Protocols for Water and Wastewater Utility Assets
F-133
F46.6 Limitations
Electrical resistance strain gauge
−
−
Errors due to temperature fluctuations.
A strain gauge only measures strain at one point. Multiple gauge arrangements are
required to analyze strain along different axes and to determine bending and
torsional strains.
Photoelastic strain gauge
−
Operate best under laboratory conditions.
Table F-48. Summary Measurement of Strain.
Technical
selection
Technical
suitability
Utility technical
capacity
Economic factors
Technical
selection
Electrical resistance gauge
Criteria
Assets covered
Material
Service area
Access requirements
Limitations relating to asset condition
Limitations relating to asset size/ geometry
Continuous/ discrete
Destructive/ non-destructive
Interruption to supply/ function
Assessment parameters
Integration with software tools
Commercialization
Previous/ existing use of the tool
Ease of validation
Accuracy/reliability
Asset management sophistication required
Skills required (level of tool sophistication)
Technology required (level of tool sophistication)
Documentation
Availability of technical support
Cost per inspection
Resource requirements
Photoelastic strain gauge
Criteria
Assets covered
Material
Service area
Access requirements
F-134
Assessment
Crack growth monitoring of dams; civil structures
e.g. concrete
Potable.
No specific requirements.
No specific limitations.
No specific limitations.
Continuous.
Non-destructive.
None.
Strain analysis.
None
Widely available.
Extensive use in the manufacturing industry. Limited
use in the water industry.
Direct measurement.
Quantitative
Generic approach.
Informed engineer.
Strain gauges.
N/A
N/A
N/A
One or two people.
Assessment
Any components made of a homogeneous material,
such as a motor shaft.
Potable or wastewater.
Objects made of photoelastic materials can be
analyzed directly. Other objects need to have a
photoelastic coating applied.
Objects are usually analyzed in a laboratory
environment.
Photoelastic strain gauge
Criteria
Limitations relating to asset condition
Limitations relating to asset size/ geometry
Continuous/ discrete
Destructive/ non-destructive
Interruption to supply/ function
Technical
suitability
Assessment parameters
Integration with software tools
Commercialization
Previous/ existing use of the tool
Utility technical
capacity
Ease of validation
Accuracy/reliability
Asset management sophistication required
Skills required (level of tool sophistication)
Technology required (level of tool sophistication)
Economic factors
Documentation
Availability of technical support
Cost per inspection
Resource requirements
Assessment
If necessary, a model made of a photoelastic material
or a model with a photoelastic coating can be used to
analyze strain under different loading conditions
without loading the real object.
No apparent limitations in principle but objects are
usually analyzed in a lab.
Continuous real time recording of fringe patterns is
possible.
Non-destructive.
Objects are usually analyzed in a laboratory
environment.
Stress and strain analysis.
None
Commercially available equipment, e.g., GFP 1200
Grey-Field Polariscope.
Extensive in the manufacturing industry.
Used as a quality monitoring tool in the glass industry.
Limited use in the water industry.
Direct measurement.
Quantitative
Generic approach.
An informed engineer is required to perform the tests
and analyze the results.
A polariscope and preferably the relevant software to
eliminate the need for manual fringe counting.
N/A
N/A
Inexpensive.
One or two people.
F46.7 Bibliography
1. ISO 4965:1979 Axial load fatigue testing machines - Dynamic force calibration - Strain
gauge technique
2. BS 6888:1988 Methods for calibration of bonded electrical resistance strain gauges
3. ASTM D4093-95(2005)e1 Standard Test Method for Photoelastic Measurements of
Birefringence and Residual Strains in Transparent or Translucent Plastic Materials
4. ASTM C978-04 Standard Test Method for Photoelastic Determination of Residual Stress in
a Transparent Glass Matrix Using a Polarizing Microscope and Optical Retardation
Compensation Procedures
5. ASTM C1279-05 Standard Test Method for Non-Destructive Photoelastic Measurement of
Edge and Surface Stresses in Annealed, Heat-Strengthened, and Fully Tempered Flat Glass
6. Roylance, D. Experimental Strain Analysis, (accessed from
http://web.mit.edu/course/3/3.11/www/modules/expt.pdf), 2001
7. Doyle, J.F. and Phillips, J.W. Manual on Experimental Stress Analysis, 5th Edition, Society
of Experimental Mechanics, Inc., 1989
Condition Assessment Strategies and Protocols for Water and Wastewater Utility Assets
F-135
F47.0 Methylene Chloride Gelation Assessment
F47.1 Overview
The methylene chloride (dichloromethane or methylene dichloride) test is a destructive
test used to give an indication of the degree of gelation in a PVC pipe.
A short section of chamfered pipe is immersed in a bath of methylene chloride for at
least 15 minutes and the chamfered surface then inspected for attack. The degree and location
of attack gives an indication of the degree of gelation around the pipe circumference.
F47.2 Main Principles
The methylene chloride test is a qualitative method used to give an indication of the
level of gelation in a PVC sample. The degree of gelation is directly related to the conditions
experienced by the pipe during manufacturing and so can also be used as a measure of quality
assurance.
Gelation is the process by which particulate PVC is formed into a homogenous
material. The degree of gelation achieved during the extrusion of a PVC pipe is related to the
toughness of the material produced. A low level of gelation results in a material with reduced
toughness. As such, pressure pipes made from a low level of gelation material will fail before a
pipe with a high level of gelation under the same operating conditions.
Methylene chloride testing is conducted on a short length of pipe, approximately 8
inches in length. One end of this length is chamfered and that end immersed in methylene
chloride for at least 15 minutes at 68°F. After this time, the length is removed and allowed to
dry. After drying the chamfered end is inspected for signs of attack.
Areas of the pipe which have been attacked will become whitened or bleached. The
chamfered surface will also become rough where attack has occurred. Generally there are three
results from the methylene chloride test:
Type 1 – where the surface exhibits no apparent attack.
Type 2 – where the surface exhibits uniform attack.
Type 3 – where the surface exhibits non-uniform attack.
F47.3 Application
Methylene chloride assessment is a qualitative method used to determine the gelation
level of PVC pipes. The test is used to identify areas in a pipe sample with the least gelation as
part of the fracture toughness testing.
Standards which include this test are: BS 3505:1986, AS/NZS 1462.19:2006.
F47.4 Practical considerations
This test is widely used in industry where fracture toughness testing is conducted.
Methylene chloride is toxic and so should be handled and stored in an appropriate
fashion.
Where quantitative measurement of gelation is required other methods are available
(see DSC Gelation Assessment review).
F47.5 Advantages
Test gives an indication of the quality of the manufactured pipe.
F-136
F47.6 Limitations
When used for condition assessment, requires a pipe section to be removed for testing.
Test solution (methylene chloride) is toxic and should be handled by trained personnel
only.
Test is broadly qualitative only.
Table F-49. Summary Methylene Chloride Gelation Assessment.
Technical
selection
Criteria
Assets covered
Material type
Service area
Access requirements
Limitations relating to asset condition
Limitations relating to asset size/geometry
Continuous/discrete
Destructive/non destructive
Interruption to supply/function
Technical
suitability
Assessment parameters
Integration with software tools
Commercialization of tool
Previous/existing use of the tool in sector
Accuracy/reliability
Ease of validation of results
Utility technical
capacity
Asset management sophistication required
Skills required (level of tool sophistication); usability
Technology required (level of tool sophistication)
Documentation
Availability of technical support
Economic factors
Cost per inspection
Resource requirements
Assessment
Pipe assets.
PVC.
Potable and wastewater.
Lab based test; requires samples to be taken.
No limits due to asset condition.
No limitations due to sample size.
Discrete.
Destructive test.
Asset must be exhumed from pipeline before
testing.
The level of gelation in a PVC sample.
No integration with software tools.
Tool is a procedure
Test is widely used in industry.
Test is broadly qualitative.
Results are indicative.
Generic approach.
Operator should be trained in use of methylene
chloride.
Test requires methylene chloride and timing
device.
BS 3505:1986, AS/NZS 1462.19:2006.
Test can be conducted by consultants if
required.
Low cost per test.
Test requires a fume hood.
F47.7 Bibliography
1. Dorn, R., Howsam, P., Hyde, R.A. and Jarvis, M.A. Water mains: Guidance on assessment
and inspection techniques, CIRIA Report 162, Construction Industry Research and
Information Association, London, England, 1996
2. Randall-Smith, M., Russell, A. and Oliphant, R. Guidance manual for the structural
condition assessment of trunk mains, WRc, UK, 1992
3. BS 3505:1986 Specification for unplasticized polyvinyl chloride (PVC-U) pressure pipes
for cold potable water
4. AS/NZS 1462.19:2006 Methods of test for plastics pipes and fittings - C-ring test for
fracture toughness of PVC pipes
Condition Assessment Strategies and Protocols for Water and Wastewater Utility Assets
F-137
5. ISO 9852 : 1995 Unplasticized Polyvinyl Chloride (PVCU) pipes – Dichloromethane
resistance at specified temperature (DCMT) – Test method
6. Fillot, L.A Hajji, P. UPVC Gelation level assessment Part 1: Comparison of different
techniques, Journal of Vinyl and Additive Technology, 2006
F-138
F48.0 Motor Circuit Analysis
F48.1 Overview
Motor circuit analysis is a non-destructive low voltage method for testing electric motor
cables, connections, windings and rotors for developing faults, to reduce the likelihood of
electrical failure occurring during operation. The results are not a definite indication of
impending failure but need to be compared with previous tests to identify trends. The test can
also indicate motor efficiency losses over time. The additional running costs could be a factor
in any decision for remedial works or replacement.
F48.2 Main Principles
When undertaking motor circuit analysis, a low voltage is applied to enable the testing
of electric motor cables, connections, rotor and windings for the onset of equipment breakdown
or faults. An insulation resistance test to earth is performed at either 500V or 1000V DC. The
measurements which are typically undertaken when conducting motor circuit analysis include:
DC resistance (R), impedance (Z), inductance (L), phase angle (Fi), multiple current/frequency
response (I/F) and insulation to ground. Based on the readings obtained, the physical and
electrical properties of a particular electrical component can be determined in accordance with
the following guidelines.
Resistance (R) is used for determining the continuity of electrical cables and
connections.
Impedance (Z) and Inductance (L) are compared to evaluate the insulation condition
of winding contamination.
Phase angle (Fi) and Current/Frequency (I/F) are used to detect winding shorts.
The above three measurements will be balanced in a fully serviceable motor. Imbalance
in itself is not a definite indication of impending failure. Routine testing is required to enable
trends to be generated on which failure predictions can be based. The level of imbalance before
action should be fairly tolerant for non-critical motors and have a low tolerance for critical
equipment.
Impedance imbalance will cause the operating temperature of the electric motor to
increase placing further electro-mechanical stresses on the motor winding and rotor.
Imbalances also affect efficiency as well as reliability. As the balance between phases varies, it
becomes harder for the magnetic fields to turn the rotor, reducing efficiency of the motor.
F48.3 Application
Motor circuit analysis is applicable to all types of plant that contain electrical motors
and circuits.
F48.4 Practical Considerations
Analysis of electrical motors and circuits using motor circuit analysis is widely used
throughout the manufacturing industry.
F48.5 Advantages
Motor circuit analysis allows for changes in electric motors and associated circuits to be
trended. Action can then be taken prior to reliability being affected. Identification of
efficiency loss can form part of the financial case for repair/ replacement.
Condition Assessment Strategies and Protocols for Water and Wastewater Utility Assets
F-139
All tests are conducted using portable hand held non-specialized equipment, which
enables assessment to be conducted by non electrical trained personnel. Motor circuit
analysis can be conducted without the need to disassemble the motor prior to analysis.
F48.6 Limitations
During the assessment, the electrical motor must be electrically isolated.
Table F-50. Summary Motor Circuit Analysis.
Technical
selection
Technical
suitability
Criteria
Assets covered
Material type
Service area
Access requirements
Limitations relating to asset condition
Limitations relating to asset size/geometry
Continuous/discrete
Destructive/non destructive
Interruption to supply/function
Assessment parameters
Integration with software tools
Commercialization of tool
Previous/existing use of the tool in sector
Accuracy/reliability
Ease of validation of results
Utility technical
capacity
Asset management sophistication required
Skills required (level of tool sophistication); usability
Technology required (level of tool sophistication)
Documentation
Availability of technical support
Economic factors
Cost per inspection
Resource requirements
Assessment
Electric motors.
Windings.
Potable and wastewater.
Portable hand held equipment.
None.
None.
Discrete readings.
Non-destructive.
Off-line.
Electrical properties of winding.
Standalone.
Fully developed and off the shelf.
Standard industry practice.
High accuracy.
Can be validated by measuring separately
winding resistance insulation and comparing to
as installed information.
Generic approach.
Electrician.
Standard computer.
Documented but no formal standard as yet.
Suppliers offer service to undertake
assessments.
Relatively low cost per inspection.
One person no more than half hour per motor.
F48.7 Bibliography
1. American Bureau of Shipping, Guidance Notes on Reliability Centred Maintenance, 16855
Northchase Drive, Houston, TX 77060 USA, July 2004,
http://www.aptgroup.com.au/elec_moto.htm
F-140
F49.0 Multi-sensor Pipe Inspection Robots
F49.1 Overview
Pipeline inspection is undertaken in a number of sectors using “intelligent pigs” (see
Intelligent Pig review) that travel with the product in the pipeline. These devices incorporate a
range of inspection technologies and are effective tools for inspections undertaken over long
distances, but are expensive and so their cost cannot be justified over short distances.
As an alternative, automated inspection of the inner surface of a pipe can be achieved
by a mobile robot. In this approach, a robot with multiple sensors is introduced into the pipe to
undertake a condition assessment using various non-destructive techniques.
The technology for these tools is still under development, but a number of systems have
been produced, though not fully commercialized. The robots being developed all incorporate
an array of non-destructive techniques that simultaneously assess pipeline condition. Research
has also focused on the automatic interpretation of the collected data.
To date, the development of these tools has generally concentrated on assessment
systems for sewers, but conceptually there is no reason why the approach could not be adopted
for water mains. Nevertheless, the information provided below pertains to the inspection of
sewers.
F49.2 Main Principles
Multi-sensor robotic systems have been developed by a number of international bodies
that incorporate several sensor technologies, including:
Visual images: CCTV images can be used in conjunction with other sensors such as
laser profiling. Lateral connection cameras are capable of traveling up small diameter
service connections (see CCTV Visual Inspection review).
Acoustic monitoring techniques: acoustic techniques can be used to assess pipe wall
thickness and locate flaws in the pipe wall. Sonar uses sound to produce an image of
the pipeline, which can be used to identify the pipe surface and other softer materials
such as plant matter and silt (see In Pipe Acoustic Monitoring Techniques (Sonar)
review).
Electromagnetic: electromagnetic techniques such as remote field eddy current,
magnetic flux leakage and broad band electromagnetics can be used to assess wall
thickness of metallic assets (see Remote Field Eddy Current, Broadband
Electromagnetics and Magnetic Flux Leakage reviews).
Ground Penetrating Radar: ground penetrating radar can be used in-pipe to find
cavities in the soil surrounding the pipe (see Ground Penetrating Radar review).
Microwave sensors: microwave backscattering sensors can be used similar to ground
penetrating radar to explore anomalies in a medium range behind the pipe outer surface.
Hydrochemical sensors: hydrochemical sensors can be used to assess water quality,
and for sewer pipelines can be used to indicate the presence of infiltrated groundwater.
Laser profiling: measurement of pipe diameter and deviations including ovality can be
important, particularly in plastic pipes in which such deflection indicates stresses that
can cause premature failure of the pipe. Laser profiling systems are available to
measure pipe diameter during normal CCTV inspection.
Examples of robot platforms include:
Condition Assessment Strategies and Protocols for Water and Wastewater Utility Assets
F-141
The KARO and PIRAT multi-sensor robotic development projects were aimed at
producing ‘smart’ sewer inspection vehicles equipped with several different sensor
devices. The robots were connected to a mobile control and surveillance unit by a
cable. One research focus of both projects was to develop methods for the automatic
interpretation of sensor data to identify and characterize pipe damage. KARO, an
inspection platform with exchangeable sensor modules, employed fuzzy logic to fuse
and interpret data from different types of sensors. In the PIRAT project, an expert
system analyzed laser images and ultrasonic data allowing classification of pipe
damage.
The Sewer Scanner and Evaluation Technology (SSET) is a flexible non-destructive
evaluation data acquisition tool. At present, the prototype has a diameter of 130 mm
and a length of 850 mm and weighs 25 kg. In the prototype, higher quality information
on sewer condition is obtained through optical scanner and gyroscope technology.
SSET records a 360° image as it travels through the pipe. This allows the pipe
condition to be assessed after the inspection. This reduces the in-pipe time because the
operator is not required to locate and analyze defects during the inspection itself. The
interpretation system SSET implements fuzzy set theory and fuzzy logic techniques to
automatically identify, classify and rate pipe defects.
SAM an interdisciplinary German research and development project on “Sewer Defect
Characterization by Multisensor Systems” involves the development and linkage of
different sensor systems. SAM includes a commercial CCTV system as well as a
number of sensors, including, microwave backscattering, hydro chemical, acoustic
impact, optical triangulation, geophysical and radioactive probes. The interpretation
system of SAM also implements fuzzy set theory and fuzzy logic techniques to
automatically identify, classify and rate pipe defects.
The MAKRO robot is an autonomous sewer robot and its frame is flexible both
horizontally and vertically. The robot is equipped with a set of internal sensors, which
serve mainly to determine the robot's relative and absolute position within the pipe. The
robot's external sensors enable analysis of its environment and include obstacle
detection, collision avoidance, motion control, and landmark detection - a subtask of
self-localization.
Pipe Rover is currently being developed in Hong Kong for assessment of pipes over
one meter in diameter. It is an underwater robot for inspection of water ducts, pipes and
foul water drains. It is especially suitable for offshore sewer outlets or power station
outfalls, where the pipes may terminate kilometres offshore and run deep in water. Pipe
Rover has two propulsion mechanisms. For flat-bottomed ducts with few obstructions;
tracks propel the robot, while for pipes, legs are used. The sensors include a color video
inspection camera with pan, tilt and lights, ultrasonic obstacle detection and
distance/depth/temperature/heading/pitch and roll information.
F49.3 Application
Intelligent inspection of sewer pipelines using multiple sensor robots to simultaneously
obtain a wide range of condition data.
F49.4 Practical considerations
Multi sensor systems are generally still in the development stage, and as such these
systems are not widely used. Nevertheless, various platforms have been subject to field
tests:
F-142
−
SSET was introduced to North American market in 1997; field trials covered 38.5
kms (126,612 ft) of sewer inspection in 13 participant cities. More recently, a 5.7km
(19,000 ft) sewer evaluation project for City of Atlanta and a project for Eastman
Chemical Company, Tennessee, have been completed.
−
PIRAT has been tested in 5 km of sewers in Melbourne.
−
SAM is currently being field-tested in several German cities.
The evaluation of SSET is on-going. Work on KARO has stopped, though parts of it
are integrated into a new project SAM. PIRAT is unlikely to be commercialized.
The external sensors available on MAKRO at the moment are very limited and
considerable development is still needed in this area before it would be usable for
automated pipeline inspection.
F49.5 Advantages
Robots can be used to simultaneously gather large amounts of useful information about
a pipeline.
Tools can be customized to gather data of specific interest for each asset type.
F49.6 Limitations
The capital cost of inspections systems can be high due to the sensors incorporated in
them.
Robots are not yet commercially available.
Table F-51. Summary Multi-sensor Pipe Inspection Robots.
Technical
Selection
Criteria
Assets covered
Material type
Service area
Access requirements
Limitations relating to asset condition
Limitations relating to asset size/geometry
Technical
suitability
Utility technical
capacity
Continuous/discrete
Destructive/non destructive
Interruption to supply/function
Assessment parameters
Integration with software tools
Commercialization of tool
Previous/existing use of the tool in sector
Accuracy/reliability
Ease of validation of results
Asset management sophistication required
Skills required (level of tool sophistication); usability
Technology required (level of tool sophistication)
Assessment
Pipe assets.
Any.
Mainly wastewater.
Access to interior of pipe for inspection probe
(robot).
Blocked and clogged assets cannot be
inspected past blockages.
Depends on equipment but minimum diameter
of around 150mm.
Continuous.
Non-destructive test.
Depends on sensors being used.
Depends on sensors being used.
Fully integrated software for analysis of data.
Systems are either still in development or have
been abandoned.
Limited testing for development purposes.
Quantitative.
Depends on sensors being used.
Associated with high levels of asset
management sophistication.
Training in use of specific device and
associated sensors is required.
Highly sophisticated.
Condition Assessment Strategies and Protocols for Water and Wastewater Utility Assets
F-143
Criteria
Documentation
Economic factors
Availability of technical support
Cost per inspection
Resource requirements
Assessment
Use and development documented in the
literature.
Limited.
High at present.
Robot and team to operate device.
F49.7 Bibliography
1. Burn, L.S., Eiswirth, M., DeSilva D. and Davis P., Condition Monitoring and its Role in
Asset Planning, Pipes Wagga Wagga 2001, Charles Sturt University, Wagga Wagga,
N.S.W, 2001
2. Ratliff, A. An overview of current and developing technologies for pipe condition
assessment, Pipelines 2003, ASCE 2004
F-144
F50.0 Oil Testing
F50.1 Overview
In many different types of equipment, oil is either used as a lubricant to reduce the rate
of wear and deterioration of internal moving components (e.g., in an air compressor, gearbox,
diesel/petrol engines), or used as a cooling medium to transfer heat (e.g., from the core and
coils contained in an electrical transformer).
Routine assessment of a sample of oil is a non-destructive method that can be used to
give an indication of the current condition of the plant. A number of tests are conducted on the
oil sample that can identify component wear, fatigue and corrosion. The analysis can also give
an indication of oil contamination and deterioration, which can indicate when oil should be
changed.
F50.2 Main Principles
F50.2.1 Oil as a Lubricant
In many different types of equipment (petrol/diesel motors, gearboxes, compressors and
hydraulic systems), analysis of the lubricating oil for the presence of sediment particles,
corrosion, fatigue and changes in the properties of the oil (such as density and viscosity) can
often provide an indication of the equipment’s current state of operation and internal condition.
Over time the level of oil and the changes in the oil properties have an influence on the
rate of wear and deterioration of moving internal components, with the formation of ferrous
particles in the lubricating oil providing an indication of the rate of wear of internal plant
components.
The following laboratory-based assessments are typically undertaken on a routine basis
to gain an indication of the condition of equipment through analysis of its lubricating oil.
Ferrographic analysis is a technique that can be used to determine the density and size
of particles that have formed in the lubricating oil as a direct result of wear, fatigue
and/or corrosion. A sample taken from the equipment is analyzed by diluting the
sample in a fixer solvent that is then passed over a glass slide subjected to a magnetic
field. The applied magnetic field results in the separation of the ferrous particles from
the non-ferrous particles. The density of the particles and the ratio of the large to small
particles indicate the type and the extent of the wear that is occurring to internal
components.
Particle counter analysis is a method undertaken to monitor particles in lubricating
and hydraulic oils caused by corrosion, wear and contamination. The two most
common methods used for particle counting are light extinction and light scattering. In
the light extinction method, an incandescent light is used to shine on a cell that the oil
sample moves through under controlled flow and volume conditions. A particle counter
measures the light that passes through the sample to determine the number of particles
in a predetermined size range. In the light scattering assessment technique, a laser is
used to shine light through an object cell that the oil sample fluid moves through under
controlled flow and volume. As opaque particles pass through the laser, the scattered
light created is measured and translated into a particle count.
Atomic emissions spectroscopy can be used to determine the presence of corrosion
and wear products, contaminants and additives in hydraulic and lubricating oils. The
characteristic radiation emitted when samples are subjected to high energy and
temperature are measured to determine the presence of elements such as iron,
Condition Assessment Strategies and Protocols for Water and Wastewater Utility Assets
F-145
aluminum, chromium, copper, lead, tin, nickel and also components of oil additives
such as boron, zinc, phosphorus and calcium.
Kinematic viscosity assessment provides an indication of the deterioration of oil over
time as well as an indication of the contamination of the oil by fuel and other oils.
During the assessment, the oil’s resistance to flow under controlled pressure and
temperature is measured by forcing a sample to flow through a capillary viscometer.
The viscosity of the oil can be determined from the results obtained.
F50.2.2 Oil as a Heat Transfer/Insulating Medium
In transformers, oil is used primarily as a cooling medium to transfer heat from the core
and coils to the external radiator banks, while also forming part of the insulation system. Oil
filled transformers have the core and coil assembly placed in a tank filled with dielectric
cooling oil. The primary insulation system used in an oil-filled transformer is Kraft paper,
wood, porcelain and oil. In more modern transformers, paper that is chemically treated to
improve its tensile strength properties and resistance to decay caused by immersion in oil are
commonly used.
Over time, the insulating properties of the oil may deteriorate as a result of
contamination and the formation of moisture leading to transformer break down. In order to
determine the condition of the oil and the electrical insulating properties to reduce the likely
hood of transformer break down, the following laboratory based oil tests are commonly
undertaken.
Sediment tests (ASTM D – 1698), to determine the properties of sediment that has
formed in the oil due to contamination and or deterioration over time. The analysis
involves taking a sample of the oil and using a centrifuge to separate the sediment from
the oil to enable assessment of the sediment properties.
Karl Fisher titration test (ASTM D – 1744), can be used to determine the amount of
moisture in an oil sample by measuring the electrical current flow between two
electrodes immersed in the sample solution with the result reported as the amount of
water in parts per million.
Dielectric strength tests are used to measure the insulating properties of electrical
insulating oils. The electrical insulating properties of oil can change due to the
deterioration as a result of contamination or oil breakdown. The test is conducted by
subjecting the sample to an electrical stress at a given temperature by passing a voltage
through the sample.
In addition to the laboratory assessments outlined above, a visual inspection conducted
at six monthly intervals of the transformer dehydrating breather silica gel crystals can also be
undertaken, to ensure the color of the crystals has not changed. If on inspection more than 50%
of the crystals have changed color, replacement is recommended due to the possibility of
moisture entering the unit during warming up/cooling down cycles and resulting in premature
insulation failure of the oil. Insulating oil decay is found to be the single greatest cause of
power transformer failure.
F50.3 Application
Oil testing methods are used to assess the properties of oil and can be used to determine
the condition of internal moving components in petrol/diesel engines, gearboxes and
transmissions, and also those types of plant that use oil as a heat transfer medium, such as
electrical transformers, to provide a effective method of determining the current condition and
rate of deterioration of plant equipment.
F-146
ASTM D – 1698, ASTM D – 1744 and ISO/DIS 18436-4 reference different oil testing
methods.
F50.4 Practical Considerations
The majority of the assessments used in determining the type of contaminants and
particles present in oil samples are laboratory based assessments, and as a result require
trained technical staff to undertake these assessments and interpret test results.
F50.5 Advantages
Oil testing can be undertaken as a part of a routine maintenance program to provide a
means of obtaining an early indication of plant failure.
Oil testing can be used to optimize the frequency of oil changes in plant equipment,
preventing premature oil changes and indicating when an oil change is due.
F50.6 Limitations
The majority of the assessments used in determining the type of contaminants and
particles present in oil samples are laboratory based assessments, and as a result require
trained technical staff to undertake these assessments and interpret test results.
Table F-52. Summary Oil Testing.
Technical
selection
Criteria
Assets covered
Material type
Service area
Access requirements
Limitations relating to asset condition
Limitations relating to asset size/geometry
Continuous/discrete
Destructive/non destructive
Interruption to supply/function
Technical
suitability
Utility
technical
capacity
Economic
factors
Assessment parameters
Integration with software tools
Commercialization of tool
Previous/existing use of the tool in sector
Accuracy/reliability
Ease of validation of results
Asset management sophistication required
Skills required (level of tool sophistication);
usability
Technology required (level of tool
sophistication)
Documentation
Availability of technical support
Cost per inspection
Resource requirements
Assessment
Wastewater/water infrastructure transformers, oil switchgear,
mechanical components requiring oil as lubricant.
Electrical insulant/cooling medium, mechanical lubricant.
Potable and wastewater.
Sample of oil required to be taken. Transformers usually
have tap points, switch gear requires removal from housing.
Mechanical some have sample taps.
None.
None.
Discrete reading.
Non destructive.
Transformers on-line. HV gear off-line. Mechanical
dependent on equipment
Impurities and dielectric strength of oil.
Stand alone.
Fully commercially available.
Standard industry practice.
Accurate results of sample but with electrical equipment are
indicative of condition.
Indicative requiring visual inspection.
Generic approach. Is commercially available.
Skilled operator for dielectric strength. Laboratory for analysis
Specialist equipment for dielectric strength. Laboratory
equipment for analysis.
Method is widely used and documented. ISO/DIS 18436-4.
Many laboratories available.
Depends on tests.
One man sample. Offsite laboratory.
Condition Assessment Strategies and Protocols for Water and Wastewater Utility Assets
F-147
F50.7 Bibliography
1. American Bureau of Shipping, Guidance notes on Reliability Centred Maintenance, 16855
Northchase Drive, Houston, TX 77060 USA, July 2004
2. ASTM D – 1698, Standard test method for sediment and soluble sludge in service aged
insulating oils
3. ASTM D – 1744, Standard test method for determination of water in liquid petroleum
products by Karl Fischer reagents
4. ISO/DIS 18436-4: Condition monitoring and diagnostics of machines - Requirements for
training and certification of personnel - Part 4: Field lubricant analysis. This document is a
Draft International Standard
F-148
F51.0 On-Line Leak Detection Systems
F51.1 Overview
In the oil and gas sector it is common to have on-line leak detection systems for real
time monitoring of transmission pipelines. All such systems have the same underlying
principle; continuous on-line monitoring of flow parameters (flow and/or pressure) at the
upstream and downstream ends of a pipeline is used to determine if there are any hydraulic
anomalies.
Approaches range from simple comparison of “metered out” volumes with “metered
in” volumes, the monitoring of ‘rate of change’ in parameters of interest, and complex
computational pipeline monitoring.
Computational Pipeline Monitoring (CPM) uses an algorithmic approach to detect
hydraulic anomalies in pipeline operating parameters. The data from sensors is fed into a
computer model that can indicate if there is a new leak within the sensitivity of the algorithm.
The CPM system then provides an alarm and displays other related data to the pipeline
controllers to aid in decision-making.
F51.2 Main Principles
Continuous on-line monitoring of flow and pressure is carried out at the upstream and
downstream ends of a pipeline. The simplest approaches compare “metered out” volumes with
“metered in” volumes. Other relatively straight forward approaches look at the rate of change
in monitored parameters; operating parameters are monitored at various points along the
pipeline and the system reacts when there is a change at an abnormal rate.
More complex approaches utilize complex computational monitoring systems that
simultaneously monitor numerous operating conditions. Flow, pressure and other data are fed
into a mathematical model of the pipeline. The system then continuously compares the
measured values with the values predicted by the model. A discrepancy between measured and
predicted value indicates a change in the operating characteristics of the pipeline; for example,
the presence of a new leak or other hydraulic anomaly.
F51.3 Application
Used as a technique for leak detection in the oil and gas industry by pipeline operators
to protect the public and the environment from consequences of a pipeline failure. There is the
potential to expand use into the water industry for the monitoring of transmission pipes.
F51.4 Practical considerations
This approach to on-line leak detection is commonly adopted in the oil and gas sector.
The technique relies upon relatively frequent monitoring of at least one flow and one
pressure at opposite ends of the pipeline. A potential difficulty in applying this
technique to the water sector is that pipeline flow needs to be monitored to high degree
of accuracy, which is currently not standard practice.
With an algorithmic approach to detect hydraulic anomalies, the technique can only
indicate the presence of a new leak; any leak existing when the model was first
calibrated will form part of the steady state conditions. A significant leak can, however,
be indicted by the difficulty in making the model fit or in a discrepancy between the
flow into and out of the pipeline.
Condition Assessment Strategies and Protocols for Water and Wastewater Utility Assets
F-149
Operational transients such as pump starts, line fills, valve closures, etc., may be
modeled as well, so that this automatic leak detection system can continue to work
during operational changes that occur in the normal day-to-day operation of the
pipeline system.
F51.5 Advantages
Provides real time assessment of structural condition through detection of new leaks.
F51.6 Limitations
Cost could be prohibitive in the water sector except where there are specific risk and
revenue drivers.
Table F-53. Summary On-Line Leak Detection Systems.
Technical
selection
Technical
suitability
Utility technical
capacity
Criteria
Assets covered
Material type
Service area
Access requirements
Limitations relating to asset condition
Limitations relating to asset size/geometry
Continuous/discrete
Destructive/non destructive
Interruption to supply/function
Assessment parameters
Integration with software tools
Commercialization of tool
Previous/existing use of the tool in sector
Accuracy/reliability
Ease of validation of results
Asset management sophistication required
Skills required (level of tool sophistication); usability
Technology required (level of tool sophistication)
Documentation
Availability of technical support
F-150
Assessment
Water pipelines.
N/A
Potable.
None, on-line monitoring technique.
Applicable to structurally sound assets.
None, though only cost-effective for large
mains.
Continuous readings.
Non-destructive.
Asset remains on-line.
Change in flow parameters that indicate a leak.
By definition, integrated software tool.
Developed for the oil and gas sector.
No uptake in the water sector.
Quantitative assessment.
Difficult to validate except by locating new leak.
Would require a high degree of sophistication to
justify.
Automated monitoring.
High level of instrumentation; sophisticated
tools.
N/A
N/A
F52.0 PARMS-Planning
F52.1 Overview
The Pipeline Asset and Risk Management System (PARMS) is a suite of computerbased models developed by CSIRO, designed to assist in the management of water supply
network assets. Two tools have been commercialized to date; PARMS-Planning and PARMSPriority. PARMS-Planning is designed to be used annually for long-term planning and
regulatory reporting, whereas PARMS-Priority is designed to be used on a regular basis to
allow determination of which assets to rehabilitate to meet the water utility’s strategies (see
PARMS-Priority review).
PARMS-Planning is a software tool that allows assessment of both short and long-term
repair and replacement strategies for water pipelines. The PARMS-Planning software can be
used to:
1. Forecast the expected annual number of failures.
2. Assess replacement based upon the predicted number of failures in any one year.
3. Calculate the cost implications of different management and operational scenarios.
PARMS-Planning assesses replacement needs based upon the predicted number of pipe
failures, in conjunction with the policy adopted by the water utility. The failure rates of each
pipe are estimated for each year in the forecast period. The product of the failure rate and the
length of the pipe give the number of failures for that pipe asset. The total number of failures in
the system in any one-year is given by the aggregate of failures for individual assets.
F52.2 Main Principles
The overall approach used by PARMS-Planning is to forecast the expected annual
number of failures for each individual pipe asset over the long term (the next 30 to 100 years),
based on various determinants including the age of each asset, its installation and operating
conditions, and its failure history. The calculation process for each year involves the following:
Estimating the expected number of failures of each pipe for each of the years in the
forecast period using a relevant statistical or physical probabilistic failure model. This
expected number is then converted into an integer number of failures using a negative
binomial probability distribution.
Estimating the cost of each failure. This involves modeling whether the failure was
repaired by clamping; how long the interruption was and when it started; and
consequentially what rebates and penalties applied (where regulators require such
payment); and whether neighboring pipes also experienced an interruption.
Evaluating (in conjunction with a set of policy options) which pipes should be
considered for replacement. Pipes that are identified as replacement candidates are then
either replaced or considered for shut-off valve insertion (inserting a valve to reduce the
number of customers impacted by a pipe failure). The cost of the selected option is
accumulated.
The costs of maintenance are provided within PARMS-Planning per repair, and the cost
of replacement assets are calculated from costs per unit length. Replacements reduce the length
of existing assets and create a new asset in the year of replacement.
The chosen policy options determine when a pipe is a candidate for replacement. This
can be on the basis of the number of failures experienced by the pipe, the number of unplanned
Condition Assessment Strategies and Protocols for Water and Wastewater Utility Assets
F-151
interruptions, or the net present value of the future costs of the alternatives of maintenance or
replacement.
As noted, the analysis can be tailored to the strategy/policy of individual utilities, but in
general those assets that have multiple failures in any one-year are targeted for replacement
(the number of allowable failures per year depending upon customer preference).
F52.3 Application
PARMS-Planning is used to undertake long term strategic planning for water
distribution networks and model the impact that management strategies will have on
performance.
F52.4 Practical considerations
PARMS-Planning is a commercial software package that has been implemented in
several authorities in Australia. It is a Windows based application with an easy to use
GUI.
PARMS-Planning requires failure curves to be developed through the analysis of the
utility’s data. These curves are utilized in the forecasting of network performance and
provide the basis for the management modeling scenarios. Generic failure curves are
currently being developed by CSIRO.
Users of the software have reported that it has enabled them to better understand the
long term implications of their management strategies and has provided insight into
how their networks are actually performing.
F52.5 Advantages
The expected failure rate over time can be described for every individual asset in the
network.
PARMS-Planning is able to assess replacement based upon the predicted number of
failures in any one year, and thus is able to include customer preferences for supply
interruptions.
The software allows the modeling of modified asset management strategies that might
occur as a result of regulatory changes or business objective changes.
A combination of graphical and tabular outputs provides users with a detailed
breakdown of network performance by pipe material, pipe age, failure type, etc.
The system incorporates a simple GIS interface that allows network information to be
displayed in an incorporated GIS viewer.
F52.6 Limitations
PARMS-Planning requires good quality asset data as well as failure history data in
order to develop the failure curves.
The failure curve development is normally undertaken by consultants and is an
additional cost to the software package.
F-152
Table F-54. Summary PARMS Planning.
Technical
selection
Technical
suitability
Criteria
Assets covered
Granularity
Service area
Focus of analysis
Scalability of tool/approach
Commercialization
Previous/existing use of the tool
Ease of validation
Flexibility with regard to analysis (asset types) and
granularity (system, asset level)
Integration with other tools/GIS
Utility technical
capacity
Asset management sophistication
In-house skills required
Technology required
Documentation
Data Requirements
Linking to asset data
Availability of software and technical support
Usability
Assessment
Pipes, water pipeline infrastructure.
System and asset level.
Potable
Long term asset management planning using
asset failure curves developed from utility asset
data.
Better suited to medium to large authorities
where good asset data is available; a ‘light’
version is currently in development that could be
more suited to small utilities.
Commercial software.
Used by several large utilities in Australia .
Initial validation is provided in statistical analysis
of failure data and development of failure
curves.
Potable only. Subsystem to system level.
Integrates with most database systems and
requires standard GIS shape files for GIS
implementation.
Aimed at higher level of asset management
where good asset data is available.
Asset manager/engineer.
PC based tool. Windows based operating
system.
Research and development fully documented.
Good quality asset data and asset failure history
data is required.
Linking to utility asset database is provided in
initial setup.
Software available through CSIRO, as is
technical support.
Simple user interface, once data is loaded.
F52.7 Bibliography
1. Burn, L. S., Tucker, S. N., Rahilly, M., Davis, P., Jarrett, R., and Po, M. Asset planning for
water reticulation systems - the PARMS model. Water Science and Technology: Water
Supply, 3(1-2), 55-62, 2003
2. Burn, S., Ambrose, M. D., Moglia, M., and Tjandraatmadja, G. PARMS - An approach to
strategic management for urban water infrastructure. IWA Leading edge conference on
strategic asset management. San Francisco, 26-27 July, 2004
3. Burn, S., Ambrose, M. D., Moglia, M., Tjandraatmadja, G., and Buckland, P. Management
strategies for urban water infrastructure. IWA World Water Congress. Marrakech,
Morocco, October, 2004
Condition Assessment Strategies and Protocols for Water and Wastewater Utility Assets
F-153
F53.0 PARMS-Priority
F53.1 Overview
The Pipeline Asset and Risk Management System (PARMS) is a suite of computerbased models developed by CSIRO, designed to assist in the management of water supply
network assets. Two tools have been commercialized to date; PARMS-Planning and PARMSPriority. PARMS-Planning is designed to be used annually for long-term planning and
regulatory reporting (see PARMS-Planning review), whereas PARMS-Priority is designed to
be used on a regular basis to allow determination of which assets to rehabilitate to meet the
water utility’s strategies.
PARMS-Priority is a software tool that assists water authorities to make tactical
renewal and valve insertion decisions for water distribution pipes and networks. The PARMSPriority software can be used to:
Prioritize between pipe assets targeted for potential renewal.
Develop work packages for effective programming of pipe replacement.
Evaluate pressure reduction scenarios.
Analyze shut-off block reduction scenarios (inserting valves to reduce the number of
customers impacted by a failure).
Facilitate information management of water pipe asset and failure information.
Predict pipeline failures and costs for individual assets; including service levels.
F53.2 Main Principles
PARMS-Priority is designed to compliment PARMS-Planning by allowing water
utilities to spend available renewal budgets in an efficient manner by supporting the renewals
prioritization process. The analysis undertaken within PARMS-Priority is based on estimating
risk; risks involved with different scenarios and options are assessed using a standard risk
management approach, as per Australia/New Zealand standards. Risk is calculated by
combining the output of failure prediction models with the output of cost assessment models.
The failure forecasting is developed from a utility’s failure database using statistical
analysis. Depending upon pipe material, failure predictions are based on either statistical NonHomogeneous Poisson models or physical probabilistic models. The predictions provide failure
rates and probabilities for each pipe in the network, taking into consideration the age of the
pipe, material type and diameter, operating pressure, length of pipe, the pipe’s failure history
and where possible soil. The costs and consequences of failures are related to repairs, customer
supply interruptions – rebates, penalties and customer preferences, as well as flooding and
damages.
Costs and failure rates and probabilities are combined to associate risk values with
different scenarios relating to pipeline renewal, pressure reduction and valve insertions.
Scenarios are ranked on various risk and financial indicators such as net-present value of
savings/losses, and payback period.
F53.3 Application
PARMS-Priority is used to prioritize a water pipe renewal program by targeting high
risk assets.
F-154
F53.4 Practical considerations
PARMS-Priority is a commercial software package that has been used in several
authorities in Australia. It is a Windows based application with an easy to use GUI.
As with PARMS-Planning, PARMS-Priority requires failure curves to be developed
through the analysis of the utility’s data. These curves are utilized in the forecasting of
network performance and provide the basis for the management modeling scenarios.
Generic failure curves are currently being developed by CSIRO.
F53.5 Advantages
Failure predictions are based on rigorous analysis of the failure history of pipe groups.
PARMS-Priority supports the user in identifying renewal clusters, and evaluating the
effects of pressure reduction and valve insertions.
The risk calculation engine can be used to investigate user-specified scenarios and to
prioritize between different actions, which allows for proactive asset management.
A query engine allows authorities to target specific areas of their network to review
performance. A combination of graphical and tabular outputs provides users with a
detailed breakdown of asset performance by pipe material, pipe age, failure type, etc.
The system also incorporates a simple GIS interface that allows asset information to be
displayed in an incorporated GIS viewer.
F53.6 Limitations
PARMS Priority requires good quality asset data to be available as well as failure
history data in order to develop the failure curves.
The failure curve development is normally undertaken by expert consultants and is an
additional cost to the software package.
Table F-55. Summary PARMS-Priority.
Technical
selection
Technical
suitability
Criteria
Assets covered
Granularity
Service area
Focus of analysis
Scalability of tool/approach
Commercialization
Previous/existing use of the tool
Ease of validation
Flexibility with regard to analysis (asset types) and
granularity (system, asset level)
Integration with other tools/GIS
Assessment
Pipes, water pipeline infrastructure.
System, sub-system and Asset level.
Potable.
Decision support system to assist water
authorities make renewal and valve insertion
decisions for water distribution pipes.
Better suited to medium to large authorities
where good asset data is available.
Commercial software.
Used by several large utility in Australia.
Initial validation is provided in statistical analysis
of failure data and development of failure
curves.
Potable only; asset to system level.
Integrates with most database systems and
requires standard GIS shape files for GIS
implementation.
Condition Assessment Strategies and Protocols for Water and Wastewater Utility Assets
F-155
Utility technical
capacity
Criteria
Asset management sophistication
In-house skills required
Technology required
Documentation
Data Requirements
Linking to asset data
Availability of software and technical support
Usability
Assessment
Aimed at higher level of asset management
where good asset data is available.
Asset manager/engineer.
PC based tool. Windows based operating
system.
Users standard asset classification system as
developed by WSSA Australia, but can be
tailored to other regional standards.
Good quality asset data and asset failure history
data is required.
Linking to utility asset database is provided in
initial setup.
Software available through CSIRO, as is
technical support.
Simple user interface, once data is loaded.
F53.7 Bibliography
1. Moglia, M., Burn, S., Meddings, S. Decision support system for water pipeline renewal
prioritisation, ITcon Vol. 11, pp 237 – 256, 2006
F-156
F54.0 Passive Acoustic Inspection of Pipes (Acoustic Emission)
F54.1 Overview
This technique is a non-destructive method used to detect the release of sound energy
when wires in pre-stressed concrete pipes fail.
During the manufacture of pre-stressed concrete pipes (also known as pre-stressed
cylinder concrete pipe or PCCPs) high strength steel cables (bundles of steel wires) are
wrapped under tension around a central core to apply a compressive stress to the concrete. As
the pipe degrades, the steel cables corrode. Eventually, wires will break releasing the stored
energy, the majority of which is released as sound. This sound propagates along the pipe via
the pipe wall and the water within the pipe.
As deterioration continues, the prestressing cable will continue to corrode and wires
will break releasing more energy in a series of discrete events; these can be detected by
hydrophones or other sensors.
F54.2 Main Principles
Passive acoustic inspection uses acoustic sensors, hydrophones or accelerometers to
detect failures occurring in the prestressing wire of pre-stressed concrete pipes. To locate these
pipe sections, the sensors are placed along the pipeline while the pipe is in service to log when
a wire fails. The location of a failure is determined by using data from the sensors on either
side of the failure. The time difference between the sound reaching the two sensors, the speed
of sound in water, and the distance between the sensors is used to locate where the failure
occurred.
Acoustic sensors can be located in assets on a temporary basis or as a permanent means
of pipeline monitoring.
F54.3 Application
Passive acoustic inspection is used to locate actively deteriorating sections of prestressed concrete pipe.
F54.4 Practical considerations
The monitoring technique is fully commercialized and used to manage the risk
associated with the catastrophic failure of pre-stressed concrete pipes.
The sensor spacing is limited by the presence of discontinuities in the pipeline between
the failure and the sensors, such as valves or elbows.
Sensor spacing can range from 300 ft to 1500 ft based on the pipeline diameter and
presence of discontinuities.
Inspections are generally used on pipes greater that 30” diameter.
Hydrophones are inserted into the water column through a minimum of a ¾’’ tap.
Accelerometers are installed directly on the pipe surface. Both sensors can be installed
when the pipeline is in service.
F54.5 Advantages
Actively deteriorating sections of pipe can be located without exhuming the pipe or
removing it from service; the rate of deterioration can be determined to prioritize
replacement.
Condition Assessment Strategies and Protocols for Water and Wastewater Utility Assets
F-157
Sensors can be left in place as a permanent means of monitoring asset condition.
Technique can also detect sounds produces during cracking of the concrete.
Inspection is not limited by heavy walled PCCP.
Manhole access is not required.
F54.6 Limitations
Accuracy of section location is affected by discontinuities in the pipeline between the
failure and the hydrophones.
This technique does not quantify the amount of broken wires in the pipe.
Table F-56. Summary Passive Acoustic Inspection of Pipes (Acoustic Emission).
Technical
selection
Technical
suitability
Criteria
Assets covered
Material type
Service Area
Access requirements
Limitations relating to asset condition
Limitations relating to asset size/geometry
Continuous/discrete
Destructive/non destructive
Interruption to supply/function
Assessment parameters
Integration with software tools
Commercialization of tool
Previous/existing use of the tool in sector
Accuracy/reliability
Ease of validation of results
Utility technical
capacity
Economic factors
F-158
Asset management sophistication required
Skills required (level of tool sophistication);
usability
Technology required (level of tool sophistication)
Documentation
Availability of technical support
Cost per inspection
Resource requirements
Assessment
Pipes.
Pre-stressed concrete.
Potable and wastewater.
¾’’ access required for entry of hydrophone into
water column or exposed pipe surface for
accelerometer.
None.
Generally used for 30’’diameter and above.
Continuous.
Non-destructive test.
Inspection requires pipe to be on-line.
Location and number of wire related events
during the monitoring period.
Can be telemetered.
Tool is available from several commercial
suppliers.
Wide use in North America.
Quantitative.
Results can be validated by exposing a pipe
section for visual inspection and/or performing a
RFEC/TC inspection.
Generic approach
Training in use of equipment is required. Analysis
of results conducted by experts.
Specialized equipment is used, can be obtained
from supplier or testing can be conducted by
contractors.
Use documented in the literature.
Tool support available from supplier.
Pipeline specific.
Units are battery powered.
F54.7 Bibliography
1. The pressure pipe inspection company homepage,
http://www.ppic.com/services/aet.asp, accessed 2006
2. Dingus, M., Haven, J. and Austin, R. Nondestructive None Invasive Assessment of
Underground Pipes, AwwaRF, USA, 2002
3. Makar, J. M. ; Chagnon, N. Inspecting systems for leaks, pits, and corrosion, National
Research Council of Canada, Institute for Research in Construction, NRCC-42802
(downloaded from www.nrc.ca/irc/ircpubs), 1999
Condition Assessment Strategies and Protocols for Water and Wastewater Utility Assets
F-159
F55.0 Performance Testing of Rotating Machinery
F55.1 Overview
Performance testing of rotating machinery is a non-destructive method used to assess
whether equipment is operating as per the original specification or manufacturer’s data.
Performance tests are usually conducted in the manufacturer’s shop as part of ‘factory
acceptance testing’ and again on-site as part of ‘site acceptance testing’. Ideally performance
tests should also be carried out periodically to ensure that equipment continues to operate
satisfactorily. Periodic performance tests can reveal deterioration and inefficiencies in
equipment that can lead to significant savings on power bills and maintenance costs.
F55.2 Principles
To undertake a performance test, a rotating machine needs to be run under a range of
operating conditions. For example, the shaft speed or applied load can be altered to give a
range of test results. For each operating condition, data needs to be collected that can be used
to calculate parameters such as efficiency and load capacity. The data collected and parameters
calculated will depend on the particular type of rotating machinery under analysis. The test
results are compared to the specification or manufacturer’s data to determine if the equipment
is operating as required.
Performance testing of pumps is particularly common. For on-site pump testing, a
range of flow conditions can be tested by adjusting the position of a downstream valve to alter
the pump delivery head. Upstream and downstream calibrated pressure gages and a flow meter
are required for this testing. Typically, the flow rate, suction head, delivery head and motor’s
current are measured. The results can be plotted on top of the manufacturer’s pump curves to
show the difference between the actual operating performance and the design (or optimal)
operating performance. The manufacturer will typically guarantee that a pump will operate
within a particular range of the pump curve. Performance testing of pumps can help diagnose
pump problems such as cavitation, impeller damage and case damage. Noise, temperature and
vibrations may also be measured as part of the pump performance test.
F55.3 Application
Performance testing is applicable to all rotating machinery. Applications for the water
and wastewater industry include pumps, fans, motors, screw conveyors, air blowers,
compressors, mixers and centrifuges.
ANSI/HI 1.6-2000 Centrifugal Pump Tests.
ANSI/HI 2.6-2000 Vertical Pump Tests.
ANSI/HI 12.1-12.6 (A128) Rotodynamic (Centrifugal) Slurry Pump Standard.
ISO 9906:1999 Rotodynamic pumps - Hydraulic performance acceptance tests - Grades
1 and 2.
ISO 13380:2002 Condition monitoring and diagnostics of machines - General
guidelines on using performance parameters.
F55.4 Practical Considerations
In order to undertake a performance test the rotating machinery needs to be operated
under a full range of operating conditions.
F-160
F55.5 Advantages
The performance of equipment can degrade significantly with time. Performance
testing can highlight inefficiencies and the need for the repair or replacement of
components, which can lead to cost savings.
F55.6 Limitations
On-site performance tests can be limited by the equipment available to take
measurements. For example, a pump performance test is limited by the location of the
pressure gauge. If a pressure gauge cannot be located close to the pump then the
measurement will be affected by friction head losses in the pipe and fittings giving
unreliable results.
Table F-57. Summary Performance Testing of Rotating Machinery.
Technical
selection
Criteria
Assessment
Assets covered
Pumps, fans, motors, screw conveyors, air
blowers, compressors, mixers and centrifuges.
N/A
Potable and wastewater.
None.
It may be decided that equipment in poor
condition should not be exposed to the full
range of operating loads and conditions.
N/A
Continuous readings over test duration.
Non-destructive.
On-line.
The performance of rotating machinery, e.g.,
efficiency, head, pressure, noise, vibration.
It is possible to use SCADA software to record
the measured data.
Tool is fully developed.
Widespread use throughout the water and other
sectors.
Dependent on the accuracy of the measuring
devices, e.g., flow meters, manometers.
Validation by repetition.
Generic approach.
The operator needs to be able to interpret the
data collected. For instance, they should be
able to read pump curves.
Only basic measurement devices are required.
SCADA may be used to track the results but is
not required.
ANSI/HI 1.6-2000, ANSI/HI 2.6-2000,
ISO 9906:1999, ISO 13380:2002.
Technical support is available from
manufacturers.
Low cost per inspection.
One operator required.
Material type
Service area
Access requirements
Limitations relating to asset condition
Technical
suitability
Limitations relating to asset size/geometry
Continuous/discrete
Destructive/non destructive
Interruption to supply/function
Assessment parameters
Integration with software tools
Commercialization of tool
Previous/existing use of the tool in sector
Accuracy/reliability
Utility technical
capacity
Ease of validation of results
Asset management sophistication required
Skills required (level of tool sophistication); usability
Technology required (level of tool sophistication)
Documentation
Availability of technical support
Economic
factors
Cost per inspection
Resource requirements
Condition Assessment Strategies and Protocols for Water and Wastewater Utility Assets
F-161
F55.7 Bibliography
1. ANSI/HI 1.6 (M104) American National Standard for Centrifugal and Regenerative
Turbine Pump Tests
2. ANSI/HI 2.6 (M108) Vertical Pump Tests
3. ISO 9906:1999 Rotodynamic pumps - Hydraulic performance acceptance tests - Grades 1
and 2.
4. ISO 13380:2002 Condition monitoring and diagnostics of machines - General guidelines on
using performance parameters
5. ANSI/HI 12.1-12.6 (A128) Rotodynamic (Centrifugal) Slurry Pump Standard
F-162
F56.0 Phenolphthalein Indicator (Carbonation Testing)
F56.1 Overview
The phenolphthalein indicator test is a quick method used to indicate the presence of
free lime in cementituous materials.
Samples are removed from the structure being tested, such as a pipe section, and
stained with the indicator. Areas with low or no free lime content remain colorless, while areas
with free lime remaining turn pink.
A freshly exposed sample is required. For a pipe section, the sample must be extracted
(see Cut-Out Sampling and/or Core/Coupon Sampling reviews).
F56.2 Main Principles
Phenolphthalein is a pH indicator that changes color, from colorless to pink/red in
alkaline environments where the pH is greater than approximately 9.6; below this pH the
indicator remains colorless. Since free lime has an alkalinity of approximately 12.5, the
phenolphthalein indicator test is a good indicator of free lime. The depth of carbonation and/or
leaching in cementituous materials can thus be detected.
Cementituous materials become carbonated due to the action of carbon dioxide; carbon
dioxide reacts with moisture in the cement/concrete to form carbonic acid. This then reacts
with the free lime to form calcium carbonate. The rate of carbonation is dependent on the
permeability and moisture content of the concrete. Over time, the depth of carbonation will
increase.
Leaching of free lime occurs when water in contact with the concrete/cement surface
dissolves free lime, which is then transported away. This occurs in situations where running
water is in contact with the asset, such as for asbestos cement pipelines.
The service life of concrete assets with steel reinforcement depends on the ability of the
concrete to protect the reinforcement from corrosion. In good quality reinforced concrete, the
steel reinforcement is chemically protected from corrosion by the alkaline nature of the
concrete. The highly alkaline environment promotes the formation of a passive and protective
oxide layer around steel reinforcing bars (Campbell et al, 1991).
The lack of free lime at the surface of the steel reinforcement reduces the alkalinity to
the point where the passive protection layer cannot be maintained. The steel reinforcement is
therefore free to corrode in the presence of moisture and oxygen. This will eventually lead to
spalling of the concrete and failure of the asset.
As above, the tensile strength of a concrete or asbestos cement pipe also falls over time
due to the removal of free lime. Free lime can be leached (washed) out of the cement matrix by
water, or can be chemically converted by carbonation.
F56.3 Application
The phenolphthalein indicator test is used to detect the presence of free lime in
cementituous assets.
F56.4 Practical considerations
Phenolphthalein indicator is widely used in a number of industries as a general
indicator of alkalinity. For this reason it is readily available from numerous suppliers.
Condition Assessment Strategies and Protocols for Water and Wastewater Utility Assets
F-163
For the purpose of indicating the presence of free lime phenolphthalein indicator is
simple to use and widely used for condition assessment.
When conducting testing all dust created in exposing the surface to be tested should be
removed as this can give false readings. Where holes have been drilled into slabs of
material, the edges of the holes should be chipped at to expose a fresher surface prior to
testing.
The boundary between free lime and carbonated material is blurred due to variations in
material structure. Repeatability in the tests is good; variation of ± 5mm has been found
(Campbell et al, 1991).
The phenolphthalein test can be conducted on-site or in the lab and requires a freshly
exposed surface as carbonation begins immediately on exposure to air.
F56.5 Advantages
•
Phenolphthalein indicator is readily available and easy to use. The test is cheap, fast
and simple to conduct. The test can be conducted in the field or in the lab.
F56.6 Limitations
Test requires some damage to the asset being tested.
Phenolphthalein indicator solution is flammable and appropriate precautions need to be
taken.
Phenolphthalein indicator should not be ingested.
Table F-58. Summary Phenolphthalein Indicator (Carbonation Testing).
Technical
selection
Criteria
Assets covered
Material type
Service area
Access requirements
Limitations relating to asset condition
Limitations relating to asset size/geometry
Continuous/discrete
Destructive/non destructive
Interruption to supply/function
Technical
suitability
Assessment parameters
Integration with software tools
Commercialization of tool
Previous/existing use of the tool in sector
Accuracy/reliability
Ease of validation of results
F-164
Assessment
Any cementituous asset type, civil also.
Cementituous materials only.
Potable and wastewater.
Freshly exposed sample required. For pipes section
must either be extracted or a core sample taken.
No restrictions.
No restriction.
Discreet.
At least part of the asset is damaged/removed to allow
testing.
Non-pressure pipes can remain in use if only a core is
taken above flow. Pressure pipes need to be taken offline for sample removal/testing.
Remaining free lime, used to infer carbonation depth.
Stand alone.
Widely available.
Widely used.
Qualitative indicator; the boundary between
carbonated and non-carbonated areas is some what
blurred, others areas are clearly identifiable.
Direct measurement.
Utility technical
capacity
Criteria
Asset management sophistication required
Skills required (level of tool sophistication);
usability
Technology required (level of tool
sophistication)
Documentation
Availability of technical support
Economic factors
Cost per inspection
Resource requirements
Assessment
Generic approach.
Easy test to conduct by following simple procedure.
No sophisticated tools required to conduct test.
Specialized tools may be required to obtain samples
depending on location and type.
No known standard test methods. Specific chemical
information can be obtained from MSDS,
CAS# 77-09-8.
Knowledge of phenolphthalein is widespread and
easily obtainable.
Low cost.
Resources are required to obtain sample, e.g.,
exposing pipeline and removing sample.
F56.7 Bibliography
1. Dorn, R., Howsam, P., Hyde, R.A. and Jarvis, M.A Water mains: Guidance on assessment
and inspection techniques, CIRIA Report 162, Construction Industry Research and
Information Association, London, England, 1996
2. Randall-Smith, M., Russell, A. and Oliphant, R., Guidance manual for the structural
condition assessment of trunk mains, WRc, UK, 1992
3. Campbell, D., Strum, R. and Kosmatka, S., Detecting Carbonation, Concrete Technology
Today, Volume 12, Number 1, 1991
Condition Assessment Strategies and Protocols for Water and Wastewater Utility Assets
F-165
F57.0 Pipe Potential Surveys
F57.1 Overview
Pipe potential surveys are used to gain an understanding of the electrochemical
interaction between ferrous pipes and the surrounding soil. The pipe-to-soil potential is
measured using a voltmeter and a reference electrode. If electrical connection to the asset can
be made above ground, for example connection to a valve, this does not require exhumation of
the pipe.
The pipe-to-soil potential measured during testing is useful for identifying areas of for
further analysis, including areas where coatings have deteriorated or been damaged. However,
some practitioners consider the application is limited for coal tar enamel coatings due to the
high number of defects generally found in these coatings.
F57.2 Main Principles
There are two main types of pipe potential survey. For pipelines with a high quality
external protective coating, a Direct Current Voltage Gradient (DCVG) survey can be used to
determine the location of gaps in the coating.
The technique involves imposing a direct current on the pipe and measuring the
difference in the pipe-to-soil voltage between two reference electrodes (Cu/CuSO4), which are
gradually moved along the whole length of the main. At gaps in the coating, the imposed
electrical current leaks to earth and there is a significant increase in the voltage gradient
compared to sections of the main where the coating is complete.
The second survey technique determines the pipe-to-soil potential along the length of
the main using a single reference electrode (Cu/CuSO4) and without an imposed current. This
approach is most useful for mains that have either a low quality or no external coating and
where electrical continuity is created by the run lead method of jointing.
In order to convert pipe-to-soil potential into corrosion rate, information is required
about the soil in which it the potential measured. This requires the soil to be sampled every 50
to 100 meters. Sections of the main in different soils are then exposed and their external
condition directly assessed in order to ‘calibrate’ a particular value of pipe-to-soil potential.
A variant of the second form of pipe potential survey should be carried out on a regular
basis where a cathodic protection system is installed. If a pipe’s potential is not suppressed
sufficiently (≤-850 mV Cu/CuSO4 scale) it will continue to corrode. If its potential is
suppressed too much (≈ ≤-1200 mV Cu/CuSO4), excessive alkali can be produced at the pipe
surface leading to the possibility of delaminating of the protective coating.
F57.3 Application
Pipe potential surveys measure the voltage between ferrous pipes and the surrounding
soil. The technique is most applicable to continuously welded steel pipes, which have good
quality external coatings. The voltage can either be the result of an applied current, in the case
of DCVG testing, or electrochemical corrosion cells.
Other techniques are also available which rely on similar techniques, including the
Pearson Survey, the Current Attenuation Survey and the Close Interval Potential Survey. The
Pearson Survey and the Current Attenuation Survey are used to assess the condition of pipe
external linings. The Close Interval Potential Survey is used to determine the level of cathodic
protection throughout a pipeline.
F-166
BS 7361 refers to some of these techniques.
F57.4 Practical considerations
For the DCVG technique to work, the main has to be electrically continuous. This is
usually the case with steel pipes joined by welding, where the condition of the external
coating is critical for the satisfactory long term performance of the main.
To measure the pipe-to-soil potential, a fine insulated trailing wire is connected to the
pipeline, preferably at an accessible point such as a valve or air valve. The other end is
connected to a voltmeter and then the copper/copper sulfate electrode(s). When in
contact with the ground, the electrodes complete the electrical circuit and allow the
pipe-to-soil potential to be read from the voltmeter.
Pipe potential readings are taken periodically along the pipeline. At any distance, a
constant reading provides some confidence in the results. In contrast, a wildly varying
voltage could indicate the presence of stray current or interference from other pipes.
Water mains coated with coal tar enamel (the default coating in many areas up until the
1980/90’s) will invariably find numerous coating defects, and in some cases continuous
defects where the coating has split due to soil stresses.
F57.5 Advantages
The techniques are non-destructive and can be successful in locating corrosion
hotspots.
Technique may not require a pipe to be exhumed for examination and pipelines can
remain in service.
Locates areas of likely corrosion and indicated if more invasive assessment is required.
F57.6 Limitations
Varying moisture contents in soils over the year will cause variation in results.
Techniques may miss very small isolated areas of corrosion.
Results are affected by the presence of stray currents.
The more advanced techniques require highly specialized equipment and trained
personnel.
Table F-59. Pipe Potential Surveys.
Technical
selection
Criteria
Assets covered
Material type
Service Area
Access requirements
Limitations relating to asset condition
Limitations relating to asset size/geometry
Continuous/discrete
Destructive/non destructive
Interruption to supply/function
Assessment
Buried pipes.
Externally coated ferrous pipes.
Potable and wastewater.
Electrical contact with asset is required.
DCVG requires pipe to have a good coating
(used for locating flaws in coatings). Not such
requirement for pipe-to-soil testing.
Limited to continuously welded steel pipe.
Discrete.
Non-destructive test.
Inspection can be undertaken on-line.
Condition Assessment Strategies and Protocols for Water and Wastewater Utility Assets
F-167
Technical
suitability
Criteria
Assessment parameters
Integration with software tools
Commercialization of tool
Previous/existing use of the tool in sector
Accuracy/reliability
Utility technical
capacity
Ease of validation of results
Asset management sophistication required
Skills required (level of tool sophistication);
usability
Technology required (level of tool sophistication)
Economic factors
Documentation
Availability of technical support
Cost per inspection
Resource requirements
Assessment
Measures electrical potential between a pipe.
and surrounding soil to locate areas of corrosion
potential.
Stand alone.
Tools are fully commercialized.
Pipe potential surveys are widely used in the gas
industry and to a lesser extent in the water
industry.
Quantitative; techniques are considered to be
reliable.
Results can be validated by exposing of pipe.
Generic approach.
Operators require training; specialized training is
required where electrical currents/potential is
applied to pipes.
Pipe-to-soil technique requires specialized
though widely available equipment. Other
techniques require specialized equipment and
training of personnel.
BS 7361.
From service providers.
Depends on technique used.
Depends on technique used.
F57.7 Bibliography
1. Klechka, E. (2004) Corrosion Protection for Offshore Pipelines, Coatings for Corrosion
Protection, Colorado School of Mines; Accessed November 2006 at:
http://www.mines.edu/outreach/cont_ed/coatings1b.htm
2. TechCorr (2005) Pipeline Surveys, TechCorr; Accessed November 2006 at:
http://www.techcorr.com/surveys/index.htm
F-168
F58.0 PiReP/PiReM
F58.1 Overview
The Pipe Rehabilitation Planning System (PiREP) software is a decision support tool
for the management of rehabilitation planning in water supply systems. The software currently
consists of two modules, supporting both long-term strategic rehabilitation management and
mid-term rehabilitation planning.
Strategic planning is undertaken by estimating the annual rehabilitation rates, based on
analysis of failure data for groups of pipes and other operational and environmental
parameters. Mid-term planning is facilitated using a subjective (weighted) risk ranking
approach that provides a priority list of assets.
Pipe Rehabilitation Management (PiReM) is currently under development and is an
enhanced version of the PiReP software.
F58.2 Main Principles
The software was developed as part of a PhD thesis undertaken at the Institute of Urban
Water Management and Water Landscape Engineering at Graz University of Technology, and
has had only limited use within water authorities.
The existing software includes two modules that analyze long-term and medium-term
rehabilitation strategies. These modules are to be revised with further development of the
economic and business management aspects. The addition of GIS functionality is planned.
The main part of the strategic long-term rehabilitation planning is the estimation of
annual rehabilitation rates for groups of pipes considering pipe attributes, existing
environmental influences, aging parameters and failure rates. This requires data from several
years of network operation. The boundaries for the annual planned rehabilitation are given by
calculating pessimistic and optimistic rehabilitation needs.
The medium -term rehabilitation planning module identifies pipes requiring
rehabilitation based on various technical, economical and business management criteria.
Criteria such as high failure rate, potential for corrosion, unusual diameter and unusual material
are considered. The module uses a subjective risk ranking approach to prioritize assets. The
resultant priority list can then be used for the annual planning of future period of five years.
F58.3 Application
The software is designed for the long term and medium term rehabilitation planning of
water supply networks.
F58.4 Practical considerations
The software tool is not fully commercialized; though the PiReP software has been
utilized by two Austrian water supply companies.
F58.5 Advantages
The software allows detailed scenario analysis to be undertaken, which permits
authorities to see the results of modifying rehabilitation rates. This allows the financial
needs for long-term rehabilitation to be estimated.
The mid term rehabilitation module provides a priority list of assets that can be used to
guide annual planning for a future period of five years.
Condition Assessment Strategies and Protocols for Water and Wastewater Utility Assets
F-169
F58.6 Limitations
Non commercial software that has only had limited use in Europe.
Requires several years of network failure data. Consequently, the software is not well
suited for small authorities or authorities with only limited data.
Table F-60. Summary PiReP/PiReM.
Technical
selection
Technical
suitability
Criteria
Assets covered
Granularity
Service area
Focus of analysis
Scalability of tool/approach
Commercialization
Previous/existing use of the tool
Ease of validation
Flexibility with regard to analysis (asset types)
and granularity (system, asset level)
Integration with other tools/GIS
Utility technical
capacity
Asset management sophistication
In-house skills required
Technology required
Documentation
Data Requirements
Linking to asset data
Availability of software and technical support
Usability
Assessment
Pipes, water pipeline infrastructure.
System and asset level.
Potable.
Decision support system for the rehabilitation
planning management of water supply systems.
Better suited to medium to large authorities where
good asset data is available.
Non commercial software, although commercial
release is intended.
Only been used by several European water
authorities during its development.
Validation through statistical analysis.
Potable only; asset to system level.
Requires standard GIS shape files and database files
for GIS implementation.
Aimed at higher level of asset management where
good asset data is available.
Asset manager/engineer.
PC based tool. Windows based operating system.
Needs GIS and spatial data.
Only limited documentation available. Has been
based on the German standards DVGW W 401.
Good quality asset data and asset failure history data
is required.
Uses an authorities GIS data base to transfer
information. ESRI shape files and dbf data files are
required. No direct link to GIS is provided.
Only limited support available at this time.
Software still under development.
F58.7 Bibliography
1. Kainz, H., Gangl, G., and Fischer, W. PiReM – Pipe Rehabilitation Management: Decision
Support System for the rehabilitation management of water supply systems, Graz
University of Technology. Website accessed November 2006 at:
http://www.sww.tugraz.at/sww/Projekte/pirem/Offizielle_Beschreibung_PiReM_englisch_
neu_2005.08.01.pdf
F-170
F59.0 Pit Depth Measurement
F59.1 Overview of Inspection Tool
Pit depth measurement is a manual technique used to infer corrosion rates of ferrous
materials.
Samples are sand blasted and inspected for pitting; the depth of pits are measured using
a pointed micrometer or needle-point depth gauge. The corrosion rate is then estimated, with
care taken not to underestimate results due to corrosion products remaining in the pits (Dorn et
al., 1996). Pit depth measurements can be undertaken as a non-destructive technique in the
field, or a pipe section can be removed for testing in a laboratory.
F59.2 Main Principles
The corrosion of ferrous pipe materials commonly occurs preferentially in localized
areas, resulting in the formation of pits. In order to measure the depth of corrosion pits, the
pipe surface must be sand/grit blasted to remove corrosion products. In situations where a large
number of pits have formed, visual inspection is used to identify the 10 deepest pits for
measuring. However, where only a small number of pits are present they should all be
measured (Dorn et al., 1996).
Pit depth can be measured using several manual instruments, the most appropriate for a
situation depending on the size of the pits found. Larger pits can be measured on site using
pointed micrometer or needle-point depth gauge. Smaller pits need to be examined under a
microscope to determine pit depth (Dorn et al., 1996).
Pit depth alone does not give an indication of asset condition; knowledge of original
wall thickness, general corrosion depth and age are also required to estimate the corrosion rate
and thus remaining life of the asset.
F59.3 Application
Pit depth measurement is relevant only to ferrous materials. Pit depth measurement can
be carried out on site and in the laboratory. More advanced pit depth measurements and those
for small pits require laboratory facilities.
No standards or other documentation found on pit depth measurement, however ASME
B31G-1991 relates to determining the remaining strength of corroded pipelines.
F59.4 Practical considerations
Detailed knowledge of the original wall thickness and general corrosion depth is
sometimes difficult to obtain.
The age of the pipe may not always be relevant in calculating corrosion rate, as in the
case of coated pipelines, since corrosion begins only after failure/removal of this
coating. For these reasons, corrosion rate estimates should be considered relatively
uncertain and this uncertainty should be considered in decision making
Equipment for manual measurement of pit depth is widely available for a number of
commercial suppliers. Field pit depth measurement equipment is easily portable and
simple to use. Lab-based equipment requires skilled operators and can require difficult
sample preparation. Both field and lab techniques give accurate results, though labbased techniques are more accurate and able to measure smaller pits.
Condition Assessment Strategies and Protocols for Water and Wastewater Utility Assets
F-171
Attention is required to ensure that all corrosion products are removed prior to pit depth
measurement. Corrosion of cast iron results in graphitization which retains the shape of
the pipe disguising locations of corrosion.
Manual measurement in other pipeline sectors has been generally superseded by other
techniques. However, the approach is still used in the water sector.
F59.5 Advantages
Simple technique for field measurements giving accurate results.
F59.6 Limitations
Without knowledge of original pipe wall thickness, pit depth measurement cannot be
used to estimate remaining life of the pipe.
Pit depth will be underestimated if the depth of general corrosion surrounding the pit
measured is unknown and so underestimate the actual corrosion rate.
Coatings will limit the accuracy of corrosion rate estimations, as pitting will only begin
after failure of this coating.
Manual pit depth measurement is time consuming.
Table F-61. Summary Pit Depth Measurement.
Technical
selection
Criteria
Assets covered
Material type
Service Area
Access requirements
Limitations relating to asset condition
Limitations relating to asset size/geometry
Continuous/discrete
Destructive/non destructive
Technical
suitability
Interruption to supply/function
Assessment parameters
Integration with software tools
Utility technical
capacity
Commercialization of tool
Previous/existing use of the tool in sector
Accuracy/reliability
Ease of validation of results
Asset management sophistication required
Skills required (level of tool sophistication); usability
Technology required (level of tool sophistication)
Documentation
F-172
Assessment
Buried assets.
Ferrous materials only.
Potable and wastewater.
Pipes must be extracted for lab measurements,
field measurements can be preformed in situ.
Any coating and/or corrosion products on the
asset need to be removed prior to
measurements.
No restriction due to size of asset.
Results are discreet.
Field measurements are non-destructive. Lab
based measurements require sections to be cut
from pipe.
No interruption to supply when done in situ.
Pit depth only.
Results need to be used in conjunction with
other data to obtain useful information.
Equipment is widely available.
Wide use in the sector.
Measurement accuracy is high.
Direct measurement.
Generic approach.
Some training is required for field level
measurements. Lab level measurements require
specialists.
Low level technological sophistication required
from field level measurements. For lab level
measurements specialist equipment is required.
No standards or other documentation found on
pit depth measurement, however ASME B31G-
Criteria
Economic factors
Availability of technical support
Cost per inspection
Resource requirements
Assessment
1991 relates to Determining the Remaining
Strength of Corroded Pipelines.
N/A
Can be expensive due to man hours required
Resources are required to obtain sample, e.g.
exposing pipeline, sandblasting asset surface.
Removal of sample may be required.
F59.7 Bibliography
1. Dorn, R., Howsam, P., Hyde, R.A. and Jarvis, M.A Water mains: Guidance on assessment
and inspection techniques, CIRIA Report 162, Construction Industry Research and
Information Association, London, England, 1996
2. Randall-Smith, M., Russell, A. and Oliphant, R. Guidance manual for the structural
condition assessment of trunk mains, WRc, UK, 1992
Condition Assessment Strategies and Protocols for Water and Wastewater Utility Assets
F-173
F60.0 Process Control Systems (Integrated)
F60.1 Overview of Tool
An overall Distributed Control System (DCS) network monitors/controls assets and
provides preventative maintenance data. PLCs and PCs servers are typically connected on an
Ethernet ring with all field equipment by a Field bus network.
F60.2 Main Principles
When a DCS is implemented, all the plant equipment, starters, variable frequency
drives, instruments, PLCs etc. are connected together by a field bus network (e.g., Profibus).
This allows on-line diagnostics, field device configuration and predictive maintenance from
one central point.
Intelligent field devices provide a lot of diagnostic information. Usually field devices
offer two kinds of diagnostic information: "on-line" (cyclically retrieved) diagnostic
information and "off-line" (acyclically) retrieved information. On-line information offers
current status of the device; e.g., major status and fault bits stored in the device itself. Off-line
information includes more detailed information about the device. This detailed information
also includes historical information stored in the device itself. Both can be accessed with the
equipment in operation.
F60.3 Application
Motor control centers starters (and connected equipment), variable frequency drives,
instruments and any other plant items that can be connected to the Field bus network.
ISO 13374-1:2003; establishes general guidelines for software specifications related to
data processing, communication, and presentation of machine condition monitoring and
diagnostic information.
F60.4 Practical Considerations
Wide use throughout manufacturing industry. Starting to be used in water industry; the
industry is moving towards fully networked control systems.
F60.5 Advantages
Automatic records can be kept and trends observed.
Fieldbus technologies offer some savings in wiring and cross connections costs and
reduced commissioning costs. Field devices can be tested, commissioned and
configured on-line through the network. Checking device parameters can also be done
through the DCS system on-line.
F60.6 Limitations
Not readily applied to existing plant as requires substantial infrastructure changes and
associated costs. Ideal for green field sites or where major new plant is being installed.
F-174
Table F-62. Summary Process Control Systems (Integrated).
Technical
selection
Criteria
Assets covered
Material type
Service area
Access requirements
Limitations relating to asset condition
Limitations relating to asset size/geometry
Continuous/discrete
Destructive/non destructive
Technical
suitability
Interruption to supply/function
Assessment parameters
Integration with software tools
Commercialization of tool
Previous/existing use of the tool in sector
Accuracy/reliability
Ease of validation of results
Utility technical
capacity
Economic factors
Asset management sophistication required
Skills required (level of tool sophistication); usability
Technology required (level of tool sophistication)
Documentation
Availability of technical support
Cost per inspection
Resource requirements
Assessment
All ‘intelligent’ devices.
N/A
Potable and wastewater.
Field bus network is required with component
parts connected to it.
None.
None.
Continuous.
Non-destructive gathers data from on board
memory device.
On-line.
Current / historical status of component. Status
and condition (faults/healthy), number of trips.
Required to be part of a filed bus system.
Fully developed and off the shelf.
Becoming widespread.
Quantitative.
Depends on application, if for example current
drawn by starter, then this can be validated by
clamp on ammeters.
Aimed at a higher level of sophistication.
Once set up an operator can view condition
status data.
Field bus network.
Tool is documented. Standard ISO 13374.
Yes by supplier of fieldbus technology.
N/A
Overall control system can automatically
produce reports.
F60.7 Bibliography
1. ISO 13374-1:2003 : Condition monitoring and diagnostics of machines - Data processing,
communication and presentation - Part 1: General guidelines
Condition Assessment Strategies and Protocols for Water and Wastewater Utility Assets
F-175
F61.0 Pull-off Adhesion Testing
F61.1 Overview of Tool
Pull-off adhesion testing measures the adhesive strength of applied coatings to metal,
concrete, masonry, plastic and wood. The strength of epoxies, mortars, plasters, bituminous
coats, paint finishes and metal coatings can be measured. The surface strength of concrete and
other materials can also be tested directly.
The mechanical tensile strength is tested by applying a perpendicular force, either to
destruction or until the applied force reaches a prescribed value. For this reason the test may be
fully non-destructive in certain situations. However, the review below assumes that testing
continues until coating failure.
F61.2 Main Principles
Pull-off adhesion testing involves measuring the mechanical tensile strength of a
coating by applying an increasing stress to the test surface until the weakest path through the
material fractures. Test equipment generally consists of a hydraulic hand pump, an actuator,
test disks or dollies, an abrasive pad, a cutting tool, adhesive, adhesive mixing sticks and
palettes, a drilling template and drill bits for thick coatings.
During testing, the test dolly is attached to the coating surface with an adhesive. Force
is then applied perpendicular to the surface to maximize tensile stress as compared to the shear
stress (Figure F-11). Failure will occur along the weakest path within the system comprised of
the test fixture, adhesive, coating system and substrate. The weakest path could be along an
interface between the test fixture and the coating, the coating and the substrate, a cohesive
fracture within the coating, a cohesive fracture of the substrate (e.g., concrete) or a
combination of these. Test results are generally given as a pressure, psi or MPa, and can be
related to the strength of adhesion to the substrate.
Figure F-11. Basic Pull-Off Test Setup
(Reprinted with permission from: Kolsaker, T., DFD Instruments, 2006).
F61.3 Application
Pull-off adhesion testing can be used to test the surface strength of any asset. This
primarily applies to assets to which coatings have been applied, but the surface strength of
materials such a concrete can also be tested.
F-176
ASTM C4541, ASTM D4541, BS 1881 Part 207 and ISO 4624 (EN 24624) all define
the method and procedures for carrying out pull-off adhesion testing of paints,
varnishes and other coatings.
F61.4 Practical Considerations
Pull-off test equipment is widely available and falls into two general categories,
manually and automatically applied force. The choice of equipment usually depends on
several factors such as the type of coating, the amount of testing required, test
procedure specifications, and personal preferences.
A range of different sized pull-off adhesion testers are available for measuring coating
adhesion on a variety of substrates. For instance a 20mm dolly is ideal for metal, plastic
and wood substrates, while a 50mm dolly is recommended for masonry substrates such
as concrete. Custom dolly sizes are used to meet specific measuring needs.
The testing standards emphasize that the speed of tensile force increase must be
constant and within specified minimum and maximum values and also consistent from
test to test. For these cases, automatic testers are required rather than manual testers.
Pull-off test equipment is portable so that testing can be conducted in a wide variety of
locations.
The measurement range of equipment varies with the specific surface it was designed
for. Many pull-off adhesion-testing pressure systems are calibrated and certified to at
least ± 2% accuracy and 0.01 N/mm2 resolution. The certified stress range will
generally not cover the full stress range possible by the tester.
Test equipment with a self-aligning dolly enables measurement on smooth or uneven
surfaces without adversely affecting the test results.
In order to enable the testing of thick coatings, a drilling template is used for isolating
the test area from the surrounding coating.
Powerful pull-off adhesion testers have been designed particularly for tensile adhesion
testing of the strongest thermal sprayed coatings (e.g., arc, plasma and HVOF sprayed).
These testers have a certified testing range of 19700 psi (136 MPa). This is higher than
the tensile strength of the strongest heat-curing adhesive (used for gluing the test
elements).
F61.5 Advantages
Pull-off testing can be conducted on a wide variety of substrates and coatings.
Testing is not limited to flat surfaces; curved surfaces such as pipes can be readily
tested.
For concrete coatings, there is no need to embed the sample in the concrete substrate
first.
Self-aligning dolly systems enable force to be consistently distributed over the test area,
preventing earlier failure.
F61.6 Limitations
Measurements are limited by the strength of adhesion bonds between the loading
fixture and the specimen surface or the cohesive strengths of the adhesive, coating
layers, and substrate.
Condition Assessment Strategies and Protocols for Water and Wastewater Utility Assets
F-177
This test can be destructive and spot repairs may be necessary.
If the dollies are not cleaned sufficiently, ‘glue failure’ can occur during testing,
resulting in an inaccurate. Self-leveling pull testing devices can produce far too low-test
results if the pull stress is not 100% evenly distributed throughout the pulled coating. If
not, the area where the stress is concentrated will fracture long before maximum stress
has been reached elsewhere resulting in low readings.
Table F-63. Summary Pull-off Adhesion Testing.
Technical
selection
Criteria
Assets covered
Material type
Service area
Access requirements
Limitations relating to asset condition
Limitations relating to asset size/geometry
Continuous/discrete
Destructive/non destructive
Interruption to supply/function
Technical
suitability
Assessment parameters
Integration with software tools
Commercialization of tool
Previous/existing use of the tool in sector
Accuracy/reliability
Utility technical
capacity
F-178
Ease of validation of results
Asset management sophistication required
Skills required (level of tool sophistication);
usability
Assessment
Metal, concrete, masonry, plastic and wood assets
which are covered in applied coatings, mortars,
plasters, bituminous coats and paint finishes.
Metal, concrete, masonry, plastic and wood.
Potable and wastewater.
Direct contact with asset coating. If asset is buried
then it must be exposed. Surface coatings should be
cleaned.
Coating must not be too deteriorated.
No limitations relating to size. Small diameter curved
surfaces are more difficult to measure. Specialized
models ‘micro testers’ have been designed for the
testing of small test elements and of fragile material.
Discrete reading.
Overall non-destructive, a small patch of coating is
removed from asset.
The asset can remain in use and does not need to be
taken off-line if the coating being tested is external.
The testing of internal coatings will require for the
asset to be taken off-line in order to allow testing to
occur.
The adhesive strength of applied coatings and the
surface strength of concrete.
Stand alone tool and automatic digital adhesion
testers are available. For digital adhesion testers the
stress increase rate is controlled automatically by a
computer and can be set to comply with the relevant
adhesion testing standard.
Tool is fully developed, exists in manual and digital
forms and is available from a range of commercial
vendors.
Widespread use throughout the water and other
sectors.
Some testers are calibrated and certified to ± 1%.
Generally testers have ± 2% accuracy and 0.01
N/mm2 resolution.
Direct measurement.
Generic approach.
Easy to use by following simple procedure. Basic
training in achieving correct alignment of the testing
machine is recommended. The aim of this is to avoid
substantial unwanted stress concentrations in the
tested material, resulting in premature fracture of the
sample.
Criteria
Technology required (level of tool sophistication)
Documentation
Economic factors
Availability of technical support
Cost per inspection
Resource requirements
Assessment
Low level of technological sophistication is needed for
hand held, manual tools. For digital tools the stress
increase rate can be controlled automatically by
computer.
ASTM D4541, ACI 503-30 USA, ISO 4624 (EN
24624) and BS 1881 Part 207.
Technical support widely available from distributors.
Low cost per inspection.
One operator required. Pneumatic or mains powered.
Resources required can also depend on asset being
inspected. Buried assets need to be exposed.
F61.7 Bibliography
1. ASTM D4541 Standard Test Method for Pull-Off Strength of Coatings Using Portable
Adhesion Testers
2. ASTM C4541 Pull-Off Strength of Coatings Using Portable Adhesion Testers
3. ISO 4624 (EN 24624) Paints and varnishes -- Pull-off test for adhesion
4. BS 1881 Part 207 Testing Concrete Part 207: Recommendations for the Assessment of
Concrete Strength by Near-to- Surface Tests
5. DFD Instruments, http://www.dfdinstruments.co.uk/topics/Study5-ASTM-D4541.htm,
accessed 2006
Condition Assessment Strategies and Protocols for Water and Wastewater Utility Assets
F-179
F62.0 Radiographic Testing
F62.1 Overview
Radiography is the use of radiation to obtain a picture (radiograph) of an object. The
intensity of radiation transmitted through the object is recorded, using a photosensitive film or
digital recorder. The process is very similar to x-ray radiography in a hospital; possible
imperfections are indicated as density changes on the film in the same manner as a medical X
ray shows broken bones.
Radiography is a non-destructive technique that has been used to examine ferrous,
cementituous, and plastic pipes (though not GRP). The radiograph shows variations in material
and structure, including changes in density (such as associated with corrosion products),
inclusion of material ingredients (for plastic pipes), and changes in thickness. It can also be
used for inspection of valves.
F62.2 Main Principles
Traditionally a source of radiation, either gamma or x-rays, was passed through the
material and directed onto a photographic film. There is however a trend to replace
radiography film by non-film type radiation detectors; digital radiography uses radiation
detectors for real time radiographic imaging.
Gamma rays emitted from isotopes (usually Iridium-192, Cobolt-60) are used for
ferrous and cementituous materials. X-rays created by cathode-ray tubes are used for plastic
materials.
According to the WRc Trunk Main Structural Condition Assessment Manual, there are
three variations on the basic technique used in the water sector:
Single Wall Single Image: Here the radiation source is put inside the object under
examination and the photographic film placed on the outside; the radiation passes
through a single wall thickness before reaching the film.
Double Wall Single Image: Here the radiation source is placed outside the object under
examination and the photographic plate positioned externally on the opposing side. The
radiation passes through two walls before reaching the film. However, because of the
intensity of the beam, the features of the wall nearest the source become obliterated and
only those of the wall nearest the film are recorded.
Double Loading: This approach is used to radiograph the features of two adjacent
objects between source and film. Two films with different speeds are placed one on top
of the other and exposed for the same time. The result is that the slow film records the
features of the object closest to the source, with the second object under exposed, and
the fast film records the second object from the source with the one nearest over
exposed.
Details of the material structure can be seen on the radiograph; darker areas correspond
to thinner or less dense material. The features on the film can thus be interpreted in a semiquantitative manner:
For ferrous materials, the technique is suitable for detecting pits, due to the difference
in density between corrosion products and the parent metal. Since corrosion products
are less dense, they appear darker on the radiograph. Calibration is required to estimate
the thickness of the corrosion.
F-180
For cementituous materials, radiography can be used to check for voids. The condition
of reinforcement in pre-stressed concrete pipe has also been examined using these
techniques.
For plastic materials, the radiograph can detect inclusions or manufacturing voids; Xray analysis has been used to determine the distribution of lead stabilizers in PVC-U
pipes.
Gamma radiography has also been used to check welds in pipelines that carry natural
gas or oil. Special film is taped over the weld around the outside of the pipe. A machine carries
a shielded radioactive source down the inside of the pipe to the position of the weld. The
radioactive source is then remotely exposed and a radiographic image of the weld produced on
the film. This film is then developed and examined for signs of flaws in the weld.
F62.3 Application
In the water sector, the techniques have been used to examine the condition of pipes
and valves in situ. In process industries, radiography has been proven to be very useful in
detecting different kinds of internal deposits in pipes.
F62.4 Practical considerations
Radiography is one of the most commonly used NDE methods in petrochemical
processing plants. It is understood this technique is not used within the United States
water sector, though it has been used in the United Kingdom water sector.
Radiography has to be carried out by trained staff aware of all the health and safety
issues involved in the use of ionizing radiation. In addition, a certain amount of
experience is required to interpret the radiographs produced.
Exposure times are dependent on section thickness; thicker sections require relatively
longer exposure periods. Similarly, water filled pipes also require relatively longer
exposure times compared to air filled pipes. For pipe diameters greater than 380 mm
(that is, 15”), the main has to be drained down because water is an effective absorbent
of γ-rays. Even for smaller diameters, there is a significant reduction in clarity of the
radiographs if water is present
X-ray sets can only be used when electric power is available and when the object to be
X-rayed can be taken to the X-ray source and radiographed. Radioisotopes have the
advantage that they can be taken to site and no electric power is needed.
F62.5 Advantages
The technique can be applied to most materials in situ. It is a non-destructive inspection
technique, and details of the material structure can be obtained.
F62.6 Limitations
The technique is expensive and there are OH&S issues associated with its use. It
examines only a small area of pipe.
Large diameter mains (> 15”) must be drained down.
Exposing drinking water to ionizing radiation is not approved or sanctioned by any
utility, water industry association, or governmental agency in the United States.
Experience is required to interpret the radiographs produced.
Condition Assessment Strategies and Protocols for Water and Wastewater Utility Assets
F-181
Table F-64. Radiographic Testing.
Technical
selection
Technical
suitability
Criteria
Assets covered
Material type
Service area
Access requirements
Limitations relating to asset condition
Limitations relating to asset size/geometry
Continuous/discrete
Destructive/non destructive
Interruption to supply/function
Assessment parameters
Integration with software tools
Commercialization of tool
Previous/existing use of the tool in sector
Accuracy/reliability
Ease of validation of results
Utility technical
capacity
Asset management sophistication required
Skills required (level of tool sophistication);
usability
Technology required (level of tool sophistication)
Documentation
Availability of technical support
Economic factors
Cost per inspection
Resource requirements
Assessment
Pipes, valves.
Ferrous, cementituous, plastics (not GRP)
Potable.
Both sides of the asset must be accessible.
None.
None.
Discrete; small sections only.
Non-destructive.
Generally would require the asset to be off-line,
as water absorbs the radiation.
Changes in material structure, including
inclusions, corrosion, voids, and thickness
changes.
Stand alone tool; images need manual
interpretation.
Tool and service commercially available.
Limited or no use in the United States water
sector; use reported in the United Kingdom water
sector.
Semi-quantitative.
Images can be calibrated; interpretation is a
skilled task.
Generic approach.
High level of skill due to health and safety issues;
would require specialized contractor to
undertake.
Independent of technology.
Standards for use are available; documentation
also available.
N/A; would require specialized contractor to
undertake.
High.
Requires specialist contractor.
F62.7 Bibliography
1. Dorn, R., Howsam, P., Hyde, R.A. and Jarvis, M.A. Water mains: Guidance on assessment
and inspection techniques, CIRIA Report 162, Construction Industry Research and
Information Association, London, England, 1996
2. Randall-Smith, M., Russell, A. and Oliphant, R. Guidance manual for the structural
condition assessment of trunk mains, WRc, UK, 1992
3. IAEA Development of protocols for corrosion and deposits evaluation in pipes by
radiography, Industrial Applications and Chemistry Section, International Atomic Energy
Agency,Vienna, Austria, 2005
F-182
F63.0 Remote Field Eddy Current (RFEC and RFEC/TC Tools)
F63.1 Overview
The Remote Field Eddy Current (RFEC) inspection technique is a non-destructive
method that uses low frequency AC and through-wall transmission to inspect ferrous pipes and
tubes from inside the pipe. The through-wall nature of the technique allows external and
internal defects to be detected with approximately equal sensitivity.
RFEC probes have been successfully adapted for inspection of cast iron and steel water
mains, as well as pre-stressed concrete cylinder pipes (also know as PCCPs).
F63.2 Main Principles
Eddy current testing is often used to find leaks in large u-tube heat exchanger tubes. In
this application, each tube is tested individually. Testing thick walled ferrous pipes from within
using conventional eddy current probes is, however, not practical. Very low frequencies are
necessary to achieve the through-wall penetration required to detect flaws on the outer surface.
This in turn produces low sensitivity. These problems are overcome by the RFEC method. The
RFEC inspection technique measures a different phenomenon; the generated AC magnetic
field.
The RFEC tool uses a relatively large internal solenoid exciter coil, which is driven
with low frequency AC. A detector, or circumferential array of detector coils, is placed near
the inside of the pipe wall, but axially displaced from the exciter. The separation between the
two coils is between two to five times the internal diameter of the pipe.
Two distinct coupling paths exist between the exciter and the detector coils. The direct
path, inside the pipe, is attenuated rapidly by circumferential eddy currents induced in the wall.
The indirect coupling path originates in the exciter fields, which diffuse radially outward
through the wall. At the outer wall, the field spreads rapidly along the pipe with little further
attenuation. These fields re-diffuse back through the pipe wall and are the dominant field inside
the pipe at remote field spacing.
A receiver coil that is placed in the remote field zone of the exciter picks up the field.
Furthermore, because the pipe wall attenuates the through-wall field, the strength of the field is
very sensitive to the wall thickness. Anomalies anywhere in the indirect path cause changes in
the magnitude and phase of the received signal, and can therefore be used to detect defects
such as cracks, pits or wall thinning produced by corrosion.
RFEC tools are used within the pipe. As such, access requires cut-ins at regular
intervals (100 m to 500 m, depending on cable length, pipe alignment, etc). Some tools are
adapted for launching through hydrants. RFEC tools are deployed and propelled through the
pipe by water pressure or by winching. Computerized software is available for signal
interpretation.
When applied to ferrous pipes, the RFEC method is claimed to detect changes in metal
mass, graphitization and wall thinning (the direct field eddy current methods are reported to be
more sensitive for detection of cracks and voids than RFEC).
A modified version of the tool is used for pre-stressed concrete cylinder pipes (also
know as PCCPs) inspection; the RFEC/Transformer Coupling (TC) tool. RFEC/TC testing
uses a combination of the remote field effect and the transformer coupling effect. The remote
field effect acts as a signal attenuator reducing and slowing the signal sent from a detector coil
as is passes out and back in through a metallic pipe wall. The transformer coupling effect acts
to amplify and accelerate the transmitted signal in the presence of continuous prestressing
Condition Assessment Strategies and Protocols for Water and Wastewater Utility Assets
F-183
wires. The electromagnetic field energy produced in the RFEC/TC technique interacts with
broken pre-stressing wires. Wire breaks interrupt the flow of energy, changing the measured
field and allowing for detection of broken wires.
F63.3 Application
The RFEC method was developed for the inspection of carbon steel components such
as process heat exchangers, tanks and boiler tubes.
It allows for the inspection of pipes and tubes from the inside to check for problems
around the entire circumference and over the entire length.
RFEC probes have been successfully adapted for inspection of cast iron and steel water
mains. A modified version of the tool is used for pre-stressed concrete cylinder pipes (also
know as PCCPs) inspection.
F63.4 Practical considerations
Tools are commercially available though use requires specialized contractors.
Commercial use of the tools is reported in literature and trade journals.
The sensitivity and resolution of the technique depends on the configuration of the
exciter and detector coils. Detector coils with small footprints improve the resolution,
but reduce the scanning rate.
Inspection speeds with RFEC is significantly lower than conventional eddy current
(Birring, 1999).
F63.5 Advantages
RFEC tools are available to suit a range of pipe sizes 150 mm upwards. The smaller
sizes may be launched through modified fire hydrants. The probes can be used in wet or
dry conditions.
Probes with circumferential array of detectors are capable of examining 100% of the
pipe. Some tools operate through internal cement linings (up to 25 mm), though with a
reduction in sensitivity and resolution.
The RFEC/TC tool is able detect and resolve multiple regions of broken wires at
different axial locations along the pipe.
F63.6 Limitations
Pipe requires internal cleaning prior to inspection. If water is used to propel the tool, it
is necessary to discharge the water to the environment.
There is variability in the success of flaw detection and location by probes supplied by
different companies.
Although capable of giving a good estimate of where the wire break occurs along the
length of the pipe, the technique can give no information at this time as to the
circumferential position of the broken wires.
F-184
Table F-65. Summary Remote Field Eddy Current.
Technical
selection
Criteria
Assets covered
Material type
Service Area
Access requirements
Limitations relating to asset condition
Limitations relating to asset size/geometry
Continuous/discrete
Technical
suitability
Destructive/non destructive
Interruption to supply/function
Assessment parameters
Integration with software tools
Commercialization of tool
Previous/existing use of the tool in sector
Accuracy/reliability
Ease of validation of results
Utility technical
capacity
Asset management sophistication
Skills required (level of tool sophistication);
usability
Technology required (level of tool sophistication)
Documentation
Economic factors
Availability of technical support
Cost per inspection
Resource requirements
Assessment
Pipes, water and Wastewater pipeline
infrastructure, tubes.
Iron and steel pipes, PCCPs.
Potable and wastewater.
Tool only for use within pipe (internal use). Tool
access requires cut-ins at regular intervals (100 m
to 500 m, depending on cable length, pipe
alignment). Some adapted for launching through
hydrants.
No limitations relating to asset condition provided
direct contact with the pipe wall is available.
Asset must be of sufficient size to accommodate
wheeled carriage. Devices to suit 150 mm internal
diameter have been produced. These can
negotiate bends up to 15º radius. Tools are tailored
to specific internal pipe diameters, ±5%.
Continuous readings stored in computer memory in
real time and space.
Non-destructive.
Tool application requires pipe to be off-line.
Internal and external defects such as cracks, pits or
wall thinning.
Computerized software is available for signal
interpretation.
Commercialized, availability through specialized
companies.
Commercial use of the tools reported in literature
and trade journals. AwwaRF reports available on
tool sensitivity.
Quantitative assessment; but varied sensitivity to
defects.
Calibration of tool against reference samples
required. Validation possible only by comparison
with manual/direct measurements.
Generic approach.
Professional skills required to interpret output data.
Tool operation typically by a third party.
Specialized equipment and dedicated computer
software.
Tool principles and description of reports generated
by tool will be available.
Tool operation typically by a third party.
Greater than US$5,000 per site, plus civil costs.
Typically two-person crew.
Condition Assessment Strategies and Protocols for Water and Wastewater Utility Assets
F-185
F63.7 Bibliography
1. Birring, A.S. Selection of NDT techniques for inspection of heat exchanger tubing. Proced.
Petroleum Industry Inspection Conference, Texas, USA. June 1999
2. Burn, L.S., Eiswirth, M., DeSilva D. and Davis P., Condition Monitoring and its Role in
Asset Planning, Pipes Wagga Wagga 2001, Charles Sturt University, Wagga Wagga,
N.S.W., 2001
3. Dingus, M., Haven, J. and Austin, R. Nondestructive None Invasive Assessment of
Underground Pipes, AwwaRF, USA, 2002
4. Makar, J. M. ; Chagnon, N. Inspecting systems for leaks, pits, and corrosion, National
Research Council of Canada, Institute for Research in Construction, NRCC-42802
(downloaded from www.nrc.ca/irc/ircpubs), 1999
5. Rajani, B.; Kleiner, Y. Non-destructive inspection techniques to determine structural
distress indicators in water mains, National Research Council of Canada, Institute for
Research in Construction, NRCC-47068 (downloaded from www.nrc.ca/irc/ircpubs), 2004
6. Lillie, K., Reed, C. and Rodgers, M. A. R., 2004, Workshop on Condition Assessment
Inspection Devices for Water Transmission Mains, AwwaRF, USA, 2004
F-186
F64.0 Schmidt Hammer
F64.1 Overview
The Schmidt hammer is a simple hand held device that allows non-destructive
assessment of materials such as brick and concrete. The tool gives an inferred measure of
compressive strength by an assessment of surface hardness.
The hammer consists of a spring loaded mass that is fired at the sample and rebounds,
thereby measuring the ‘rebound number’ for the material. A calibration chart is then used to
give an indication of compressive strength. Digital versions of the tool give direct readouts of
compressive strength.
F64.2 Main Principles
The Schmidt hammer or rebound hammer indirectly measures compressive strength by
measuring surface hardness of materials such as concrete and brick. The original design of the
Schmidt hammer was cylindrical, approximately 55 mm in diameter and 275 mm in length
(Dorn et al., 1996). Several new designs are now available for use on samples of different
geometries, strengths and impact resistances.
In use, the Schmidt hammer is ideally aligned perpendicular to the surface being tested.
A spring loaded mass is then fired at the sample. The distance the mass rebounds from the
surface of the sample is related empirically to the compressive strength of the sample (Proceq,
2005).
F64.3 Application
The Schmidt hammer is used to test the strength and quality of concrete and brick
assets, both civil and pipeline, and is used in a number of international standards:
•
ASTM C 805-97, Svensk Standard SS 13 72 37, Svensk Standard SS 13 72 50, Svensk
Standard SS 13 72 52, BS 1881: Part 202.
F64.4 Practical considerations
The Schmidt hammer is readily portable and simple and is widely used for testing
concrete assets. The Schmidt hammer is available from many commercial suppliers.
Results obtained from the manual version of the tool are converted to compressive
strength using calibration curves; some digital versions can give compressive strength
readouts directly.
The accuracy of the technique is relatively low for prediction of compressive strength;
between ± 15-20% in well controlled conditions (Feldman, 1977). Due to the
heterogeneity of cementituous materials, multiple readings (~10) should be taken,
although not in exactly the same location.
The result of this technique should only be used as an indication of material strength.
However, it is useful for comparing the relative strengths of different materials or
different areas of an asset (Dorn et al., 1996).
In order to conduct a test using the Schmidt hammer, access to the surface of the asset
is required. This means that buried assets must be exposed and surface coatings must be
removed. The asset surface may also require abrading to provide a smooth surface. The
tool is hand held and so sufficient room is required for personnel.
Condition Assessment Strategies and Protocols for Water and Wastewater Utility Assets
F-187
Depending on the angle of the Schmidt hammer to the vertical during testing,
corrections may need to be made for this angle.
F64.5 Advantages
•
The Schmidt hammer is a quick means of assessing compressive strength of
cementituous or rock like materials, and can provide valuable comparative data
between different parts of a sample, or between different samples (Dorn et al., 1996).
F64.6 Limitations
The accuracy of the technique is relatively low for prediction of compressive strength,
between ± 15-20% in well controlled conditions (Feldman, 1977).
The results are also very dependant on surface conditions (Dorn et al., 1996) and results
can be affected by the smoothness of surface, geometry of sample, moisture content,
type of cement and aggregate and the extent of surface carbonation (Feldman, 1977).
The results obtained are for localized areas of the asset due to the heterogeneous nature
of cementituous materials (Randall-Smith et al, 1992).
Table F-66. Summary Schmidt Hammer
Technical
Selection
Criteria
Assets covered
Material type
Service Area
Access requirements
Limitations relating to asset condition
Limitations relating to asset size/geometry
Continuous/discrete
Destructive/non destructive
Interruption to supply/function
Technical
suitability
Assessment parameters
Integration with software tools
Commercialization of tool
Previous/existing use of the tool in sector
Accuracy/reliability
Ease of validation of results
Utility technical
capacity
F-188
Asset management sophistication required
Skills required (level of tool sophistication); usability
Technology required (level of tool sophistication)
Assessment
Manholes, pipes, CSOs, civil.
Concrete, brick.
Potable and wastewater.
Direct contact with asset required. If the asset is
buried, then it must be exposed. Surface
coatings must also be removed. The asset
surface may also require abrading to provide a
smooth surface.
No limitations relating to asset condition.
No limitations relating to size/geometry for
external use on pipes. For internal usage the
asset must be of sufficient size for man entry.
Discrete reading.
Non-destructive.
For man entry, standard safety procedures
should be followed, otherwise the asset can
remain in use.
Equipment gives a reading relating to
compressive strength of asset.
No integration with software tools.
Equipment is widely available from commercial
vendors.
Widely used to assess the quality of concrete
assets.
Quantitative; readings are ± 15-20% accurate.
Results are only indicative of compressive
strength on which can be used.
Generic approach.
Easy to use by following simple procedure.
Tool comes in both manual and digital versions,
manual versions provide rebound numbers only
and compressive strength needs to be obtained
Criteria
Documentation
Availability of technical support
Economic factors
Cost per inspection
Resource requirements
Assessment
by reading calibration curves. Digital versions
calculate compressive strength.
ASTM C 805-97, Svensk Standard SS 13 72 37,
Svensk Standard SS 13 72 50, Svensk
Standard SS 13 72 52, BS 1881: Part 202.
Technical support available from retailers and
from Internet.
Low cost per inspection.
Resources required depend on assets being
inspected.
F64.7 Bibliography
1. ASTM C805-02 Standard Test Method for Rebound Number of Hardened Concrete
2. BS EN 12504-2:2001 Testing concrete in structures. Non-destructive testing.
Determination of rebound number
3. Dorn, R., Howsam, P., Hyde, R.A. and Jarvis, M.A. Water mains: Guidance on assessment
and inspection techniques, CIRIA Report 162, Construction Industry Research and
Information Association, London, England, 1996
4. Feldman, R.F., CBD-187 Non-destructive testing of concrete, Canadian Building Digest,
http://irc.nrc-cnrc.gc.ca/pubs/cbd/cbd187_e.html , accessed 2005
5. Mastrad: Quality and test systems, http://www.mastrad.com/schmidt.htm , accessed 2005.
6. Proceq, http://www.proceq-usa.com/products/originalschmidt.php , accessed 2005.
7. Randall-Smith, M., Russell, A. and Oliphant, R. Guidance manual for the structural
condition assessment of trunk mains, WRc, UK, 1992
8. SIS; Svensk Standard SS 13 72 37. "Betongprovning-Hårdnad betong-Studsvärde,"
(Concrete testing - Hardened concrete - Rebound number, in Swedish)
9. SIS; Svensk Standard SS 13 72 50. "Betongprovning-Hårdnad betong- Tryckhållfasthet
skattad med ledning av studsvärden," (Concrete testing - Hardened concrete - Compressive
strength from rebound number, in Swedish)
10. SIS; Svensk Standard SS 13 72 52. "Betongprovning-Hårdnad betong- Tryckhållfasthet,
skattad med ledning av studsvärden och ljudhastighetsvärden," (Concrete testing Hardened concrete - Compressive strength, rated from rebound and sound velocity values,
in Swedish)
Condition Assessment Strategies and Protocols for Water and Wastewater Utility Assets
F-189
F65.0 SCRAPS (Sewer Cataloging, Retrieval and Prioritization System)
F65.1 Overview
The Sewer Cataloguing, Retrieval and Prioritization System (SCRAPS) is an expert
system that targets the inspection of critical areas of the sewer network.
The knowledge base of this expert system was assembled with input from a national
group of experts, drawn from both the public and private sectors. Input from the experts was
used to develop the system’s logic, which assesses the overall need to inspect a sewer based on
the pipe’s consequence and likelihood of failure. The inference engine is based on Bayesian
belief network theory, which allows the uncertainty in the experts’ beliefs to be propagated
through the system. The tool was developed with a rapid prototype application process. The
validation of the tool showed it is effective at mimicking the knowledge of experts.
F65.2 Main Principles
SCRAPS assumes sewer collection systems fail when they are unable to convey
wastewater from its origin to its prescribed destination without endangering or inconveniencing
the public. System failures include releases, overflows, and surface collapse. SCRAPS predicts
the criticality of sewer pipelines in terms of how likely the sewer is to fail (likelihood) and the
extent of societal impacts if failure should occur (consequence).
SCRAPS is intended to target CCTV inspections on critical areas of the sewer system,
thereby reducing the potential cost for emergency repair and delaying unnecessary inspections.
The logic in SCRAPS is based on work from the Water Research Centre (WRc, UK), and on a
group of eight mechanisms that define the consequence and likelihood of asset failure. These
mechanisms constitute the tool’s decision making logic. Two of the eight mechanisms, ‘SocioEconomic Impacts’ and ‘Reconstruction Impacts,’ define the consequence of failure. The
remaining six mechanisms define the likelihood of failure, and include ‘Operational Defects’,
‘Structural Defects’, ‘Interior Corrosion’, ‘Exterior Corrosion’, ‘Infiltration’ and ‘Erosion’.
SCRAPS has two primary components: 1) an inference engine and 2) a knowledge
base. The inference engine defines the mathematical algorithm by which a decision is reached.
The knowledge base is the body of information that represents the expert knowledge. The other
components of SCRAPS, a graphical user interface and a database, are developed with
Microsoft Visual Basic and Microsoft Access respectively.
The knowledge base of the expert system was developed through a process of
‘‘knowledge acquisition.’’ Knowledge was acquired and incorporated into SCRAPS by
interviewing sewer infrastructure experts, operators, and managers. The knowledge acquisition
process was facilitated by a rapid prototyping process that allowed on-going testing of the
accuracy of the knowledge base.
F65.3 Application
The software is designed to facilitate the management of sewerage networks by
prioritizing CCTV inspections.
F65.4 Practical considerations
The SCRAPS system is available from WERF.
SCRAPS is principally aimed at small utilities that may not have sufficient system data
to search effectively for potential failures.
F-190
The tool is also usable by utilities that have collected considerable data and performed
condition assessments. In this case, the tool allows prioritization of repair of the sewers
with the highest risk of failure according to the consequences of failure.
The tool may provide insight in to the factors that have had greatest influence on the
current condition.
F65.5 Advantages
SCRAPS can assist small to medium sized utilities develop a strategy to gather
information about their systems by prioritizing their inspection process.
The tool targets critical areas of the sewer system first, thereby reducing the potential
cost for emergency repair and delaying unnecessary inspections.
The tool’s logic is based on the industry paradigm of consequence of failure and
likelihood of failure and extensive input from numerous regional-based experts.
The tool has the advantage of containing the heuristics and understanding of failure and
impact relationships of many experts.
F65.6 Limitations
Large authorities may require more sophisticated approaches.
Table F-67. Summary SCRAPS (Sewer Cataloging, Retrieval and Prioritization System).
Technical
selection
Technical
suitability
Criteria
Assets covered
Granularity
Service Area
Focus of analysis
Scalability of tool/approach
Commercialization
Previous/existing use of the tool
Ease of validation
Utility technical
capacity
Flexibility with regard to analysis (asset types) and
granularity (system, asset level)
Integration with other tools/GIS
Asset management sophistication
In-house skills required
Technology required
Documentation
Data Requirements
Linking to asset data
Availability of software and technical support
Usability
Assessment
Sewer networks.
System level.
Wastewater.
Expert system that prioritizes sewer inspections.
Aimed at small utilities that may not have
sufficient system data to search effectively for
potential failures.
Commercial system available from WERF.
Has been used in the United States.
Validation is possible through comparison with
independent assessments.
Wastewater; system level only.
None.
Aimed at level of asset management where
standard asset data is available.
Asset manager.
PC based tool. Windows based operating
system.
Detailed report available from WERF.
Targets critical assets and requires information
on them.
Through database.
Limited support available.
Windows based software.
Condition Assessment Strategies and Protocols for Water and Wastewater Utility Assets
F-191
F65.7 Bibliography
1. Hahn, M.A., Palmer R.N., Merrill, M.,S. and Lukas, A.B. Sewer inspection prioritization
with a regional expert system. Proc. of the ASCE’s 2000 Joint Conference on Water
Resources Engineering and Water Resources Planning and Management, Minneapolis,
MN, August, 2000
F-192
F66.0 Slow Crack Growth Resistance of PE Pipes
F66.1 Overview
The Notched Tensile Test is a destructive test that can be used to quantify the resistance
to slow crack growth of a PE pipe material.
The test involves deliberately introducing a razor notch onto a test coupon, which is
then subjected to a pre-defined tensile stress. The time to failure is recorded, which correlates
with the resistance to slow crack growth exhibited by a particular pipe material
Traditionally used to assess performance of new PE materials, this test has also been
used to measure slow crack growth resistance of pipes currently in-service.
F66.2 Main Principles
The test is conducted on a small coupon (50 mm in length and 25 mm in width)
extracted from the pipe wall. The coupon can be extracted so that its longitudinal axis is
aligned with either the pipe longitudinal or circumferential directions. The thickness of the
coupon corresponds to the pipe wall thickness.
A razor notch is deliberately introduced into the coupon specimen using a razor blade.
This razor notch is aligned perpendicular to the longitudinal axis of the specimen. The
specimen is then loaded in tension along its longitudinal axis to a pre-defined nominal tensile
stress and the time to failure is recorded.
The time to failure correlates with the resistance to slow crack growth exhibited by a
particular pipe material. Longer test times correspond to relatively high slow crack growth
resistances.
F66.3 Application
This test is applicable to PE pipe materials only.
•
This test method applies to PE pipes and is described by the American Standard ASTM
F 1473. The American standard ASTM D 3350 specifies a test temperature of 80°C and
a stress of 2.4 MPa. ISO 16241: 2005 also references this test method.
F66.4 Practical considerations
This test method is primarily used by PE material and pipe producers to rank the slow
crack growth performance of new PE materials. However, some limited studies have
also conducted tests on coupon samples from pipes in service and shown reasonable
correlation with field performance.
Specimen preparation (especially notching) requires skill, but clear guidelines are
provided in the American standard F 1473. Due to the requirement for elevated
temperature, the test method should be conducted in the laboratory.
Different PE material type classifications are listed in the American standard ASTM D
3350. For a particular PE material type, ASTM D 3350 specifies minimum failure times
in the Notched tensile test. Therefore, results from notched tensile tests can be used to
determine the material classification of the pipe under inspection. Furthermore, results
from notched tensile tests on a wide range of PE materials have also been published in
the literature. This provides a basis for comparison in terms of slow crack growth
resistance.
Condition Assessment Strategies and Protocols for Water and Wastewater Utility Assets
F-193
Results from the notched tensile test correlate well with the potential for slow crack
growth failure under normal operating loads. In general, longer failure times correspond
to lower average slow crack growth failure rates in the field. However, the test does not
relate to PE pipe failures that occur under the influence of external factors such as poor
pipe installation practice and third party damage during adjacent excavation.
F66.5 Advantages
The test method should be relatively low cost.
A single coupon test will indicate the resistance to slow crack growth of the pipe under
inspection.
With appropriate expertise, comparisons can then be made with previous literature
studies in which notched tensile test results were compared with slow crack growth
field failures in PE pipes.
F66.6 Limitations
The test method is destructive and coupon samples require careful razor notching.
Test results require comparison with previous studies in the literature to be meaningful.
Tests conducted on new PE materials can result in impractically long test times.
Table F-68. Summary Slow Crack Growth Resistance of PE Pipes.
Technical
selection
Criteria
Assets covered
Material type
Service area
Access requirements
Limitations relating to asset condition
Limitations relating to asset size/geometry
Continuous/discrete
Destructive/non destructive
Technical
suitability
Interruption to supply/function
Assessment parameters
Integration with software tools
Commercialization of tool
Previous/existing use of the tool in sector
Accuracy/reliability
Utility technical
capacity
F-194
Ease of validation of results
Asset management sophistication required
Skills required (level of tool sophistication);
usability
Technology required (level of tool
sophistication)
Assessment
Pipes.
Polyethylene.
Potable or wastewater.
Pipe must be exposed and coupon must be extracted
from the pipe wall.
None.
None.
Discrete.
Destructive, but the location of coupon removal on the
pipe can be repaired using an electrofusion coupling.
Tests must be conducted off-line in laboratory.
The resistance of the pipe material to slow crack
growth is measured.
Stand alone.
Test method fully developed and included in
American standards.
Primarily used as a material research tool but has
been applied using coupons extracted from PE gas
pipelines in service.
High degree of accuracy can be achieved in test with
commercially available mechanical test and data
collection equipment.
Direct measurement.
Generic approach.
A medium level of operator skill is required for sample
notching prior to test.
Mechanical test and data collection equipment are
available in many research company test labs.
Criteria
Documentation
Availability of technical support
Economic factors
Cost per inspection
Resource requirements
Assessment
Test method is fully documented in ASTM F 1473.
Threshold values for test times distinguishing different
PE materials classes are covered in ASTM D 3350.
Journal papers quoting typical results for different PE
pipe materials in use are available in the literature.
University or research organizations can offer support
in the use of and interpretation of test results.
Specialist test, so relatively expensive
Laboratory based test.
F66.7 Bibliography
1. ISO 16241: 2005, Notch tensile test to measure the resistance to slow crack growth of
polyethylene materials for pipe and fitting products
2. ASTM F1473, Standard test method for the notch tensile test to measure the resistance to
slow crack growth of polyethylene pipes and resins
3. ASTM D 3350, Standard specification for polyethylene plastic pipe and fitting materials
Condition Assessment Strategies and Protocols for Water and Wastewater Utility Assets
F-195
F67.0 Smart Digital Sewer Pipe Diagnostic System (VTT)
F67.1 Overview
The Smart Digital Diagnostics System for Sewer Pipes is currently being developed. It
is intended to be a new diagnostics system able to interpret digital image data according to
future CEN standard (Visual Inspection Coding System).
When completed, the system will measure and analyze the condition of a sewer pipe
and will support network wide regular condition monitoring and proactive maintenance.
F67.2 Main Principles
The approach is intended to be a replacement for CCTV inspection of sewer pipes. The
technology used differs from CCTV in that it produces very accurate digital side scans of the
pipe wall instead of producing only forward looking continuous images of the pipe. It also
produces very accurate on-line location data with the help of two different measurement
systems.
In use, the system scans the pipe wall, taking one 1mm ring scans, and produces open
folded side scans of the pipe. The image produced is continuous. Besides the side scanning, the
tool captures front view images at discrete intervals.
The scanner’s inclinometer registers vertical movement and a gyroscope registers
horizontal movement. The distance from the starting point is measured from the power cable.
If the x, y and z co-ordinates of the starting point and the ending point are given, the system
can determine the co-ordinates of the centerline of the pipe.
F67.3 Application
When developed, the system will provide automated analysis of defects in sewer
pipelines.
It is intended to interpret digital image data according to a future CEN standard (Visual
Inspection Coding System).
F67.4 Practical considerations
The system is still in the development stages with the focus of the research and
development being direct defect analysis.
When the software is completed, all the measurements and analyzing work will be
made immediately on-site after the data is collected.
Helsinki Water has utilized the system and field demonstrations have been carried out
in Germany (Hamburg), Denmark (Copenhagen), Sweden (Malmo), Stockholm,
(Gothenburg), Norway (Oslo), Russia (St Petersburg), Latvia (Riga) and Estonia
(Tartu).
F67.5 Advantages
Enables advanced and automatic analysis of sewer pipelines for defects rather than the
manual analysis required with traditional CCTV data. This has the potential in the long
term to reduce the costs associated with sewer inspection.
F-196
F67.6 Limitations
The technique is in its development stages and has only been trialed in a number of
European cities.
The system requires a highly specialized scanner unit.
Table F-69. Summary Smart Digital Sewer Pipe Diagnostic System (VTT).
Technical
selection
Criteria
Assets covered
Material type
Service area
Access requirements
Limitations relating to asset condition
Limitations relating to asset size/geometry
Continuous/discrete
Technical
suitability
Destructive/non destructive
Interruption to supply/function
Assessment parameters
Integration with software tools
Commercialization of tool
Utility technical
capacity
Previous/existing use of the tool in sector
Accuracy/reliability
Ease of validation of results
Asset management sophistication required
Skills required (level of tool sophistication); usability
Technology required (level of tool sophistication)
Economic factors
Documentation
Availability of technical support
Cost per inspection
Resource requirements
Assessment
Sewer pipelines.
Any material.
Wastewater.
Scanner unit is inserted through manhole
access point.
Assets in very poor condition may cause the
scanner to get stuck.
Scanner unit needs to be inserted into pipeline,
so very small diameter pipes are not suitable,
although the vast majority of sewer pipes will be
covered.
Scanner records continuous data along pie
length.
Non-destructive inspection technique.
No interruption to sewer is needed.
Records high quality digital images with 1mm
accuracy that covers the entire circumference of
the pipe wall.
Requires specialized software to interpret
results.
Non commercial product that is still under
development.
Has been trialed in several European cities only.
Quantitative and qualitative.
Validation is possible through visual inspection.
A high level of sophistication is required using
specialized equipment and software.
Skilled operator required.
Specialized scanner unit is required and
dedicated software to interpret results.
Technique still in development.
Technique still in development.
Initial purchase costs are high.
Skilled operator and equipment is required.
F67.7 Bibliography
1. Welsh School of Architecture (Data Unknown) Case Study: Digital diagnostics system
for sewer pipes. Accessed November 2006 at:
http://www.cardiff.ac.uk/archi/programmes/cost8/case/watersewerage/finlandsewer.pdf
Condition Assessment Strategies and Protocols for Water and Wastewater Utility Assets
F-197
F68.0 Smoke Testing
F68.1 Overview
Smoke testing is used to identify faulty or illegal connections to gravity sewer and
storm water systems.
Fans are used to force artificial smoke into the sewer at one or more manholes. The
smoke will then either escape the system at house vent pipes, defective or illegal connections
and other problem areas, allowing them to be identified.
F68.2 Main Principles
Smoke from either smoke bombs or a liquid smoke system is forced into the system at
manholes using specially designed fans. The smoke escapes from the system at house vent
pipes, illegal connections such as down pipes and faulty connections, allowing them to be
identified.
When testing sewer systems smoke should escape from house vent pipes, if smoke
escapes from drain pipes this indicates an illegal connection to the sewer system. The reverse is
true for storm water systems.
F68.3 Application
Smoke testing is used to locate illegal or faulty connections to gravity sewer and storm
water systems, but can also indicate defective connections buried manholes.
F68.4 Practical considerations
By partially blocking pipes leading away from the test area, smoke is not lost to areas
not being inspected.
Residents and emergency service should be fully informed prior to testing to prevent
unnecessary distress.
F68.5 Advantages
Smoke test systems are inexpensive and provide a fast method for locating illegal and
faulty connections.
F68.6 Limitations
May cause alarm to residents.
F-198
Table F-70. Summary Smoke Testing.
Technical
selection
Criteria
Assets covered
Material type
Service area
Access requirements
Limitations relating to asset condition
Limitations relating to asset size/geometry
Continuous/discrete
Destructive/non destructive
Interruption to supply/function
Technical
suitability
Assessment parameters
Integration with software tools
Commercialization of tool
Previous/existing use of the tool in sector
Accuracy/reliability
Ease of validation of results
Utility technical
capacity
Asset management sophistication required
Skills required (level of tool sophistication); usability
Technology required (level of tool sophistication)
Documentation
Availability of technical support
Economic factors
Cost per inspection
Resource requirements
Assessment
Gravity sewer and storm water.
Any.
Wastewater.
Manhole or similar access to sewer pipes
required.
Not restrictions due to asset condition.
No restriction due to size of asset.
N/A
Testing is Non-destructive.
Inspection can be undertaken while asset is online.
Test indicates connections to sewer pipeline.
Stand alone tool for detecting locations of
inflow.
Equipment is available from a number of
commercial suppliers.
Used in the United States.
Qualitative indication.
Results can be validated by visual or other
inspection methods.
Generic approach.
Low level of operator skill required.
Specialized equipment required to introduced
smoke to assets.
No standards were found on this technique.
Information on testing can be obtained from
equipment suppliers.
Low cost.
Test requires a number of personnel for each
test to locate smoke escape points.
F68.7 Bibliography
1. Hurley, L. Smoke Testing Our Sewer Systems, Pipes Wagga Wagga 2005, Charles Sturt
University, Wagga Wagga, N.S.W., October 17-20, 2005
2. Ratliff, A. An overview of current and developing technologies for pipe condition
assessment, Pipelines 2003, ASCE 2004.
Condition Assessment Strategies and Protocols for Water and Wastewater Utility Assets
F-199
F69.0 Soil Characterization
F69.1 Overview
Soil characterization involves analyzing soil parameters relevant to the deterioration of
buried assets. Such parameters include pH, sulfide concentrations, moisture content, electrical
conductivity (salinity), shrink-swell capacity and redox potential. Soil characteristics interact
with buried assets of all material types.
Characterization of soil parameters relevant to buried assets allows suitable material
types to be chosen and effective preventative measures to be taken to minimize degradation of
the asset. Soil characterization can also be used with pipe specific information to predict the
working life of the pipe.
F69.2 Main Principles
When collecting samples for lab characterization or in-situ testing the position of the
sample should be relevant to the buried asset. For example, samples should be taken at the
depth of the pipe asset instead of at the surface. Soil parameters of interest include:
Soil resistivity; Soil resistivity is relevant to the corrosion of ferrous materials. Soils
with low resistivity are more likely to have high corrosion rates, while high resistivities
are likely to indicate low corrosion rates (see section on Soil Resistivity).
pH; Low pH values are associated with corrosion of ferrous assets and deterioration of
cementituous assets. However, while a useful indicator of potential corrosivity, the
correlation between pH and corrosion rate is not consistent and can be affected by a
number of factors. Deterioration of cementituous materials will be affected by the type
of acid present, as some react more readily with the cement than others.
Redox potential; the redox potential of soil is a measure of soil aeration and gives an
indication of the suitability of conditions for sulfate reducing bacteria. The presence of
sulfate reducing bacteria can result in the production of corrosive products such as
hydrogen sulfide (as a by-product of metabolism), and can create cathodic areas on
assets due to the consumption of hydrogen. Redox potentials of below 100 mV are most
favorable for sulfate reducing bacteria.
Sulfates also react with cementituous materials forming gypsum and ettringite, which
have significantly higher volumes than the materials they replace causing swelling and
cracking of the pipe wall. Sulfate attack will only occur where the sulfate salt are in
solution.
Chloride content; Chloride ions permeate into cementituous and attack steel
reinforcement. Corrosion of the reinforcement results in a volume increase applying
stress to the asset resulting in spalling.
Moisture content; Soil moisture acts as the electrolyte in electro-chemical corrosion of
ferrous assets. Static water also acts to produce anaerobic conditions suitable for sulfate
reducing bacteria. Static water can also allow sulfates and chlorides to enter solution in
close contact with the asset and permeate into cementituous assets (see above). Flowing
water can act to leach free lime from cementituous assets (Randall-Smith, 1992). Soil
moisture content will also define the degree of saturation of the soil. This will give an
indication of the state of soil drying, which is important for moisture migration and soil
moisture reactivity (see shrink/swell capacity).
F-200
Shrink/swell capacity (soil moisture reactivity); Clay soils change volume depending
on their water content. Clay particles absorb moisture into their crystal lattice causing
them to swell. As the moisture content of the soils reduces due to uptake by plant root
systems, percolation through soil matrix and evaporation, the soil will shrink. Assets
within soils with high shrink/swell capacities are known to have an increased failure
rate, due to the stresses imparted by the soil during the shrink/swell cycle. The basic
properties that characterize shrink/swell capacity are plasticity index, fraction of fine
particles and the mineralogy of the particles. The mineralogy of the particles may be
related to the geologic origin of the soil deposit. Alternatively, direct mineralogical
measurements may be carried out to characterize the soil fractions.
Buffering capacity; Clay soils and soils high in organic matter have high buffering
capacity while sandy soils and soils low in organic matter have low buffering capacity
(Agri-facts, 2005). A soil’s buffering capacity is the degree to which it is able to resist
changes in pH; in particular acidification. The affects of pH are covered above.
Linear polarization resistance; LPR can been used to predict the corrosion rate of
buried ferrous assets; high LPR indicates low corrosion rates. The empirical
relationship between LPR and corrosion rate has been investigated on a number of
occasions, and some doubt has been expressed as to the reliability of the technique
(Heathcote and Nicholas, 1998). (see review on Linear Polarization Resistance)
Contaminants; soil contaminants such as organic compounds can have negative affects
on polymeric materials. Organic compounds such as petrol can migrate through the
polymeric pipes both impacting water quality and remaining in the polymer matrix
causing it to swell and lose strength. Highly levels of acidic continents can also cause
environment stress cracking of polymers dramatically reducing lifetime.
Soil compaction: The susceptibility of the trench filling and the surrounding sediments
for compaction.
These parameters often cannot be used in isolation because of the range of factors
involved in chemical and electrochemical processes that cause corrosion, deterioration and
stress failure (Dorn, 1996). As such, results are often incorporated into scoring systems used to
classify a soil’s potential for corrosion or other mechanisms of deterioration.
F69.3 Application
Soil characterization tests conducted on samples taken at relevant locations can be used
to give an insight into the environment of buried assets without disturbing the asset.
Characterization conducted prior to installation of buried assets can be used to
determine appropriate material type to be used and also establish if any protection measures
need to be included, such as cathodic protection.
F69.4 Practical considerations
Integration of soil characterization into a GIS system can give a good picture of soil
conditions. Soil information, asset characteristics and depth, and groundwater levels
can be overlayed within a GIS to identify likely interactions between soil, groundwater
and buried assets. This is especially true in cities where the pipe system is in contact
with the ground water table, which is a common occurrence in Europe.
Soil tests are often conducted at failure locations, however, it should be noted that this
may give a skewed picture of soil conditions.
Condition Assessment Strategies and Protocols for Water and Wastewater Utility Assets
F-201
F69.5 Advantages
Samples can be obtained without exposing buried assets.
Characterization can be focused on parameters of interest such as those linked to
corrosion.
Characterization at failure locations can be used to give an indication of the process
involved in failure.
Characterization prior to installation can be used to choose appropriate asset materials
and/or protection.
F69.6 Limitations
As samples are small, tests only give parameters for a small area, which may or may
not be representative of the area of interest.
Analyzes often needs to be conducted in a lab and can be expensive.
Correlation between measured parameters and desired result is not always reliable.
Moisture content of soil sample may not be that seen at the asset location due to
variations in factors such as compaction.
Table F-71. Summary Soil Characterization.
Technical
selection
Technical
suitability
Criteria
Assets covered
Material type
Service area
Access requirements
Limitations relating to asset condition
Continuous/discrete
Destructive/non destructive
Interruption to supply/function
Assessment parameters
Integration with software tools
Commercialization of tool
Previous/existing use of the tool in sector
Accuracy/reliability
Utility technical
capacity
Integration with software tools
Ease of validation of results
Asset management sophistication required
Skills required (level of tool sophistication); usability
Technology required (level of tool sophistication)
Documentation
Availability of technical support
F-202
Assessment
Environmental survey (pipeline assets).
Soil characterization can be related to any
material depending on tests conducted.
Potable and wastewater.
Access to soil at point of interest.
None.
Results are discreet.
Non-destructive.
Inspection does not affect assets.
Soil parameters.
None.
Equipment is widely available, although most
tests need to be conducted in a lab.
Wide use.
Results should be viewed as a qualitative
assessment of the general soil properties.
None.
Results can be validated through other tests.
Generic approach.
Operator training is required; the level is
dependant on testing being conducted.
Specialized equipment required for most tests.
Techniques described well in literature and
standards.
Information available in literature and for
contractors supplying the services.
Economic factors
Criteria
Cost per inspection
Resource requirements
Assessment
Cost depends on number and type parameters
being tested.
Resources required is dependant on testing
being conducted.
F69.7 Bibliography
1. Agri-facts: Practical Information for Alberta’s Agriculture Industry,
http://www1.agric.gov.ab.ca/$department/deptdocs.nsf/all/agdex3684/$file/5341.pdf?OpenElement , accessed 2005
2. Dorn, R., Howsam, P., Hyde, R.A. and Jarvis, M.A. Water mains: Guidance on assessment
and inspection techniques, CIRIA Report 162, Construction Industry Research and
Information Association, London, England, 1996
3. Heathcote, M. and Nicholas, D. Life Assessment of Large Cast Iron Watermains, Urban
Water Research Association of Australia, Research Report No 146, 1998
4. Matti, M.A. and A. Al-Adeebt Sulphate attack on asbestos pipes, The international journal
of cement composites and lightweight concrete, 1985
5. Randall-Smith, M., Russell, A. and Oliphant, R. Guidance manual for the structural
condition assessment of trunk mains, WRc, UK, 1992
Condition Assessment Strategies and Protocols for Water and Wastewater Utility Assets
F-203
F70.0 Soil Corrosivity
F70.1 Overview
The predominant deterioration mechanism for ferrous pipes is electro-chemical
corrosion. Soil corrosivity tests use one or more soil characteristics to predict the likely rate of
corrosion.
A soil’s corrosivity to ferrous pipe materials can be assessed in different ways; some
methods predict only that corrosion is likely, while others predict a likely rate of corrosion.
F70.2 Main Principles
Najjaran (2006) reports several different methods that incorporate multiple soil
characteristics:
The 10- point DIPRA method uses soil resistivity, pH, redox potential, sulfide content
and moisture content to classify soils as either corrosive or non-corrosive.
The Metalogic method uses twelve soil factors; soil type, soil resistivity, water content,
pH, buffering capacity, chloride and sulfide concentrations, ground water level,
horizontal and vertical homogeneities and electro-chemical potential to rate corrosivity
at four levels from highly corrosive to virtually non-corrosive.
The Spickelmire method uses a twenty-five point method and includes soil properties
as in the DIPRA method and pipe factors such as pipe location, size, maximum surge
pressure, design life, and leak repair difficulty. This method ranked corrosivity at four
levels from mild to severe.
Linear Polarization Resistance (LPR) is a soil characteristic used to predict the
corrosion rate of buried ferrous assets. LPR has a negative correlation with corrosion
rate in ferrous assets, meaning that soils with high LPR values will exhibit low
corrosion rates. Heathcote and Nicholas (1998) reported that LPR (Also see LPR
review) showed significant correlation with pitting rate of cast iron when measured
manually.
F70.3 Application
Soil corrosivity gives an indication of the likelihood that corrosion will occur. It can
generally be used to qualitatively rank soil types, such as on a scale from non-corrosive
through to very corrosive. Soil corrosivity tests are relevant for buried ferrous assets. Soils can
be categorized into broad corrosivity categories that identify areas where corrosion potential is
highest.
F70.4 Practical considerations
LPR measure using automated systems showed very limited correlation with corrosion
rate and so should not be used unless technique correlations to pit rate have been
improved.
Methods for measurement of soil characteristics, such as pH, resistivity, redox potential
and moisture content, are available either from standards or literature. Companies are
available to conduct all of the required soil characterization work if needed.
Prediction of pipe condition requires additional information such as pipe age and wall
thickness.
F-204
F70.5 Advantages
Techniques used in predicting soil corrosivity can be conducted prior to laying pipe
allowing appropriate corrosion control measures to be undertaken. Categorization of
soil types into corrosivity classes can be useful in focusing attention on assets where
more detailed monitoring and inspection of buried ferrous assets may be justified.
Outputs from soil corrosivity tests can be linked to soil layers within a geographic
information system, in order to provide a spatial overview of likely areas of high
corrosivity.
F70.6 Limitations
Most techniques only indicate the corrosion rate qualitatively.
Corrosion rate does not allow the condition of an asset to be assed on the rate of its
degradation.
Table F-72. Summary Soil Corrosivity.
Technical
selection
Technical
suitability
Criteria
Assets covered
Material type
Service Area
Access requirements
Limitations relating to asset condition
Limitations relating to asset size/geometry
Continuous/discrete
Destructive/non destructive
Interruption to supply/function
Assessment parameters
Integration with software tools
Commercialization of tool
Previous/existing use of the tool in sector
Accuracy/reliability
Ease of validation of results
Utility technical
capacity
Economic factors
Asset management sophistication required
Skills required (level of tool sophistication); usability
Technology required (level of tool sophistication)
Documentation
Availability of technical support
Cost per inspection
Resource requirements
Assessment
Environmental survey (pipeline assets).
N/A
Potable and wastewater.
Access to soil required.
None.
None.
Results are discreet.
Non-destructive.
Inspection does not affect assets.
Technique predicts corrosion from soil
characteristics.
Knowledge of corrosion rate requires knowledge
of pipe wall thickness and age in order to
provide pipe condition information.
Approaches to soil corrosion assessment are
available from commercial suppliers.
Widely used.
Qualitative assessments.
Results can be validated through inspection of
pipes.
Generic approach.
Operator training is required.
Lab based testing procedures.
Information available from literature.
Information available in literature.
Cost varies depending on technique employed
Dependent on technique applied
Condition Assessment Strategies and Protocols for Water and Wastewater Utility Assets
F-205
F70.7 Bibliography
1. Najjaran, Homayoun; Sadiq, Rehan; Rajani, and Balvant Fuzzy Expert System to Assess
Corrosion of Cast/Ductile Iron Pipes from Backfill Properties, Computer–Aided Civil and
Infrastructure Engineering, 21, 1, pp. 67-77, 2006
2. Sadiq, R., Rajani, B. and Kleiner, Y. Fuzzy-Based Method to Evaluate Soil Corrosivity for
Prediction of Water Main Deterioration, Journal of Infrastructure Systems, 10, 4, pp. 149 –
156, 2004
F-206
F71.0 Soil (Electrical) Resistivity
F71.1 Overview of Inspection Tool
The predominant deterioration mechanism for ferrous pipes is electro-chemical
corrosion. Soils with low resistivity are more likely to have high corrosion rates, while high
resistivities are likely to indicate low corrosion rates. As such, measuring soil resistivity gives
an indication of the rate at which corrosion will occur. Soil resistivity can be measured in situ
or in the lab using a number of techniques.
F71.2 Main Principles
A number of factors influence the rate at which corrosion of ferrous assets will occur
including resistivity, pH, redox potential, moisture content and sulfide levels. Of these factors
soil resistivity is considered to be most representative of the likelihood of corrosion (Najjaran
et al, 2006). Resistivity varies with changes in soil moisture and salt content, lower moisture
content resulting in higher resistivity; lower salt content resulting in higher resistivity.
Field measurements of soil resistivity are conducted using the Wenner technique. This
involves inserting four equally spaced electrodes into the soil. An electrical potential is then
impressed between the outermost electrodes, and the potential drop between the two central
electrodes measured. Several measurements are taken and used to calculate the soil resistivity
(Lillie et al, 2004).
Lillie et al (2004) state that the electrodes should be located directly above the pipe and
along its axis; however other sources (ASTM G57-95a (2001); TM 5-811-7, 2005) indicate
that electrodes should be placed perpendicular to the axis of the pipe.
The Wenner technique measures the average resistivity from the soil surface to a depth
equal to the pin spacing, in particular the spacing between the two central electrodes, so this
distance should be chosen to coincide with pipe depth.
Lab measurements of soil resistivity can be conducted using a variation of the Wenner
technique (G57-95a (2001), AS 1289.4.4.1 -1997) or a two electrode method (ASTM G18705)
F71.3 Application
Soil resistivity is an environmental indicator of the corrosivity of soils. In conjunction
with other environmental information, the corrosion rate of materials in the soil can be
estimated. Reference standards include:
AS 1289.4.4.1 -1997: Determination of the electrical resistivity of soil.
ASTM G187-05 Standard Test Method for Measurement of Soil Resistivity Using the
Two-Electrode Soil Box Method.
ASTM G57-95a(2001) Standard Test Method for Field Measurement of Soil Resistivity
Using the Wenner Four-Electrode Method.
F71.4 Practical considerations
These techniques are widely used in the sector, and services are provided by a number
of companies.
As resistivity can change with depth due to the effect of the water table, when using the
Wenner technique, the spacing between each pin should be equal or greater than the
pipe depth.
Condition Assessment Strategies and Protocols for Water and Wastewater Utility Assets
F-207
Measurements should be taken to the side of the line of the pipe, to avoid the pipe from
being included in the conduction path.
Due to differences in the degree of compaction, the results obtained in the laboratory
tend to be lower than the corresponding values measured in situ.
Soil resistivity should not be measured on soil at below-freezing temperatures (TM 5811-7, 2005).
F71.5 Advantages
Low cost technique.
Gives an indication of soil corrosion potential.
Widely used technique.
F71.6 Limitations
Soil resistivity is only indicative of corrosion rate for buried ferrous assets; further
detailed analysis is required to actually determine corrosion rate and asset condition.
Table F-73. Summary Soil (Electrical) Resistivity.
Technical
selection
Technical
suitability
Utility technical
capacity
Economic factors
F-208
Criteria
Assets covered
Material type
Service Area
Access requirements
Limitations relating to asset condition
Limitations relating to asset size/geometry
Continuous/discrete
Destructive/non destructive
Interruption to supply/function
Assessment parameters
Integration with software tools
Commercialization of tool
Previous/existing use of the tool in sector
Accuracy/reliability
Ease of validation of results
Asset management sophistication required
Skills required (level of tool sophistication);
usability
Technology required (level of tool
sophistication)
Documentation
Availability of technical support
Cost per inspection
Resource requirements
Assessment
Environmental survey (pipeline assets).
Soil.
Potable and wastewater.
Access to soil surface required.
None.
None.
Results are discreet.
Non-destructive.
Inspection does not affect assets.
Soil electrical resistivity.
None.
Equipment is widely available but generally
superseded.
Widespread use.
Quantitative, but qualitative interpretation.
Results can be validated though other soil test.
Generic approach.
Operator training is required.
Low level technological requirements, specialized
equipment required.
AS 1289.4.4.1 -1997, ASTM G187-05, ASTM G5795a(2001).
Information available in literature.
Low cost .
Measurements can be undertaken by a single
person.
F71.7 Bibliography
1. Dorn, R., Howsam, P., Hyde, R.A. and Jarvis, M.A. Water mains: Guidance on assessment
and inspection techniques, CIRIA Report 162, Construction Industry Research and
Information Association, London, England, 1996
2. Lillie, K., Reed, C. and Rodgers, M. A. R., 2004, Workshop on Condition Assessment
Inspection Devices for Water Transmission Mains, AwwaRF, USA, 2004
3. Najjaran, H., Sadiq, R. and Rajani, B. Fuzzy Expert System to Assess Corrosion of
Cast/Ductile Iron Pipes from Backfill Properties, Computer-Aided Civil and Infrastructure
Engineering, 21, pp 67-77, 2006
4. Randall-Smith, M., Russell, A. and Oliphant, R., Guidance manual for the structural
condition assessment of trunk mains, WRc, UK, 1992
Condition Assessment Strategies and Protocols for Water and Wastewater Utility Assets
F-209
F72.0 Thermographic Testing
F72.1 Overview
Thermographic testing uses infrared (IR) imagery to locate defects and potential
failures in electrical equipment by scanning for thermal abnormalities. As IR energy is emitted
from objects due to their thermal properties, thermographic testing enables the early detection
of electrical problems that are associated with a thermal signal, such as overheating. This nondestructive test allows for the early identification and repair of defects before they potentially
cause unscheduled power losses, equipment damage, or even catastrophic equipment failures.
F72.2 Main Principles
Thermographic testing detects thermal properties using IR imaging. IR imaging allows
invisible IR radiation to be converted into a visible image so that objects are viewed on the
basis of their heat emissions rather than light properties. Images can be instantaneously viewed,
photographed, video recorded or if required can be downloaded to provide reports and
historical records for future comparison. By locating thermal abnormalities in images, such as
hot or cold spots, deteriorating and defective components can be identified and repaired or
replaced before failure.
F72.3 Application
Thermographic testing is an effective method of locating problems in all electrical
equipment that carries a current. Thermographic testing is potentially applicable to the
following: Substations, Switchgear, Motor Control Centers, Motors, Bearings, Transformers,
Circuit Breakers, Cables, Terminators, Bus Bars, Bus Plugs, Overhead Distribution Lines,
Starters Contactors, Transmission Lines, Power Panels, Lighting Panels, High Voltage
Equipment, Switches, Controls and Low Voltage Equipment. IR can also be used for roads and
roofs.
ASTM-E1934-99a and ISO/DIS 18436-8 are applicable to thermographic testing.
ISO/DIS 18436-8 is a Draft International Standard (DIS) with no specific standard for
this test method.
F72.4 Practical Considerations
Thermographic testing is widely applied for the testing of electrical systems; there are
numerous commercial organizations that provide specialist skills.
The testing equipment consists of handheld camera that is battery powered, so it is
readily portable.
Thermographic testing allows rapid scanning of electrical equipment and the results are
repeatable. The equipment must be under load conditions during testing.
Comparison of images taken from regular thermographic testing may show changes in
heat emissions, which enables early detection of possible faults.
F72.5 Advantages
Thermographic testing allows rapid scanning of equipment and can be used at a
distance, meaning that no direct contact or intrusion is required.
The results are reliable, can be recorded in different formats and sensors can be
sensitive to 0.1 °C.
F-210
F72.6 Limitations
A temperature difference is required to identify electrical faults. Some operator
experience is necessary as sensitivity and resolution can be reduced with distance to
object and angle of view.
As most thermographic testing is performed on "live front" energized equipment
precautions must be taken to ensure no direct contact with live parts.
Table F-74 Summary Thermographic Testing.
Technical
selection
Technical
suitability
Utility technical
capacity
Criteria
Assets covered
Material type
Service area
Access requirements
Limitations relating to asset condition
Limitations relating to asset size/geometry
Continuous/discrete
Destructive/non destructive
Interruption to supply/function
Assessment parameters
Integration with software tools
Commercialization of tool
Previous/existing use of the tool in sector
Accuracy/reliability
Ease of validation of results
Asset management sophistication required
Skills required (level of tool sophistication); usability
Technology required (level of tool sophistication)
Documentation
Availability of technical support
Economic factors
Cost per inspection
Resource requirements
Assessment
Wastewater/water electrical infrastructure substations, switchgear, motor control centers,
motors, bearings, transformers, circuit breakers,
cables, terminators, bus bars, bus plugs,
overhead distribution lines, starters contactors,
transmission lines, power panels, lighting
panels, high voltage equipment, switches,
controls and low voltage equipment.
N/A
Potable and wastewater.
Hand held battery operated.
None.
None.
Discrete.
Non-destructive.
Equipment is required to be on-line/under load.
Heat generated.
Stand alone.
Commercialized, can be used off the shelf.
Standard industry practice.
Qualitative.
Direct observation.
Generic approach
Field service engineer, HV authorized (in HV
areas)
None, is a stand alone portable tool
Is well documented. ISO/DIS 18436-8; ASTME1934-99a
Sufficient suppliers of equipment, training and
services.
Low.
One operator needed.
F72.7 Bibliography
1. ISO/DIS 18436-8: Condition monitoring and diagnostics of machines - Requirements for
training and certification of personnel - Part 8: Thermography (Under Development)
2. ASTM-E1934-99a (2005) Standard Guide for Examining Electrical and Mechanical
Equipment with Infrared Thermography
Condition Assessment Strategies and Protocols for Water and Wastewater Utility Assets
F-211
F73.0 Transformer Circuit Protection Coordination and Protection Relays
F73.1 Overview of Tool
Transformer circuit protection coordination and protection relays are designed to
prevent damage to valuable electrical equipment from short circuits or other faults.
Coordination of protection relays aims to minimize disruption to network operations by
ensuring that only equipment impacted by the fault is isolated and shutdown.
This review outlines the testing and analysis of electrical protection systems that should
be undertaken to ensure adequate protection and the reliable performance of protection relays.
This type of protective device co-ordination review should be done as part of any
comprehensive maintenance program at least every five years.
F73.2 Main Principles
Coordination of relay protection is designed to ensure that only the equipment
threatened with damage is isolated and removed from service. Relay settings determine when a
relay sends a control signal to a circuit breaker. A review of transformer circuit protection
coordination and protection relays should include analysis of fault levels, equipment ratings,
protection installed and protection settings to ensure faults such as short circuits will not cause
damage to electrical equipment.
Tests are designed to provide inputs to relay protections that simulate faults, such as
short circuits. Tests include primary and secondary injection tests sets for HV/MV distribution
switchboards and motor control centers for establishing the protection operates at the right
settings and includes motor protection relays. Primary injection testing involves injecting a
high current on the primary side of the transformer, which means the whole system is covered
by the test and requires the equipment to be off-line. Secondary testing involves disconnecting
protective relays from the transformers and circuit breakers, with current and voltage fed
directly to relay protection, which means that equipment can stay on-line. Primary injection
testing is generally only used in the case where new equipment is being commissioned or when
secondary circuits are not accessible.
F73.3 Application
Analysis of circuit protection coordination and protection relays can be applied to the
following: LV switchboards, HV switchgear, transformers and cabling. Relevant standards
include:
AS/NZ 3000 wiring rules. Various standards for equipment types (fuses, breakers,
MCCBs, etc.).
AS 3851-1991: The calculation of short-circuit currents in three-phase alternating
current systems.
AS 3865-1991: Calculation of the effects of short-circuit currents.
IEC 60865- Short-circuit currents - calculation of effects.
IEC 60909- Short-circuit currents in three-phase alternating current systems.
F73.4 Practical Considerations
Testing of electrical protective systems is standard, particularly in organizations such as
power and water utilities.
F-212
The analysis of relay protection and coordination requires an experienced and specialist
engineer. There are a number of companies that specialize in providing the expertise to
design and test electrical protection systems.
F73.5 Advantages
The design and testing of electrical protection systems is critical in preventing damage
to important and expensive electrical equipment.
If adequate information is available there is the potential for non-invasive desktop study
of electrical protection systems.
F73.6 Limitations
If data on the electrical protection system is lacking, a desktop analysis is not possible.
Therefore, direct access to components may required, which in some cases will result in
power shutdowns. Plant has to be off-line to enable the tripping of breakers.
Table F-75. Summary Transformer Circuit Protection Coordination and Protection Relays.
Technical
selection
Criteria
Assets covered
Material type
Service area
Access requirements
Limitations relating to asset condition
Limitations relating to asset size/geometry
Continuous/discrete
Destructive/non destructive
Interruption to supply/function
Technical
suitability
Assessment parameters
Integration with software tools
Commercialization of tool
Previous/existing use of the tool in sector
Accuracy/reliability
Utility technical
capacity
Economic factors
Ease of validation of results
Asset management sophistication required
Skills required (level of tool sophistication); usability
Technology required (level of tool sophistication)
Documentation
Availability of technical support
Cost per inspection
Resource requirements
Assessment
Electrical protection systems; fuses, overload
units, CTS, protection relays.
N/A
Potable and wastewater.
Access to HV authorized areas.
None.
None.
Gives time co-ordination with other devices for
fault currents.
Non-destructive.
For testing of equipment reaction it is necessary
to trip feeder units with resultant power outages.
Time for protection system to react and its
interaction with other protection devices.
Stand alone.
Fully developed.
Standard industry practice.
Within tolerances of supplied equipment e.g.,
tripping times may have a 10% margin.
Direct measurement.
Generic approach.
Requires experienced and qualified engineer.
N/A
Standard design in accordance with AS/NZ
3000; AS 3851-1991: AS 3865-1991 ; IEC
60865 ; IEC 60909.
N/A
N/A
Site survey and offsite desktop study.
Condition Assessment Strategies and Protocols for Water and Wastewater Utility Assets
F-213
F73.7 Bibliography
1. AS/NZS 3000:2000 Electrical installations (known as the Australian/New Zealand Wiring
Rules)
2. AS 3851-1991 : The calculation of short-circuit currents in three-phase alternating current
systems
3. AS 3865-1991 : Calculation of the effects of short-circuit currents
4. IEC 60865- Short-circuit currents - Calculation of effects - Part 1: Definitions and
calculation methods
5. IEC 60909- Short-circuit currents in three-phase AC systems - Part 3: Currents during two
separate simultaneous line-to-earth short circuits and partial short-circuit currents flowing
through earth
6. Thorp, J.S. The Protection System in Bulk Power Networks, Power System Engineering
Research Centre, 2003
F-214
F74.0 Transient Earth Voltage (TEV)
F74.1 Overview of Tool
The detection of transient earth voltage (TEV) is an indicator of partial discharge. In
general terms, partial discharge is a minute electrical pulse or discharge occurring in a gas
filled void or on a dielectric surface of a solid or liquid insulation system. This can occur upon
insulation breakdown due to aging, damage or contamination. The pulse or discharge only
partially bridges the gap between the phase to ground insulation. This is an early indicator of
insulation failure. Emissions from a partial discharge are electromagnetic, radio up to 80 MHz,
light, heat, acoustic ultrasonic and gases.
F74.2 Main Principles
If a partial discharge occurs in the phase to earth insulation of an item of high voltage
plant, a small quantity of charge is transferred capacitively to the earthed metal cladding. An
electromagnetic wave is generated at the discharge site which propagates away in all
directions. By escaping through an opening in the metal cladding, such as a gasketed joint, this
can be detected on the outer surface as a TEV. The TEV has a nanosecond rise time and
amplitude that varies widely from millivolts to volts.
F74.3 Application
TEV can be used to inspect HV switchgear, transformer cable boxes and tappings for
the detection of electrical insulation breakdown.
F74.4 Practical Considerations
Inspection of HV switchgear is best carried out in conjunction with ultrasonic emission
inspection to detect problems between phases, terminations and switch tank spouts (see
Ultrasound Emissions review).
HV authorized personnel only to undertake testing of HV electrical equipment.
F74.5 Advantages
TEV is non-destructive and components are monitored while in normal operation.
This method is easy to use and provides instantaneous information. It is a compact and
user-friendly tool that is also very durable.
There is no requirement to expose electrical live parts. No requirement for directs
contact.
F74.6 Limitations
Detects discharges to earth through voids or insulation breakdown. It does not detect
discharge between phases or into air. It therefore cannot, on its own, be used for all HV
switchgear or fault applications.
It is best used in a device that uses a combination of ultrasound and electromagnetic
detection.
Condition Assessment Strategies and Protocols for Water and Wastewater Utility Assets
F-215
Table F-76. Summary Transient Earth Voltage (TEV).
Technical
selection
Criteria
Assets covered
Material type
Service area
Access requirements
Technical
suitability
Utility technical
capacity
Economic factors
Limitations relating to asset condition
Limitations relating to asset size/geometry
Continuous/discrete
Destructive/non destructive
Interruption to supply/function
Assessment parameters
Integration with software tools
Commercialization of tool
Previous/existing use of the tool in sector
Accuracy/reliability
Ease of validation of results
Asset management sophistication required
Skills required (level of tool sophistication); usability
Technology required (level of tool sophistication)
Documentation
Availability of technical support
Cost per inspection
Resource requirements
Assessment
HV switchgear, transformer cable boxes and
tapping selector switches.
Electrical insulation.
Potable and wastewater.
HV authorized person usually required to
access plant areas.
None.
None.
Continuous during test.
Non-destructive.
On-line
Electrical discharge to earth.
Stand alone.
Commercialized, can be used off the shelf.
Industry standard practice.
Validity confirmed on insulation testing of unit
(requires power down) and physical inspection.
Is an indicative tool.
Direct measurement.
Generic approach.
Field service engineer, HV authorized.
None is a stand alone portable tool.
Is well documented.
N/A
Low cost test.
One operator needing only time required to
access plant item.
F74.7 Bibliography
1. EA technology, http://www.eatechnology.com, accessed 2006
F-216
F75.0 Ultrasonic Emission Inspection
F75.1 Overview of Tool
The use of audible sound has long been part of the information gathering process to
diagnose the operating condition of plant and machinery.
Audible sounds generated by individual bearings, electrical arcing, or leaks are difficult
to differentiate in a noisy environment where components operate within close proximity of
one another. Machinery also generates sound above the range of normal human hearing in the
ultrasound region. Due to the properties of ultrasound, the sounds made by individual parts can
be differentiated. Any physical changes in equipment will produce resultant sound changes.
Theses sound changes will often first appear within the ultrasound spectrum before the audible
spectrum, giving the opportunity for early diagnosis.
Ultrasonic emission inspection is a non-destructive method for maintenance
diagnostics, safety, and quality control.
F75.2 Main Principles
Machines and equipment generate both audible sound and ultrasound when in
operation. Ultrasound is sound that occurs above the normal range of human hearing, the upper
range of human hearing is typically 20 kHz. Defects such as electrical arcing and bearing
damage can be identified by their ultrasound signature.
Inspection is undertaken using a portable sensor. The ultrasound signal is converted
into the audible region with the normal audible signals being filtered out. The reproduced noise
retains recognizable characteristics such that a bearing sounds like a bearing and electrical
arcing sounds like arcing. This permits detection even in extremely noisy environments.
Ultrasound is very directional and attenuates much faster than audible sound. Therefore
it stays close to its source allowing for easier location. Detection can be improved by making
direct contact with the plant item using a solid probe so eliminating air gap attenuation.
In the case of bearings and gears, ultrasound will be emitted prior to mechanical failure,
thus giving the end-user of the ability to perform maintenance before breakdown occurs.
Ultrasonic emission inspection can also be used to detect and pinpoint electrical arcing,
tracking (partial discharge) or corona discharge on high voltage and medium voltage electrical
systems.
F75.3 Application
Ultrasonic emission inspection can be used to inspect plant mechanical defects within
motor bearings and gearing. Electrical faults that involve arcing, tracking over insulation
(partial discharge) or air discharge (corona) can also be detected. Acoustic ultrasonic can also
be used to check steam trap performance and to find air leaks.
Ultrasonic emission inspection is referenced in ISO-10375 - Non-Destructive Testing Ultrasonic Inspection - Characterization of Search Unit and Sound Field.
F75.4 Practical Considerations
Ultrasonic emission inspection is widely used throughout industry due to ease of use
and instantaneous results it obtains.
Ultrasonic emission detectors are compact, user-friendly and very durable. They can be
hand carried. The method can be implemented for routine predictive and preventive
Condition Assessment Strategies and Protocols for Water and Wastewater Utility Assets
F-217
maintenance inspections, for identification of failed components when a problem is
suspected, and for confirmation of repairs.
This method cannot be used in isolation for all HV switchgear applications. Inspection
of HV switchgear is best carried out with in conjunction with transient earth voltage
inspection (see transient earth voltage review). HV authorized personnel only to
undertake testing of HV electrical equipment.
F75.5 Advantages
Ultrasonic emission inspection is non-destructive and components are monitored while
in normal operation.
There is no requirement to expose electrical live parts or for direct contact. This method
is easy to use and provides instantaneous information.
This inspection method can be used in hazardous areas with suitably rated detectors.
F75.6 Limitations
Ultrasonic's will show problems with air switches, insulators and bushings in outdoor
structures only where direct air passage is available, for example, through the skin of
the cable box.
It cannot, on its own, be used for all HV switchgear applications. Inspection of HV
switchgear is best carried out with in conjunction with transient earth voltage inspection
(see Transient Earth Voltage Review).
Table F-77. Summary Ultrasonic Emission Inspection.
Technical
selection
Criteria
Assets covered
Material type
Service area
Access requirements
Technical
suitability
Utility technical
capacity
F-218
Limitations relating to asset condition
Limitations relating to asset size/geometry
Continuous/discrete
Destructive/non destructive
Interruption to supply/function
Assessment parameters
Integration with software tools
Commercialization of tool
Previous/existing use of the tool in sector
Accuracy/reliability
Ease of validation
Asset management sophistication required
Skills required (level of tool sophistication);
usability
Technology required (level of tool sophistication)
Documentation
Availability of technical support
Assessment
Wastewater/water motor bearings, HV/ MV
switchgear. All components from main
switchboards to individual motors.
N/A
Potable and wastewater.
No portable battery operated. Physical contact
required via probe to outer casing.
None.
None.
Continuous during test.
Non-destructive test.
Can be on-line.
Mechanical condition, electrical discharges.
Stand alone.
Commercialized; can be used off the shelf.
Standard industry practice.
Indicative measure.
Requires inspection of asset.
Generic approach.
Field service engineer
Tool only.
Well documented. ISO-10375.
Is well documented.
Economic factors
Criteria
Cost per inspection
Resources required
Assessment
Relatively low cost
One operator needing only time required to access
plant item and listen.
F75.7 Bibliography
1. ISO-10375 - Non-Destructive Testing - Ultrasonic Inspection - Characterisation of Search
Unit and Sound Field
2. CTRL, http://www.ctrlsys.com/library/faq/faq_ut.php, accessed 2006
3. EA technology, http://www.eatechnology.com, accessed 2006
Condition Assessment Strategies and Protocols for Water and Wastewater Utility Assets
F-219
F76.0 Ultrasonic Measurements; Continuous (Guided Wave)
F76.1 Overview
Ultrasonic inspection is a non-destructive test conducted by sending high frequency
sound into an asset and evaluating any echoes detected. Ultrasonic examination procedures are
widely used for thickness measurement, corrosion monitoring, delamination checks and flaw
detection in welds, forgings, castings and pipes.
In the material, the ultrasonic pulses travel in straight lines, until they hit an interface
between two different materials (steel and air for example), or a flaw, when most of the energy
of the vibration will be reflected. A small amount of the energy is reflected back to the probe,
where it is detected.
This section applies to continuous techniques used for the rapid screening of pipes for
corrosion/erosion. Discrete ultrasonic inspection techniques are considered in a separate
section (see Ultrasonic Measurements; Discrete).
F76.2 Main Principles
In recent years much work has gone into the development of ultrasonic techniques for
the rapid screening of pipes for corrosion/erosion. This has resulted in systems that make use
of low frequency guided waves. Systems were originally designed for use on above-ground
exposed or insulated pipes, but are now used on buried pipes, though the range of inspection
can be shorter.
Depending on the type of guided wave used, the number of transducers can range
between two and four. Torsion waves require only two transducers, while longitudinal waves
required three or four transducers. Torsion wave systems were first introduced in 1998 and can
be used in pipes filled with water. Longitudinal waves are not used for water filled pipes as the
signal is partially propagated through the water and also reenters the pipe wall, making signal
interpretation very difficult even in simple situations. Longitudinal systems that use three
transducers can only operate on a single frequency, while four transducer systems can operate
using more frequencies, improving results.
During testing a unit using piezoelectric transducers is clamped around the pipe and
ultrasound is sent simultaneously in both directions along the pipe. The signal obtained is
similar to a conventional ultrasonic A-scan, where the horizontal axis represents distance along
the pipe and the vertical axis represents signal amplitude, which is indicative of the severity of
the corrosion. Unlike conventional A-scans, the signals are displayed from three different wave
modes, namely symmetrical, horizontal flexural and vertical flexural. The relative intensities
and characteristics of these three signals are important in identifying different distributions of
corrosion.
Electro-magnetic acoustic transducers (EMATs) have also been used in some
applications. EMATS give relatively consistent results in comparison to piezoelectric
transducers since they do not need any couplant. Other methods are available which do not
require direct contact with the pipe, however these techniques suffer from increased noise in
the signal, reducing accuracy and the length of pipe which can be inspected.
F76.3 Application
Continuous ultrasonic measurement is used to obtain an understanding of corrosion
along a pipeline, above and below ground pipes can be assed. This technique is suitable for use
on pipe diameters above 50mm (2.0") and on wall thicknesses up to 40mm (1.6").
F-220
•
ASTM E1816-96(2002); Standard Practice for Ultrasonic Examinations Using
Electromagnetic Acoustic Transducer (EMAT) Techniques.
F76.4 Practical considerations
While this technique is relatively new, commercialized tools and services are available,
although generally from specialized consulting companies.
Recent advances in these systems allow focused guided waves to be used. These allow
the location of circumferential corrosion and improved signal to noise ratio. Although
propagation distances vary according to pipe geometry, contents, coating/insulation and
general condition, it is not unusual that a range of up to 30m (100') in either direction
from the transducer can be inspected. The technique is equally sensitive to internal and
external corrosion, but cannot distinguish between them.
F76.5 Advantages
•
The principal advantage of this technique is that it provides 100% initial screening
coverage, and only requires local access to the pipe surface (i.e. exposure of small
section of buried pipe or removal of a small amount of insulation) at those positions
where the transducer array is to be attached.
F76.6 Limitations
Continuous ultrasonic measurement is more expensive than discrete ultrasonic
measurements. While the technique is equally sensitive to internal and external
corrosion, it cannot distinguish between them.
Only very limited pipe lengths can be inspected when the pipe is heavily coated in a
very alternative material such as fresh bitumen. Surface deposits such as scale and
corrosion products also limit the length pipe which can be inspected.
Table F-78. Summary Ultrasonic Measurements; Continuous (Guided Wave).
Technical
selection
Criteria
Assets covered
Material type
Service Area
Access requirements
Limitations relating to asset condition
Limitations relating to asset size/geometry
Continuous/discrete
Destructive/non destructive
Technical
suitability
Interruption to supply/function
Assessment parameters
Integration with software tools
Commercialization of tool
Previous/existing use of the tool in sector
Accuracy/reliability
Assessment
Pipes, water and wastewater pipeline
infrastructure.
Iron and steel pipes.
Waste and potable water.
Direct contact with pipe wall required.
No limitations relating to asset condition
provided direct contact with the pipe wall is
available.
Pipe diameters above 50mm (2.0") and on wall
thicknesses up to 40mm (1.6").
Continuous readings.
Non-destructive. External tool require exposure
of pipe surface.
Does not require interruption.
Level of wall thickness or corrosion pit depths in
iron and steel pipes.
Tool integrated with software; some systems
upload results via mobile phones.
Commercialized.
Some use reported in the literature.
Quantitative.
Condition Assessment Strategies and Protocols for Water and Wastewater Utility Assets
F-221
Criteria
Ease of validation of results
Utility technical
capacity
Asset management sophistication required
Skills required (level of tool sophistication);
useability
Technology required (level of tool sophistication)
Documentation
Economic factors
Availability of technical support
Cost per inspection
Resource requirements
Assessment
Validation possible only by comparison with
manual /direct measurements.
Generic approach.
Professional skills to interpret output data. Tool
operation typically by a trained technician.
Specialized equipment and dedicated computer
software.
Tool principles and description of reports
generated by tool will be available.
Service provided by special operator.
Variable. Staff time will be the highest cost.
Equipment cost US$1,000-10,000.
Typically one person.
F76.7 Bibliography
1. Lowe M.J.S., Alleyne D.N., Cawley P., Defect detection in pipes using guided waves,
Ultrasonics Vol. 36, p147-154, Elsevier Science, 1998
2. Wassink, C.H.P., Robers M.A., de Raad J.A, and Bouma T. (2000) Condition Monitoring
of Inaccessible Piping, 15th World Conference on Nondestructive Testing, Roma (Italy)
15-21 October 2000. Accessible at:
http://www.ndt.net/article/wcndt00/papers/idn075/idn075.htm
F-222
F77.0 Ultrasonic Measurements; Discrete
F77.1 Overview
Ultrasonic inspection is a non-destructive test conducted by sending high frequency
sound into an asset and evaluating any echoes detected. Ultrasonic examination procedures are
widely used for thickness measurement, corrosion monitoring, delamination checks and flaw
detection in welds, forgings, castings and ferrous pipes.
An ultrasonic flaw detector has an oscillator circuit that sends electrical pulses to a
probe. The transducer in the probe produces ultrasonic vibrations when it receives the electrical
pulse. A range of vibration frequencies can be chosen between 1 MHz and 15 MHz depending
on the specific application. For example, typical frequencies used in weld examination are
between 2 MHz and 5 MHz.
The ultrasonic vibrations leave the probe and are conducted into the material to be
tested by a couplant, usually grease, oil, water, paste or gelatin.
In the material, the ultrasonic pulses travel in straight lines, until they hit an interface
between two different materials (steel and air for example), or a flaw, when most of the energy
of the vibration will be reflected. A small amount of the energy is reflected back to the probe,
where it vibrates the piezoelectric crystal, generating an electric current. This current returns to
the flaw detector, where it is amplified, rectified, filtered and displayed.
This section applies to discrete techniques used for screening of pipes for
corrosion/erosion at discrete locations. Continuous ultrasonic inspection techniques are
considered in a separate section.
F77.2 Main Principles
Several methods are available to produce the ultrasonic signals, piezoelectric ceramics
being the most common. Other methods include electromagnetic acoustic transducers
(EMATs), magnetosctrictive sensors (MSS), lasers and piezoelectric polymers.
When measuring wall thickness, the crystal is aligned perpendicular to the wall. The
waves propagate to the back wall and are reflected back towards the transducer. The transit
time from initial pulse to reception of back wall reflection is recorded. Knowledge of the
material’s ultrasonic velocity then gives the distance traveled by the wave. Calibration targets
of known thicknesses and materials are normally used to make these determinations
Figure F-12 illustrates a simple set-up using the pulse-echo principle and a twin crystal
probe. In this configuration, one crystal acts as transmitter and the other as the receiver.
Figure F-12. Simple Set-Up Using the Pulse-Echo Principle and a Twin Crystal Probe.
(Reprinted with permission from: Drury, J., 1996)
Figure F-13 shows a more complicated situation where the ultrasonic signal passes
through three materials the cement lining, pipe wall and corrosion products respectively. Four
Condition Assessment Strategies and Protocols for Water and Wastewater Utility Assets
F-223
echo signals are generated in this case, at the air-cement lining, cement lining-pipe wall, pipe
wall corrosion products and corrosion products-air interfaces. It should be noted that the
situation below is a schematic only, the transducer and detector both need to be in contact with
the surface of the asset being inspected. Also field experience indicates that ultrasonic
techniques are unable to detect flaws in cement mortar linings.
Figure F-13. Multiple Interfaces on Cement-Lined Water Pipe Create Multiple Ultrasonic Reflections
(Shown with a Probe Located Internally).
Wall thickness measurements are performed using a conventional flaw detector and a
compression wave probe, which sends longitudinal waves into the component at normal
incidence to the surface. Signals are displayed on the flaw detector screen in the form of an Ascan, in which the horizontal axis represents time and the vertical axis represents signal
amplitude. When a 0° compression probe is being used, the horizontal axis is equivalent to the
depth of the discontinuity (flaw or other interface) from the scanning surface.
The use of an A-scan display allows the operator to distinguish more easily between
signals originating from embedded plate flaws and the nominal back wall response. Also, the
dynamics of the back wall echo can be observed on the A-scan display to detect the presence of
pitting.
Conventional twin-crystal 0° compression probes are generally used to detect hidden
corrosion. However, where pitted surfaces are being assessed for remaining thickness, pencil
probes are used. These have a pointed tip which is designed to fit into the pits, so that the
remaining thickness can be measured where pitting is at its most severe.
F77.3 Application
Use for thickness measurement, corrosion monitoring, delamination checks and flaw
detection in welds, forgings, castings and ferrous pipes.
•
ASTM E1816-96(2002); Standard Practice for Ultrasonic Examinations Using
Electromagnetic Acoustic Transducer (EMAT) Techniques.
F77.4 Practical considerations
The technique is fully commercialized, with widespread use of the probes reported in
literature and trade journals. Accuracy of results can be high, but depends upon
application and calibration.
When ultrasonic tools are used for condition assessment, the ideal reflector of the
ultrasonic sound energy is a flat, smooth, surface parallel to the scanning surface and
F-224
larger in area than the beam at that range. These characteristics are not found in
corroded pipes.
An eroded pipe surface with a gradual gradient over most of the length of the eroded
area is a reasonable reflector (the surfaces are nearly parallel and relatively smooth). An
ultrasonic probe placed anywhere in the eroded region is therefore likely to give a
reasonable echo amplitude. Reasonable measurement accuracy can be expected as long
as the beam circumference is smaller than the eroded area. Drury (1996) showed that in
most cases corrosion measurements are accurate to within 0.5mm. If, however, the
erosion is uneven and with corrosion pits the accuracy is limited. Corrosion pits can
have a variety of shapes, but may be generalized into two forms, lake type and cone
type (Drury, 1996).
Figure F-14. Types of Corrosion Pits.
In lake type pitting the major part of the reflecting target is relatively parallel to the
scanning surface and will give adequate echo amplitude, provided the ultrasonic probe
is placed over the "flat" region.
Cone type pits are the most difficult to detect as the major reflecting surfaces are not
favorably orientated, the surfaces are rough and often ridged, and the target area is
often small in relation to the beam cross section. The latter is true particularly of the
base of the pit. For this reason cone type pits are the least likely to be detected and have
the greatest inherent inaccuracy in their measurement.
The likelihood of detecting corrosion pitting using the ultrasonic method is dependent
on many factors. Until recently, it was common practice to use spot checks on a grid
pattern. Area scanning is however now preferred and can be applied manually using
contact scanning or via automated scanning.
As noted above, the reflecting surface that is offered by typical corrosion pitting is
often poor for ultrasonic purposes and the operator needs to be able to see the character
of the signal to avoid errors. For this reason simple digital thickness meters are not
suitable for corrosion detection. Equipment with an A-Scan presentation is preferred
and this can be complimented by B-Scan (through wall view) and C-Scan (plan view
image) facilities.
The curved outer surface of pipe causes the incident ultrasonic beam to diverge. The
effect becomes more severe as the diameter of the pipe decreases. The effect is
overcome by making the circumferential dimension of the beam focus on the surface of
the test material small compared with the diameter of the pipe being inspected. For this
reason, probes with small beam focus are more suited for small diameter pipe.
F77.5 Advantages
Probes are availability in wide a range of sizes, measurement accuracies and costs.
Simple to use. User manuals supplied with instruments sufficient for operator training.
The external units can be used without supply interruption.
Wall thickness reductions detected with a reasonable degree of accuracy.
Condition Assessment Strategies and Protocols for Water and Wastewater Utility Assets
F-225
F77.6 Limitations
Inspection requires pipe cleaning prior to inspection to remove material, which would
affect the readings. For internal inspection, the pipe has to be off-line and dry as
inspection units are generally not waterproof.
If the pipe is inspected from the inside, care needs to be taken because the surface of
the specimen (concave rather than convex) will make the beam converge rather than
diverge.
Table F-79. Summary Ultrasonic Measurements; Discrete.
Technical
selection
Criteria
Assets covered
Material type
Service Area
Access requirements
Limitations relating to asset condition
Limitations relating to asset size/geometry
Continuous/discrete
Destructive/non destructive
Interruption to supply/function
Technical
suitability
Assessment parameters
Integration with software tools
Commercialization of tool
Previous/existing use of the tool in sector
Accuracy/reliability
Ease of validation of results
Utility technical
capacity
Asset management sophistication required
Skills required (level of tool sophistication);
useability
Technology required (level of tool sophistication)
Documentation
Economic factors
Availability of technical support
Cost per inspection
Resource requirements
F-226
Assessment
Pipes, tanks, etc.
Iron and steel.
Waste and potable water.
Direct contact with asset wall required. Pipe
surface must be clean. The asset surface may
also require shot blasting abrading to provide a
smooth surface.
Poor coupling on excessively pitted surfaces
can cause inaccuracies.
Internal tools: generally limited to pipes 250 mm
and greater. External tools: no limit, but small
diameter pipes require probes with small
footprint to minimize curve effect.
Discrete.
Non-destructive. External tool require exposure
of pipe surface. Internal tool requires access by
cut-ins or other methods.
External tool does not require interruption.
Internal tool application requires pipe to be offline.
Wall thickness or corrosion pit depths in iron
and steel pipes.
Stand alone.
Commercialized, availability widespread.
Widespread commercial use of the UT probes
reported in literature and trade journals.
Quantitative.
Validation possible only by comparison with
manual/direct measurements. Calibration of tool
against reference samples required.
Generic approach.
Tool operation typically by a trained technician.
User manual sufficient for operator training.
Specialized equipment and dedicated computer.
software.
Tool principles and description of reports
generated by tool will be available
Service provided by special operator.
Variable. Staff time will be the highest cost.
Equipment cost US$1,000-10,000.
Typically one person to carry out test, but pipe
must be excavated.
F77.7 Bibliography
1. Drury, J.C. Corrosion monitoring and thickness measurements – what are we wrong?, IIR
Bulk Liquid Storage Tank Conference London 22nd /23rd January 1996, accessed at:
http://www.silverwinguk.com/en/technical%20pdfs/ultrasonics_corrosion_pitting.pdf
2. Saka, M. and Salam Akanda, M. A. Ultrasonic Measurement of the Crack Depth and the
Crack Opening Stress Intensity Factor under a No Load Condition, Journal of
Nondestructive Evaluation, Vol. 23, No. 2, pp 49-63, 2004
Condition Assessment Strategies and Protocols for Water and Wastewater Utility Assets
F-227
F78.0 UtilNets
F78.1 Overview
UtilNets is a prototype software-based decision-support system intended to help
manage the preventative maintenance of water distribution assets. It performs current condition
assessments and reliability-based life predictions for pipes, and analyzes the consequences of
maintenance decisions.
UtilNets uses a GIS-based user interface, and results are presented as thematic maps
and tables. The tool provides a forecast on the aggregate structural, hydraulic, water quality,
and service reliability of the network, together with an assessment of the required rehabilitation
expenditures. It also provides support to rehabilitation planning by ranking each pipe segment
in the whole network on a basis of its need for rehabilitation.
Currently, the software is in a prototype phase and can only be used in the assessment
of cast-iron water mains.
F78.2 Main Principles
UtilNets is based on physical models of asset degradation. The life expectancy of pipe
segments is determined based on known asset performance data and the permanent, seasonal
and variable loads to which a pipe segment is subjected. This life expectancy is then used in
conjunction with budgetary figures for the prioritisation of asset rehabilitation measures such
as lining or replacement. While still in the prototype phase UtilNets has been implemented for
cast-iron water pipes, it is extendable to other pipe materials, and includes the following:
Probabilistic models that give a measurement of the likelihood of structural, hydraulic,
water quality and service failure of pipe segments over the next several years.
Assessment of both the quantifiable and qualitative consequences of various
rehabilitation options, including the ‘do nothing’ option, over time.
Selection of the optimal rehabilitation policy for each failed pipe segment.
An aggregate structural, hydraulic, water quality and service profile of the network
together with an assessment of the required rehabilitation expenditures.
An assessment of network reliability in terms of demand point connectivity and flow
adequacy.
UtilNets optimizes the individual rehabilitation policy for each segment and the ranking
of rehabilitation within the whole network.
F78.3 Application
The software is designed to facilitate maintenance management of water distribution
assets. A prototype of UtilNets has been implemented for cast-iron water pipes, but is
extendable to other pipe materials
F78.4 Practical considerations
UtilNets has been used by several European water authorities during its development,
but is not yet commercialized.
Since most utilities have in general incomplete information about the state of their pipe
network, a complex Default Manager has been incorporated to yield forecasts even
F-228
where data is incomplete. Probability curves are provided to assist the Default Manager
where applicable.
A data dictionary has also been prepared as part of UtilNets to assist users. The data
dictionary sets out the way in which data is held, by both type and units.
F78.5 Advantages
A data dictionary has been prepared as part of UtilNets to assist the user in setting up
the system.
The software comes with an import manager which can be used to import data into the
UtilNets database from a number of sources such as Oracle and Access databases, text
files and Excel.
The software provides defaults that allow analysis when there are data gaps.
F78.6 Limitations
UtilNets in its current prototype form is rigid, complex and requires large amounts of
data that may be unaffordable to collect and to enter on to the system. For this reason
more utilities are being involved from across Europe to help the developers in
designing the commercially available version of UtilNets.
Currently only grey and ductile cast-iron water mains can be assessed.
Table F-80. Summary UtilNets.
Technical
selection
Technical
suitability
Criteria
Assets covered
Granularity
Service Area
Focus of analysis
Scalability of tool/approach
Commercialization
Previous/existing use of the tool
Utility technical
capacity
Ease of validation
Flexibility with regard to analysis (asset types) and
granularity (system, asset level)
Integration with other tools/GIS
Asset management sophistication
In-house skills required
Technology required
Documentation
Data Requirements
Linking to asset data
Availability of software and technical support
Usability
Assessment
Pipes, water pipeline infrastructure.
Sub system level.
Potable.
Reliability-based, decision-support system for
the maintenance management of pipes.
Better suited to medium to large authorities
where good asset data is available.
Currently prototype software.
Only been used by several European water
authorities during its development.
Via statistical means only.
Potable only; designed for assessment at a
segment level, utilizing a cluster of pipes.
None.
Aimed at higher level of asset management
where good asset data is available, though
defaults are provided.
Asset manager/engineer.
PC based tool. Windows based system.
Only limited documentation available.
Good quality asset data and asset failure history
data is required.
No direct link.
Only limited support available at this time.
High skill levels may be required.
Condition Assessment Strategies and Protocols for Water and Wastewater Utility Assets
F-229
F78.7 Bibliography
1. Hadzilacos, T.; Kalles, D.; Preston, N.; Melbourne, P.; Camarinopoulos, L.; Eimermacher,
M.; Kallidromitis, V.; Frondistou-Yannas, S.; and Saegrov, S. UtilNets: a water mains
rehabilitation decision-support system, Computer, Environment and Urban Systems,
Volume: 24, Issue: 3, pp. 215-232, 2000
F-230
F79.0 Valve Exercising
F79.1 Overview
The operation of valves is critical to the function of a water distribution system. In the
event of a pipe failure, valves are used to minimize the impact and to allow repair work to be
carried out. Boundary valves can also be operated in an emergency to rezone areas. As such,
valve locations should be known and operation checked intermittently, although the impact of
the disturbed flow must be considered before doing this (change in flow conditions can disturb
sediments and cause discoloration events).
Valve exercising is a non-destructive test used to ensure the function of valves by
moving them through their full range of motion. Periodic operation gives a measure of
operability, which in turn can be used as an indicator of condition. A valve exercising program
is thereby used as a means of identifying faulty or broken valves needing replacement.
F79.2 Main Principles
Valve exercising is generally performed as a program where all valves in a network are
assessed. A valve exercising program consists of four main components; 1) locating the valve,
2) exercising the valve, 3) maintaining up-to-date records for each valve and 4) scheduling
repairs as required.
When conducting a valve exercising program, each valve should be operated through a
full cycle and returned to its original position on a regular basis. The time frame can vary
between authorities, depending on local experience, but should be often enough to prevent a
build-up of corrosion products and any other deposits that could render the valve inoperable or
prevent full closing. The time interval between valve exercising for more critical valves should
be shorter than for other less important valves.
When conducting the program, a detailed record of valves should be maintained
including the number of turns required to close or open the valve, torque required to operate
valve (if possible), valve location, valve condition, maintenance required etc. This data should
be compared with previous records to identify any changes to valve operation.
If when exercising valves the action is tight (requires more torque than previously), the
operation should be repeated until the opening and closing actions are smooth and free.
Equipment is now widely available to operate valves reducing the effort required by operators.
F79.3 Application
Valve exercising is conducted in order to maintain an up-to-date record of valve
condition, schedule repair work as required and to extend valve life through preventative
maintenance. The following documents provide guidance on valve exercising:
ANSI/AWWA G200-04, Distribution Systems Operation and Management, American
Water Works Association
AWWA Manual M44 Distribution Valves, American Water Works Association
F79.4 Practical considerations
Equipment is now widely available to operate valves reducing the effort required by
operators, reducing back problems and improving the efficiency of operation.
A program of flushing may be undertaken first in an attempt to minimize the risk of
water quality issues associated with changed flow conditions when valves are operated.
Condition Assessment Strategies and Protocols for Water and Wastewater Utility Assets
F-231
The torque used to operate a valve should be the lowest required. This torque should be
maintained throughout as too much torque on closing will mean significantly more
torque will be required to reopen the valve. Too much torque can also force the valve
and a higher percentage of broken valves will result.
F79.5 Advantages
Valve exercising can increase the lifetime of a valve, removing build-up on the action
that can prevent operation.
Allows valves requiring repair to be identified.
F79.6 Limitations
Cost of introducing the program may seem prohibitive to some authorities.
Changed flow conditions could result in disturbance of sediments and discoloration
events.
Table F-81. Summary Valve Exercising.
Technical
selection
Technical
suitability
Utility technical
capacity
Economic factors
F-232
Criteria
Assets covered
Material type
Service Area
Access requirements
Limitations relating to asset condition
Limitations relating to asset size/geometry
Continuous/discrete
Destructive/non destructive
Interruption to supply/function
Assessment parameters
Integration with software tools
Commercialization of tool
Previous/existing use of the tool in sector
Accuracy/reliability
Ease of validation of results
Asset management sophistication required
Skills required (level of tool sophistication);
useability
Technology required (level of tool
sophistication)
Documentation
Availability of technical support
Cost per inspection
Resource requirements
Assessment
Valves.
N/A
Potable.
Valve must be accessible.
No restrictions, if the valve cannot be exercised in its
current condition then it should be repaired or
replaced.
Depends on equipment being used to operate valve.
Discrete.
Non-destructive.
Inspection can be conducted on-line.
Valve condition and operability.
N/A
Equipment for valve exercising is fully commercialized
Not used historically, but is now being undertaken.
Direct assessment of operability.
N/A
Generic approach.
Operator needs training in procedure of equipment
use and data recording.
Require specific equipment to operate valves, where
not operated by hand.
Tools and related documentation are available from
equipment suppliers.
Tool supported from equipment supplier.
Low cost.
Requires only single person, equipment to operate
valve and to record relevant data.
F79.7 Bibliography
1. Blakely, D. Why bother with a valve exercising program, On Tap Magazine, National
Drinking Water Clearinghouse, 2004
Accessed October 2006 at: http://www.nesc.wvu.edu/ndwc/articles/OT/WI04/valve.html.
2. Hurley, L. (2005) Water Main Valve Exercising Program, Conference Proceedings of
Pipes Wagga Wagga 2005, Charles Sturt University, Wagga Wagga, N.S.W., October 1720, 2005
Condition Assessment Strategies and Protocols for Water and Wastewater Utility Assets
F-233
F80.0 Vibration Analysis
F80.1 Overview of Tool
Vibration analysis is used to monitor the condition of assets and for fault diagnosis.
Vibration is typically measured using hand-held (can be permanently positioned)
accelerometers placed on the equipment at key measurement points, with portable data
collectors and software for vibration analysis. Vibration analysis is commonly used on large
items of rotating equipment, such as turbines, centrifugal pumps, motors, gearboxes etc.
F80.2 Main Principles
All machines vibrate; over time the pattern of this vibration changes as the asset
condition changes. By measuring the displacement at different points of an asset over time
using transducers, the pattern of the vibration can be established.
The pattern of the vibration provides a great deal of information about the asset, such as
RMS level (imbalance and misalignment), shock pulse (bearing condition) and spike energy.
This information can then be analyzed using Fast Fourier Transform techniques. Once broken
down into component frequencies, patterns can be observed that relate to plant operation. An
example of this is a fan’s rotation with its resultant signature frequencies and the additional
frequency caused by an imbalance on one of the blades.
Analysis can be preformed by experience and knowledge of the equipment,
manufacturer’s guidelines, or by using proprietary software. In the example given above, the
number of fan blades and speed will directly relate to observed frequencies so allowing the
cause to be determined. A severity number can then be assigned, to act as a benchmark. The
number is chosen either by experience or the proprietary software. If the number increases,
each time the asset is tested, the condition of the asset has deteriorated. The importance of
changes will be different for differing assets. Understanding when to take action requires
experience, training, manufacturer’s guidance and Standards.
F80.3 Application
Vibration analysis can be used on any vibrating machinery, but is most commonly used
on machinery with rotating parts such as gearboxes, drive shafts, motor bearings, rotors in
electric motors, pumps and fans.
The ISO 10816-1:1995 and BS ISO 18436-2:2003: reference vibration analysis.
BS ISO 18436-2:2003 specifies the general training requirements for personnel who
perform condition monitoring and diagnostics on assets using vibration analysis. Certification
to this standard will provide recognition of the qualifications and competence of individuals to
perform machinery vibration measurements and analysis using portable and permanently
installed sensors and equipment. However, ISO certification is only necessary if a utility is ISO
certified; the Vibration Institute provides various levels of certification from technician to
expert and is generally used by most industries in the United States.
F80.4 Practical Considerations
Vibration analysis is in wide use throughout manufacturing industry, using both
permanent and portable transducers. While it is relatively easy to record vibration data,
proper analysis requires experienced and trained personnel.
F-234
Vibration analysis should be used as part of routine assessment to allow for developing
trends in the equipment to be identified. Vibration analysis assessments are often
carried out on a monthly basis.
Vibration can be measured using a number of different types of transducers;
accelerometers, velocity transducers and displacement transducers. Accelerometers are
the most common and versatile transducers in use and the only type capable of
measuring high frequency vibration such as that produced by bearing and gear
problems. However, accelerometers have reduced accuracy at low frequencies.
Repeatability is key to worthwhile comparisons. If the plant is operated at different
speeds, the frequencies generated and their amplitude may be changed. The plant must
therefore be operated in the same manner and the same load as previous samples.
During a sample the load and speed must remain constant.
Block/washers are normally installed on equipment to provide a stable source for the
vibration probe and to provide repeatability of results.
F80.5 Advantages
Vibration analysis is non-destructive. Portable measuring devices can be used. Assets
can remain on-line subject to repeatability issues noted above.
F80.6 Limitations
Must form part of a monitoring program to allow comparison with previous results.
Table F-82. Summary Vibration Analysis
Technical Selection
Criteria
Assets covered
Material type
Service area
Access requirements
Limitations relating to asset condition
Limitations relating to asset size/geometry
Continuous/discrete
Destructive/non destructive
Interruption to supply/function
Suitability
Assessment parameters
Integration with software tools
Commercialization of tool
Previous/existing use of the tool in sector
Accuracy/reliability
Ease of validation of results
Assessment
Rotating machinery such as gearboxes,
misalignment of couplings on drive shafts, motor
bearings, out of balance rotor in electric motors,
pumps, and fans.
N/A
Potable or wastewater.
Fixed test points required to ensure same
measuring point used.
None.
None.
Can be either. More usually discrete
measurement.
Non-destructive.
Must be on-line with same load conditions as
previous test.
Vibration.
Stand alone.
Fully developed and of the shelf.
Widely used.
Good accuracy of measurement
Alignment checks, ultrasound measurement.
Condition Assessment Strategies and Protocols for Water and Wastewater Utility Assets
F-235
Utility technical
capacity
Economic factors
Criteria
Asset management sophistication required
Skills required (level of tool sophistication);
usability
Technology required (level of tool sophistication)
Documentation
Availability of technical support
Cost per inspection
Resource requirements
Assessment
Generic approach.
Requires training.
Standard PC.
Well documented. ISO 10816; ISO 18436.
Widely available.
No information.
One person no more than a few minutes per
load once test points are established.
F80.7 Bibliography
1. ISO 10816-1:1995: Mechanical vibration -- Evaluation of machine vibration by
measurements on non-rotating parts -- Part 1: General guidelines
2. BS ISO 18436-2:2003: Condition monitoring and diagnostics of machines - Requirements
for training and certification of personnel
3. Vibration School.com, http://www.vibrationschool.com/index.htm, accessed 2006
F-236
F81.0 Visual Inspection (Pipes)
F81.1 Overview
Visual inspection is a low-tech inspection method of structural condition assessment
that requires no specialized equipment and can provide a great deal of useful information about
buried assets.
Visual inspection can be carried out as an opportunistic approach to condition
assessment when assets are unearthed for operational reasons. Visual inspection is also
undertaken as a precursor to other condition assessment techniques.
After exposing the asset, visual observations should be recorded using written
descriptions, photography and/or video recordings. Exposing buried assets also allows the
quality and condition of back fill to be assessed.
F81.2 Main Principles
Visual inspection of the external surface of a buried asset requires the asset to be
exposed. Once exposed and cleaned, the condition of any external protective measure such as
PE sleeving or bitumen coating can be inspected.
The spread and pattern of any deterioration on the asset can then be assessed. This may
provide an indication of the cause of the deterioration, and the likelihood of it being more
widespread.
Unearthing the asset also allows the quality and condition of backfill to be assessed.
The quality and condition of back fill is a critical factor for polymeric pipe lifetime, and can
also strongly affect the condition of external coatings on ferrous mains. In particular:
Plastic materials are subject to fracture resulting from point loading. For this reason the
presence of stones and other similar materials in the surround media should be noted.
Pitting concentrated at the crown of a ferrous pipe may be caused by rocks in the
backfill damaging the external coating when the pipe was originally buried. Such
effects are likely to occur wherever the system is in rocky soils (Dorn, 1996).
F81.3 Application
This technique is used commonly onsite and should be undertaken whenever a pipe is
exposed and as a precursor to other condition assessment techniques.
F81.4 Practical considerations
Visual inspection is a widely applied approach to condition assessment and can be
applied by operators with a basic knowledge of asset deterioration.
Standard inspection record forms should be used to ensure all relevant data are
collected and is available in a standard format (Dorn, 1996). Training of
maintenance/service personnel in the requirements of completing inspection forms can
increase data available for analysis.
Digital photographs can be taken to provide a permanent record of points of interest.
F81.5 Advantages
Physical observation can be conducted when the asset is exposed for other reasons
enabling useful information to be obtained at minimal cost.
Condition Assessment Strategies and Protocols for Water and Wastewater Utility Assets
F-237
The technique is simple and requires no specialized equipment, although a camera and
welding hammer can be useful. When undertaken as an opportunistic inspection it is
low cost. Results can be used to indicate any further tests which might be useful.
F81.6 Limitations
Results are qualitative only; depending on operator experience and detail included in
inspection reports. Results are also limited to the section observed.
Table F-83. Summary Visual Inspection (pipes).
Technical
selection
Technical
suitability
Utility technical
capacity
Economic factors
Criteria
Assets covered
Material type
Service Area
Access requirements
Limitations relating to asset condition
Limitations relating to asset size/geometry
Continuous/discrete
Destructive/non destructive
Interruption to supply/function
Assessment parameters
Integration with software tools
Commercialization of tool
Previous/existing use of the tool in sector
Accuracy/reliability
Ease of validation of results
Asset management sophistication required
Skills required (level of tool sophistication);
useability
Technology required (level of tool sophistication)
Documentation
Availability of technical support
Cost per inspection
Resource requirements
Assessment
Pipes.
Any.
Wastewater and potable.
Physical access to the asset is required.
None.
None.
Results are discreet.
Non-destructive.
Inspection does not affect assets.
Visual condition of pipe, and quality of backfill.
None.
Framework approach.
Widespread use.
Qualitative only.
Results can be validated through other
assessment techniques.
Generic approach.
Operator training is required for consistent
results.
None.
Technique described well in literature.
Information available in literature.
Low cost.
Can be undertaken by a single person.
F81.7 Bibliography
1. Dingus, M., Haven, J. and Austin, R. Non-destructive None Invasive Assessment of
Underground Pipes, AwwaRF, USA, 2002
2. Dorn, R., Howsam, P., Hyde, R.A. and Jarvis, M.A. Water mains: Guidance on assessment
and inspection techniques, CIRIA Report 162, Construction Industry Research and
Information Association, London, England, 1996
3. Rajani, B.; Kleiner, Y. Non-destructive inspection techniques to determine structural
distress indicators in water mains, National Research Council of Canada, Institute for
Research in Construction, NRCC-47068, 2004, (downloaded from www.nrc.ca/irc/ircpubs)
F-238
F82.0 WARP
F82.1 Overview
WARP is a software-based decision support tool that helps to model the deterioration
rates of water mains and subsequently plan their renewal. To achieve this, WARP provides a
number of functions, including the analysis of water main breakage patterns, short-term
operational forecasting and long-term renewal planning.
Static factors affecting pipe failure rates (e.g., pipe material, diameter, soil) are
considered through the grouping of water mains into relatively homogeneous groups.
Historical failure patterns are assumed to govern the future behavior of the water mains. Based
on this assumption, and with the appropriate economic and cost data, the future impact of
various operational strategies can be computed.
The analysis of water main breakage patterns is undertaken in WARP accounting for
time-dependent factors such as temperature, soil moisture (rainfall deficit), main replacement
rates and cathodic protection strategies. The influence of each of these factors on pipe failure
rate is quantified to identify the background deterioration rates of buried water mains.
The impact of various operational strategies on future failure rates can also be
predicted.
F82.2 Main Principles
WARP is a computer program developed at the National Research Council of Canada
(NRC). The software is designed to integrate the use of several models developed at NRC into
a decision support tool-box.
WARP considers three types of factors affecting water main breakage rates. The first is
termed background ageing, which is a result of corrosion and other continuous deterioration
processes. The second consists of cyclical environmental effects such as temperature and soil
moisture. The third comprises operational factors such as water main replacement rates and the
rate of cathodic protection retrofit. As such, the analysis undertaken in WARP includes the
following:
A multi-variate model to predict water main breaks; a general, multi-variate
exponential model is used to consider time-dependent factors in predicting water main
breaks. This model is applied to groups of water mains that are assumed homogeneous
with respect to their deterioration rates.
Impact of climate: The breakage rate of buried pipes can be influenced by climatic
conditions, in particular rainfall and frost. To incorporate climate, WARP uses a
surrogate measure for the severity of winter in a given year. Similarly, a surrogate
measure is used for soil moisture.
Impact of cathodic protection strategies; this module is used to allow the benefits of
retrofitting cathodic protection to be incorporated into the analysis (cathodic protection
is assumed to be fitted either opportunistically at the time of pipe failures, or in a
systematic retrofitting program).
WARP can perform analyzes of historical breakage rates with or without any number of
covariates. When no covariates are selected, the results indicate an average ageing rate only.
When one or more covariates are selected, the results reflect background ageing (the consistent
increase in pipe breakage rate due to corrosion and other continuous deterioration processes) as
well as annual variations due to the influence of time-varying, dynamic factors.
Condition Assessment Strategies and Protocols for Water and Wastewater Utility Assets
F-239
Once the analysis identifies all the parameters and coefficients governing the breakage
rates in the water mains, expected future breakage rates can be forecasted. With the appropriate
economic data, such as costs of breakage consequences, pipe replacement and cathodic
protection, long-term planning can then be undertaken.
WARP can perform some rudimentary optimizations as well as calculate the life-cycle
costs of any user-defined strategy, which may include combinations of cathodic protection and
pipe replacement over several years.
F82.3 Application
The software is designed to facilitate rehabilitation planning and maintenance
management of water distribution assets.
F82.4 Practical considerations
There has been limited use of the tool to date; through it has been developed with the
in-kind support of water utilities in Canada and the United States.
The software is Windows based and has a graphical user interface.
Significant volumes of data are required for the application of the approaches to pipe
failure prediction.
F82.5 Advantages
WARP integrates a number of tools into a decision support tool-box; the tools are based
on published research.
The analysis of both steady and dynamic influences on the pipe failure rate are
considered, which will allow utilities to understand the background level of network
deterioration without the influence of annual variations associated with dynamic factors
beyond the utility’s control.
The tool allows various operational strategies to be considered to determine their
relative effectiveness.
F82.6 Limitations
Use of tool to date has been limited to the development projects.
Data requirements are high.
Analysis is based on the assessment of asset cohorts. It is thus macro model that
estimates a broad range of lengths of water mains to be rehabilitated or replaced each
year. The model does not predict specific water mains that should be rehabilitated or
replaced each year.
F-240
Table F-84. Summary WARP.
Technical
selection
Technical
suitability
Criteria
Assets covered
Granularity
Service Area
Focus of analysis
Scalability of tool/approach
Commercialization
Previous/existing use of the tool
Ease of validation
Utility technical
capacity
Flexibility with regard to analysis (asset types) and
granularity (system, asset level)
Integration with other tools/GIS
Asset management sophistication
In-house skills required
Technology required
Documentation
Data Requirements
Linking to asset data
Availability of software and technical support
Usability
Assessment
Pipes, water pipeline infrastructure
System and asset cohorts.
Potable.
Long-term asset management planning using
asset failure curves developed from utility asset
data.
Better suited to medium to large authorities
where good asset data is available.
Commercial software released in 2006.
Developed through in kind support from utilities
in the United States and Canada .
Initial validation is provided in statistical analysis
of failure data and development of failure
curves.
Potable; designed for system level, but does
allow assessment at sub network level.
None.
Aimed at higher level of asset management
where good asset data is available.
Asset manager/engineer.
PC based tool. Windows based operating
system.
Research and development fully documented.
Good quality asset data and asset failure history
data is required.
None; cohort level analysis.
Software available through NRC.
Simple user interface.
F82.7 Bibliography
1. Kleiner, Y.; Rajani, B. Modeling the deterioration of water mains and planning their
renewal, National Research Council of Canada, Institute for Research in Construction,
NRCC-46119, 2002 (downloaded from www.nrc.ca/irc/ircpubs)
2. Rajani, B.B.; Kleiner, Y. WARP - water mains renewal planner, National Research Council
of Canada, Institute for Research in Construction, NRCC-44680, 2001 (downloaded from
www.nrc.ca/irc/ircpubs)
Condition Assessment Strategies and Protocols for Water and Wastewater Utility Assets
F-241
F83.0 WRc Sewer Rehabilitation Manual
F83.1 Overview
The WRc Sewer Rehabilitation Manual (SRM) is a framework for assessing the
condition and performance of sewerage networks. The SRM sets out a strategy that
concentrates appropriate investigations on those parts of the system where problems are most
severe with the aim of producing:
Significant cost savings in necessary rehabilitation works.
The ability to limit future rehabilitation costs as the network gets older.
The means of quantifying and justifying the financial requirements for future upgrading
programs.
The approach was developed principally to meet the sewerage rehabilitation needs of
the United Kingdom water sector. However, it has since been applied in a number of other
countries. While it had an initial focus on the United Kingdom, some minor amendments were
made to bring the SRM approach into line with the European Standard, Drain and Sewer
Systems Outside Buildings: Part 5 Rehabilitation.
F83.2 Main Principles
The SRM is currently divided into two volumes:
Volume 1 deals with the determination of the structural performance of sewers, survey
techniques, and procedures for assessing deterioration and collapse mechanisms,
analysis of hydraulic performance, and maintenance planning.
Volume 2 deals with new renovation techniques and structural design methods for
sewer renovation.
The basis of the SRM procedure is the systematic investigation of drainage areas, so the
division of the utility’s area of operation into one or more drainage areas (catchments) is
essential. The SRM procedure for a drainage area is divided into three main stages:
1. Initial Planning: this is an initial investigation to establish the extent and type of
problems in the drainage area and to plan the approach for the diagnostic study.
2. Diagnostic Study: this is the detailed investigation stage, which is tailored to meet the
needs of the drainage area. The details of the study therefore depend on the nature of
the problems identified during the initial planning stage.
3. Implementation: the final stage of the procedure involves the implementation of the
rehabilitation plan, operation of the system in accordance with the operations and
maintenance plan, and the long term monitoring of the system.
A key aspect of the diagnostic study is the structural condition assessment of the
sewers, which is achieved through standard CCTV inspection and grading procedures.
Selection of sewers to inspect is targeted towards those sewers where the risk of failure is
highest. The types of failure considered can include one or more of the following:
Structural collapse of the sewer.
Blockage of the sewer.
Leakage of effluent from the sewer.
F-242
Without first inspecting the sewers it is not possible to fully assess the risk of failure.
Three possible approaches are described in the SRM to address this paradox:
1. Consider only the consequences of failure. Since the assessment of the consequences
of failure does not generally depend on the condition, consequence can be used as a
basis for identifying potentially high risk sewers. A method of identifying those sewers
(termed critical sewers) with a high consequence of collapse is a central feature of the
SRM. The consequences include direct costs to the utility as well as social costs (e.g.,
traffic disruption).
2. Consider available information known to affect the likelihood of failure. This
approach allows the selection of those sewers where other factors would suggest that
the likelihood of failure is high (e.g., shallow depth).
3. Consider consequences together with the available information known to affect
the likelihood of failure. This approach allows the selection of sewers with high
failure risk, whether this is due to the high consequences failure, a high likelihood of
failure, or a combination of both.
When considering which sewers to inspect, the principle aim is to select a group such
that the total costs of failure over time would be significantly higher than the costs of
inspection and subsequent pro-active rehabilitation before failure. In some countries,
legislation requires inspection of certain sewers. If this is the case, this requirement will
override any other consideration.
After CCTV inspection, each sewer length inspected is assigned into one of five grades
as set out in Table F-85. Two methods of assessing the internal condition grade are available:
A computerized scoring system based on defect codes.
A manual method.
Table F-85. Internal Condition Grades.
Grade
Implication
5
Collapsed or collapse imminent.
4
Collapse likely in foreseeable future.
3
Collapse unlikely in near future but further deterioration likely.
2
Minimal collapse likelihood in short term but potential for
further deterioration.
1
Acceptable structural condition.
Once the internal condition grade has been allocated, various other factors are used to
make an assessment of the likelihood of structural failure (collapse) of the sewer or further
deterioration. To this end, a structural performance grade (SPG) is allocated based on the
internal structural condition grade and other information such as surcharge potential and soil
type.
Since an internal structural condition of (say) 3 (collapse unlikely in near future but further
deterioration likely) can represent low or high risk depending on the specific asset’s context,
it is the SPG that is of most interest to the asset manager.
Condition Assessment Strategies and Protocols for Water and Wastewater Utility Assets
F-243
F83.3 Application
The SRM provides guidelines and procedures to assist in the planning and design of
works to improve the performance of existing sewer systems and in the strategic planning of
operations and maintenance work.
F83.4 Practical considerations
The SRM is published as a CD and can be purchased from WRc
(http://www.webookshop.com/). A trimmed down version of the manual can be found
at http://www.wrcplc.co.uk/srm/.
The manual has been widely adopted in the United Kingdom and is also used in other
countries.
While the scope of the manual is focused on wider service issues, structural condition is
a major focus of the SRM approach and is assessed through the collection and
interpretation of CCTV and other data.
F83.5 Advantages
The WRc framework is a generic approach built on a well established engineering
framework. As such it provides a practical means of collecting information to better
understand the condition and performance of sewerage networks.
The WRc approach can be used to obtain both an understanding of present condition
and the interventions required to address service issues in sewerage networks.
F83.6 Limitations
The overall approach has been designed in light of European practices; United States
approaches may differ from those adopted.
The approach presupposes there are issues within the drainage area. Drainage areas that
do not have hydraulic, environmental, structural or operational problems are outside the
applicability of the SRM and do not warrant investigation in the manner described in
the Manual. As such, the scope of the SRM does not cover drainage areas where there
are no service issues.
F-244
Table F-86. Summary WRc Sewer Rehabilitation Manual.
Technical
selection
Technical
suitability
Criteria
Assets covered
Granularity
Service Area
Focus of analysis
Scalability of tool/approach
Commercialization
Previous/existing use of the tool
Ease of validation
Utility technical
capacity
Flexibility with analysis (asset types) and
granularity (system, asset level)
Integration with other tools/GIS
Asset management sophistication
In-house skills required
Technology required
Documentation
Data Requirements
Linking to asset data
Availability of software and technical support
Usability
Assessment
Sewerage networks.
Drainage area to sewer level.
Wastewater
Cost effective management of sewerage assets;
resolution of service problems in drainage
areas.
Scaleable; framework can be tailored to meet
the demands of any size company.
Framework available as a manual.
Has been widely used in the United Kingdom
water sector.
Validity of results depends on data collection
and interpretation.
Wastewater; asset to system level.
N/A
Generic approach.
Professional engineering skills required for
development of assessment program.
Contractors usually used to inspect pipes
Depends on CCTV inspection tool used.
Approach documented in a Manual that has
been kept current and up to date.
High; requires data on drainage area and
environment, but the program can be tailored in
terms of affordability issues.
N/A
Not supported by software. Technical support is
not available except on a consultancy basis.
N/A
F83.7 Bibliography
1. WRc (2001) Sewerage Rehabilitation Manual – 4th Edition, Water Research Council
(WRc), Accessed October 2006 (Limited content version):
http://www.wrcplc.co.uk/srm/
Condition Assessment Strategies and Protocols for Water and Wastewater Utility Assets
F-245
F84.0 WRc Trunk Main Structural Condition Assessment Approach
F84.1 Overview
The WRc Trunk Main Structural Condition Assessment approach is a framework for
assessing the structural condition of large diameter pressure pipes. It can be applied to the
range of pipe materials used in the bulk transmission of potable water; that is, ferrous,
cementitious, and plastics. The approach also covers the condition assessment of valves.
The overall approach is broken down into a number of logical steps:
Initial Data Gathering: Define the purpose of the study, and review currently available
(including opportunistic) data.
Subdivision of system under study into categories on the basis of physical pipeline
features and environmental factors.
Inspection of pipes in the categories of importance, with due consideration given to
factors such as the strategic importance of the pipe, the consequence of pipe failure and
known problem pipes/areas.
Analysis and interpretation of data.
F84.2 Main Principles
The basic purpose of WRc’s structural condition assessment framework is to draw
general conclusions about the current and future structural condition of the system under study
from a limited number of discrete observations made at a fixed point in time. To achieve this,
the pipeline system to be assessed is notionally divided into categories based on pipe
parameters and environmental factors. The pipe parameters and environmental factors include
such things as:
Pipe diameter.
Corrosion protection systems.
Soil type and characteristics.
Water source and composition.
Other categories are added covering such things as valves, pipe bridges, etc.
Once the pipeline system has been appropriately divided, an inspection program is then
developed to cover the asset categories identified. These inspections provide a snapshot of the
current state of the system. To be able to provide future predictions of asset condition,
information on the following is also required:
The deterioration mechanism.
The deterioration rate.
The change of the deterioration rate over time.
The point in the deterioration process at which the pipe fails.
F84.3 Application
A framework approach to the condition assessment of large diameter transmission
pipes.
F-246
F84.4 Practical considerations
The WRc approach to condition assessment is detailed in a published manual
obtainable from WRc (http://www.webookshop.com/index.asp).
In practice, the WRc approach has often been applied to the assessment of cast iron
pipes. For these pipes, measurement of condition is often made by shot blasting the
pipe, measuring external pit depths by manual means (e.g., using a welding gauge), and
use of ultrasonic sensors to assess the level of internal pitting. Remaining life is then
calculated through simplifying assumptions, namely that:
1. Corrosion is assumed to be initiated as soon as the pipe is brought into service;
2. The internal and external corrosion rates do not change with time;
3. The deepest external pit measured is coincident with the calculated deepest internal
pit, that is, maximum thinning of the wall, based on measured values, is assumed;
4. The ‘failure’ of the pipe is taken to occur as soon as corrosion penetrates the wall,
so called through-wall corrosion.
These simplifying assumptions mean there is a high degree of uncertainty inherent in
the predictive assessment of structural condition in the future. The WRc manual notes
that it is important that this uncertainty is taken into account when interpreting survey
results so that appropriate management decisions can be made.
Where the variability in structural condition within the system is low, and observation
points are well chosen, the WRc approach will allow conclusions to be drawn about the
system-wide condition. As the variability increases, however, the number of
observation sites required to accurately quantify that variability increases, and it
becomes difficult to provide accurate information about the state of the overall system.
It is thus critical to precisely define the objectives of a study so that a cost-effective
assessment program with an appropriate level of discrimination can be devised.
Brittle failures are often independent of pipe deterioration; the condition of valves is
therefore important to damage limitation.
F84.5 Advantages
The WRc framework is a generic approach built on a well-established engineering
framework. As such it provides a practical means of collecting information to better
understand the condition of large diameter pipes.
The WRc approach can be used to obtain both an understanding of present condition
and, with the application of appropriate simplifications, the change in condition into the
future.
F84.6 Limitations
Having been first published in 1992, the approach could be considered somewhat dated,
especially with regard to the use of discrete sampling techniques. However, in practice
the underlying principles are still valid and pragmatic in many situations, especially for
utilities with little information regarding their transmission pipe network.
The main limitation of the approach is that generalized conclusions are made about
pipeline systems from measurements made at a limited number of discrete points.
Condition Assessment Strategies and Protocols for Water and Wastewater Utility Assets
F-247
The WRc Manual notes that the confidence levels of the asset life predictions are low
and should be interpreted accordingly. In particular, predictions of asset life expectancy
do not indicate the time to next failure.
Table F-87. Summary WRc Trunk Main Structural Condition Assessment Approach.
Technical
selection
Technical
suitability
Criteria
Assets covered
Granularity
Service Area
Focus of analysis
Scalability of tool/approach
Commercialization
Previous/existing use of the tool
Ease of validation
Utility technical
capacity
Flexibility with regard to analysis (asset types) and
granularity (system, asset level)
Integration with other tools/GIS
Asset management sophistication
In-house skills required
Technology required
Documentation
Data requirements
Linking to asset data
Availability of software and technical support
Usability
Assessment
Trunk mains; pipes and valves.
Pipelines or networks of pipes.
Potable.
Current structural condition and remaining life
Scaleable; inspection program can be tailored to
meet the demands of any size company.
Framework available as a manual.
Has been widely used in the United Kingdom
water sector.
Results of discrete sampling procedures are
uncertain.
Mainly potable, but applicable to force sewer
mains; asset to system level.
N/A
Generic approach.
Professional engineering skills required for
development of assessment program.
Contractors usually used to inspect pipes.
Depends on inspection tool used.
Approach documented in a manual, though this
is somewhat out of date, the underlying
principles still apply.
Moderate; requires data on pipeline and
environment, but the program can be tailored in
terms of affordability issues.
N/A
Not supported by software. Technical support is
not available except on a consultancy basis.
N/A
F84.7 Bibliography
1. Randall-Smith, M., Russell, A. and Oliphant, R. Guidance manual for the structural
condition assessment of trunk mains, WRc, United Kingdom, 1992
F-248
F85.0 Volumetric X-Ray or Radiographic Testing
F85.1 Overview of Tool
Volumetric X-Ray or radiographic testing is a non-destructive method used for
checking the integrity of metal assets such as welded pipe joints and plant components.
The technique is based on the transmission of X-rays onto to an object, with the
resultant radiation signal being used to produce an image. Volumetric X-ray testing uses
multiple X-ray images taken from different angles to enable reconstruction of any horizontal or
vertical X-ray image plane. This capability enables the viewing of additional information that
may be hidden by obstructing details in the testing region of interest (Berger and Schulte,
2002). This can assist in providing additional information for the detection and characterization
of discontinuities, such as hollow spaces or foreign material, in all kinds of structures,
including welds, castings, electronic devices and electromechanical assemblies.
F85.2 Main Principles
Volumetric X-ray testing requires a minimum of two images to be taken from different
angles in order to permit the viewing of stereo images. A typical testing set-up is shown in
Figure F-15. The X-ray source is located at an oblique angle with respect to the vertical
direction of the object (asset component). The object under test is rotated to eight different
positions, and an X-ray image is taken at each position. The process is very flexible and is not
constrained to any specific positions, number of images or geometry. The circular image
pattern, however, is convenient to demonstrate the technique. The image detector can be any
flat panel detector, film or scintillator.
Figure F-15. Volumetric X-Ray Testing
(Reprinted with permission from: The American Society of Nondestructive Testing, 2002).
Any view through the object can be reconstructed with software tools that use the basic
set of oblique incidence images acquired during the X-ray test to develop an image. The
reconstructed X-ray image planes have the capacity to provide precision dimensional
measurements.
Condition Assessment Strategies and Protocols for Water and Wastewater Utility Assets
F-249
Horizontal and vertical X-ray reconstructed images can provide excellent location
information about weld discontinuities. Information about discontinuities such as the size and
location of pores and inclusions in the weld bead can be reconstructed along the direction of
the weld and through the center of the pore. By combining this with the capability for
dimensional measurement, the quality of the weld can be assessed and repair decisions such as
from which side of the weld to start can be made.
F85.3 Application
X-ray tomosynthetic imaging (imaging by sections or sectioning) can be used on a wide
variety of assets including castings, electronic devices and electromechanical assemblies;
however the most practical application for the water industry is weld testing. The following
standards reference this test method:
ASME Code 31.1 and B31.3 standards are applicable for pressure vessels.
AS 3507.1—2003 Non-destructive testing Part 1: Guide to radiography for ferrous
castings.
Tomography (imaging by sections or sectioning) is defined in ASTM E-1316 (1999).
F85.4 Practical Considerations
Volumetric X-ray testing is a commonly used non-destructive testing method outside of
the water industry. Equipment for industrial application, such as inspection of welds, is
commercially available from a large number of suppliers. The equipment can be
supplied in a number of configurations from portable units that can be used in the field
by one operator to larger non-portable units.
Volumetric X-ray testing has to be carried out by trained staff aware of all the health
and safety issues involved in the use of ionizing radiation. In addition, experience is
required to interpret the radiographs produced.
Accurate interpretation of volumetric X-ray images requires skilled operators who can
recognize and categorize the flaws in welded joints. Zuev et al (2006) propose the
following main types of defects that can be observed in welded joints using X-ray
testing: pores, slag or tungsten inclusions, incomplete fusions and cracks.
Access is often required to both sides of asset or asset element, which is not always
practical. When an X-ray source is placed on one side of the asset and a photographic
plate which records the image is placed on the other, safety precautions are required to
safeguard personnel and the general public. This procedure is usually expensive and the
disruption often unacceptable for routine investigations.
F85.5 Advantages
Use of a digital flat panel provides high sensitivity, fast response and good resolution.
Images of any region of an asset can be obtained quickly and with little effort with
volumetric X-ray systems. The viewer can look behind obstructing details that may
hide the region of interest.
Reconstructed viewing of any horizontal or vertical X-ray image plane is achievable
along with the ability to scan through selected horizontal or vertical image regions as
well as a precision measurement capability. Volumetric X-ray imaging in conjunction
with methods such as tomosynthesis or computed tomography can provide the
additional information often needed for critical non-destructive testing applications.
F-250
Volumetric X-ray imaging’s real-time radioscopic capability means that an immediate
response is given during testing. The operator can view the usual two dimensional Xray image and decide if more information is needed to complete the test. If that is the
case, additional images can be taken while the asset to be tested is in place to provide
the volumetric images needed.
F85.6 Limitations
Volumetric X-ray imaging is relatively time consuming and expensive. There are also
significant occupational safety hazards associated with the use of X-ray imagery due to
the potential for radiation accidents. The staff operating the equipment need to be fully
trained in safe operating procedures and monitored for radiation exposure.
The accurate development and interpretation of volumetric X-ray testing to identify
asset defects requires significant operator experience and expertise.
Table F-88. Summary Volumetric X-Ray or Radiographic Testing.
Technical
selection
Criteria
Assets covered
Material type
Service area
Access requirements
Limitations relating to asset condition
Limitations relating to asset size/geometry
Continuous/discrete
Destructive/non destructive
Interruption to supply/function
Technical
suitability
Assessment parameters
Integration with software tools
Commercialization of tool
Previous/existing use of the tool in sector
Accuracy/reliability
Utility technical
capacity
Economic factors
Ease of validation of results
Asset management sophistication required
Skills required (level of tool sophistication);
useability
Technology required (level of tool sophistication)
Documentation
Availability of technical support
Cost per inspection
Resource requirements
Assessment
Welded pipe joints, castings, electronic devices,
electromechanical assemblies and other plant
components.
N/A
Potable and wastewater.
None.
No restriction.
No limitations relating to size of element.
Continuous reading in time and space.
Non-destructive.
The asset will be required to be taken off-line if
asset components are taken for laboratory testing
or access is required by testing apparatus from the
water side of asset.
The measurement, detection and characterization
of asset components.
Stand alone.
Equipment is fully developed, available from
selected commercial vendors.
Widespread use internationally on steel bridges, in
the petrochemical, process and nuclear industries.
Relatively common selective applications in the
water industry, e.g., on pipework.
Quantitative. Accuracy is dependent on the
resolution of the image detector.
Direct measurement.
Generic approach.
Trained staff can take measurements. Limited
specialist knowledge and training required.
High level of sophistication.
AS 3507.1—2003.
Technical support available from distributors.
Relatively high cost per inspection.
One operator required.
Condition Assessment Strategies and Protocols for Water and Wastewater Utility Assets
F-251
F85.7 Bibliography
1. AS 3507.1 (2003) Non-destructive testing Part 1: Guide to radiography for ferrous castings
2. ASTM E-1316 (1999), Standard Terminology for Nondestructive Examinations.
3. Berger and Schulte Volumetric X-Ray Testing, Back to Basics Archive (Available at:
http://www.asnt.org/publications/materialseval/basicsarchive.htm), The American Society
for Non-Destructive Testing, 2002
4. Zuev, V. M., Ivanov, V. I. and Kapustin, V. I. Classification of flaws in ultrasonic and Xray testing, Russian Journal of Nondestructive Testing, Vol. 42, No. 5, pp. 325-333, 2006
F-252