1
Ink Master
Reference Manual
INTRODUCTION
User Information
X-RITE SOFTWARE LICENSE AGREEMENT
This is a legal agreement between you (either an individual or an
entity) and X-Rite, Incorporated. By opening the sealed software
packets(s) you are agreeing to be bound by the terms of this
agreement. If you do not agree to the terms of this agreement, X-Rite
and its suppliers are unwilling to grant you a license to use the
software, and you may not use the software. You may, however,
promptly return the unopened software packet(s) and the
accompanying items (including written materials and binders or other
containers) to the place you obtained them for a full refund.
1. GRANT OF LICENSE
X-Rite grants to you the right to use one copy of the enclosed X-Rite
software product (“SOFTWARE”) on a single computer. The
SOFTWARE is in “use” on a computer when it is loaded into temporary
memory (i.e. RAM) or installed into permanent memory (e.g. hard disk,
CD-ROM, or other storage device) of that computer. However, installation
on a network server for the sole purpose of distribution to one or more
other computer(s) shall not constitute “use” for which a separate license is
required. The license granted herein transfers neither title nor proprietary
rights to you with respect to the SOFTWARE.
2. COPYRIGHT
The SOFTWARE is owned by X-Rite or its suppliers and is protected by
United States copyright laws and international treaty provisions.
Therefore, you must treat the SOFTWARE like any other copyrighted
material (e.g. a book or musical recording) except that you may either (a)
make one copy of the SOFTWARE solely for backup or archival purposes,
or (b) transfer the SOFTWARE to a single hard disk provided you keep the
original solely for backup or archival purposes. You may not copy the
written materials accompanying the SOFTWARE, and you may not
remove the labels or proprietary legends from the SOFTWARE or its
i
I N T R O D U C T I O N
3.
documentation. All rights not specifically granted under this agreement
are retained by X-Rite.
TRANSFER/LIMITATIONS
This agreement is your proof of license to exercise the rights granted
herein and must be retained by you. You may not rent, lease or sublicense
the SOFTWARE, but you may transfer the SOFTWARE and
accompanying written materials on a permanent basis provided you retain
no copies and the recipient agrees to the terms of this License Agreement.
If the SOFTWARE is an update or has been updated, any transfer must
include the most recent update and all prior versions. You may not reverse
engineer, decompile or disassemble the SOFTWARE.
4.
MULTIPLE ENVIRONMENT SOFTWARE/MULTIPLE
LANGUAGE SOFTWARE/DUAL MEDIA SOFTWARE/MULTPLE
COPIES/UPGRADES.
If the package contains, or, in connection with the acquisition of the
Software contained in this package you receive, two or more operating
environment versions of the SOFTWARE (e.g., Macintosh® and
Windows®) two or more language translation versions of the SOFTWARE,
the same SOFTWARE on two or more media (e.g., diskettes and a CDROM), and/or you otherwise receive two or more copies of the
SOFTWARE, the total aggregate number of computers on which all
versions of the SOFTWARE are used may not exceed the primary
computer as described above. You may make one back-up copy, in
accordance with the terms of this Agreement.
You may not rent, lease, sublicense, lend or transfer versions or copies of
the SOFTWARE you do not use, or SOFTWARE contained on any unused
media, except as part of the permanent transfer of all SOFTWARE and
Documentation as described above.
5.
LIMITED WARRANTY
X-Rite warrants that the SOFTWARE will perform substantially in
accordance with the accompanying written materials for a period of ninety
(90) days from the date of receipt. This limited warranty (“Limited
Warranty”) is expressly conditioned on your observance of the operating
procedures set forth in the documentation. X-Rite shall not be obligated to
correct, cure, or otherwise remedy any nonconformity or defect in the
SOFTWARE if you have made any changes to, misused, or damaged the
SOFTWARE.
X-RITE AND ITS SUPPLIERS DISCLAIM ALL OTHER
WARRANTIES, EITHER EXPRESS OR IMPLIED, INCLUDING,
ii
USER
INFORMATION
BUT NOT LIMITED TO, IMPLIED WARRANTIES OF
MERCHANTABILITY AND FITNESS FOR A PARTICULAR
PURPOSE, TITLE AND NON-INFRINGEMENT WITH REGARD
TO THE SOFTWARE, THE ACCOMPANYING WRITTEN
MATERIALS, AND ANY ACCOMPANYING HARDWARE.
6.
CUSTOMER REMEDIES
X-Rite’s and its suppliers’ entire liability and your exclusive remedy shall
be, at X-Rite’s option, either (a) return of the price paid, or (b) repair or
replacement of the SOFTWARE or hardware that does not meet X-Rite’s
Limited Warranty and which is returned to X-Rite with a copy of your
receipt. The Limited Warranty does not apply if failure of the
SOFTWARE has resulted from accident, abuse, or misapplication. Any
replacement SOFTWARE or hardware will be warranted for the remainder
of the original warranty period or thirty (30) days, whichever is longer.
Outside the United States, these remedies are not available without proof of
purchase from an authorized non-U.S. source.
7.
NO LIABILITY FOR CONSEQUENTIAL DAMAGES
IN NO EVENT SHALL X-RITE OR ITS SUPPLIERS BE LIABLE
FOR ANY DAMAGES WHATSOEVER (INCLUDING, WITHOUT
LIMITATION, SPECIAL, INCIDENTAL, INDIRECT AND
CONSEQUENTIAL DAMAGES FOR LOSS OF BUSINESS PROFIT,
BUSINESS INTERRUPTION, LOSS OF BUSINESS
INFORMATION, OR ANY OTHER PECUNIARY LOSS) ARISING
OUT OF THE USE OF OR INABILITY TO USE THE SOFTWARE,
EVEN IF X-RITE HAS BEEN ADVISED OF THE POSSIBILITY OF
SUCH DAMAGES. IN ANY CASE, X-RITE’S ENTIRE LIABILITY
UNDER ANY PROVISION OF THIS AGREEMENT SHALL BE
LIMITED TO THE AMOUNT ACTUALLY PAID BY YOU FOR
THE SOFTWARE. BECAUSE SOME STATES/COUNTRIES DO
NOT ALLOW THE EXCLUSION OR LIMITATION OF LIABILITY
FOR CONSEQUENTIAL OR INCIDENTAL DAMAGES, THE
ABOVE LIMITATION MAY NOT APPLY TO YOU.
8.
U.S. GOVERNMENT RESTRICTED RIGHTS.
The SOFTWARE and documentation are provided with RESTRICTED
RIGHTS. Use, duplication, or disclosure by the Government is subject to
restrictions as set forth in subparagraph (c)(1) and (ii) of the Rights in
Technical Data and Computer Software clause at DFARS 252.227-7013 or
subparagraphs (c)(1) and (2) of the Commercial Computer Software –
Restricted Rights at 48 CFR 52.227-19, as applicable.
iii
I N T R O D U C T I O N
If you acquired this product in the United States, this Agreement is
governed by the laws of the State of Michigan.
Should you have any questions concerning this Agreement, please contact:
X-Rite, Incorporated 3100 44th Street S.W./Grandville, MI 49418/Phone
616-534-7663, Fax 616 534-2513.
X-Rite, Incorporated 1996, 1999
“ALL RIGHTS RESERVED”
X-Rite® , Ink-Master®, and QA-Master® are registered trademarks of X-Rite, Incorporated.
Windows® is a registered trademark of Microsoft Corporation.
iv
USER
INFORMATION
Table of Contents
Section One—Getting Started
Installing the Software............................1-2
Installing the Security Key......................1-3
Starting the Application ..........................1-4
What You’ll See First .............................1-4
Tutorial ..................................................1-5
Section Two—Instrument Setup & Calibration
Connecting the Instrument .....................2-1
Proper Measuring Techniques................2-4
Instrument Calibration............................2-4
Section Three—User Interface
Main Screen ..........................................3-2
Menu Bar ...............................................3-2
Control Window .....................................3-3
Desktop Area .........................................3-5
Using Your Mouse..................................3-5
Using The Keyboard ..............................3-6
Getting Help...........................................3-7
Section Four—Setting Up Your Software
Administrative Options...........................4-2
Database Options ..................................4-3
Formulation Options ..............................4-3
Units of Measure Options.......................4-6
Display Options......................................4-7
Instrument Port ......................................4-10
Instrument Mode....................................4-10
Auto Inventory .......................................4-11
Section Five—Establishing Your Database
Entering Customers and Suppliers .........5-2
Setting Up a Calibration Set...................5-5
Entering Calibration Inks ........................5-10
Creating a Secondary Calibration Set ....5-17
Creating a Substrate Library ..................5-20
v
I N T R O D U C T I O N
Section Six—Formulating
Entering the Standard ........................... 6-2
Setting Tolerances ................................ 6-4
Formulating a Match ............................. 6-9
Testing the Match.................................. 6-14
Improving the Match ............................. 6-15
Accepting a Match or Correction ........... 6-17
Section Seven—Basic Techniques
Taking a Measurement.......................... 7-2
Printing Color Data................................ 7-9
Using the Note Editor ............................ 7-17
Adding Notes & Tags to a Sample......... 7-19
Accepting or Rejecting a Sample .......... 7-20
Finding a Standard................................ 7-20
Finding Samples ................................... 7-23
Section Eight—Managing Your Data
Copying & Pasting Data ........................ 8-2
Downloading Data ................................. 8-3
Uploading Data ..................................... 8-13
Exporting Standards & Inks ................... 8-15
Transferring Data .................................. 8-18
Backing Up Your Database ................... 8-22
Restoring Your Database ...................... 8-23
Section Nine—Viewing Your Data
View Menu ............................................ 9-2
Window Menu ....................................... 9-2
View Specific Menu............................... 9-4
Tolerance View ..................................... 9-5
Controls View........................................ 9-5
L*A*B* View .......................................... 9-7
FMC2 View ........................................... 9-9
Spectral View ........................................ 9-11
Status Density View .............................. 9-13
Trend View............................................ 9-15
L*A*B* Data View.................................. 9-17
Spectral Data View................................ 9-18
Status Density Data View ...................... 9-19
Formula View........................................ 9-20
Notes & Tags View................................ 9-21
Visual Color View .................................. 9-23
Verbal Color View ................................. 9-24
vi
USER
INFORMATION
Indices View...........................................9-25
Delete All ...............................................9-27
Section Ten—Advanced Software Features
Creating Filters ......................................10-2
Creating Tags ........................................10-12
Using Lot IDs .........................................10-14
Alternate Entry Methods.........................10-16
Alternate Standards ...............................10-19
Visually Editing Tolerances ....................10-20
Advanced Ink Selection Methods ...........10-22
Recycling Waste Ink ..............................10-23
Formulating a Series of Matches............10-24
Formulating From a Trial .......................10-27
Using Batch Add Mode ..........................10-33
Editing Formulas....................................10-37
Appendix A—Sample Preparation Guide
..............................................................A-1
Appendix B—Technical Support
..............................................................B-1
Appendix C—Technical Glossary
..............................................................C-1
Index
..............................................................Index-1
vii
I N T R O D U C T I O N
ABOUT QA-MASTER SOFTWARE INCLUDED WITH
INK-MASTER
X-Rite's QA-Master is also included with your Ink-Master Formulation
Software.
QA-Master Quality Assurance software package is setup and operates
basically in the same manner as Ink-Master (i.e., creating customers,
creating standards, etc.). Therefore, the Ink-Master Reference Manual
can be referred to for information when required.
The QA-Master application does include
extensive on-line help and an Interactive
Tutorial if more detailed information is required on the application.
QA-Master is activated by double clicking on the QA-Master icon.
viii
CHAPTER 1 SECTION ONE
Getting Started
Section Contents
Installing the Software............................1-2
Installing the Security Key......................1-3
Starting the Application ..........................1-4
What You’ll See First .............................1-4
Tutorial ..................................................1-5
This section covers installing and starting your software application.
It guides you through the installation process, then shows you what you’ll
see first and previews what you’ll be doing first. Most of this information
applies to the very first time you start up your software.
The next section, Instrument Set-up & Calibration, helps you connect your
instrument and calibrate it for use with the software. Section Three is a
User Interface Guide that briefly describes the windows, buttons, and
menus that you use to run the software and Instruments. Once you become
familiar with the user interface, you’re ready to work with the software.
Section FourSetting Up Your Software describes how to set-up the
software to work more conveniently for you. Section Five—Establishing
Your Data describes the techniques and functions available to organize
your data. Software functions available for ink formulation are explained in
Section Six—Formulating. Section Seven provides information about the
basic techniques for using the software, and Section Eight covers topics
concerning managing your data. Section Nine describes all of the available
methods for viewing your data. Lastly, Section Ten provides information
about advanced software features.
1-1
1
SECTION
ONE
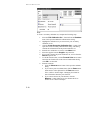
INSTALLING THE SOFTWARE
Software is installed using X-Rite’s Setup-Master program. This is a
common program that allows you to install all of the available X-Rite
applications from one consistent interface. Simply check the appropriate
check boxes to select the applications you want to install.
NOTE: Some users of this software package have purchased “turn-key”
systems with a pre-installed application. These users can use the following
procedures in the event they must re-install the software from their back-up
disks.
The Ink-Master software application installs onto your specified computer
hard drive using a series of 3.5” diskettes. Installation instructions are
provided for both Windows® 3.1 and Windows® 95. Successful
installation creates a Program Manager group in the drive location you
specified.
Windows 3.1 Installation
1.
2.
3.
4.
5.
6.
7.
8.
Start Windows.
Insert Install Disk 1 into your 3.5” disk drive.
Select the File menu item of Program Manager.
Select the Run function from the File pull down menu.
Check the appropriate check boxes for the applications you want to
install.
Select the correct source drive (A: or B:) from the Source Drive
drop down list.
Click the OK button.
Follow the Full Install installation instructions on your computer
screen.
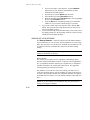
Windows 95 Installation
1.
2.
3.
4.
5.
1-2
Insert Install Disk 1 into your computer’s 3.5" diskette drive.
Select your Start button.
Select the Control Panel folder under the Setting Start Menu item.
Double-click the Add/Remove Programs icon in the Control
Panel directory. The Add/Remove Programs Properties dialog
box appears.
Click the Install/Uninstall tab to activate the Install function, then
click the Install… button.
G E T T I N G
6.
7.
8.
9.
S T A R T E D
Follow the Install Wizard prompts to start the software Setup
program, then check the appropriate check boxes for the applications
you want to install.
Select the correct source drive (A: or B:) from the Source Drive
drop down list.
Click the OK button.
Follow the Full installation instructions.
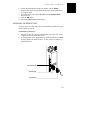
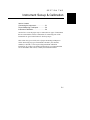
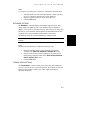
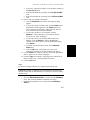
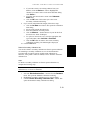
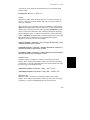
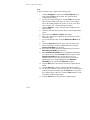
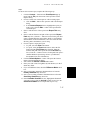
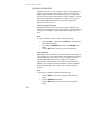
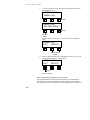
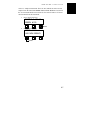
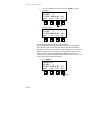
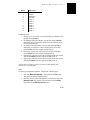
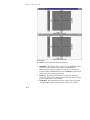
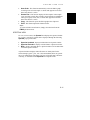
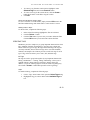
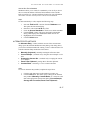
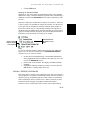
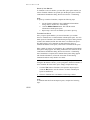
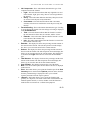
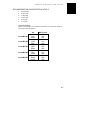
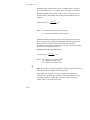
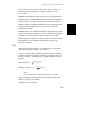
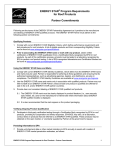
INSTALLING THE SECURITY KEY
A security key is provided with your system and must be installed in order
for the software to operate.
To install the security key:
1.
2.
Insert the security key into the parallel printer port on the back of your
computer and secure it with two screws.
A parallel printer can be plugged directly on the Security Key. NOTE:
If using a printer, the printer must be “on line” for the security key to
function properly.
LPT1 Printer Port
Security Key
Printer Cable
1-3
1
SECTION
ONE
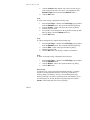
STARTING THE SOFTWARE
Before starting the software, you should take a moment to check your
display driver’s color settings. For optimal representation of on-screen
color simulations, your display driver should be set up for 256 resolution to
display 64K (65,536) colors.
To check your display driver settings:
1.
2.
3.
4.
Open the Windows 95 Control Panel folder.
Double-click the Display program icon in the Control Panel
directory. The Display Properties dialog box appears.
At the top of the Display Properties box, click the Settings tab.
The Settings layer of controls appears.
Check the Color Palette menu. It should be set to High Color (16
bit) or True Color (24 bit). If neither of these settings is available in
the pop-up menu, your display driver does not support these resolution
settings.
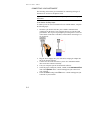
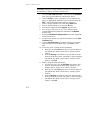
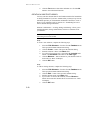
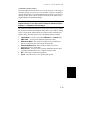
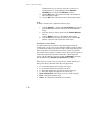
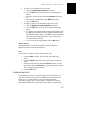
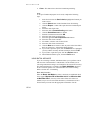
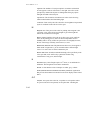
Once the software is installed on your computer, you can start it by doubleclicking the Program Icon located in the software’s directory.
Software Startup Icon
See Section Two—Instrument Set-up and Calibration for instructions on
how to connect your instrument.
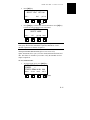
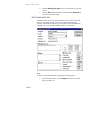
WHAT YOU’LL SEE FIRST
The first time you open the software, the software user interface Main
Window appears. This Main Window consists of the Menu Bar, the
Control Window, and the Desktop Area. Refer to Section Three—User
Interface for more information.
IMPORTANT NOTE: The software is designed with the familiarity of
standard Windows® environment. Basic functions and terminology of the
software and the User’s Manual follow these standards. For more
information about the basics of Windows, see the Windows tutorial in the
Windows help.
The Menu Bar
The Menu Bar holds the pull down menus items. Each pull down menu
item contains functions related to it. For example, the Edit pull down
1-4
G E T T I N G
S T A R T E D
menu contains functions used for editing such as the Copy… function and
the Paste... function.
The Control Window
The Control Window provides you with the current information, a way to
access different information, and ways to create, edit, or delete
information.
The Desktop Area
The Desktop Area is where you can view your data in various ways, as well
as viewing any associated information. Below is a list of available “views.”
•
•
•
•
•
•
•
•
•
•
•
•
•
Tolerance (L*a*b* or Trend)
FMC2
Spectral
Status Density…
Trend…
L*a*b* Data
Spectral Data
Status Density Data…
Formula
Notes and Tags
Visual Color
Verbal Color
Indices (General or Ink)
TUTORIAL
You should go through the QA-Master Interactive Tutorial that is provided
with this software. The tutorial can be accessed by clicking on the Help
menu, then clicking on Tutorial.
1-5
1
SECTION
1-6
ONE
CHAPTER 2 SECTION TWO
Instrument Set-up & Calibration
2
Section Contents
Connecting the Instrument .....................2-1
Proper Measuring Techniques................2-4
Instrument Calibration............................2-4
Section Two covers the proper way to connect the two types of instruments
that are used with the software. Instructions for connecting each of the
instruments are given in the format of “Six Easy Steps.”
This section also gives a brief series of proper measuring techniques to
follow when using any type of instrument to measure your substrate,
standard, or trial ink, as well as providing instrument calibration
instructions. If you have any further questions about your instrument that
are not included in this section, consult your instrument manual.
2-1
S E C T I O N
T W O
CONNECTING YOUR INSTRUMENT
The following sub-sections give instructions for connecting each type of
instrument: 0°/45° Series and Sphere Series.
Important Notice: Always turn your computer off before connecting any
instrument.
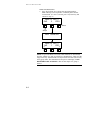
0°/45° Series: Six Easy Steps
To install your 0°/45° Series instrument for use with Ink-Master, complete
the following steps:
1.
Insert the 9 pin Serial Cable into your available communications
(COM) port on the back of your computer. Be sure to note the COM
port number. The 25 pin to 9 pin adapter provided (part no. 418-91-01
of the MA58-75 Interface Cable Kit) is needed when connecting to a 9
pin COM port.
2.
Plug the Power Supply into your wall outlet, and plug its adapter into
the 25 pin Serial Connector.
Connect one end of the flat cable to your 0°/45° instrument and the
other end to the Connector assembly.
Turn your computer system on and start the software.
Select the proper COM port (COM1, COM2) in the Instrument Port
item of the Options menu. A check mark appears just to the left of
your selection.
Select the 0°/45° setting in the File menu. A check mark appears just
to the left of your selection.
3.
4.
5.
6.
2-2
INSTRUMENT
SET-UP
&
CALIBRATION
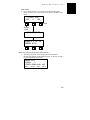
Sphere Series: Six Easy Steps
To install your Sphere Series instrument for use with Ink-Master, complete
the following steps:
1.
2.
3.
4.
5.
6.
Insert the 9 pin Serial Cable into your available communications
(COM) port on the back of your computer. Be sure to note the COM
port number. The 25 pin to 9 pin adapter provided (part no. 418-91-01
of the MA58-75 Interface Cable Kit) is needed when connecting to a 9
pin COM port.
Plug the Power Supply into your wall outlet, and plug its adapter into
the 25 pin Serial Connector.
Connect one end of the flat cable to your Sphere instrument and the
other end to the Connector assembly.
Turn your computer system on and start the software.
Select the proper COM port (COM1, COM2) in the Instrument Port
item of the Options menu. A check mark appears just to the left of
your selection.
Select the Spherical setting in the File menu. A check mark appears
just to the left of your selection.
2-3
2
S E C T I O N
T W O
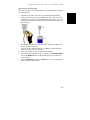
PROPER MEASURING TECHNIQUES
When using Ink-Master, proper measuring techniques are essential to
generate accurate ink formulations. An ink formula can only be as good as
the sample measurements that are taken. The following is a list of proper
measuring techniques.
•
•
•
•
•
Select a Good Measurement Area - Find a blemish-free area that
represents the color of the ink sample.
Instrument Alignment - While taking a measurement, keep the
instrument flat against the surface you are measuring.
Keep the Instrument Still - While the instrument is performing a
measurement, keep the instrument and the sample you are measuring
as still as possible.
Consult Your Instrument Manual - These basic instructions should
help you take precise measurements. For detailed instructions on the
use and maintenance of your instrument, be sure to read your
instrument manual.
Consistent Backing - When measuring substrates, standards, or trials,
ensure that the color of the surface behind the sample is consistent
with the substrate being measured. You can do this by placing layers
of the same substrate under the sample while measuring. This is
especially important when measuring thin substrates that allow light to
pass through. Any dark or bright colors behind the substrate can affect
the way your instrument measures the sample.
TIP: When measuring color on clear film, there is an error introduced
by the reflection off the backside of the film. This error can be reduced
by wetting (with distilled water) the area between the film and the
backing. This wetting allows most of the reflection to come off of the
backing rather than the backside of the film. Don’t wet the surface if
the film and backing are not waterproof.
INSTRUMENT CALIBRATION
Your instrument should be calibrated often to ensure measurement
accuracy. Calibrating your instrument is done in one of two manners: you
can either choose to calibrate the instrument or wait until the software
notifies you of the need for calibration. Refer to your instrument’s
operation manual for the appropriate calibration schedule.
2-4
INSTRUMENT
SET-UP
&
CALIBRATION
Choose to Calibrate
1.
2.
3.
4.
5.
6.
Select Calibrate… in the Instrument pull down menu. The
Calibration dialog appears.
If you need to change any of the calibration (Reflection Standard)
values, highlight the value and type in the new value.
Click the Calibrate button. Wait for the Calibration Instructions to
appear.
Position the target window of the instrument over the white spot on the
standard and take your white calibration readings. Be sure to let the
whole shoe of the instrument rest on the standard as you take your
reading. (The entire standard should be covered.)
For spherical instruments only, position the instrument’s target
window over the opening in the black trap and take a measurement.
When the calibration is finished, a “Calibration Complete” message
appears. Click on OK.
Prompted to Calibrate
1.
2.
3.
4.
5.
If you try to take a measurement and calibration is needed, an
“Instrument Needs Calibration” error message appears.
Click the OK button. Wait for the Calibration Instructions to appear.
Position the target window of the instrument over the white spot on the
standard and take your white calibration readings. Be sure to let the
whole shoe of the instrument rest on the standard as you take your
reading. (The entire standard should be covered.)
For spherical instruments only, position the instrument’s target
window over the opening in the black trap and take a measurement.
When the calibration is finished, a “Calibration Complete” message
appears. Click on OK.
NOTE: For 0°/45° instruments only! When a black calibration is
requested, take a reading in a dark room for your zero reflectance reading.
(In most cases, it is possible to take a zero reflectance reading under a desk
with no direct light.)
2-5
2
S E C T I O N
2-6
T W O
CHAPTER 3 SECTION THREE
User Interface
Section Contents
Main Screen ..........................................3-2
Menu Bar ...............................................3-2
Control Window .....................................3-3
Desktop Area .........................................3-5
Using Your Mouse..................................3-5
Using The Keyboard ..............................3-6
Getting Help...........................................3-7
3
Section Three describes the user interface of Ink-Master. It outlines the
various contents of the Ink-Master main screen as well as providing
information about using the mouse and the keyboard. Lastly, this section
explains how to access the Ink-Master Help text.
Even though Section Three gives descriptions of the Controls window
contents, it does not provide explanations for the use of these functions.
The remaining sections will help to provide explanation for all functions—
they will walk you through customizing the software and through the
processes of establishing and measuring data, formulating inks, managing
data, and viewing data.
NOTE: The screen captures in this manual show Ink-Master operating
with Windows® 95 (the recommended environment). If Ink-Master is used
with an older version of Windows®, some differences may exist.
3-1
S E C T I O N
T H R E E
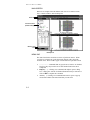
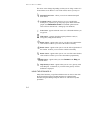
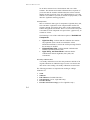
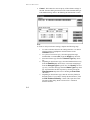
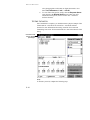
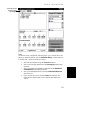
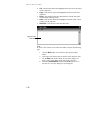
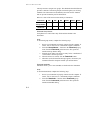
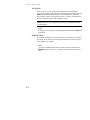
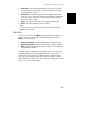
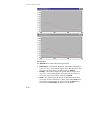
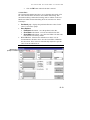
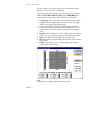
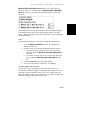
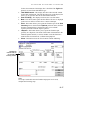
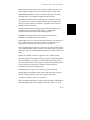
MAIN SCREEN
Below is an example of the Ink-Master main screen. It contains a menu
bar, a Controls window, and a desktop area.
Menu Bar
Controls window
(Default settings)
Measure Trial
“icon”
Desktop area
MENU BAR
The items listed in the menu bar are names of pull down menus. When
you click on a menu item, a pull down menu appears with a list of the
available items. There are three types of items found in a pull down menu.
•
•
•
3-2
Grayed Text - Commands that are grayed out are inactive or disabled.
However, they may become active after another function has been
completed.
Ellipsis (. . . ) - Clicking on a command with ellipsis opens a dialog
box. A dialog box will ask for further information and you will have to
click on OK to complete the command.
Arrow ( ) - Clicking on a command with an arrow opens a pop up
menu with available sub-menu items that you can select.
USER
INTERFACE
GUIDE
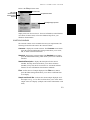
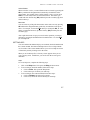
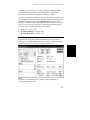
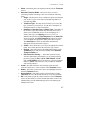
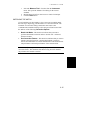
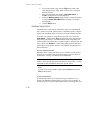
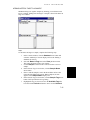
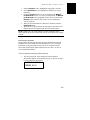
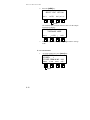
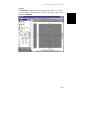
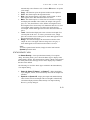
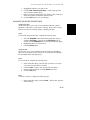
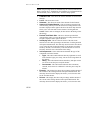
Below is the File pull down menu.
Menu bar item
The check
mark indicates
that this item is
selected.
File pull down menu
Print Report pop up menu
3
Simply click on an item to select it. For more information on the Windows
conventions for menu items, refer to the Windows Help file or your
Windows documentation.
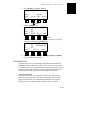
CONTROLS WINDOW
The Controls window can be customized to meet your requirements. The
following list describes the items in the Controls window.
Customer - displays the current customer. The Customer arrow button
opens the Customer Maintenance dialog which allows you to create,
edit, or delete customer information.
Standard - displays the current standard. The Standard arrow button
opens the Find Standard dialog which allows you to select a different
standard.
Standard Description - displays the description for the current
standard. This drop down menu allows you to choose alternate
standards (if any exist). Refer to Section Ten—Advanced Software
Features for more information about alternate standards.
Filter - defines the set of samples displayed. The Filter arrow button
opens the Filters dialog which allows you to choose a different filter
set to display.
Sample and Scroll Bar - indicates the current sample displayed out of
the sample set (e.g., 2 of 4). The scroll bar allows you to select which
sample of the set to display. (Samples can be either ink matches or ink
trials.)
3-3
S E C T I O N
T H R E E
Status - displays the status, PASS (in green text) or FAIL (in red text), of
the sample according to the standard’s set tolerances. The Status
arrow button displays the Status dialog which contains the tolerance
parameters and the sample status. (The Edit Tolerance Visually…
button opens the Visual Tolerance Editor dialog. Refer to Section
Ten—Advanced Software Features.)
Accept/Reject/Undetermined - These radio buttons indicate the
acceptability of the sample. You can either manually select the
acceptability of the sample, or you can let the software assign the
acceptability according to the sample’s pass or fail status.
Lot ID - displays the Lot Identification for the current standard and
sample. This field also allows you to create a new Lot ID or to edit a
Lot ID. The Lot ID arrow button displays the Find Lot ID dialog
which allows you to search for a specific Lot ID.
Sample Note - displays a single line “note” regarding the current sample
(if one exists). This field also allows you to create a new note or edit
the current note.
Sample Tag - displays a tag for the current sample. The Sample Tags
arrow button displays the Select Tags dialog which allows you to select
tags.
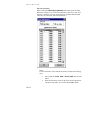
Illuminant/Observer - displays the illuminant/observer combination for
the current standard and sample data. The drop down menu also
allows you to select a different illuminant/observer. The following is a
list of available illuminants. (The 2° and 10° designations represent
the viewing angle—the observer.)
• A/2° and A/10° - incandescent light; color temperature: 2856K
• C/2° and C/10° - daylight (simulated overcast sky): 6774K
• D50/2° and D50/10° - natural daylight; color temperature: 5000K
• D65/2° and D65/10° - natural daylight; color temperature: 6500K
• F2/2° and F2/10° - cool white fluorescent illuminant
• F7/2° and F7/10° - daylight white fluorescent illuminant
• F11/2° and F11/10° - three narrow band white fluorescent
illuminant
• F12/2° and F12/10° - the Ultralume 3000 fluorescent illuminant
Specular - displays whether or not the current standard and sample data
is specular included or specular excluded. NOTE: This applies only to
3-4
USER
INTERFACE
GUIDE
data gathered by a sphere instrument. The drop down menu allows you
to choose either specular included (In) or specular excluded (Ex).
L*a*b* Data - displays the L*, a*, b*, C*, h°, DH, DE, and delta
difference values for the standard and sample.
DESKTOP AREA
When Ink-Master is first started, the L*a*b* views are displayed in the
Desktop. The Desktop area can vary depending on what views are selected
in the View menu, and what display options are set in Options menu.
The View menu allows you to select L*a*b*, FMC2, Spectral, Status
Density, Trend, L*a*b* Data, Spectral Data, Status Density Data, Visual
Color, Verbal Color, Formula, Indices, and Notes & Tags as well as other
views. Default display options can be set using the Display functions in
the Options menu. Refer to Section Four—Setting Up Your Software for
more information.
USING YOUR MOUSE 8
The mouse is used to move the cursor on the screen. If you are unfamiliar
with mouse operation, refer to the Windows Tutorial.
Using the mouse involves several techniques:
•
•
•
•
Pointing - Moves the mouse so the tip of the cursor is over an object
on the screen.
Clicking - Means to quickly press and release the (right) mouse
button. This is a common way of selecting objects in a window.
Dragging - To press and hold the (right) mouse button while you
move the mouse. Use dragging when you move or change the size of a
window.
Double Clicking - To quickly press and release the (right) mouse
button twice. Use double clicking to open file names and restore
minimized icons.
3-5
3
S E C T I O N
T H R E E
The mouse cursor changes depending on what you are doing or where it is
located on the screen. Below is a list of the various cursors you may see.
Selection Tool Cursor - allows you to select commands and pull
down menus.
Crosshair Cursor - appears when you are over a graph in the
desktop area. It allows you to easily target spots on the reflectance
graphs. (The Reflectance Track View Default option must be
active. Refer to Section Four—Setting Up Your Software.)
Text Cursor - appears when the cursor is in a field which allows you
to type text.
Wait Cursor - appears when the program performs a task (ex.,
saving files, taking measurements).
Resize Cursor - appears when you are over the top or bottom border
of the window. It allows you to resize the window vertically.
Resize Cursor - appears when you are over the left or right border of
the window. It allows you to resize the window horizontally.
Resize Cursor - appears when you are over one of the corner borders
of the window. It allows you to resize the window proportionally.
Help Cursor - appears when you select Context in the Help pull
down menu.
Help Glossary Cursor - appears when you are over a glossary word
in the Help file. At that time, if you click on the glossary word its
definition is displayed.
USING THE KEYBOARD 7
Many of the functions you perform with the mouse can also be done with
the keyboard. Most of the keyboard functions are explained in the
Window's Program Manager Help file. Below are some basic keyboard
procedures.
3-6
USER
INTERFACE
GUIDE
Active Window
When a window is active, a control function can be selected by pressing the
Alt key and then the designated letter (marked by an underline) in the
control name. For example, if the Control window is active you can press
Alt+t to view the status of the selected measurement. This means you
would hold down the first key (Alt) and then press the second key (t), then
release both keys.
Menu Item
You can select any of the pull down menus on the main screen by pressing
Alt and then the designated letter (marked by an underline) in the menu
name. For example, to select the File menu you would press Alt , F. This
means you would momentarily press the first key (Alt) and then press the
second key (F).
After a pull down menu is open you can select the operation you want to
perform by pressing the underlined letter in that function. To select Exit
you would press x.
GETTING HELP
You can reach the Ink-Master Help by two methods, the Index method and
the Context method. The Index method provides access to Help with the
use of an index. The Context method allows you to access Help for an item
or function by directly clicking on it in the menu.
When you are in the help file, a Glossary Cursor appears when you are
over a glossary word. At that time, you can click on the word to get its
definition.
Steps:
To access Help text, complete the following steps.
1.
2.
3.
Click on the Help Menu. This opens the Help pull down menu.
To access help by the Index method, follow these steps.
• Click on Index. This opens the Help Index.
• Click on the topic for which you want help.
To access help by the Context method, follow these steps.
• Click on Context. The help cursor appears.
• Click on any menu bar item for which you want help.
3-7
3
S E C T I O N
3-8
T H R E E
CHAPTER 4 SECTION FOUR
Setting Up Your Software
Section Contents
Administrative Options...........................4-2
Database Options ..................................4-3
Formulation Options ..............................4-3
Units of Measure Options.......................4-6
Display Options......................................4-7
Instrument Port ......................................4-10
Instrument Mode....................................4-10
Auto Inventory .......................................4-11
Section Four discusses the functions that allow you to customize the way
your software runs. All of these functions are found in the Options menu:
Administrative, Database, Formulation, Units of Measure, Display,
Instrument Port, Instrument Mode, and Auto Inventory.
Ideally, you should select your software set-up options before doing
anything in Ink-Master. Changing two Units of Measure options,
Monetary units and Film Thickness units, after data is established,
causes the data dependent upon those units to become incorrect. See the
Units of Measure sub-section for more information.
4-1
4
SECTION
FOUR
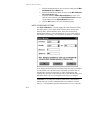
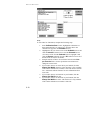
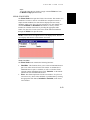
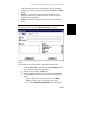
ADMINISTRATIVE OPTIONS
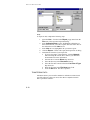
The Administrative… function displays the Access Levels dialog which
allows you to determine access privileges to certain software functions. A
password is required to reach the Access Levels dialog. A generic password
is originally assigned to this function, PASSWORD. When you first open
the Administrative function this generic password must be used.
Steps:
To open the Access Level dialog, complete the following steps.
1.
2.
3.
Select the Administrative… function from the Options menu.
The Administrative Access dialog is displayed.
Enter the password in the Password field.
Click the OK button. This opens the Access Levels dialog.
Once in the Access Levels dialog you may assign your own password.
Steps:
To change the password for the Administrative… function, complete the
following steps.
1.
2.
3.
4.
5.
Click the Change Password… button. This opens the Change
Password dialog.
Enter the old password in the Old Password field.
Enter the new password in the New Password field.
Enter the new password again in the Verify New Password
field.
Click the OK button. Your new password is assigned.
Access privileges are assigned by checking the check box next to the
function. Below is a list of the functions affected by access levels.
•
•
•
•
•
•
•
•
4-2
Edit Calibration Sets/Inks
Edit Standards
Sample/Set Deletion
Edit Customer
Edit Supplier
Edit Formulation Options
Transfer In/Restore Database
Instrument Calibration
S E T T I N G
U P
Y O U R
S O F T W A R E
Steps:
To assign access privileges to a function(s), complete the following steps.
1.
2.
3.
Select the check box to the left of the function to which you want
access. A “checked” check box has a check mark in it.
Repeat for all the functions to which you want access.
Click the OK button.
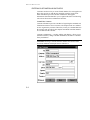
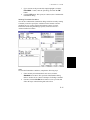
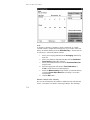
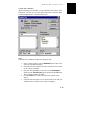
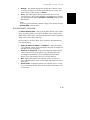
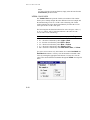
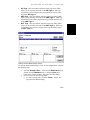
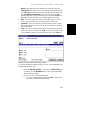
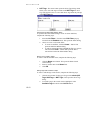
DATABASE OPTIONS
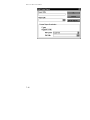
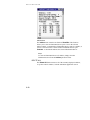
The Database… function displays the Database Options dialog. This
dialog displays the paths for your 0°/45° database and your Spherical
database. These paths are informational only and should not be changed. It
also allows you to determine Search Options: the maximum Delta E value
of samples for a typical standard, and the Delta E value used to
automatically select the closest match during a standard search.
NOTE: By default, this option is disabled by the Administrative Access
Security.
4
Steps:
To define the Search Options, complete the following steps.
1.
2.
3.
Enter the maximum Delta E value of samples for a typical
standard in the Find new standard if sample DE > field.
Enter the Delta E value used to automatically select the closest
match during a standard search in the Auto accept standard
search result if DE < field.
Click the OK button.
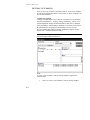
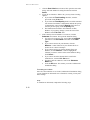
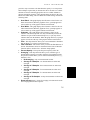
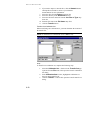
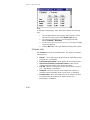
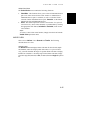
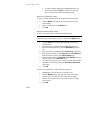
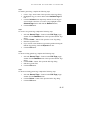
FORMULATION OPTIONS
The Formulation… function allows you to specialize your formulation
process. If you do not have a specialized process, these options are best left
at their original settings. Contact your X-Rite Application Support
Specialist if required.
4-3
SECTION
FOUR
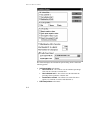
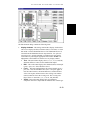
This function displays the Formulation Options dialog which contains the
following options:
•
•
4-4
Ink Interpolation radio buttons:
• Use Total Ink % - The software uses the combined percentages
of the inks in a formula to calculate data.
• Use Individual Ink % - The software uses the individual ink
percentage from a formula to calculate data.
• Combination of Both - The software uses both of the above
options, Use Total Ink % and Use Individual Ink %.
K/S Extrapolation radio buttons:
S E T T I N G
U P
Y O U R
S O F T W A R E
•
•
•
•
•
•
Flat - All concentrations above the highest calibration sample
have equivalent K/S values.
• Linear - The K/S data is generated by drawing a line from zero
through the last calibration point.
• Auto - An automated method is used to generate the data beyond
the last calibration point.
K/S Reporting radio buttons:
• Report negative values - All negative K/S, K, and S values
generated during recalculation of inks are reported.
• Don’t report negative values - negative K/S, K, and S values
are not reported.
• Set negative values to zero - negative K/S, K, and S values
are automatically reset to zero.
Allow Negative Add in Correction - When checked, this check
box allows negative values to display for ink correction adds (if the
substrate add is above zero).
Max Allowable DE for a Match - This allows you to assign the
Delta E that must be met for a formula combination to be displayed
during formulation.
Max Iterations for Convergence - This allows you to assign the
maximum number of iterations the software performs when attempting
to formulate to zero Delta E. A smaller number generates less accurate
formulas, however, formulation speed increases.
Enable Report Export - When checked, this check box allows you
to export a formula report. The following information also must be
completed.
• Save Export File As - This is where you enter the filename for
the export file. The … button allows you to assign a path and
name in a standard Windows Save As dialog.
• Export Button Text - This is where you enter the text you want
to be displayed on the button that exports the report.
Steps:
To define the Formulation Options, complete the following steps.
1.
2.
3.
4.
Select the desired Ink Interpolation radio button.
Select the desired K/S Extrapolation radio button.
Select the desired K/S Reporting radio button.
If desired, check the Allow Negative Add in Correction check
box.
4-5
4
SECTION
FOUR
5.
6.
7.
8.
Enter the maximum Delta E value to meet for a match in the Max
Allowable DE for a Match field.
Enter the maximum formulation iterations in the Max Iterations
for Convergence field.
If desired, check the Enable Report Export check box, and
enter the export filename in the Save Export File As field and
export button text in the Export Button Text field.
Click the OK button to save your formulation options.
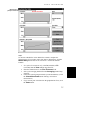
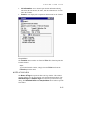
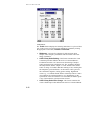
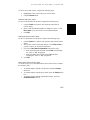
UNITS OF MEASURE OPTIONS
The Units of Measure… function displays the Units of Measure dialog.
This dialog allows you to assign default inventory units, density units,
monetary units, and film thickness units. These units are then used
throughout the software. Since Ink-Master allows you to select different
units within various dialogs, you can perform “on-the-spot” conversions.
If you change the inventory units and density units after data is established
in your database, all of the data (values) dependent upon these units are
automatically converted to reflect the new units. Unfortunately, this
condition does not apply to the monetary units or film thickness units since
Ink-Master has no way of converting these units if they are changed.
CAUTION: If you change the monetary default units or film thickness
default units after you have established data in your database, all of the
data (e.g., Cost) dependent upon these units becomes incorrect. The units
4-6
S E T T I N G
U P
Y O U R
S O F T W A R E
change, but the value does not. The data or values dependent upon these
units then need to be re-entered and/or recalculated.
Steps:
To define your units of measure, complete the following steps.
1.
2.
3.
4.
5.
6.
Select the Units of Measure… function from the Options
menu. This opens the Units of Measure dialog.
Select the desired inventory unit of measurement from the
Inventory drop down list.
Select the desired density unit of measurement from the Density
drop down list and the per drop down list.
Enter the desired monetary unit of measurement in the Monetary
field.
Enter the desired film thickness unit of measurement in the
Thickness field.
Click the OK button to set your units of measurement.
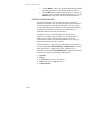
DISPLAY OPTIONS
4
The Display pop up menu contains functions that allow you to control
your software display. Each Display function is described below.
Auto Arrange
When the Auto Arrange function is checked, the software automatically
arranges all open windows to fill the screen, even when you move or resize
windows. When un-checked, any window arrangement or sizing you do is
unaffected.
Steps:
To activate the Auto Arrange function, simply select it from the
Display pop up menu.
Auto L*a*b*
When the Auto L*a*b* function is checked, the software automatically
displays all preset tolerances for the current standard in L*a*b* graphs.
Steps:
To activate the Auto L*a*b* function, simply select it from the Display
pop up menu.
4-7
SECTION
FOUR
Auto Trend
When the Auto Trend function is checked, the software automatically
displays all preset tolerances for the current standard in trend graphs.
Steps:
To activate the Auto Trend function, simply select it from the Display
pop up menu.
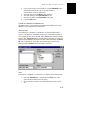
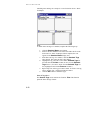
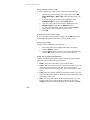
User Defined Controls
When the User Defined Controls… function is selected, the Controls
Window Configuration dialog is displayed. This dialog allows you to select
which control items you want to display in the Controls window. The
control items can then be arranged in any order, or the items can be
arranged automatically by checking the Smart Layout check box. The
Default button returns the items to the default selection and order:
Customer and Standard, Set Filter, Pass/Fail Status, Sample Selector,
and L*a*b* Data.
The following is a list of the control items available:
•
•
•
•
•
•
•
•
•
Customer and Standard
Standard Description
Set Filter
Sample Selector
Pass/Fail Status
Accept/Reject Status
Lot ID
Sample Notes/Tags
L*a*b* Data
NOTE: All nine Controls window items can be selected for display;
however, the last items extend off the screen when in 800 x 600 display
mode. 1024 x 768 display mode must be used if all items are to be
displayed.
Steps:
To customize the Controls window, complete the following steps.
1.
4-8
Select the User Defined Controls… function from the
Display pop up menu. This opens the Controls Window
Configuration dialog.
S E T T I N G
2.
3.
4.
U P
Y O U R
S O F T W A R E
Highlight a Control window item that you want to display in the
Available list box, and click the >> button to move the item to
the Selected list box. (Do the reverse if you want to remove an
item from the Selected list box; highlight the item in the
Selected list box and click the << button.) Repeat this step for
each Controls window item you want to display in the Controls
window.
Check the Smart Layout button if you want your items
automatically arranged, or click the Up or Down button to move
a highlighted item up or down in the Selected list (repeat until
items are arranged in desired order).
Click the OK button.
View Defaults
When the View Defaults… function is selected, the View Defaults dialog
is displayed. This dialog allows you to customize certain parameters in the
L*a*b*, Reflectance, or Trend windows. The default settings affect all of
the L*a*b*, Reflectance, or Trend windows that are currently displayed.
Any view option that is selected remains selected even after exiting the
software.
The following is a list of the available defaults:
•
•
•
•
•
•
L*a*b* Graph Scatter - All samples (trials and matches) in the
sample set are displayed in the L*a*b* graph. The current sample is
highlighted in green (pass) or red (fail).
L*a*b* Graph Auto Scale - The L*a*b* graph is automatically
scaled to best display the current sample’s measurement.
Reflectance Grid - A grid is displayed in the Reflectance graph.
Reflectance Mark - When checked, clicking on a wavelength (must
be a 10 nm interval) places a vertical line at the selected wavelength
and displays the Delta E for that wavelength. The standard is white
and the sample is either green (pass) or red (fail).
Reflectance Track - This is used to view the exact location of every
point on the spectral curve. Position the cross hair cursor with the
mouse to any point along the curve. The reflectance value and
wavelength will be displayed in the upper left-hand portion of the
Reflectance window.
Reflectance Range - This shows the measurement variation of the
sample set reflectance curves. The upper and lower range curves are
gray.
4-9
4
SECTION
FOUR
•
•
•
Trend Control Limits - Upper and lower control limits (tolerances)
are displayed in the Trend graph. These are displayed only when the
tolerance exists for the selected method and illuminant/observer.
Trend Grid - A grid is displayed in the Trend graphs.
Trend Viewport - This value sets the number of samples that are
displayed at one time.
Steps:
To set your view defaults, complete the following steps.
1.
2.
3.
4.
Select the View Defaults… function from the Display pop up
menu. This opens the View Defaults dialog.
Check all the defaults that you want active.
Enter the number of samples you want displayed in the Trend
Viewport field.
Click the OK button to set your view defaults.
INSTRUMENT PORT
The Instrument Port pop up menu allows you to select the serial Com
port (1 or 2) that your instrument uses.
Steps:
To select your instrument port, simply select either COM1 or COM2 from
the Instrument Port pop up menu. (A check mark indicates which port is
selected.)
INSTRUMENT MODE
The Instrument Mode pop up menu allows you to determine the mode of
your instrument. There are three instrument modes:
•
•
•
4-10
Normal - This mode allows normal X-Rite instrument measurement
procedures.
Closed Shoe Read - This mode enables you to take measurements
with the instrument’s shoe opened or closed. Once activated,
measurements are initiated by clicking a Close Shoe Read button.
Macbeth - This mode is used for Macbeth® sphere instruments. This
mode is not available when 0°/45° is selected in the File pull down
menu.
S E T T I N G
U P
Y O U R
S O F T W A R E
Steps:
To select your instrument mode, simply select Normal, Closed Shoe
Read, or Macbeth from the Instrument Mode pop up menu. (A check
mark indicates which mode is selected.)
4
4-11
SECTION
FOUR
AUTO INVENTORY
The Auto Inventory function automatically displays the Edit Inventory
Amount dialog when a Batch Add Formula report is printed. This dialog
allows you to view and edit original ink inventories for the generated
formula before the report is actually sent to the printer.
The Edit Inventory Amount dialog lists the ink names and corresponding
inventory amounts in the units selected from the units drop down list. The
OK button saves all inventory changes.
Steps:
To display the Edit Inventory Amount dialog automatically, simply check
the Auto Inventory item in the Options pull down menu. (A check
mark indicates that the item is selected.)
4-12
CHAPTER 5 SECTION FIVE
Establishing Your Database
Section Contents
Entering Customers and Suppliers .........5-2
Setting Up a Calibration Set...................5-5
Entering Calibration Inks ........................5-10
Creating a Secondary Calibration Set ....5-17
Creating a Substrate Library ..................5-20
Section Five discusses how to establish data in your database so that you
can organize your data and perform formulation matches.
You first need to determine who your formulations are for and who the raw
materials are from—enter your customers and suppliers. Then you can setup calibration sets and enter the raw material information—calibration
inks. If desired, Ink-Master allows you to create a secondary calibration set
from an established calibration set. You may even enter all your known
substrates to create a substrate library.
5
5-1
SECTION
FIVE
ENTERING CUSTOMERS AND SUPPLIERS
Customers are those who you create formula matches for, and suppliers are
those who provide you with the raw materials needed to create an ink
match. Ink-Master provides customer maintenance and supplier
maintenance functions that allow you to organize this data. The following
sub-sections discuss these maintenance functions.
Create/Edit a Customer
Customer information provides a method of organizing the standards and
formulation tolerances from a customer. All samples based on a standard
are also organized by customer. Therefore, not only is a standard linked to
the customer who provided it, the samples formulated from that standard
are also linked to the customer.
Customer “maintenance”—creating, editing, and deleting—allows you to
establish customers, change customer information, and remove customers
from your database.
CAUTION: Deleting a customer from the database also deletes all the
associated standards and samples that are linked to it.
5-2
ESTABLISHING
YOUR
DATABASE
Steps:
To create a new customer, complete the following steps.
1.
2.
3.
4.
5.
6.
7.
8.
Select the Edit Customers… function from the Database
menu. This opens the Customer Maintenance dialog.
Click the Create… button. This opens the Create Customer
dialog.
Enter the customer’s ID in the ID field.
Enter the company name in the Company field.
If desired, enter information about the customer in the remaining
fields.
If you want to create a note for the customer, click the Note…
button to enter any notes in the Note Editor. Refer to Section
Seven—Basic Techniques.
If you want to create another new customer without closing the
Create Customer dialog, check the Repeat check box.
Click the OK button.
Steps:
To edit an existing customer, complete the following steps.
1.
2.
3.
4.
5.
Select the Edit Customers… function from the Database
menu. This opens the Customer Maintenance dialog.
Click the Edit… button. This opens the Edit Customer dialog.
You can not change the supplier’s ID.
Edit any of the information about the supplier in the remaining
fields.
If you want to edit the note, click the Note… button to edit the
notes in the Note Editor. Refer to Section Seven—Basic
Techniques.
Click the OK button.
Steps:
To delete an existing customer, complete the following steps.
CAUTION: Deleting a customer from the database also deletes all the
associated standards and samples that are linked to it.
1.
Select the Edit Customers… function from the Database
menu. This opens the Customer Maintenance dialog.
5-3
5
SECTION
FIVE
2.
3.
4.
Click the Delete… button. This opens the Delete Customer
dialog.
Click the OK button. A warning dialog appears.
Click the Yes button to delete the customer and all the
information linked to it. Click the No button if you do not want to
delete the customer.
Create/Edit a Supplier
Supplier information provides a method of organizing inks under the
supplying vendor. Therefore, all inks are linked to their supplier. Supplier
“maintenance”—creating, editing, and deleting—allows you to establish
suppliers, change supplier information, and remove suppliers from your
database.
CAUTION: Deleting a supplier from the database also deletes all the ink
information that is linked to it.
Steps:
To create a new supplier, complete the following steps.
1.
2.
3.
4.
5.
6.
7.
8.
Select the Edit Suppliers… function from the Database menu.
This opens the Supplier Maintenance dialog.
Click the Create… button. This opens the Add Supplier dialog.
Enter the supplier’s ID in the ID field.
Enter the company name in the Company field.
If desired, enter information about the supplier in the remaining
fields.
If you want to enter a note, click the Note… button to enter any
notes in the Note Editor. Refer to Section Seven—Basic
Techniques.
If you want to create another new supplier without closing the
Add Supplier dialog, check the Repeat check box.
Click the OK button.
Steps:
To edit an existing supplier, complete the following steps.
1.
2.
5-4
Select the Edit Suppliers… function from the Database menu.
This opens the Supplier Maintenance dialog.
Click the Edit… button. This opens the Change Supplier dialog.
You can not change the supplier’s ID.
ESTABLISHING
3.
4.
5.
YOUR
DATABASE
Edit any of the information about the supplier in the remaining
fields.
If you want to edit the note, click the Note… button to enter any
notes in the Note Editor. Refer to Section Seven—Basic
Techniques.
Click the OK button.
Steps:
To delete an existing supplier, complete the following steps.
CAUTION: Deleting a supplier from the database also deletes all the ink
information that is linked to it.
1.
2.
3.
4.
Select the Edit Suppliers… function from the Database menu.
This opens the Supplier Maintenance dialog.
Click the Delete… button. This opens the Delete Supplier dialog.
Click the OK button. A warning dialog appears.
Click the Yes button to delete the supplier and all the information
linked to it. Click the No button if you do not want to delete the
supplier.
SETTING UP A CALIBRATION SET
A calibration set provides a means of organizing the inks that make up
your database. These are the inks that are used when formulating a match.
Calibration set parameters include the supplier, calibration method,
calibration set types, substrate, k1 and k2 values, solvent and extender
information, formula units, notes, and tags. All of these parameters define
a calibration set. All the inks measured into the database for a calibration
set then share these parameters. Refer to Appendix A—Sample Preparation
Guide for information on the samples required.
Single Constant & Multi-Flux Calibration Methods
The Single Constant method is used for measuring the absorption
property of an ink. It requires only that each calibration level of an ink
be measured once (on the desired substrate). This method works well
when calibrating transparent inks if you do not plan to use an opaque
white ink in your mixtures.
The Multi-Flux method is used for measuring the absorption and
scattering properties of an ink. It requires that each calibration level
5-5
5
SECTION
FIVE
for an ink be measured over a black substrate and over a white
substrate. The substrate and extender calibration data is required. (If
you do not enter the extender calibration data, the software assumes
that the extender is perfectly clear—the calibration data is zero.) This
method is used whenever your ink set contains an opaque white, or the
inks have significant scattering properties.
Ink Components
Inks are available in three types of components: Light Ink, Heavy Ink,
and Concentrate. Light Ink is an ink component that contains ink
pigment, extender, and solvent. Heavy Ink is an ink component that
contains ink pigment and extender. There is no solvent in a Heavy Ink.
Concentrate is an ink component in its purest form—pigment only, no
extender or solvent.
The following is a list of three radio button options of Available Ink
Components.
•
•
•
Light Inks Only - indicates that the Calibration Set contains
only Light Inks. Since solvent is not added, the solvent
information and fields (as well as the solvent percentage field for
the extender) are disabled.
Light and Heavy Inks - indicates that the Calibration Set
includes Light Inks and Heavy Inks.
Light, Heavy, and Concentrate - indicates that the
Calibration Set includes Light Inks, Heavy Inks, and
Concentrates.
Secondary Calibration Sets
A secondary calibration set uses the same parameters and inks of an
original calibration set without having to recreate or re-measure the
inks. Refer to the Creating a Secondary Calibration Set sub-section.
The following parameters are required when creating or editing a
calibration set.
•
•
•
•
•
•
5-6
Name
Substrate
Film Thickness (for Multi-Flux inks)
Solvent Density (not for “Light Inks Only”)
Extender Density
Extender Solvent Percentage (not for “Light Inks Only”)
ESTABLISHING
YOUR
DATABASE
Calibration set “maintenance”—creating, editing, and deleting—allows
you to establish the parameters for the calibration set, change these
parameters, and remove the calibration set from your database.
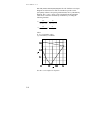
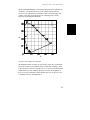
It is not recommended to edit the k1 value (Fresnel reflection coefficient for
incident light) and k2 value (Fresnel reflection coefficient of diffused light
striking the surface from the inside). IMPORTANT! If the inks that
belong to a calibration set are recalculated, and any reflectance value falls
below k1, you can choose to have the k1 value automatically adjusted to a
safe value. The k1 and k2 default values are as follows:
•
•
•
0°/45°: k1=0.00; k2=0.60
Specular Included: k1=0.04; k2=0.60
Specular Excluded: k1=0.00; k2=0.60
CAUTION: Editing an existing calibration set affects all of the inks for
the calibration set and the secondary calibration set (if any). Deleting a
calibration set from the database deletes the substrate, all the inks for that
calibration set, and any associated secondary calibration sets.
5
Steps:
To create a new calibration set or to edit an existing calibration set,
complete the following steps.
5-7
SECTION
FIVE
CAUTION: Editing an existing calibration set affects all of the inks for
the calibration set and any secondary calibration sets.
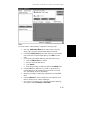
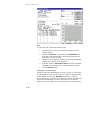
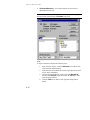
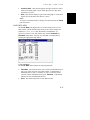
Select the Edit Calibration Set… function from the Database
menu. This opens the Maintain Calibration Set dialog.
2. Click the Create… button (opening the Create Calibration Set
dialog), or highlight the calibration set to be edited and click the
Edit… button (opening the Edit Calibration Set dialog).
3. Enter or edit the calibration set’s name in the Name field.
4. Enter or edit the calibration set’s ID in the ID field.
5. Select the ink supplier from the Supplier drop down list.
6. For creating a calibration set only, select either the Single
Constant method or the Multi-Flux method from the Method
drop down list.
7. Select the Available Ink Components radio button appropriate
for the calibration set.
8. For Multi-Flux method only, enter the film thickness in the Film
Thickness field.
9. Click the Formula Units arrow button and select your formula
units in the Select Formula Mode dialog. Click OK to set the
units.
10. If necessary, enter or edit the Solvent information:
• Enter the cost in the Cost field. The cost is always displayed
with default units. Refer to Section Four—Setting Up Your
Software.
• Click the Density arrow button. Choose the units and enter
the mass and the unit volume. The density is always displayed
with default units. Refer to Section Four—Setting Up Your
Software. Click OK.
11. Enter or edit the Extender information:
• For Multi-Flux only, click the Cal Data arrow button. This
opens the Over Black/Over White dialog. Measure in your
extender. Refer to Section Seven—Basic Techniques.
• Enter the cost in the Cost field. The cost is always displayed
with default units. Refer to Section Four—Setting Up Your
Software.
• Click the Density arrow button. Choose the units and enter
the mass and the unit volume. The density is always displayed
with default units. Refer to Section Four—Setting Up Your
Software. Click OK.
1.
5-8
ESTABLISHING
YOUR
DATABASE
•
12.
13.
14.
15.
If necessary, enter the percentage of solvent in the extender in
the Solvent (%) field.
• Enter the minimum ink percentage in the Ink Percent Min
field.
• Enter the maximum ink percentage in the Ink Percent Max
field.
Enter or edit your substrate information:
• Click the Substrate arrow button. The Substrate dialog
appears.
• If you want to paste in substrate data, click the Paste button.
(Data must be in the clipboard for the Paste button to be
active.) Refer to Section Eight—Managing Your Data for
more information about the paste function.
• If you want to measure in your substrate, click the
Measure… button. Measure in your substrate. Refer to
Section Seven—Basic Techniques.
• If you want to retrieve an existing substrate from your
database, click the Retrieve… button. Highlight the
substrate you want to retrieve in the Select Substrate dialog.
Click Select….
• If needed, enter the substrate’s name in the Substrate
Name field.
• Click the OK button. This returns you to the Create
Calibration Set dialog or the Edit Calibration Set dialog.
Click the Note arrow button to enter any notes in the Note Editor.
Refer to Section Seven—Basic Techniques.
Click the Tags arrow button to assign tags to the calibration set.
Refer to Section Ten—Advanced Software Features.
Click the OK button.
Steps:
To delete an existing calibration set, complete the following steps.
CAUTION: Deleting a calibration set from the database also deletes the
substrate, all the inks for that calibration set, and any associated secondary
calibration sets.
1.
2.
Select the Edit Calibration Set… function from the Database
menu. This opens the Maintain Calibration Sets dialog.
Highlight the calibration set to be deleted in the Calibration
Sets list.
5-9
5
SECTION
FIVE
3.
4.
Click the Delete… button. This opens the Delete Substrate dialog
which lists the substrate(s) and inks that will also be deleted.
Click the OK button to delete the calibration set, it’s substrate, all
of its inks, and any associated secondary calibration sets. Click the
Cancel button if you do not want to delete the calibration set.
ENTERING CALIBRATION INKS
Now that the calibration set is established, inks can be entered and
organized in the database. The inks calibrated and entered in the database
are used by Ink-Master to formulate color matches as well as providing
cost and availability during formulation. An ink is entered and calibrated
by linking it to a calibration set. Therefore, any changes made to a
calibration set directly affects the inks linked to it.
Ink calibration involves careful preparation and measurement of
calibration level samples. Refer to Appendix A—Sample Preparation
Guide for how to prepare calibration level samples. Once the ink
calibration data is entered, associated ink information: cost, notes, tags,
and inventory amounts, also may be entered.
If the inks belong to a “Light Inks Only” calibration set, no concentrate or
solvent is added and the Concentrate (%) and Solvent (%) are disabled.
If the inks belong to a “Light and Heavy Inks” calibration set, no
concentrate is added and the Concentrate (%) is disabled. The following
parameters are required when creating or editing an ink.
•
•
•
•
•
5-10
Ink Name
Density
Concentrate (%) (only for “Concentrate”)
Solvent (%) (not for “Light Inks Only”)
Calibration Data
ESTABLISHING
YOUR
DATABASE
Steps:
5
To create information for a new ink or to edit an existing ink’s
information, complete the following steps.
1.
2.
3.
4.
5.
6.
7.
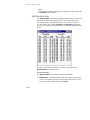
Select the Edit Ink… function from the Database menu. This
opens the Maintain Inks dialog.
Choose to create a new ink or edit an existing ink:
• To create a new ink, click the Create… button. This opens
the Create Ink dialog.
• To edit an existing ink, highlight the calibration set that
contains the ink to be edited in the Calibration Sets list.
Highlight the ink to be edited in the Inks list. Click the
Edit… button. This opens the Edit Ink dialog.
Enter or edit the ink name in the Ink Name field.
Enter or edit the ink ID in the Ink ID field.
Select the ink supplier from the Supplier drop down list.
Select the ink type from the Ink Type drop down list.
To enter or edit the Density information, follow these steps.
5-11
SECTION
FIVE
•
•
8.
9.
10.
11.
12.
13.
14.
15.
16.
17.
18.
Click the Density arrow button.
Select the units and enter the mass and the unit volume. The
density is always displayed in the default units. Refer to
Section Four—Setting Up Your Software. Click OK.
Enter or edit the cost in the Cost field. The cost is always
displayed with default units. Refer to Section Four—Setting Up
Your Software.
Enter or edit the inventory information in the Inventory field.
The inventory is always displayed in the default units. Refer to
Section Four—Setting Up Your Software.
Enter or edit the minimum ink concentration in the Min
Concentration (%) field.
Enter or edit the maximum ink concentration in the Max
Concentration (%) field.
Enter or edit the calibration set’s substrate strength in the
Strength field.
If necessary, enter or edit the percentage of concentrate in the ink
in the Concentrate (%) field.
If necessary, enter or edit the percentage of solvent in the ink in
the Solvent (%) field.
Click the Note arrow button to enter any notes in the Note Editor.
Refer to Section Seven—Basic Techniques.
Click the Tags arrow button to assign tags to the calibration set.
Refer to Section Ten—Advanced Software Features.
Click the Calibration Data arrow button and enter or edit the
ink’s calibration data. Refer to the Calibration Data sub-section.
Click the OK button.
Steps:
To delete an existing ink, complete the following steps.
1.
2.
3.
4.
5.
5-12
Select the Edit Ink… function from the Database menu. The
Maintain Inks dialog appears.
Highlight the calibration set that contains the ink to be deleted in
the Calibration Sets list.
Highlight the ink to be deleted in the Inks list.
Click the Delete… button. The Delete Ink dialog appears listing
the ink that will be deleted.
Click the OK button to delete the ink. Click the Cancel button if
you do not want to delete the ink.
ESTABLISHING
YOUR
DATABASE
Calibration Data
Once the ink’s information is entered and correct, you can then measure in
the ink’s calibration data—the calibration level samples. Also, Ink-Master
allows you to edit and delete the calibration data.
The calibration data dialog allows you to view an ink’s calibration data on
a graph. The graph selection varies upon which method you are calibrating
with, Single Constant or Multi-Flux. Below lists the different types of
graphs available for each method.
Single Constant Graph Selection:
•
•
•
Reflectance vs. Wavelength - plots the Reflectance values for
each 10 Nanometer wavelength between 400 nm and 700 nm. Check
the View Substrate check box to include it in the graph. Check the
Zoom In check box to zoom in on the graph. (Un-check it to zoom
out.)
Density vs. Wavelength - plots the Density values for each 10
Nanometer wavelength between 400 nm and 700 nm. Check the View
Substrate check box to include it in the graph. Check the Zoom In
check box to zoom in on the graph. (Un-check it to zoom out.)
Density vs. Concentration - plots the Density values against the
concentration % weight for a wavelength. Check the Auto WL check
box to let the software automatically select the wavelength with the
maximum absorption. Otherwise, use the Wavelength up and down
arrow buttons to select the wavelength to display in the graph. Check
the Zoom In check box to zoom in on the graph. (Un-check it to
zoom out.) Use the Smoothing up and down arrow buttons to adjust
the smoothness of the curve.
Multi-Flux Graph Selection:
•
•
•
•
•
Reflectance Over White - plots the “over white” Reflectance values
for each 10 nm wavelength between 400 nm and 700 nm. Check the
View Substrate check box to include it in the graph.
Reflectance Over Black - plots the “over black” Reflectance values
for each 10 nm wavelength between 400 nm and 700 nm.
Density Over White - plots the “over white” Density values for each
10 nm wavelength between 400 nm and 700 nm. Check the View
Substrate check box to include it in the graph.
Density Over Black - plots the “over black” Density values for each
10 nm wavelength between 400 nm and 700 nm.
K vs. Wavelength - plots the K (absorption coefficient) values
against wavelength between 400 nm and 700 nm. Check the Auto
5-13
5
SECTION
FIVE
•
•
•
5-14
WL check box to let the software automatically select the wavelength
with the maximum absorption. Otherwise, use the Wavelength up
and down arrow buttons to select the wavelength to display in the
graph. Check the Zoom In check box to zoom in on the graph. (Uncheck it to zoom out.) Use the Smoothing up and down arrow
buttons to adjust the smoothness of the curve.
K vs. Concentration - plots the K (absorption coefficient) values
against the concentration % weight for a wavelength. Check the Auto
WL check box to let the software automatically select the wavelength
with the maximum absorption. Otherwise, use the Wavelength up
and down arrow buttons to select the wavelength to display in the
graph. Check the Zoom In check box to zoom in on the graph. (Uncheck it to zoom out.) Use the Smoothing up and down arrow
buttons to adjust the smoothness of the curve.
S vs. Wavelength - plots the S (scattering coefficient) values
against wavelength between 400 nm and 700 nm. Check the Auto
WL check box to let the software automatically select the wavelength
with the maximum absorption. Otherwise, use the Wavelength up
and down arrow buttons to select the wavelength to display in the
graph. Check the Zoom In check box to zoom in on the graph. (Uncheck it to zoom out.) Use the Smoothing up and down arrow
buttons to adjust the smoothness of the curve.
S vs. Concentration - plots the S (scattering coefficient) values
against the concentration % weight for a wavelength. Check the Auto
WL check box to let the software automatically select the wavelength
with the maximum absorption. Otherwise, use the Wavelength up
and down arrow buttons to select the wavelength to display in the
graph. Check the Zoom In check box to zoom in on the graph. (Uncheck it to zoom out.) Use the Smoothing up and down arrow
buttons to adjust the smoothness of the curve.
ESTABLISHING
YOUR
DATABASE
Steps:
To create an ink’s calibration data, complete the following steps.
1.
2.
3.
4.
5.
6.
7.
Select the Calibration Data arrow button in the Create Ink
dialog. This opens the calibration data dialog for the ink.
Click the Formula Units arrow button and select your formula
units in the Select Formula Mode dialog. Click OK to set the
units.
If you need to add a White Ink to the ink, follow these steps.
• Click the White Ink arrow button.
• Select a white ink from the list.
• Click Select.
• Enter the percentage of white ink added in the White field.
Click the Ink arrow button to view, print, or export the New
Formula Report for the calibration level ink. Refer to Section
Six—Formulating for more information.
Enter the percentage of ink for the calibration level in the Ink
field.
Click the Measure… button. Measure in the calibration level.
Refer to Section Seven—Basic Techniques.
For spherical instruments only, select the appropriate data type
radio button, either Included or Excluded.
5-15
5
SECTION
FIVE
8.
Click the OK button to return to the Create Ink dialog.
Steps:
To edit an ink’s calibration data, complete the following steps.
1.
2.
3.
4.
5.
6.
7.
8.
9.
5-16
Select the Calibration Data arrow button in the Edit Ink dialog.
This opens the calibration data dialog for the ink.
Highlight the calibration level of the ink you want to edit in the
Selected Cal Levels list.
Click the Formula Units arrow button and select your formula
units in the Select Formula Mode dialog. Click OK to set the
units.
If you need to add a White Ink to the ink, follow these steps.
• Click the White Ink arrow button.
• Select a white ink from the list.
• Click Select.
• Enter the percentage of white ink added in the White field.
Click the Ink arrow button to view, print, or export the New
Formula Report for the calibration level ink. Refer to Section
Six—Formulating for more information.
To move the highlighted calibration level from the Selected Cal
Levels list to the Available Cal Levels list, click the Remove
button. To move the highlighted calibration level from the
Available Cal Levels list to the Selected Cal Levels list,
click the Include button.
To change an ink percentage, follow these steps.
• Highlight the desired calibration level in the Selected Cal
Levels list.
• Enter the new percentage of ink for the calibration level in
the Ink field.
• Click the Change button. This updates the highlighted
calibration level with the new percentage.
To re-measure an ink, follow these steps.
• Highlight the desired calibration level in the Selected Cal
Levels list, or, if necessary, enter the correct percentage of
ink for the calibration level in the Ink field.
• Click the Measure… button. Measure in the calibration
level. Refer to Section Seven—Basic Techniques.
Click the OK button to return to the Edit Ink dialog.
ESTABLISHING
YOUR
DATABASE
Steps:
To delete an ink’s calibration data, complete the following steps.
1.
2.
3.
4.
Select the Calibration Data arrow button in the Create Ink or
Edit Ink dialog. This opens the calibration data dialog for the ink.
In the Selected Cal Levels list, highlight the calibration level
of the ink you want to delete.
Click the Delete button. The calibration level for the ink is
deleted. If you did not want to delete it, click the Cancel button
to return to the Create Ink or Edit Ink dialog.
To save the deletion, click the OK button.
CREATING A SECONDARY CALIBRATION SET
A secondary calibration set can be created from an original calibration set.
This function allows you to use all the parameters and inks of the “parent”
calibration set for a new calibration set. All you need to do is enter a new
calibration set name, measure in or retrieve a new substrate, and edit any
of the parameters (if needed). You can also enter new calibration data for
the inks to determine their strength. (Calibration data graph options are
identical to the graph options when creating/editing an ink. See the
Create/Edit an Ink sub-section.)
Once created, a secondary calibration set can be edited and deleted in the
same manner as an original calibration set. Secondary calibration sets are
listed in the Maintain Calibration Sets dialog along with original
calibration sets. A secondary calibration set has a prefix to its name—
{SC}. Refer to the Create/Edit a Calibration Set sub-section for editing a
secondary calibration set.
IMPORTANT: Because secondary calibration sets are based on their
parent calibration set, the following conditions apply:
•
•
•
•
Inks can not be created in the secondary calibration set—they must be
created with the parent calibration set.
Deleting an ink from a parent calibration set also deletes it from the
secondary calibration set.
Editing or deleting a parent calibration set also affects or deletes the
secondary calibration set as well as all associated inks.
Editing or deleting a secondary calibration set does not affect the
parent calibration set in any way.
5-17
5
SECTION
FIVE
Steps:
To create a secondary calibration set, complete the following steps.
1.
2.
3.
4.
5.
6.
7.
8.
5-18
Select the Edit Calibration Set… function from the Database
menu. This opens the Maintain Calibration Sets dialog.
Highlight the calibration set you want to base your secondary
calibration set on.
Click the Create Secondary Calibration Set … button. This
opens the Create Secondary Calibration Set dialog. This dialog
contains the information from the parent calibration set.
Enter the new calibration set’s name in the Name field.
Select the supplier from the Supplier drop down list.
If you want to change the parent calibration set, select it from the
Parent drop down list.
To edit the formula units, click the Formula Units arrow button
and select the formula units in the Select Formula Mode dialog.
Click OK to set the units.
Enter the substrate:
• Click the Substrate arrow button. This opens the Substrate
dialog.
• If you want to paste in substrate data, click the Paste button.
(Data must be in the clipboard for the Paste button to be
active.) Refer to Section Eight—Managing Your Data for
more information about the paste function.
• If you want to measure in your substrate, click the
Measure… button. Measure in your substrate. Refer to
Section Seven—Basic Techniques.
ESTABLISHING
YOUR
DATABASE
•
If you want to retrieve an existing substrate from your
database, click the Retrieve… button. Highlight the
substrate you want to retrieve in the Select Substrate dialog.
Click Select….
• If needed, enter the substrate’s name in the Substrate
Name field.
• Click the OK button. This returns you to the Create
Secondary Calibration Set dialog.
9. If you want to establish the ink strength, follow these steps.
• Click the Cal Data arrow button. This opens the Calibration
Data dialog.
• Select an ink from the drop down list.
• Enter the calibration level ink percent.
• Click the Measure… button. Measure in your ink. Refer to
Section Seven—Basic Techniques.
• For spherical instruments only, select the appropriate data
type radio button, either Included or Excluded.
• Click the OK button to return to the Create Secondary
Calibration Set dialog. The Ink Strength is displayed.
10. Click the OK button.
Detach a Secondary Calibration Set
You can also detach a secondary calibration set from its parent calibration
set. Detaching a secondary calibration set saves all the information
associated with it separate from its original parent calibration set.
Therefore, if the parent is edited or deleted, it won’t affect the “detached”
calibration set.
Steps:
To detach a secondary calibration set from its parent calibration set,
complete the following steps.
CAUTION: Once a secondary calibration set is detached from its parent
calibration set, it can not be reattached.
1.
2.
3.
Select the Edit Calibration Set… function from the Database
menu. This opens the Maintain Calibration Set dialog.
Highlight the secondary calibration set you want to detach.
Click the Detach Secondary Calibration Set… button. This
opens the Detach Secondary Calibration set dialog.
5-19
5
SECTION
FIVE
4.
Click the Yes button to detach the calibration set. Click the No
button to cancel the detach function.
CREATING A SUBSTRATE LIBRARY
You may enter the substrate data for the formula match before formulation
or during formulation. If you have substrates that you always keep in stock,
Ink-Master provides you with substrate maintenance functions to create a
library of your substrates. Refer to Section Six—Formulating for how to
enter a substrate during formulation.
Substrate “maintenance”—creating, editing, and deleting—allows you to
establish substrates, change substrate data, and remove substrates from
your database.
CAUTION: Deleting a substrate from the database causes all formulas
referencing it to become invalid.
Steps:
To create a new substrate, complete the following steps.
1.
2.
3.
4.
5.
6.
Select the Edit Substrate… function from the Database menu.
This opens the Substrate Maintenance dialog.
Click the Create… button. This opens the Substrate dialog.
Enter the substrate’s name in the Name field.
For spherical instruments only, select either the Included radio
button or the Excluded radio button for the Data Type.
Click the Measure… button. Measure in your substrate. Refer to
Section Seven—Basic Techniques.
Click the OK button.
Steps:
To edit an existing substrate, complete the following steps.
1.
2.
3.
4.
5.
5-20
Select the Edit Substrate… function from the Database menu.
This opens the Substrate Maintenance dialog.
Click the Edit… button. This opens the Substrate dialog.
Edit the substrate name in the Name field.
If you want to re-measure the substrate, click the Measure…
button. Re-measure the substrate. Refer to Section Seven—Basic
Techniques.
Click the OK button.
ESTABLISHING
YOUR
DATABASE
Steps:
To delete an existing substrate, complete the following steps.
CAUTION: Deleting a substrate from the database causes all formulas
referencing it to become invalid.
1.
2.
3.
Select the Edit Substrate… function from the Database menu.
This opens the Substrate Maintenance dialog.
Click the Delete… button. This opens the Delete Substrate
dialog.
Click the Yes button to delete the substrate. Click the No button
if you do not want to delete the substrate.
5
5-21
SECTION
5-22
FIVE
6.
SECTION SIX
Formulating
Section Contents
Entering the Standard ............................6-2
Setting Tolerances .................................6-4
Formulating a Match ..............................6-9
Testing the Match ..................................6-14
Improving the Match ..............................6-15
Accepting a Match or Correction ............6-17
Section Six—Formulating walks you through the process you’ll need to
take to generate a formula match to a standard. First, you need to specify a
standard and its tolerances. Then, you can generate a formula that matches
your standard. Next, mix a physical sample of the formulated match and
measure it in as a trial. Based on your trial information, correct your
formula. Lastly, accept the match or correction and prepare the formula to
be used.
6
6-1
SECTION
SIX
ENTERING THE STANDARD
There are two ways to choose a standard to match—create a new standard
or find an existing standard. Refer to Section Seven—Basic Techniques for
how to find a standard.
Create/Edit a Standard
Creating a standard allows you to enter the color data for a new standard.
Standard “maintenance”—creating, editing, and deleting—allows you to
establish standards, change standard information, and remove standards
from your database. When editing a standard, if you choose not to rename
the standard before accepting new standard data, you may save the
previous standard data under an alternate standard description. Refer to
Section Ten—Advanced Software Features.
CAUTION: Deleting a standard from the database also deletes all the
associated samples that are linked to it.
Steps:
To create a new standard or edit an existing standard, complete the
following steps.
1.
6-2
Choose to create a new standard, or edit an existing standard.
FORMULATING
•
To create a new standard, either select the Create
Standard… function from the Instrument menu. (Or,
select the Edit Standards… function from the Database
menu. This opens the Standard Maintenance dialog. Click the
Create… button.) This opens the Create Standard dialog.
• To edit an existing standard, select the Edit Standards…
function from the Database menu. This opens the Standard
Maintenance dialog. Click the Edit… button. This opens the
Edit Standard dialog.
2. Enter or edit the standard name in the Standard Name field.
3. Select the customer name from the Customer drop down list.
4. Enter or edit a standard description in the Standard
Description field.
5. Click the Standard Color arrow button. This opens the Edit
Standard Color dialog.
6. Click the Measure… button. Measure in your standard. Refer to
Section Seven—Basic Techniques.
7. If you want to attach or detach tags, click the Standard Tags
arrow button. This opens the Select Tags dialog. Refer to Section
Ten—Advanced Software Features.
8. If you want to create or edit a note for the standard, click the
Note… button to enter any notes in the Note Editor. Refer to
Section Seven—Basic Techniques.
9. Click the Tolerance arrow button. This opens the Edit Tolerance
dialog.
10. Create or edit the standard’s tolerances. Refer to the Setting
Tolerances sub-section.
11. Click the OK button. When editing a standard, if you didn’t
rename the standard, you are prompted to save the new standard
data under an alternate standard description. Refer to Section
Ten—Advanced Software Features.
Steps:
To delete standard, complete the following steps.
CAUTION: Deleting a standard from the database also deletes all the
associated samples that are linked to it.
1.
Select the Edit Standards… function from the Database
menu. This opens the Standard Maintenance dialog. Click the
Delete… button. This confirmation message appears.
6-3
6
SECTION
SIX
2.
Click the Yes button to delete the standard. Click the No button
if you do not want to delete the standard..
SETTING TOLERANCES
When entering a standard, you need to determine the tolerances for it.
Tolerance is the allowable deviation that is set for each sample that is
measured to match the standard. Each standard can have up to 11 types of
tolerances. Below lists and describes the available tolerances.
L*a*b* Tolerance
L*a*b* tolerancing establishes color difference limits for lightness values
(dL*), red/green values (da*), and yellow/blue values (db*). These
tolerances cause color difference to be limited by a rectangular box in a
color space. You must establish tolerance limits for each value.
L*C*h° Tolerance
L*C*h° tolerancing establishes color difference limits for lightness values
(dL*), chroma values (dC*), and hue values (dH*). Hue is limited by a
function given by the following equation: dH*=[(dE*)2-(dL*)2-(dC*)2]½.
The benefit of L*C*h° tolerancing is it reflects human perception of color
more accurately than L*a*b* tolerancing. You must establish tolerance
limits for each value.
∆ ECMC Tolerance
∆ECMC tolerancing establishes constant limits for lightness (l), chromaticity
(c), and the commercial factor (cf). This is an ellipsoidal tolerance method
which attempts to correlate small measured color differences with visual
assessment. (The CMC algorithms in Ink-Master are developed in
accordance with CIE and AATCC guidelines.) You must establish
tolerance limits for each value.
∆ E Tolerance
∆E tolerancing establishes a constant limit for total L*a*b* errors, (dE).
The Delta E tolerance causes color difference to be limited by a sphere in a
color space. You must establish a tolerance limit for Delta E.
Metamerism
Metamerism is an index which quantifies the color difference expected
between the standard and sample as the illuminant/observer pair changes.
6-4
FORMULATING
You must select two different illuminant/observers and establish a high
tolerance limit.
Formula used: dEIlluminant1 + dEIlluminant2
Strength
Strength is an index which shows the ability of a colorant to modify the
color of a material. You must establish high and low tolerance limits for
each type of strength.
There are three types of strengths: Apparent, Tristimulus, and Chromatic.
Apparent strength should be used for comparison of colors with moderate
chroma and is evaluated across the entire spectrum. Tristimulus strength
focuses on the lowest tristimulus value, indicating the highest absorbency.
(Upon finding that value, it compares the absorbency of the standard and
sample.) Chromatic strength should be used for comparison of colors with
high chroma and is evaluated at the wavelength with the highest
absorption. (You must select the wavelength.)
Apparent Formula: %Strength = Sum of sample absorbances / Sum
of standard absorbences X 100%
Tristimulus Formula: %Strength = Sample absorbance (tristimulus) /
Standard absorbance (tristimulus) X 100%
Chromatic Formula: %Strength = Sample absorbance (wavelength) /
Standard absorbance (wavelength) X 100%
Yellowness Index
Yellowness index is an index for evaluation of white and near-white
samples. These samples yield numbers which correlate with visual rating
of yellowness. You must establish high and low tolerance limits and select
the proper type of illuminant/observer:
ASTME313 Formula: Yellowness = 100(1 - .847 Z/Y) C/2°
ASTMD1925 Formula: Yellowness = 100(1.28X - 1.06Z)/Y C/2°
Whiteness Index
Whiteness index is an index for evaluation of white and near-white
samples. These samples yield numbers which correlate with visual rating
of whiteness. You must establish high and low tolerance limits.
6-5
6
SECTION
SIX
ASTME313 Formula: Whiteness = 3.37472Z - 2.99 (C/2°)
L*a*b* Asymmetric (+/-) Tolerance
L*a*b* Asymmetric tolerancing allows you to establish upper (+) and
lower (-) limits for lightness values (dL*), red/green values (da*), and
yellow/blue values (db*). These tolerances cause color difference to be
limited by a rectangular box in a color space. L*a*b* Asymmetric
tolerancing allows you to set the target anywhere within the tolerance
space, as opposed to L*a*b* tolerancing which places the target in the
center of the tolerance space. You must establish upper and lower tolerance
limits for each value.
FMC2 Tolerance
FMC2 tolerancing is based on McAdam’s work of color perceptibility of
human observers. You must establish the FMC2 Delta E limit.
Density
Density tolerancing is based on the density status type and appropriate
filter response for the status. You must establish high and low limits and
the filter response. However, if you want, Ink-Master can automatically
select the appropriate filter response. Below is a list of the density status
types with their available filter responses.
•
•
•
•
Status A, Status E, Status I, and Status T - Cyan, Magenta,
Yellow, and Visual filter responses.
Spectral and Spectral X - the wavelength of the highest
spectral density.
HiFi - Cyan, Magenta, Yellow, Visual, Red, Green, and Blue
filter responses.
Hexachrome - Cyan, Magenta, Yellow, Visual, Green, and
Orange filter responses.
Create/Edit Tolerances
Tolerances for a standard are set (created/edited) in the Edit Tolerance
dialog. This dialog contains the following items.
•
•
•
6-6
Tolerance - This list box displays all current tolerances.
Cut - This button cuts the highlighted tolerance from the Tolerance
list box and moves it to the clipboard.
Copy - This button copies the highlighted tolerance from the
Tolerance list box to the clipboard.
FORMULATING
•
•
•
•
•
•
Paste - This button pastes the clipboard contents into the Tolerance
list box.
Selected Tolerance Detail - This area is where you select
tolerancing methods and settings. This area contains the following
items.
• Angle - This drop down list is available for spherical instruments
only. It allows you to select either an included angle (In) or an
excluded angle (Ex).
• Tolerance Type - This drop down list allows you to select the
type of tolerance you want to use. See the above descriptions of
available tolerances for more information.
• Illum/Obs or Strength Type or Status Type - Depending on
the Tolerance Type selected, this drop down list allows you to
either select an illuminant observer or the strength type or a
density status type. (For Density tolerance type only, an
additional drop down list, Filter Response, and an Auto Pick
check box appear. The Filter Response drop down list allows
you to determine the appropriate density status filter response.
The Auto Filter check box lets Ink-Master determine the
appropriate density status filter response.)
• <limit> - These fields allow you to enter the appropriate tolerance
limits. These fields depend on the Tolerance Type selected.
• Change - This button replaces the highlighted tolerance in the
Tolerance list box with the current settings in the Selected
Tolerance Detail area.
• Edit Tolerance Visually… - This button opens the Visual
Tolerance Editor dialog which allows you to edit the following
tolerances visually: L*a*b*, L*C*H*, CMC, Delta E, L*a*b*
(+/), and DE (FMC2). Refer to Section Ten—Advanced Software
Features. (NOTE: This function is only available for standards
with existing samples.)
Create - This button adds the current settings in the Selected
Tolerance Detail area as a new tolerance in the Tolerance list box.
Delete - This button permanently removes the highlighted tolerance
from the Tolerance list box.
Use as Default - This button sets the current tolerance(s) in the
Tolerance list box as the default tolerance(s) for all new standards.
OK - This button accepts the current tolerance(s) in the Tolerance
list box as the tolerance(s) for the standard and returns to the Create
Standard dialog or Edit Standard dialog. Refer to the Entering the
Standard sub-section.
6-7
6
SECTION
SIX
•
Cancel - This button does not accept any of the tolerance settings in
the Edit Tolerance dialog and returns to the Create Standard dialog or
Edit Standard dialog. Refer to the Entering the Standard sub-section.
Steps:
To create or edit your tolerance settings, complete the following steps.
1.
2.
3.
4.
5.
6-8
To create a tolerance based on an existing tolerance or to edit an
existing tolerance, highlight the desired tolerance in the
Tolerance list box
For spherical instruments only, select the appropriate angle,
included (In) or excluded (Ex), from the Angle drop down list.
Select the tolerance type from the Tolerance Type drop down
list.
Depending on the tolerance type, select the illuminant/observer(s)
from the Illum/Obs drop down list(s) or select the strength type
from the Strength Type drop down list. (For Density tolerance
type only, select the status type from the Status Type drop down
list. Then determine the filter response by selecting it from the
Filter Response drop down list or checking the Auto Filter
check box.)
Depending on the tolerance type, enter the necessary limit(s) in
the limit field(s). If you want to visually edit the tolerances, click
the Edit Tolerance Visually… button. This opens the Visual
Tolerance Editor dialog. Refer to Section Ten—Advanced
Software Features.
FORMULATING
6.
7.
8.
To create a new tolerance, click the Create button. To edit a
tolerance, click the Change button.
Repeat steps 1 through 6 for each tolerance you want to create or
edit.
Click the OK button. This sets the current tolerance(s) for the
standard and returns to the Create Standard dialog or Edit
Standard dialog. Refer to the Entering the Standard sub-section.
FORMULATING A MATCH
Once the standard is entered, you can formulate an ink match for the
standard. This process includes selecting your inks, setting the formulation
conditions, viewing the results, and accepting an initial formula. To
generate a formula from a trial, refer to Section Ten—Advanced Software
Features. To formulate a series of matches from the Request Queue, refer to
Section Ten—Advanced Software Features.
Steps:
To begin the formulation process, select the Combinatorial… function
from the Formulation menu. This opens either the Select Inks dialog or
the Combinatorial Formulation dialog.
NOTE: If no ink set has been previously selected, the Select Inks dialog is
automatically displayed. If an ink set has been previously selected, the
Combinatorial Formulation dialog is automatically displayed.
The Select Inks dialog allows you to determine your ink set for the
formulation process. The Combinatorial Formulation dialog allows you to
determine all of the factors needed for an ink formula match. It also
displays the formula match results and provides access to formula reports.
For more information about formula reports, refer to the Accepting a
Match or Correction sub-section. To formulate a series of matches from the
Request Queue, refer to Section Ten—Advanced Software Features.
Selecting Inks
If no inks have been selected previous to performing a combinatorial
formulation, the software automatically prompts you to select your
formulation inks. This is done in the Select Inks dialog. Refer to Section
Ten—Advanced Software Features for advanced methods of selecting inks.
6-9
6
SECTION
SIX
Steps:
To select inks for formulation, complete the following steps.
1.
2.
3.
4.
5.
6.
6-10
In the Calibration Sets list box, highlight the calibration set
that contains the inks you want to use. All of the inks in the
calibration set appear in the Available list box.
Highlight the ink you want to select in the Available list box and
click the Include > button to move it to the Selected list box.
(To remove an ink from the Selected list box, highlight it and
click the Remove < button.) Use the “All” buttons to move all of
the inks from one list box to another.
Enter the amount of inks to be used in the formula in the Inks
per Formula field or use the up and down arrow buttons to
change the current value.
If you want to always use waste ink in your formula, click the
Always Use Waste check box. This check box is only available
if the current calibration set contains a waste ink. Refer to Section
Ten—Advanced Software Features for more information about
waste inks.
If you want to always use black ink in your formula, click the
Always Use Black check box.
If you want to always use white ink in your formula, click the
Always Use White check box. This check box is only available
if the current calibration set contains a white ink.
FORMULATING
7.
8.
If you want to set the percent add, simply highlight it, click the
Fixed Add… button, enter the percentage, and click the OK
button.
Click the OK button. This opens (or returns to) the Combinatorial
Formulation dialog.
Selecting Formulation Conditions
Once in the Combinatorial Formulation dialog and before actually creating
a formula you need to specify the conditions for the formula. Once the
conditions are set, you may add it to the Requests Queue. For more
information about using the Manage Queues, refer to Section Ten—
Advanced Software Features.
6
Steps:
To select the formulation conditions, complete the following steps.
1.
2.
If the currently selected standard is not correct, click the
Standard arrow button. This opens the Find Standard dialog.
Refer to Section Seven—Basic Techniques for finding a standard.
If needed, click the Ink Set arrow button to select your inks and
follow the steps in the Selecting Inks sub-section.
6-11
SECTION
SIX
3.
4.
5.
Click the Sort Criteria arrow button. This opens the Sort Order
dialog. Select the method of sorting from the list and click
Select.
If your ink set includes a “White” ink, you may choose Loading
Options:
• If you check the Fixed Loading check box, enter the
percent ink in the % Ink field.
• If you check the Fixed Opacity check box and the standard
was measured in with the Contrast Ratio method, the opacity
is automatically entered in the % Opacity field, otherwise
enter the percent opacity in the % Opacity field.
• The film thickness defaults to the calibration set film
thickness. If you want to change it, enter the correct film
thickness in the Film-Thk. field.
If the currently selected substrate is not correct, click the
Substrate arrow button. This opens the Substrate dialog.
• For spherical instruments only, select either the Included
radio button or the Excluded radio button for the Data
Type.
• If you want to measure in your substrate, click the
Measure… button. Measure in your substrate. Refer to
Section Seven—Basic Techniques.
• If you want to retrieve an existing substrate from your
database, click the Retrieve… button. Highlight the
substrate you want to retrieve in the Select Substrate dialog.
Click Select….
• If you want to select the substrate that is used for the
calibration set, click the Cal. Set button.
• If needed, enter the substrate’s name in the Substrate
Name field.
• Click the OK button. This returns you to the Combinatorial
Formulation dialog.
Formulating an Ink Match
Once all of the conditions are set in the Combinatorial Formulation dialog,
you can formulate an ink match. Once a formula is created, you may add
notes and tags.
Steps:
To formulate an ink match, complete the following steps.
6-12
FORMULATING
1.
2.
3.
4.
Click the Formulate button. The number of formula
combinations are displayed next to Formula: Combinations,
and the closest matches are displayed beneath the Sort Criteria.
To stop the software from formulating, click the Abort button.
Click the Note arrow button to enter any notes in the Note Editor.
Refer to Section Seven—Basic Techniques.
Click the Tags arrow button to assign tags to the calibration set.
Refer to Section Ten—Advanced Software Features.
Viewing the Results
After the software has formulated ink matches, you may view the results in
both formula form and color data form. The formula is displayed in the
formula display area below the Substrate information and the color data
is displayed in the lower right corner of the Combinatorial Formulation
dialog. To edit the formula, refer to Section Ten—Advanced Software
Features.
Below is a list of display options for the match’s color data.
•
•
•
•
Text - This radio button lists the L*, a*, b*, C*, h*, DH, and DE
values for the standard and the sample (match), as well as Delta
values.
Reflectance - This radio button displays the standard curve (in
white) and the sample curve in either green (pass) or red (fail) on a
reflectance graph.
L*a*b* - This radio button displays the standard (in white) and the
sample in either green (pass) or red (fail) on a L*a*b* graph.
Visual - This radio button displays a visual representation of the color
difference between the standard and the sample.
Steps:
To view your formula results, complete the following steps.
1.
2.
3.
6
In the list box below the Sort Criteria, highlight the formula you
want to view.
To view the ink information for the formula, click the Ink
Information arrow button in the formula display area. This
opens the Ink Information dialog.
To view the color data for the match, first select the
illuminant/observer from the drop down list above the display
area. For spherical instruments only, select either the Included
radio button or the Excluded radio button for the data type. Then
6-13
SECTION
SIX
4.
select the appropriate radio button to display the match’s color
data: Text, Reflectance, L*a*b*, or Visual.
To view either of the queues, simply click the Requests Queue
arrow button or the Results Queue arrow button. For more
information about queues, refer to Section Ten—Advanced
Software Features.
TESTING THE MATCH
Once formulation is complete, you should measure a physical sample of the
formula match—a trial. Refer to Section Ten—Advanced Software
Features for more information about using waste ink from a trial and
formulating from a trial. Trial measurements are done in the Measure Trial
dialog.
Click here to edit
the trial formula
percentages.
Steps:
To measure your trial, complete the following steps.
6-14
FORMULATING
1.
2.
3.
Select the Measure Trial… function from the Instrument
menu. This opens the Measure Trial dialog for the current
standard.
Measure the trial. Refer to Section Seven—Basic Techniques.
Click the Save button.
IMPROVING THE MATCH
If you found that your trial sample is close, but not an acceptable match,
the next step to improving your ink match is to correct the formula. The
Formulate for Correction dialog contains the same items as the
Combinatorial Formulation dialog without the queue functions and with
the addition of the following Correction Options.
•
•
Batch Add Mode - This check box indicates that you want to
perform a Batch Add correction. Refer to Section Ten—Advanced
Software Features.
Use Correction Factors - This check box indicates that you want to
include correction factors for correcting the formula. Correction
factors allow Ink-Master to consider the difference between theoretical
ink performance and actual performance of the measured trial.
CAUTION: If you suspect a trial was improperly measured, do not use
correction factors. This eliminates Ink-Master using incorrect data that
may influence the formula correction.
6
6-15
SECTION
SIX
Steps:
To correct the trial, complete the following steps.
1.
2.
3.
4.
5.
Select the trial you want to correct from the sample set in the
Controls window.
Select the Correction… function from the Formulation pull
down menu. This automatically corrects the trial and opens the
Formulate for Correction dialog.
Modify any of the settings in the dialog. Refer to the Formulating
a Match sub-section for more information.
If desired, check the Correction Factors check box. For Batch
Add Mode, refer to Section Ten—Advanced Software Features.
Click the Correct button.
Viewing the Correction Results
After the software has formulated the correction, you may view the results
in both formula form and color data form. The formula is displayed in the
formula display area below the Substrate information. Correction
Factors, percent error, percent trial, percent match, and ink information are
listed in the formula display area. Trial and correction color data are
displayed in the lower right corner of the Formulate for Correction dialog.
6-16
FORMULATING
Trial color data is white and correction color data is green. To edit the
formula, refer to Section Ten—Advanced Software Features.
Below is a list of display options for the color data.
•
•
•
•
Text - This radio button lists the L*, a*, b*, C*, h*, DH, and DE
values for the standard and the sample (match), as well as Delta
values.
Reflectance - This radio button displays the standard curve (in
white) and the sample curve in either green (pass) or red (fail) on a
reflectance graph.
L*a*b* - This radio button displays the standard (in white) and the
sample in either green (pass) or red (fail) on a L*a*b* graph.
Visual - This radio button displays a visual representation of the color
difference between the standard and the sample.
Steps:
To view your correction results, complete the following steps.
1.
2.
To view the ink information for the formula, click the Ink
Information arrow button in the formula display area. This
opens the Ink Information dialog.
To view the trial and correction color data, first select the
illuminant/observer from the drop down list above the display
area. For spherical instruments only, select either the Included
radio button or the Excluded radio button for the data type. Then
select the appropriate radio button to display the color data: Text,
Reflectance, L*a*b*, or Visual.
ACCEPTING A MATCH OR CORRECTION
If you want to accept an initial formula match or a formula correction, you
may select it to be included in the sample set and prepare the formula for
use. Accepting (selecting) a formula is done in either the Combinatorial
Formulation or Formulate for Correction dialog.
To prepare a formula for use, Ink-Master allows you to view, modify, print,
and export the formula’s report. This is done in the New Formula Report
dialog. This dialog contains the following items.
6-17
6
SECTION
SIX
NOTE: All percentage units are determined by the selected calibration set.
Refer to Section Five—Establishing Your Database. For information about
amount defaults, refer to Section Four—Software Setup Options.
•
•
•
•
•
•
•
6-18
Calibration Set - This shows the current calibration set used for the
formula.
Lot ID - This shows the Lot ID of the sample.
Substrate - This shows the name of the substrate for the formula.
Scaled Amount <type of scaling> - This arrow button opens the
Edit Amount dialog where you enter the scaled amount. The scaled
amount is displayed to the right of this item. The type of scaling is
determined by the Formula Scaling radio button currently selected.
The units drop down list allows you to select the units for the scaled
amount.
Ink Display area - This area lists the names of the inks in the
formula as well as their percentages and amounts. The units drop
down list in this area allows you to select the units for the ink
amounts. If these units are changed, all other units in the dialog reflect
this change. If an amount exceeds the inventory amount, it is
indicated by a red asterisk with an “Exceeds Inventory Amount” note
at the bottom of the dialog.
Ink Components - These radio buttons determine the type of ink
component used in the formula.
• Light - This radio button indicates that only Light Ink
components are used in the formula. All solvent information is
disabled on the report if this radio button is selected.
• Heavy - This radio button indicates that only Heavy Ink
components are used in the formula.
• Concentrate - This radio button indicates that only Concentrate
is used in the formula.
Formula Scaling - These radio buttons determine the type of scaling
used to display the formula. The selected type of scaling is displayed in
the Scaled Amount display line.
• Total - This radio button indicates that the formula is scaled to
the total amount of all the inks, the extender, and the solvent.
• Extender - This radio button indicates that the formula is scaled
to the amount of the extender only.
• Inks - This radio button indicates that the formula is scaled to the
total amount of the inks only.
FORMULATING
•
•
•
•
•
•
•
•
Extender - This display line shows the percentage and the amount of
the extender in the formula. The units drop down list in this display
line allows you to select the units for the extender amount.
Solvent - This display line shows the percentage and the amount of
the solvent in the formula. The units drop down list in this display line
allows you to select the units for the solvent amount. This display line
is disabled if the Light radio button is selected for the Ink Mixture
type.
Total Amount - This display line shows the percentage and the total
amount of the formula. The units drop down list in this display line
allows you to select the units for the total formula amount.
Cost of Batch - This display line shows the cost of the batch.
Note - This arrow button opens the Note Editor. The note is displayed
in the note box. Refer to Section Seven—Basic Techniques.
Print - This button allows you to print the formula report. If the Auto
Inventory item is checked in the Options pull down menu, the Edit
Inventory Amount dialog is displayed to allow you to edit the
inventory amounts before the report is printed.
<Export> - This button is optional. It allows you to export the
formula report (possibly to a dispenser). The name of this button is
determined in the Formula Options function, as well as whether or not
this function is enabled. Refer to Section Four—Software Setup
Options.
Close - This button closes the New Formula Report dialog.
6
6-19
SECTION
SIX
Red asterisk
indicates that the
ink exceeds the
inventory amount.
Steps:
To accept a formula and prepare it to be used, complete the following
steps.
1.
2.
3.
4.
6-20
Select the formula as a sample.
• To select an initial match formula, in the list box below the
Sort Criteria, highlight the formula you want to select.
Click the Select button in the Combinatorial Formulation
dialog.
• To select a corrected formula, simply click the Select button
in the Formulate for Correction dialog.
Click the Report… button. This opens the New Formula Report
dialog.
Select the units for the inks.
Select the desired Formula Scaling radio button.
FORMULATING
Click the Scaled Amount arrow button.
Enter the scaled amount and click OK.
Select the units for the scaled amount.
Select the desired Ink Components radio button.
Select the units for the extender.
If available, select the units for the solvent.
Select the units for the total amount.
Click the Note arrow button to enter any notes in the Note Editor.
Refer to Section Seven—Basic Techniques.
13. If you want to print the report, click the Print button. If prompted,
you may edit the inventory amounts (and units), then click OK.
14. If you want to export the report, click the <Export> button.
15. When finished with the report, click the Close button.
5.
6.
7.
8.
9.
10.
11.
12.
6
6-21
CHAPTER 7 SECTION SEVEN
Basic Techniques
Section Contents
Taking a Measurement ..........................7-2
Printing Color Data ................................7-9
Using the Note Editor.............................7-17
Adding Notes & Tags to a Sample .........7-19
Accepting or Rejecting a Sample ...........7-20
Finding a Standard.................................7-20
Finding Samples ....................................7-23
Section Seven covers basic techniques used when running the Ink-Master
software. These basic techniques include taking measurements, printing,
using the Note Editor, adding tags & notes to samples, accepting or
rejecting samples, and finding data.
7
7-1
SECTION
SEVEN
TAKING A MEASUREMENT
Taking a measurement is a fundamental skill used to establish your
database and to formulate ink matches. Whether the software requires you
to measure a substrate, standard, ink, extender, or trial, most measurement
opportunities provide you with the same techniques for taking a
measurement.
Color data is entered in a number of ways. While measuring the color with
an instrument is the most common entry method, Ink-Master provides
alternate entry methods. These alternate entry methods are covered in
Section Ten—Advanced Software Functions.
NOTE: If you need to take “Closed Shoe” measurements, be sure to select
this instrument mode. Refer to Section Four—Software Setup Options.
Measure a Sample Color
This is used for substrates, standards, and single constant ink calibration.
Substrates, standards, and single constant inks use the same measuring
techniques as well as sharing the same dialog. This measurement dialog
contains the following items.
•
•
•
7-2
Name - This states the name of the substrate, standard, or ink.
Averaging - This drop down list allows you to select the type of
measurement averaging you want to perform. Averaging is
recommended if your sample is less than perfect.
• No Averaging - only one measurement is taken.
• Average of 2 Samples - two measurements are taken and
averaged.
• Average of 3 Samples - three measurements are taken and
averaged.
• Average of 4 Samples - four measurements are taken and
averaged.
• Average of 5 Samples - five measurements are taken and
averaged.
• Average of 20 Samples - twenty measurements are taken and
averaged.
Statistical Computation - This drop down list allows you to select
the type of computation results displayed in the Color Data
information box.
• Range - range data is computed.
• Standard Deviation - standard deviation data is computed.
BASIC
•
•
•
•
•
•
•
•
•
•
TECHNIQUES
• Last Measurement - only the last measurement is displayed.
Illuminant/Observer - This drop down list allows you to select the
illuminant/observer you want to use. A standard list of
illuminant/observers is available.
Color Data - This information box displays the measurement color
data specific to the type of averaging and statistical computation you
selected.
Text - This radio button displays the color data in text form.
Reflectance - This radio button displays the color data in reflectance
graphs.
L*a*b* - This radio button displays the color data in L*a*b* graphs.
Closed Shoe Read - This button takes a closed shoe measurement.
This button is active only if the software is in the Closed Shoe
instrument mode. Refer to Section Four—Setting Up Your Software.
Alternate Entry - This button opens the Alternate Reflectance Entry
dialog. Refer to the Alternate Entry Methods sub-section.
Reset Average - This button clears all averaging color data and restarts the averaging measurement sequence.
OK - This button accepts the measurement data.
Cancel - This button does not accept the measurement data and closes
the measure dialog.
NOTE: While taking “averaging” measurements, graphs display all
measurements (in blue) as well as the average of those measurements (in
black). Once the last averaging measurement is taken, graphs display only
the average (in black).
7
7-3
SECTION
SEVEN
Steps:
To measure a substrate, a standard, a Single Constant ink, or a Single
Constant extender, complete the following steps. If you want to enter color
data by an alternate method, click the Alternate Entry… button and refer
to Section Ten—Advanced Software Features.
1.
2.
3.
4.
5.
6.
Select your averaging method from the Averaging method drop
down list.
Select your statistical computation method from the Statistical
Computation method drop down list.
Select your illuminant/observer from the Illuminant/Observer
drop down list.
Select the appropriate radio button (Text, Reflectance, or
L*a*b*) for the form of color data displayed.
Follow the Measurement prompt and take your measurement(s).
(Click the Closed Shoe Read button if taking a closed shoe
measurement.)
Click the OK button.
Measure a Sample Color & Opacity
This is used for Multi-Flux ink calibration. Multi-Flux inks and extenders
use the “Over Black, Over White” measuring technique. This technique
7-4
BASIC
TECHNIQUES
provides a way to measure color data when the opacity is not 100 percent.
This technique requires that you measure the ink or extender over a black
substrate to measure scattering properties and over a white substrate to
measure absorption properties. These measurements are done in the Over
Black/Over White dialog. The Over Black/Over White dialog contains the
following items.
•
•
•
•
•
•
•
•
Over Black - This graph displays the reflectance values for the over
black measurement. When the graph has focus, a prompt appears in
red text at the top of the graph to indicate measurement.
Over White - This graph displays the reflectance values for the over
white measurement. When the graph has focus, a prompt appears in
red text at the top of the graph to indicate measurement.
Substrate - This graph displays the reflectance values for the
substrate. This data is optional. You may automatically measure the
substrate as a part of the measurement process, or you may retrieve
substrate data from the database. When the graph has focus, a prompt
appears in red text at the top of the graph to indicate measurement.
View - This drop down list allows you to select Included or Excluded
data to display. For spherical instruments only!
Film Thickness - This field is where you enter the film thickness of
the ink. Film thickness units are determined in the Units of Measure
function. Refer to Section Four—Software Setup Options.
Percent Opacity - This reports the percent opacity of the ink.
Averaging - This drop down list allows you to select the type of
measurement averaging you want to perform. The prompt below the
drop down list states where you are in the measurement process (e.g.,
Measure 2 of 4).
• No Averaging - only one measurement is taken.
• Average of 2 Samples - two measurements are taken and
averaged.
• Average of 3 Samples - three measurements are taken and
averaged.
• Average of 4 Samples - four measurements are taken and
averaged.
• Average of 5 Samples - five measurements are taken and
averaged.
• Average of 20 Samples - twenty measurements are taken and
averaged.
Reset Average button - clears all averaging color data and re-starts
the averaging measurement sequence.
7-5
7
SECTION
SEVEN
•
•
•
•
•
•
Next - This button allows you to move the focus from one
measurement graph to another.
Paste - This button pastes color data from the clipboard into the
graph that has focus.
Manual Entry - This button opens the Enter Reflectances dialog
which allows you to manually enter color data for the graph that has
focus. Refer to the Alternate Entry Methods sub-section.
Closed Shoe Read - This button takes a closed shoe measurement.
OK - This button accepts the measurement data.
Cancel - This button does not accept the measurement data and closes
the measure dialog.
NOTE: While taking “averaging” measurements, graphs display all
measurements (in blue) as well as the average of those measurements (in
black). Once the last averaging measurement is taken, graphs display only
the average (in black).
7-6
BASIC
TECHNIQUES
Measurement
prompt in red text
Steps:
To measure a Multi-Flux ink or Multi-Flux extender, complete the
following steps. If you want to enter color data by manual entry, click the
Manual Entry button and refer to Section Ten—Advanced Software
Features.
1.
2.
3.
4.
5.
For spherical instruments only, select In (included) or Ex
(excluded) from the View method drop down list.
Enter the film thickness in the Film Thickness field.
Select your averaging method from the Averaging method drop
down list.
Follow the red text prompts and take your measurement(s). (Click
the Closed Shoe Read button if taking a closed shoe
measurement.)
If you want to paste color data into the graph that has focus, click
the Paste button.
7-7
7
SECTION
SEVEN
6.
7.
If you want to retrieve substrate color data, click the Retrieve
Substrate button, highlight a substrate from the list, and click
the Select… button.
Click the OK button.
Trials
Trials use the same dialog as the substrate, standard, and Single Constant
ink measuring dialog with additional information specific to trial
measurements. The Measure Trial dialog contains the following items in
addition to the substrate, standard, and Single Constant ink and extender
measurement dialog.
•
•
•
•
•
•
•
Formula - This arrow button opens the Edit Trial Formula dialog
which allows you to edit the trial’s formula. Refer to Section Ten—
Advanced Software Features.
Formula - This scroll bar allows you to select the trial’s formula to
display from the sample set specified in the Controls window.
Formula - This information box displays the formula for the selected
sample.
Note - This arrow button opens the Note Editor. Refer to the Using
the Note Editor sub-section.
Tags - This arrow button opens the Select Tags dialog. Refer to
Section Ten—Advanced Software Features.
Save - This button accepts the measurement data.
Close - This button does not accept the measurement data and closes
the measure dialog.
NOTE: While taking “averaging” measurements, graphs display all
measurements (in cyan) as well as the average of those measurements (in
black). Once the last averaging measurement is taken, graphs display only
the average (in black).
7-8
BASIC
TECHNIQUES
Click here to edit
the trial formula
percentages.
Steps:
To measure a trial, complete the following steps. If you want to enter color
data by an alternate method, click the Alternate Entry… button and refer
to Section Ten—Advanced Software Features.
1.
2.
3.
4.
5.
Select the trial formula using the Formula scroll bar.
Select your averaging method from the Averaging method drop
down list.
Select your statistical computation method from the Statistical
Computation method drop down list.
Select your illuminant/observer from the Illuminant/Observer
drop down list.
If you want to enter a note, click the Note arrow button. This
opens the Note Editor. Refer to the Using the Note Editor subsection.
7-9
7
SECTION
SEVEN
6.
7.
8.
9.
If you want to attach a tag, click the Tags arrow button. This
opens the Select Tags dialog. Refer to Section Ten—Advanced
Software Features.
Select the appropriate radio button (Text, Reflectance, or
L*a*b*) for the form of color data displayed.
Follow the Measurement prompt and take your measurement(s).
(Click the Closed Shoe Read button if taking a closed shoe
measurement.)
Click the Save button.
PRINTING COLOR DATA
Ink-Master offers a wide variety of methods to output your measurement
data—quick screen prints, general reports, conformance reports, complete
reports, and customized reports. You may even export customized reports.
To be sure your printers are set up the way you want it, you can use the
Print Setup… function in the File pull down menu. This opens the Print
Setup dialog. This dialog is a standard Windows Print Setup dialog and
contains printer selection functions, orientation options, and paper size and
source options. The Options… button in this dialog opens the Windows
printer options and properties. Refer to your Windows documentation for
more information.
Print the Application Screen
Ink-Master allows you to print all the screen’s contents. You may want to
set up the screen with the desired standard, samples, and views. Refer to
Section Nine—Viewing Your Data for more information.
NOTE: To print an individual window, you must select Print in the
window’s View Specific pull down menu. Refer to Section Nine—Viewing
Your Data for more information about View Specific menus.
Steps:
To print all the screen contents, simply click the Print function in the
File pull down menu.
Print a General Report
A General Report allows you to print specific types of data for a set of
samples. The Print Report dialog allows you to select a set of samples. It
also allows you access to the Output Options dialog. This dialog allows you
7-10
BASIC
TECHNIQUES
to determine the data printed in your report. The following is a list of the
data available. Select a data option by checking its check box. (Illuminants
must be selected from list boxes.)
•
•
•
•
•
•
•
•
•
L*a*b* Data
Reflectance Data
Difference Mode
Tags
Notes
Lot #
Specular Included (for spherical instruments only)
Specular Excluded (for spherical instruments only)
Illuminants
Steps:
To set up and print a general report, complete the following steps.
1.
2.
3.
4.
5.
6.
7.
Click the General… function in the Print Report pop up
window from the File menu. This opens the Print Report dialog.
If you want a different sample set, click the Filter arrow button.
This opens the sample Filter dialog. To select a set of samples,
refer to the Finding Samples sub-section. To create a new filter,
refer to Section Ten—Advanced Software Features.
Click the Options… button. This opens the Output Options
dialog.
Check the check boxes for the data you want included in your
report.
In the Available Illum/Obs list box, highlight the illuminant
you want to select. Click the Include > button to move it to the
Selected Illum/Obs list box. Repeat this step for every
illuminant/observer you want for your report. (To remove an
illuminant/observer, simply highlight it in the Selected
Illum/Obs list box and click the Remove < button.)
Click the OK button. This returns to the Print Report dialog.
Click the Print… button.
7
Print a Conformance Report
A Conformance Report prints absolute data or difference data with
pass/fail indications for a set of samples. (Absolute data gives the values
for the samples. Difference data gives the delta values between a sample
and the standard.) It also allows you to print a header and a note on a cover
7-11
SECTION
SEVEN
page. The Conformance Report dialog allows you to select a set of samples
as well as enter your cover page header and note.
Steps:
To set up and print a conformance report, complete the following steps.
1.
2.
3.
4.
5.
6.
Click the Conformance… function in the Print Report pop up
window from the File menu. This opens the Conformance Report
dialog.
If you want a different sample set, click the Filter arrow button.
This opens the sample Filter dialog. To select a set of samples,
refer to the Finding Samples sub-section. To create a new filter,
refer to Section Ten—Advanced Software Features.
Select either the Absolute Mode or Difference Mode radio
button.
Enter your header in the Page Header entry field.
Enter your note in the Cover Page Note entry field.
Click the Print button.
Print a Complete Report
IMPORTANT: The “Complete Report” available with the software is a
specific report designed by X-Rite, Incorporated for the “Master” series
products. This report contains additional options not available in any other
report.
NOTE: You can not export a Complete Report.
The Complete Report is printed through the Print Complete Report dialog.
The Print Complete Report dialog allows you to select a set of samples,
determine the options to print, and preview the report. The following is a
list items in the Complete Report Options dialog. (This is the only report
that contains these options.)
•
•
•
•
•
•
•
•
7-12
Tristimulus Data
Reflectance Data
Density Data
Color Data
Status Density Data
Status
Notes
Tags
BASIC
•
•
•
•
•
•
•
•
•
•
•
•
•
•
•
TECHNIQUES
Strength
Metamerism
Lot ID
LabCh Data - You may select either CIELab data or Hunter data.
CMC Data - You may enter lightness and chroma values.
Difference Mode - This check box indicates you want difference
data. If not checked, the report contains absolute data.
Specular In (Specular Included - for spherical instruments only)
Specular Ex (Specular Excluded - for spherical instruments only)
Illuminant/Observers - These list boxes allow you to select
illuminant/observers for the data.
Metamerism - You may select a primary illuminant/observer and a
secondary illuminant/observer to compare metameric data.
Status Density Spectral and Spectral X data.
OK - This button accepts the print options and returns to the Print
Complete Report dialog.
Use as Default - This button uses the currently selected options as
the default options that are selected when opening this dialog.
Close - This button does not accept the print options and returns to
the Print Complete Report dialog.
Help - This button opens the Helpfile.
You may preview the Complete Report in the Print Preview dialog. This
dialog contains the following viewing functions.
•
•
•
•
•
•
•
| < - This button displays the first page of the report.
| > - This button displays the last page of the report.
< - This button displays the page previous to the current page.
> - This button displays the page after the current page.
Zoom In/Zoom Out - This button zooms in or out on the report.
Print - This button prints the report.
Close - This button closes the Print Preview dialog.
7
7-13
SECTION
SEVEN
Steps:
To print a complete report, complete the following steps.
1.
2.
3.
4.
5.
6.
7.
8.
9.
10.
11.
12.
13.
14.
15.
7-14
Click the Complete… function in the Print Report pop up
menu from the File pull down menu. This opens the Print
Complete Report dialog.
If you want a different sample set, click the Filter arrow button.
This opens the sample Filter dialog. To select a set of samples,
refer to the Finding Samples sub-section. To create a new filter,
refer to Section Ten—Advanced Software Features.
Click the Options… button. This opens the Complete Report
Options dialog.
Check the data check boxes for the data you want included in the
report.
Select either the CIELab or Hunter radio button.
Enter your CMC values for lightness (l) and chroma (c) in the l
and c entry fields.
If you want difference data, check the Difference Mode check
box.
Check the Specular data check boxes you want in the report.
Select your primary metameric illuminant/observer from the
Primary Illum/Obs drop down list.
Select your secondary metameric illuminant/observer from the
Secondary Illum/Obs drop down list.
In the Available Illum/Obs list box, highlight the illuminant
you want to select. Click the Include > button to move it to the
Selected Illum/Obs list box. Repeat this step for every
illuminant/observer you want for your report. (To remove an
illuminant/observer, simply highlight it in the Selected
Illum/Obs list box and click the Remove < button.)
Click the OK button. This returns to the Print Complete Report
dialog.
Click the Preview… button to open the Print Preview dialog.
Use the Preview buttons to preview the report. If you want to print
from the Print Preview dialog, click the Print button. This prints
the Complete Report. Otherwise, click the Close button to return
to the Print Complete Report dialog.
Click the Print button. This prints the Complete Report.
BASIC
TECHNIQUES
Create/Edit a Custom Report
The Custom Report function allows you to create and store a wide range of
customized reports for easy access. You customize a report by assigning it
specific characteristics. The Custom Reports dialog allows you to select an
existing report to print, to delete a report, and to access the Add Custom
Report and Edit Custom Report dialogs.
NOTE: Ink-Master provides four sample custom reports: Color Report
Export Example, Color Report Print Example, Statistics Export
Example, and Statistics Print Example.
The Add Custom Report dialog allows you to create a new report to add to
the selection. The Edit Custom Report dialog allows you to edit an existing
report. Custom report default options are assigned in the Custom Report
Options dialog. The following is a list of the default options available.
•
•
•
•
•
•
•
LabCh Data - You may select either CIELab data or Hunter data.
CMC Data - You may enter lightness and chroma values.
Difference Mode - This check box indicates you want difference
data. If not checked, the report contains absolute data.
Illuminant/Observers - These list boxes allow you to select
illuminant/observers for the data.
Metamerism - You may select a primary illuminant/observer and a
secondary illuminant/observer to compare metameric data.
OK - This button accepts the print options.
Close - This button does not accept the print options.
7
7-15
SECTION
7-16
SEVEN
BASIC
TECHNIQUES
Steps:
To add or edit a custom report, complete the following steps.
Click the Custom… function in the Print Reports pop up
menu from the File pull down menu. This opens the Custom
Reports dialog.
2. Choose to add a new custom report or edit an existing report.
• Click the Add… button. This opens the Add Custom Report
dialog.
• In the Custom Reports list box, highlight the report you
want to edit. Click the Edit… button. This opens the Edit
Custom Report.
3. Enter or edit the name of the report in the Report Title entry
field.
4. Enter or edit the filename and path of the report in the Report
Path entry line. (Click the … button to browse for the path. This
opens a standard Windows Open dialog. Refer to your Windows
documentation for more information.) You must select the same
directory path as the database you are using.
5. Choose to print or export the report.
• To print, select the Print radio button.
• To export, select the Export radio button. Select the file
format from the File Format drop down list. Enter the
filename and path of the export file in the File Path entry
line. (Click the … button to browse for the path. This opens a
standard Windows Open dialog. Refer to your Windows
documentation for more information.)
6. Click the Default Options… button. This opens the Custom
Report Calculation Methods dialog.
7. Select either the CIELab or Hunter radio button.
8. Enter your CMC values for lightness (l) and chroma (c) in the l
and c entry fields.
9. If you want difference data, check the Difference Mode check
box.
10. Select your primary metameric illuminant/observer from the
Primary Illum/Obs drop down list.
11. Select your secondary metameric illuminant/observer from the
Secondary Illum/Obs drop down list.
12. In the Available Illum/Obs list box, highlight the illuminant
you want to select. Click the Include > button to move it to the
Selected Illum/Obs list box. Repeat this step for every
1.
7-17
7
SECTION
SEVEN
illuminant/observer you want for your report. (To remove an
illuminant/observer, simply highlight it in the Selected
Illum/Obs list box and click the Remove < button.)
13. Click the OK button. This returns to the Add Custom Report or
Edit Custom Report dialog.
14. Click the OK button. This returns to the Custom Reports dialog.
Steps:
To delete a custom report, complete the following steps.
1.
2.
3.
4.
Click the Custom… function in the Print Report pop up menu
from the File pull down menu. This opens the Custom Reports
dialog.
Select the report you want to delete from the Custom Reports
list box.
Click the Delete… button. A confirmation dialog appears.
Click the Yes button to delete the custom report. Click the No
button if you do not want to delete the custom report.
Print/Export a Custom Report
A Custom Report may be printed or exported depending on how the
custom report is set up. You can only determine whether a report is printed
or exported in the Add Custom Report or Edit Custom Report dialog. Refer
to the Create/Edit a Custom Report sub-section. You may select specific
data options before printing or exporting a report. These options include all
of the default options discussed the Create/Edit a Custom Report subsection, with the addition of two types of data: the Strength wavelength,
and the Status Density Spectral and Spectral X wavelengths.
When printing a custom report, you may preview it in the Print Preview
dialog. This dialog contains the following viewing functions.
•
•
•
•
•
•
•
7-18
| < - This button displays the first page of the report.
| > - This button displays the last page of the report.
< - This button displays the page previous to the current page.
> - This button displays the page after the current page.
Zoom In/Zoom Out - This button zooms in or out on the report.
Print - This button prints the report.
Close - This button closes the Print Preview dialog.
BASIC
TECHNIQUES
Steps:
To print or export a custom report, complete the following steps.
1.
2.
3.
4.
5.
6.
7.
8.
9.
Click the Custom… function in the Print Report pop up
window from the File menu. This opens the Custom Report
dialog.
In the Custom Reports list box, highlight the report you want
to print or export.
Click the OK button. This opens either the Print Custom Report
or Export Custom Report dialog.
If you want a different sample set, click the Filter arrow button.
This opens the sample Filter dialog. To select a set of samples,
refer to the Finding Samples sub-section. To create a new filter,
refer to Section Ten—Advanced Software Features.
Click the Options… button. This opens the Custom Report
Calculation Methods dialog.
Edit any of the options.
Click the OK button. This returns to either the Print Custom
Report or Export Custom Report dialog.
For printing only, click the Preview… button to preview the
report printout.
To print the report, click the Print button. To export the report,
click the Export button.
USING THE NOTE EDITOR
The Note Editor allows you to enter and attach notes to items. If an item
can have a note attached to it, it provides one of two ways to open the Note
Editor, a Note… button or a Note arrow. The Note Editor contains a large
entry field to enter a note and a menu bar with two menus, File and Edit.
The File menu contains the following three functions.
•
•
•
Save and Exit - This function saves the note and exits the Note
Editor.
Print - This function prints the note to your standard default printer.
Exit - This function exits the Note Editor without saving any changes
to the note.
The Edit menu contains the following six functions.
•
Undo - This function will “un-do” the last change you made to the
note.
7-19
7
SECTION
SEVEN
•
•
•
•
•
Cut - This function deletes the highlighted selection of text and copies
it to the clipboard.
Copy - This function copies the highlighted selection of text to the
clipboard.
Paste - This function pastes the clipboard items into the note at the
insertion point (blinking cursor).
Clear - This function deletes the highlighted selection of text without
copying it to the clipboard.
Select All - This function selects the entire note.
Type your note
in this field.
Steps:
To create, edit, or delete a note in the Note Editor, complete the following
steps.
1.
2.
3.
4.
7-20
Click the Note button or arrow button. This opens the Note
Editor.
Click in the entry field to enter or edit the note in the entry field.
Use the Edit menu items to make any necessary changes. (To
delete a note, simply delete all the text and save the note.)
Select the Save and Exit function in the File menu to save a
new note or to save any changes to an existing note.
BASIC
TECHNIQUES
ADDING NOTES & TAGS TO A SAMPLE
Ink-Master helps you organize samples by allowing you to add notes and
tags to a sample. Adding notes and tags to a sample is done in the Notes &
Tags view window.
Steps:
To add notes and tags to a sample, complete the following steps.
1.
2.
3.
4.
5.
6.
7.
In the Controls window, click the Standard arrow button and
select the standard you want to display. Refer to the Finding a
Standard sub-section.
Select the Notes & Tags item in the View pull down menu.
This opens the Notes & Tags view window.
Use the Sample scroll bar in the Controls window to select a
sample.
In the Notes & Tags view window, click the Sample Notes
arrow button.
Enter or edit the sample’s note in the Note Editor. Refer to the
Using the Note Editor sub-section. When complete, the note
appears in the Sample Notes display area.
In the Notes & Tags view window, click the Sample Tags arrow
button. This opens the Select Tags dialog.
Highlight the tag you want to select in the Available Tags list
box and click the Include > button to move it to the Selected
7-21
7
SECTION
SEVEN
8.
9.
Tags list box. (To remove an ink from the Selected Tags list
box, highlight it and click the Remove < button.)
Repeat step 7 for each tag you want to attach. To create a new tag,
refer to Section Ten—Advanced Software Features.
Repeat steps 3 through 8 for each sample in the current sample
set.
ACCEPTING OR REJECTING A SAMPLE
Ink-Master allows you to record the visual assessment results of you or
your customer for every sample. Three determinations can be made:
accept, reject, or undetermined. These are assigned in the Controls
window. Recording this information enables visual tolerance editing. Refer
to Section Ten—Advanced Software Features.
NOTE: You may also choose to let Ink-Master automatically assign
acceptability to samples by selecting the Auto Assign item in the
Controls View Specific pull down menu. Refer to Section Nine—Viewing
Your Data for more information on View Specific menus.
Steps:
To assign acceptability to a sample, complete the following steps.
1.
2.
3.
4.
In the Controls window, click the Standard arrow button and
select the standard you want to display. Refer to the Finding a
Standard sub-section.
Use the Sample scroll bar in the Controls window to select a
sample.
Determine the acceptability of the sample by viewing the data, and
click the appropriate radio button, Accept, Reject, or
Undetermined.
Repeat steps 2 and 3 for each sample in the current sample set.
FINDING A STANDARD
There are five ways to find a standard 1) measure and find a standard 2)
search the database with a filter 3) search for a standard by its name 4)
search for a standard by Lot ID 5) or measure a different sample.
Measuring & Finding a Standard
Ink-Master allows you to measure in a color and find an existing standard
that is the closest match.
7-22
BASIC
TECHNIQUES
Steps:
To measure in a color to find a standard, complete the following steps.
1.
2.
3.
Select the Find Standard… function from the Database menu,
or select a Standards arrow button. This opens the Find
Standard dialog.
Select the Measure & Find… button. The software prompts you
for a measurement.
Take a measurement of the target standard color. The closest
match to the target is automatically displayed.
Searching with a Standard Filter
A Standard Filter allows you to find and select a standard that matches the
parameters of the filter’s search criteria. You can select a standard filter in
the Standard Search Definition dialog. Refer to Section Ten—Advanced
Software Features for creating, editing, or deleting standard filters.
Steps:
To search for and select a standard with a Standard Filter, complete the
following steps.
1.
2.
3.
4.
5.
Open the Standard Search Definition dialog by following either of
these steps.
• Select the Find Standard… function from the Database
menu, or select a Standards arrow button. This opens the
Find Standard dialog. Then select the Search… button. This
opens the Standard Search Definition dialog.
• Select the Standard Filters… function in the Edit Filters
pop up window from the Database menu. This opens the
Standard Search Definition dialog.
Highlight the filter you want to select.
Click the Search… button. The standards that fit the parameters
of the filter appear in the Search Results dialog. The Transfer…
button transfers all the standards out. Refer to Section Eight—
Managing Your Data.
Highlight the standard you want to select.
Click the OK button.
Finding a Standard by Name
Ink-Master allows you to search for the standard by its name. You can
either enter the entire name or the first portion of the standard’s name
7-23
7
SECTION
SEVEN
followed by an asterisk (for example, White* searches for all standards
beginning with “White”). You can also search for a standard for one
customer or for all the customers.
Steps:
To find a standard by its name, complete the following steps.
1.
2.
3.
4.
Select the Find Standard by Name… function from the
Database menu. This opens the Find Standard by Name dialog.
Enter the name in the Name entry field.
If desired, check the Across Customers to search across all the
customers.
Click the Find… button. The standard that matches the name is
automatically displayed.
Finding a Standard by Lot ID
Ink-Master allows you to search for a standard by a Lot ID. If you do not
enter a Lot ID, Ink-Master will find all the standards without Lot IDs.
Refer to Section Ten—Advanced Software Features for more information
on Lot ID’s. You must search for the Lot ID across all standards.
Steps:
To find a standard by Lot ID, complete the following steps.
1.
2.
3.
4.
5.
6.
Select the Find Lot ID… function from the Database menu.
This opens the Find Lot ID dialog.
Enter the Lot ID in the Lot ID entry field.
Check the Across Standards to search across all the standards.
Click the Find… button. This opens the Find Lot ID Results
dialog which displays the standards that match the Lot ID.
Highlight the desired standard.
Click the Select button.
Measuring a Different Sample
If you measure a sample that is significantly different from the current
standard, Ink-Master prompts you to find a new standard. If you choose to
do so, the software searches for standards that closely match the sample
you measured.
7-24
BASIC
TECHNIQUES
Steps:
To find a standard that matches your measured sample, complete the
following steps.
1.
2.
3.
4.
5.
6.
7.
Select Measure Trial… function from the Instrument menu.
This opens the Measure Trial dialog for the current standard.
Measure your sample. Refer to the Taking a Measurement subsection.
If Ink-Master finds a considerable color difference, the Create
Sample: Warning dialog opens and asks if you want to find a new
standard.
Click the Yes button. This opens the Search Results dialog
which lists the standards that are the closest matches to your
sample.
Highlight the desired standard. The Least Squares value
represents how close the highlighted standard’s spectral curve is
to the measured sample. The lower the number, the closer the
match.
If you want to transfer the standard out, click the Transfer…
button. Refer to Section Eight—Managing Your Data.
To select the desired standard, click the OK button. The selected
standard appears in the Controls window.
FINDING SAMPLES
There are two ways to find a set of samples: by using a sample filter or by
searching by its Lot ID.
Using a Sample Filter
A Sample Filter allows you to select a set of samples (trials and matches)
that share the common parameters of the filter’s search criteria. Refer to
Section Ten—Advanced Software Features for creating, editing, or
deleting sample filters.
Steps:
To select a Sample Filter, complete the following steps.
1.
2.
Select the Sample Filters… function in the Edit Filters pop up
window from the Database menu, or click the Filter arrow
button in the Controls window. This opens the Filters dialog.
Highlight the filter you want to select.
7-25
7
SECTION
SEVEN
3.
Click the Select button. The samples that fit the parameters of
the filter are automatically displayed.
Finding Samples by Lot ID
Ink-Master allows you to search for samples by a Lot ID. If you do not
enter a Lot ID, Ink-Master will find all the samples without Lot IDs. You
can also search for samples for one standard or for all the standards. Refer
to Section Ten—Advanced Software Features for more information on Lot
ID’s.
Steps:
To find samples by Lot ID, complete the following steps.
1.
2.
3.
4.
7-26
Select the Find Lot ID… function from the Database menu.
This opens the Find Lot ID dialog.
Enter the Lot ID in the Lot ID entry field.
If desired, check the Across Standards to search across all the
standards.
Click the Find… button. The samples that match the Lot ID are
automatically displayed.
CHAPTER 8 SECTION EIGHT
Managing Your Data
Section Contents
Copying & Pasting Data .........................8-2
Downloading Data..................................8-3
Uploading Data ......................................8-13
Exporting Standards & Inks....................8-15
Transferring Data...................................8-18
Backing Up Your Database ....................8-22
Restoring Your Database .......................8-23
Section Eight provides information about the functions that allow you to
properly manage your data and your database—copying, pasting,
downloading, uploading, exporting, transferring, backing up, and
restoring. These functions seem similar, but each one performs a specific
task for managing your data.
8-1
8
S E C T I O N
E I G H T
COPYING & PASTING DATA
Ink-Master allows you to copy and paste two types of data: standards and
samples. The data copied to the clipboard is similar for standards and
samples (name, reflectance data, date/time, notes/tags, etc.). This allows
the data to be pasted back into Ink-Master as either a standard or a sample.
Data can also be pasted into spreadsheets or word processors as well as
other X-Rite applications that use the same geometry (spherical to
spherical or 0°/45° to 0°/45°).
Copying Standards & Samples
Standards and samples are copied in the same manner. When the copy
function is selected, the data is moved to the clipboard. Tolerance data does
not copy when a standard is copied. Samples can be copied only one at a
time.
Steps:
To copy a standard or a sample, complete the following steps.
1.
2.
3.
Select the Copy… function from the Edit menu. This opens the
Select Data Type dialog.
Click either the Standard radio button or the Sample radio
button.
Click the OK button. The data is copied to the clipboard.
Pasting Standards
When pasting data as a standard, you may add the data in the clipboard as
a new standard, or you may replace/edit the current standard data with the
data in the clipboard. If you choose create a new standard, you need to
enter the standard name and select the customer. If you choose to
replace/edit the current standard, you can either overwrite the current
standard or save it under an alternate description. For more information
about alternate standards, refer to Section Ten—Advanced Software
Features.
Steps:
To paste data as a standard, complete the following steps.
1.
2.
3.
8-2
Click the Paste… button. This opens the Select Data Type
dialog.
Click the Standard radio button.
Click the OK button. This opens the Select Paste Operation
dialog.
MANAGING
4.
5.
YOUR
DATA
To create a new standard, follow these steps.
• Click the Create new standard radio button.
• Click the OK button. This opens the New Standard Name
dialog.
• Select the desired customer from the Customer drop down
list.
• Enter the new standard name in the Name entry field.
• Click the OK button.
To replace or edit the current standard, follow these steps.
• Click the Replace current standard radio button.
• Click the OK button. This opens the Standard Description
dialog.
• To save the new standard under an alternate description, click
the Yes button and enter the new standard description in the
Standard Description dialog. Click OK. For more information
about alternate standard descriptions, refer to Section Ten—
Advanced Software Features.
• To overwrite the existing standard, click the No button.
Pasting Samples
When pasting data as a sample, the sample is placed in the proper
chronological order of the current sample set.
Steps:
To paste data as a sample, complete the following steps.
1.
2.
3.
4.
Click the Paste… button. This opens the Select Data Type
dialog.
Click the Sample radio button. This opens the Select Formula
dialog.
Select the desired formula with the Formula scroll bar. To edit
the formula, click the Formula arrow button and refer to Section
Ten—Advanced Software Features.
Click the OK button.
DOWNLOADING DATA
Downloading is the process of transferring data to the instrument. You
may either download Group Names or Standards. This function aids in
remote use of your instrument by setting the instrument into the
measurement storage mode for group names or standards. The Group
Names download function provides you with a method of organizing the
8-3
8
S E C T I O N
E I G H T
remotely measured samples into groups. The Standards download function
provides a method of referencing samples measured against your existing
standards. The instrument can automatically detect the nearest standard
and can provide immediate pass/fail information.
Below is a chart of the maximum downloads per instrument.
Instrument:
938
968
978
SP68
SP78
SP88
Maximum
Group Names:
Maximum
Standards:
20
20
20
20
20
20
24
24
none
50
none
200
Download Group Names
Group Names are entered into entry fields and downloaded to the
instrument.
Steps:
To download group names, complete the following steps.
1.
2.
3.
4.
5.
Be sure your instrument is properly connected to the computer. If
unsure, refer to Section Two—Instrument Setup & Calibration.
Select the Group Names… function in the Download pop up
menu from the Instrument pull down menu. This opens the
Download Group Names dialog.
Enter the group names (one name per entry field). A maximum of
16 characters is allowed per name.
When all names are entered, click the Download button.
When the successful download message appears, disconnect your
instrument from the computer and take your measurements.
Download Standards
Ink-Master allows you to select standards to download to the instrument.
Steps:
To download standards, complete the following steps.
1.
2.
8-4
Be sure your instrument is properly connected to the computer. If
unsure, refer to Section Two—Instrument Setup & Calibration.
Select the Standards… function in the Download pop up
menu from the Instrument pull down menu. This opens the
Download Standards dialog.
MANAGING
3.
4.
5.
6.
7.
YOUR
DATA
In the Customer list box, highlight the appropriate customer.
In the Standards list box, highlight the standard you want to
download.
Click the Include button to move the standard to the Marked
for Download list box. (To remove a standard from the Marked
for Download list box, highlight it in this list box and click the
Remove button.) Repeat steps 4 and 5 for each standard you
want to download.
When all desired standards are marked for download, click the
Download button.
When the successful download message appears, disconnect your
instrument from the computer and take your measurements.
NOTE: When a bar code reader (BCR) is used in conjunction with a
sphere instrument, the first scanned bar code can be assigned as the sample
“Lot ID.”
Instrument Key Operation
The procedures described on the following pages illustrate the selection
techniques and stored sample deletion procedures for 0°/45° and sphere
instruments, using group name storage. The 0°/45° instrument will be
shown first followed by the sphere instrument. It also shows you how to
view downloaded standards
0°/45° Key Operation (Using Group Name Storage)
1.
The first group name will be displayed on the instrument.
Measure the samples for the displayed group, or advance to Step 2
to select a different group name.
SAMPLE 0 OF 99
GREEN #100
8-5
8
S E C T I O N
E I G H T
2.
To select a different group name, press the "Right-hand" key on
the instrument twice.
SAMPLE 0 OF 99
GREEN #100
Press
GREEN #100
↓NO NEW GROUP↓
Press
3.
Delete
Mode
Press the "Down arrow" key or "Up arrow" key to select group
name.
GREEN #100
EXI T ↓SELECT ↑
4.
Select Group
Name
After the desired group name is displayed, press the "Exit" key to
set the instrument back in storage mode.
GREEN #100
EXI T ↓SELECT ↑
Press
5.
Measure samples.
0°/45° Sample Deletion (Using Group Name Storage)
The spectrophotometer will allow measurements to be deleted from the
stored memory in the instrument before data is uploaded to Ink-Master.
This option is useful if a measurement is inadvertently taken or you want to
8-6
MANAGING
YOUR
DATA
remove a sample measurement. There are two methods to remove stored
samples from the instrument: Delete Last or Clear All. Delete Last allows
the last measurement taken to be deleted. Clear All will remove all stored
measurements from the instrument.
1.
Press "Right-hand" key.
SAMPLE 2 OF 99
GREEN #100
Press
2.
Press "Left-hand" key.
GREEN #100
↓NO NEW GROUP↓
Press
8-7
8
S E C T I O N
E I G H T
Delete Last Measurement
3.
Press "Right-hand" key to delete last measurement taken.
Note: This step can be repeated to continually delete the last
measurement. (If "NO" is selected, press "Left-hand" key and
advance to step 4.)
DELETE LAST?
NO
2
YES↓
↓
Press
To
Step 4
LAST DELETED
DELETE LAST?
1
YES↓
↓NO
NOTE: To get to the Delete Last menu when standards are downloaded,
press the "Middle" key and "Left-hand" key simultaneously. Then press the
"Right-hand" key. Measurements can only be deleted in order (last to first),
not by group name. The instrument will beep twice and display "LAST
DELETED START OF GROUP" after the last sample of a group is
deleted.
8-8
MANAGING
YOUR
DATA
Clear All Data
4.
Press "Right-hand" key to clear all stored measurement data
taken. (If "NO", press "Left-hand" key to return to normal storage
mode.)
CLEAR ALL?
2
YES↓
↓NO
Press
Storage
Mode
DATA CLEARED
SAMPLE 0 OF 99
GREEN #100
Sphere Key Operation (Using Group Name Storage)
1.
The first group name will be displayed on the instrument.
Measure the samples for the displayed group, or advance to Step 2
to select a different group name.
GREEN #100
STORED:
0
STORES REMAI NI NG: 999
menu vi ew next
edi t
8-9
8
S E C T I O N
E I G H T
2.
3.
To select a different group name, press the [next] key on the
instrument.
GREEN #100
STORED:
0
STORES REMAI NI NG: 999
menu vi ew next
edi t
Press
Measure samples.
GREEN #200
STORED:
0
STORES REMAI NI NG: 999
menu vi ew next
edi t
Sphere Sample Deletion (Using Group Name Storage)
The spectrophotometer will allow measurements to be deleted from the
stored memory in the instrument before data is uploaded to Ink-Master.
This option is useful if a measurement is inadvertently taken or you want to
remove a sample measurement. There are two methods to remove stored
samples from the instrument: Delete Last or Delete All. Delete Last
allows the last measurement taken to be deleted. Delete All will remove all
stored measurements from the instrument.
1.
Press [edit] key.
GREEN #100
STORED:
2
STORES REMAI NI NG:
menu vi ew next
997
edi t
Press
8-10
MANAGING
2.
YOUR
DATA
Press [del] key.
8
SELECT EDI T OPTI ON
exi t
3.
del
pr i nt
Press
Press [last] key to delete last measurement taken. Press [all] key
to delete all stored samples in the instrument.
SELECT
DELETE MODE
exi t
al l
gr oup l ast
NOTE: Samples cannot be deleted by group, all samples are stored in the
same group. Refer to the instrument’s Operation Manual for a more
detailed explanation on deletion if required.
Viewing Downloaded Standard Data (Sphere Instruments only)
Sphere instruments allow you to view the downloaded standard name and
data. This feature is desirable if you want to verify the standard used in a
sample comparison.
To view standard name:
1.
At storage menu level, press [edit] key.
DATA GROUP 1
STORED:
1
STORES REMAI NI NG: 998
menu vi ew next
edi t
Press
8-11
S E C T I O N
E I G H T
2.
Press the [ref##] key.
SELECT EDI T OPTI ON
exi t
r ef 01
del
pr i nt
Press
The standard name used (20 characters max.) for the sample
measured will display.
DK BLUE #245
TOLERANCE MODE
exi t
3.
↓ r ef 01 ↑
edi t
After viewing standard data, press [exit] to return to storage
mode.
To view standard data:
1.
At storage menu level, press [menu] key.
DATA GROUP 1
STORED:
1
STORES REMAI NI NG: 998
menu vi ew next
edi t
Press
8-12
MANAGING
2.
DATA
Press [norm] key in MENU PAGE 1.
MENU PAGE 1
menu
pg2
3.
YOUR
nor m
8
pass
f ai l s t or e
Press
Press the [ref##] key.
*
I NCLUDED
c∆L
−. 61
*
∆C
c
+. 92
*
∆H
c
+. 85
10
menu c∆Ec mc D65
r ef 01
Press
The standard values and name (10 characters max.) used for the
last sample measurement will displayed.
*
REFERENCE
L
−. 61
*
C
.
92
DK BLUE #2
+
*
H
+. 85
menu
edi t
↓ r ef 01 ↑
4.
After viewing standard data, press [exit], [menu], and [store]
keys to return to storage mode.
UPLOADING DATA
Uploading is the process of transferring data from the instrument to the
Ink-Master software. This function allows you to retrieve stored data that
was remotely measured. The upload function is dependent upon the type of
download function that was used to set the instrument into measurement
storage mode. You may upload either Group Names or Standards.
Upload Group Names
If you downloaded with the Group Names function, the Upload Group
Names dialog automatically opens upon activating this function. Each
group of measurements is then individually uploaded into the selected
standard. Tags can be attached to the uploaded samples if required.
8-13
S E C T I O N
E I G H T
NOTE: Grayed groups can not be uploaded. A group is grayed if no stored
data exists or if the group has already been uploaded.
Steps:
To upload group names, complete the following steps.
1.
2.
3.
4.
5.
6.
7.
8.
Connect the instrument to the computer. Refer to Section Two—
Instrument Setup & Calibration.
Select the Upload… function from the Instrument menu. This
opens the Upload Group Names dialog.
In the Select Group to Upload area, select the group radio
button for the group you want to upload.
Click the Select Standard button. This opens the Find Standard
dialog.
Find and select the desired standard. Refer to Section Seven—
Basic Techniques.
Click the Sample Tag arrow button to attach tags to the samples
in the selected group. Refer to Section Ten—Advanced Software
Features.
Click the Upload button.
Repeat steps 3 through 7 for each group you want to upload.
Upload Standards
If you downloaded with the Standards function, the Upload Standards
dialog automatically opens upon activating this function. Ink-Master
allows you to select standards to upload. Once a standard is uploaded, InkMaster automatically selects the closest standard match from the database.
The last formula (trial or match) in the standard is then displayed in the
Select Formula dialog. If more than one match formula exists in the
standard, you need to select the correct formula.
NOTE: When a bar code reader (BCR) is used in conjunction with a
sphere instrument, the first scanned bar code can be assigned as the sample
“Lot ID.”
Steps:
To upload standards, complete the following steps.
1.
8-14
Connect the instrument to the computer. Refer to Section Two—
Instrument Setup & Calibration.
MANAGING
2.
3.
4.
5.
6.
YOUR
DATA
Select the Upload… function from the Instrument menu. This
opens the Upload Standards dialog.
For sphere instruments with BCR only, check the Assign Tag#1
as Lot ID check box if you want the first scanned tag to be used
as the sample ID during upload.
Click the Upload button. This opens the Select Formula dialog.
If the formula displayed is not the correct formula, select the
correct formula.
• Use the Formula scroll bar to select the correct formula.
• If you need to edit the formula, click the Formula arrow
button. This opens the Edit Trial Formula dialog. Edit the
formula. Refer to Section Ten—Advanced Software Features.
• Click the OK button. This returns to the Upload Standards
dialog.
Repeat steps 4 and 5 for each standard to upload.
EXPORTING STANDARDS & INKS
Ink-Master allows you to export standard or ink data to use in a
spreadsheet program such as Microsoft® Excel.
Export a Standard
When exporting a standard, you must determine the location of the export
file and the type of data included in the export file.
Ink-Master allows you to select output options for the data in the Output
Options dialog. The following is a list of the output options available.
Select an output option by checking its check box. (Illuminants must be
selected from list boxes.)
•
•
•
•
•
•
L*a*b* Data - When checked, the export file contains L*a*b* data.
Reflectance Data - When checked, the export file contains
reflectance data.
Difference Mode - When checked, the data reflects difference
values. When un-checked, the data reflects absolute values. (Absolute
data gives the values for the samples. Difference data gives the delta
values between a sample and the standard.)
Lot # - When checked, the export file contains the Lot ID.
Specular Included - For spherical instruments only, the export file
contains specular included data.
Specular Excluded - For spherical instruments only, the export file
contains specular excluded data.
8-15
8
S E C T I O N
E I G H T
•
Illuminant/Observer - A set of data exports for each selected
illuminant/observer pair.
NOTE: To use a file name extension other than .wks, you must specify the
extension in the Export dialog’s File Name entry field.
Steps:
To export a standard, complete the following steps.
1.
2.
3.
4.
8-16
In the Controls window, click the Standard arrow button. This
opens the Find Standard dialog.
Find and select the standard you want to export. Refer to Section
Seven—Basic Techniques.
Once the desired standard is selected, select the Standards…
function in the Export pop up menu from the File menu. This
opens the Export dialog.
Click the Filter arrow button. This opens the sample Filters
dialog.
MANAGING
YOUR
DATA
5.
Find and select the sample set you want to export with your
standard. Refer to Section Seven—Basic Techniques.
6. Click the Options button. This opens the Output Options dialog.
7. Check all the desired data check boxes.
8. Highlight the illuminant/observer you want to select in the
Available Illum/Obs list box and click the Include > button to
move it to the Selected Illum/Obs list box. (To remove an ink
from the Selected Illum/Obs list box, highlight it and click the
Remove < button.)
9. Repeat step 8 for each illuminant/observer pair you want in your
export file.
10. Once all the options are selected, click the OK button. This
returns to the Export dialog.
11. Determine the location of your export file.
• If you need to map to a network drive, click the Network
button and map the network drive. Refer to your Windows
documentation for more information.
• Select the drive from the Drives drop down list.
• Select the directory in the Directories list box.
• Select the file name extension from the List Files of Type
drop down list.
• Enter the file name in the File Name entry field.
12. Click the Export button.
Export an Ink
When exporting an ink, you must determine the location of the export file.
NOTE: To use a file name extension other than .wks, you must specify the
extension in the Export Ink dialog’s File Name entry field.
8-17
8
S E C T I O N
E I G H T
Steps:
To export an ink, complete the following steps.
1.
2.
3.
4.
5.
Select the Inks… function in the Export pop up menu from the
File menu. This opens the Export Ink dialog.
In the Calibration Sets list box, highlight the calibration set
that contains the ink you want to export. This lists all the inks for
the calibration set in the Inks list box.
In the Inks list box, highlight the ink you want to export.
Click the Export… button. This opens the Export File As dialog.
Determine the location of your export file.
• If you need to map to a network drive, click the Network
button and map the network drive. Refer to your Windows
documentation for more information.
• Select the drive from the Drives drop down list.
• Select the directory in the Directories list box.
• Select the file name extension from the List Files of Type
drop down list.
• Enter the file name in the File Name entry field.
• Click the OK button. The ink is exported.
TRANFERRING DATA
Ink-Master allows you to transfer standard or calibration set data in and
out of the software so that you can use the data in conjunction with XRite’s QA-Master software.
8-18
MANAGING
YOUR
DATA
Transfer Out a Standard
When transferring out a standard, you must determine the location of the
transfer file. You can use one of two different file name extensions: .mif
(for X-Rite applications) or .txt (ASCII text file).
Steps:
To transfer out a standard, complete the following steps.
1.
2.
3.
4.
5.
In the Controls window, click the Standard arrow button. This
opens the Find Standard dialog.
Find and select the standard you want to export. Refer to Section
Seven—Basic Techniques.
Once the desired standard is selected, select the Standards…
function in the Transfer Out pop up menu from the File menu.
This opens the Transfer Out dialog.
Click the Filter arrow button. This opens the sample Filters
dialog.
Find and select the sample set you want to transfer out with your
standard. Refer to Section Seven—Basic Techniques.
8-19
8
S E C T I O N
E I G H T
If you need to map to a network drive, click the Network button
and map the network drive. Refer to your Windows
documentation for more information.
7. Select the drive from the Drives drop down list.
8. Select the directory in the Directories list box.
9. Select the file name extension from the List Files of Type drop
down list.
10. Enter the file name in the File Name entry field.
11. Click the Transfer button.
6.
Transfer Out a Calibration Set
When transferring out a calibration set, you must determine the location of
the transfer file.
NOTE: A calibration set is transferred out as a .mif file only.
Steps:
To transfer out a calibration set, complete the following steps.
1.
2.
3.
8-20
Select the Calibration Set… function in the Transfer Out pop
up menu from the File menu. This opens the Transfer Calibration
Set dialog.
In the Calibration Sets list box, highlight the calibration set
that you want to transfer out.
Click the Transfer… button. This opens the Transfer Out File As
dialog.
MANAGING
4.
5.
6.
7.
8.
YOUR
DATA
If you need to map to a network drive, click the Network button
and map the network drive. Refer to your Windows
documentation for more information.
Select the drive from the Drives drop down list.
Select the directory in the Directories list box.
Enter the file name in the File Name entry field.
Click the OK button.
Transfer In a Standard or Calibration Set
Ink-Master allows you to transfer in standards and calibration sets. Only
.mif files can be transferred into Ink-Master.
Update Prompts
If transferring in a standard or a calibration set with data that already
exists in your database, Ink-Master prompts you to determine whether or
not to update the data. In the prompt dialog, Yes updates the data with the
transfer data; Yes to All updates all data while transferring in without any
further prompts; No does not update the data while transferring in; No to
All does not update any of the data while transferring in without any
further prompts. Cancel cancels the transfer in process.
Steps:
To transfer in a standard or a calibration set, complete the following steps.
1.
2.
Select the Transfer In… function from the File menu. This
opens the Select Transfer In File dialog.
Choose the file to transfer in, and determine the location of the
file.
8-21
8
S E C T I O N
E I G H T
•
3.
4.
If you need to map to a network drive, click the Network
button. Refer to your Windows documentation for more
information about this function.
• Select the drive from the Drives drop down list.
• Select the directory in the Directories list box.
• Enter the file name in the File Name entry field, or highlight
the file in the File Name list box.
• Click the OK button. Ink-Master prompts you to determine
whether or not you want to attach any tags to your data.
If you want to attach tags to the transfer in data, click the Yes
button. This opens the Select Tags dialog. Refer to Section Ten—
Advanced Software Features.
If you are transferring in any data that already exists, answer all of
the update prompts. See the beginning of this sub-section for more
information about Update Prompts.
BACKING UP YOUR DATABASE
The Backup Database… function compresses the Ink-Master database
(by more than 50%) so you can easily store most databases on a few floppy
disks. The procedure is very flexible; any available drive and directory can
be selected. If desired, it automatically creates new directories during
backup.
NOTE: This backup function overwrites any database files that exist in the
backup file destination or directory.
Backup Strategy
The accuracy of your data is the key ingredient to maintaining quality
assurance with your Ink-Master software. To protect yourself against data
loss, your database should be backed up on a regular basis. A disciplined
schedule of backups is an essential part of this process. We suggest the
following strategy for backing up your data.
This method is a cost-effective system for securing your data over a 12
week period (rolling backup). At least ten disks are required, allowing you
to retrieve data up to three months old. (Additional disks may be required
for months with five Fridays, or if your database backup is larger than one
disk.)
NOTE: If you have both 0°/45° and spherical data, you should create a
strategy for each type of database.
8-22
MANAGING
Disk #
1
2
3
4
5
6
7
8
9
10
11
YOUR
DATA
8
Disk Label
Monday
Tuesday
Wednesday
Thursday
Friday 1
Friday 2
Friday 3
Month 1
Month 2
Month 3
Friday 4
The Backup Cycle:
1.
2.
3.
4.
5.
6.
Start the cycle on a Friday evening and backup your database onto
the disk labeled Friday 1.
On Monday, backup the database onto the disk labeled Monday.
Repeat the process on Tuesday, Wednesday, and Thursday using
the corresponding disks.
On Friday, backup the database onto the disk labeled Friday 2.
Repeat step 2, but when it comes to Friday again, use the disk
labeled Friday 3 for the complete weekly back up.
Repeat step 2 again, but when it comes to Friday, use the disk
labeled Month 1 for the complete monthly back up.
Repeat steps 2 through 4, but at the end of the fourth week use the
disk labeled Month 2 for the complete monthly back up.
Repeat steps 2 through 4, but at the end of the fourth week use the
disk labeled Month 3 for the complete monthly back up.
You now have a complete record of 12 weeks of data, and the same
rotation cycle can start again.
Steps:
To backup your Ink-Master database, complete the following steps.
1.
2.
Select the Backup Database… function from the File menu.
This opens the Backup Database dialog.
Enter the directory path of the database you want to backup in the
Backup From entry field or select the path using the Drives
drop down list and Backup From list box.
8-23
S E C T I O N
E I G H T
3.
4.
Enter the directory path of the database backup location in the
Backup To entry field or select the path using the Drives drop
down list and Backup To list box.
Select the Backup… button.
RESTORING YOUR DATABASE
The Restore Database… function decompresses the Ink-Master
database from a backup file.
NOTE: This backup function overwrites any database files that exist in the
restore file destination or directory.
Steps:
To restore your Ink-Master database, complete the following steps.
1.
2.
3.
4.
8-24
Select the Restore Database… function from the File menu.
This opens the Restore Database dialog.
Enter the directory path of the database you want to restore in the
Restore From entry field or select the path using the Drives
drop down list and Restore From list box.
Enter the directory path of the database restore location in the
Restore To entry field or select the path using the Drives drop
down list and Restore To list box.
Select the Restore… button.
CHAPTER 9 SECTION NINE
Viewing Your Data
9
Section Contents
View Menu.............................................9-2
Window Menu........................................9-2
View Specific Menu ...............................9-4
Tolerance View ......................................9-5
Controls View.........................................9-5
L*A*B* View ...........................................9-7
FMC2 View ............................................9-9
Spectral View.........................................9-11
Status Density View ...............................9-13
Trend View ............................................9-15
L*A*B* Data View...................................9-17
Spectral Data View ................................9-18
Status Density Data View.......................9-19
Formula View.........................................9-20
Notes & Tags View.................................9-21
Visual Color View...................................9-23
Verbal Color View ..................................9-24
Indices View...........................................9-25
Delete All ...............................................9-27
Section Nine discusses the functions that allow you to display your data in
various “views.” The following views are found in the View menu:
Tolerance, Controls, L*a*b*, FMC2, Spectral, Status Density, Trend,
L*a*b* Data, Spectral Data, Status Density Data, Formula, Notes & Tags,
Visual Color, Verbal Color, Indices, and Delete All.
This section also provides information about the Window menu items as
well as View Specific items. Window menu items help you to determine
how you want to display your “views” on the Ink-Master screen. View
Specific items allow you to perform functions specific to the “view” or
window that has focus.
9-1
SECTION
NINE
VIEW MENU
Each “view” has its own window that is displayed on the Ink-Master
screen. This window displays the data for the item that is selected from the
View pull down menu. Each window can be maximized or minimized.
(The Controls window can be minimized only.) A window is minimized to
the lower left-hand corner of the Ink-Master screen.
NOTE: Each view’s View Specific menu item(s) are explained with the
view description.
Steps:
To display a view, simply select the appropriate item from the View pull
down menu.
WINDOW MENU
The Window menu allows you to arrange the view windows in a cascade or
tile format. It also allows you to arrange minimized icons and to select the
next available view window.
Steps:
To activate a Window menu function, simply select the item from the
Window pull down menu, or, if available, use the function’s short-cut
keys.
9-2
V I E W I N G
Y O U R
D A T A
Cascade
The Cascade function arranges the displayed view windows (except the
Controls window) in a stacked order. See below. The short-cut keys for this
function are Shift+F5.
9
9-3
SECTION
NINE
Tile
The Tile function arranges the displayed view windows (except the
Controls window) so each window fits in the Ink-Master screen. See below.
The short-cut keys for this function are Shift+F4.
NOTE: Tile is the default setting.
Arrange Icons
The Arrange Icons function automatically arranges the minimized view
windows in the lower left-hand corner of the Ink-Master screen.
Next Window
The Next Window function shifts the focus from one view window to
another. The short-cut keys for this function are Ctrl+Tab.
VIEW SPECIFIC MENU
The View Specific menu provides functions that are specific to the view
window that has focus. For example, if you click on the Controls window,
this gives the Controls window focus, and the Controls View Specific
menu appears in the menu bar.
9-4
V I E W I N G
Y O U R
D A T A
NOTE: Each view’s View Specific menu item(s) are explained with the
view description.
TOLERANCE VIEW
The Tolerance pop up menu items, L*a*b* and Trend, display all the
available tolerances preset for the displayed standard. The tolerances are
displayed as L*a*b* and FMC2 graphs or Trend graphs. If a different
standard is selected, the screen does not change unless Auto L*a*b* or
Auto Trend is activated. To activate Auto L*a*b* or Auto Trend, refer to
the Display options in Section Four—Setting Up Your Software.
CONTROLS VIEW
The Controls item displays the Controls window. The Controls window
items are described in Section Three—User Interface. To determine which
items appear in the Controls window, refer to the Display options in
Section Four—Setting Up Your Software.
9-5
9
SECTION
9-6
NINE
V I E W I N G
Y O U R
D A T A
Controls Menu
The Controls menu contains the following functions:
•
•
•
•
Delete Sample - This function deletes the sample currently selected
in the Controls window. A confirmation dialog appears once this
function is selected. Click the OK button to delete the sample.
Delete Set - This function deletes the entire sample set currently
selected in the Controls window. A confirmation dialog appears once
this function is selected. Click the OK button to delete the sample set.
Print - This function prints the Controls window.
Auto Assign - This function automatically assigns an Accept or
Reject status to the currently selected sample based on it’s Pass/Fail
status. A check mark appears next to this menu item when it is active.
Steps:
To select a Controls menu function, simply select the item from the
Controls pull down menu.
L*a*b* VIEW
For a 0°/45° Instrument, the L*a*b* item displays the L*a*b* window.
For a sphere instrument, L*a*b* data is displayed through the following
L*a*b* pop up menu items:
•
•
•
Specular Included - displays included data in an L*a*b* window.
Specular Excluded - displays excluded data in an L*a*b* window.
Both - displays included data in an L*a*b* window and excluded
data in another L*a*b* window.
An L*a*b* window contains the selected sample (green = pass, red = fail)
and standard with the selected illuminant/observer in an L*a*b* color
space graph. It contains the CMC tolerance, the Delta Difference, and the
tolerance values. The + (plus) button increases the viewing scale and the (minus) button decreases the viewing scale. The viewing scale ranges from
1 to 200 times (1, 2, 5, 10, 20, 100, and 200).
9-7
9
SECTION
NINE
L*a*b* Menu
The L*a*b* menu contains the following functions:
•
•
•
9-8
Illum/Obs - This function allows you to select an illuminant/observer
pair to use in the selected L*a*b* window. A standard list of
illuminant/observer pairs is available, as well as a selection for the
Controls window illuminant/observer pair: Controls. A check mark
indicates the selected illuminant/observer.
Zoom In - This function increases the viewing scale, allowing a
closer view of the L*a*b* graph. It performs the same function as the
+ (plus) button in the L*a*b* window.
Zoom Out - This function decreases the viewing scale. It performs
the same function as the - (minus) button in the L*a*b* window.
V I E W I N G
•
•
•
•
Y O U R
D A T A
Auto Scale - This function automatically scales the L*a*b* graph
according to the selected sample. A check mark appears next to this
menu item when it is active.
Scatter Plot - This function displays all the samples in the sample
set on one L*a*b* graph. The currently selected sample is highlighted
either green (pass) or red (fail). A check mark appears next to this
menu item when it is active.
Copy - This function copies the L*a*b* graph to the clipboard.
Print - This function prints the L*a*b* window.
Steps:
To select an L*a*b* menu function, simply select the item from the
L*a*b* pull down menu.
FMC2 VIEW
For a 0°/45° Instrument, the FMC2 item displays the FMC2 window. For
a sphere instrument, L*a*b* data is displayed through the following
FMC2 pop up menu items:
•
•
•
Specular Included - displays included data in an FMC2 window.
Specular Excluded - displays excluded data in an FMC2 window.
Both - displays included data in an FMC2 window and excluded data
in another FMC2 window.
An FMC2 window contains the selected sample (green = pass, red = fail)
and standard with the selected illuminant/observer in a color space. It
contains the L*C*H* tolerance, the Delta Difference, and the tolerance
value. The + (plus) button increases the viewing scale and the - (minus)
button decreases the viewing scale. The viewing scale ranges from 1 to 200
times (1, 2, 5, 10, 20, 100, and 200).
9-9
9
SECTION
NINE
FMC2 Menu
The FMC2 menu contains the following functions:
•
•
•
9-10
Illum/Obs - This function allows you to select an illuminant/observer
pair to use in the selected FMC2 window. A standard list of
illuminant/observer pairs is available, as well as a selection for the
Controls window illuminant/observer pair: Controls. A check mark
indicates the selected illuminant/observer.
Zoom In - This function increases the viewing scale, allowing a
closer view of the FMC2 graph. It performs the same function as the +
(plus) button in the FMC2 window.
Zoom Out - This function decreases the viewing scale. It performs
the same function as the - (minus) button in the FMC2 window.
V I E W I N G
•
•
•
•
Y O U R
D A T A
Auto Scale - This function automatically scales the FMC2 graph
according to the selected sample. A check mark appears next to this
menu item when it is active.
Scatter Plot - This function displays all the samples in the sample
set on one FMC2 graph. The currently selected sample is highlighted
either green (pass) or red (fail). A check mark appears next to this
menu item when it is active.
Copy - This function copies the FMC2 graph to the clipboard.
Print - This function prints the FMC2 window.
Steps:
To select an FMC2 menu function, simply select the item from the
FMC2 pull down menu.
SPECTRAL VIEW
For a 0°/45° Instrument, the Spectral item displays the Spectral window.
For a sphere instrument, spectral data is displayed through the following
Spectral pop up menu items:
•
•
•
Specular Included - displays included data in a Spectral window.
Specular Excluded - displays excluded data in a Spectral window.
Both - displays included data in a Spectral window and excluded data
in another Spectral window.
A Spectral window displays either reflectance or density data for the
selected sample (green = pass, red = fail) and standard (white) as spectral
curves in 10 Nanometer increments. The type of spectral data, reflectance
or density, is determined in the Spectral View Specific menu.
9-11
9
SECTION
NINE
Spectral Menu
The Spectral menu contains the following functions:
•
•
•
9-12
Reflectance - This function displays the spectral data as Reflectance
values on a curve. A check mark appears next to this menu item when
it is active. The short-cut keys for this function are Ctrl+R.
Density - This function displays the spectral data as Density values
on a curve. A check mark appears next to this menu item when it is
active. The short-cut keys for this function are Ctrl+D.
Scale - This function opens the Rescale Graph dialog which allows
you to enter the lower reflectance or density value in the Lower entry
field and the upper reflectance or density value in the Upper entry
field. Check the Auto Scale check box to let Ink-Master
V I E W I N G
•
•
•
•
•
•
Y O U R
D A T A
automatically scale reflectance axis. Click the OK button to accept the
scale settings.
Copy - This function copies the Spectral window to the clipboard.
Print - This function prints the Spectral window.
Grid - This function displays a grid in the spectral graph. A check
mark appears next to this menu item when it is active.
Mark - This function places a vertical line at a selected wavelength
and displays the standard values (white), the sample value (green =
pass; red = fail), the difference value, and the wavelength selected.
Wavelengths can be selected only in 10 nanometer intervals. To select
a wavelength, simply click the cross-hair cursor on the desired
wavelength. A check mark appears next to this menu item when it is
active.
Track - This function displays the exact value and wavelength for a
selected point on the curve. To select a point on the curve, simply
place the cross-hair cursor on the point. A check mark appears next to
this menu item when it is active.
Range - This function displays the measurement variation of the
sample set curves. The upper and lower range curves are gray. A
check mark appears next to this menu item when it is active.
Steps:
To select a Spectral menu function, simply select the item from the
Spectral pull down menu.
STATUS DENSITY VIEW
The Status Density… item opens the Status Density View Options
dialog. This dialog allows you to choose the Status Type to display in the
Status Density window. The Status Density window contains a bar graph of
the density data for the status type chosen. It also displays any tolerances
that have been defined.
The following is a list of the Status Types available in the Status Density
View Options dialog.
•
•
Status A, Status E, Status I, and Status T - display the highest
Cyan, Magenta, Yellow, and Visual density values for the sample and
standard.
Spectral and Spectral X - display the sample and standard density
values for the selected wavelength. This wavelength is automatically
selected and displayed in the Status Density View Options dialog.
However, you may change it.
9-13
9
SECTION
NINE
•
•
HiFi - displays the highest Cyan, Magenta, Yellow, Visual, Red,
Green, and Blue density values for the sample and standard.
Hexachrome - displays the highest Cyan, Magenta, Yellow, Visual,
Green, and Orange density values for the sample and standard
Steps:
To determine and display the status density, complete the following steps.
1.
2.
3.
4.
Once the Status Density View Options dialog is open, select the
desired status density type from the Status Type list box.
For spherical instruments only, select the appropriate radio
button, Included or Excluded.
For Spectral or Spectral X status types only, select the wavelength
for the data displayed.
Click the OK button. This opens the Status Density window.
Status Density Menu
The Status Density menu contains the following functions:
•
•
9-14
Tolerance Bars - This function displays tolerance bars on the Status
Density bar graph. A check mark appears next to this menu item when
it is active.
Zoom - This pop up menu allows you to select a zoom percentage for
the Status Density bar graph. The following is a list of percentages:
V I E W I N G
Y O U R
D A T A
100%, 200%, 150%, 125%, 75%, 50%, and 25%. A check mark
appears next to the selected zoom percentage.
Steps:
To select a Status Density menu function, simply select the item from the
Status Density pull down menu.
TREND VIEW
The Trend… item opens the Trend Options dialog. This dialog allows you
to choose the type of data to display in the Trend window. The Trend
window contains measurement data displayed on a point graph, plotted
horizontally against time.
If you select one of the following data types, you also need to select an
illuminant/observer pair:
•
•
•
•
•
•
•
•
•
•
•
•
•
L*a*b*
L*C*H*
DE
DE (CMC)
Metamerism
Strength (Apparent)
Strength (Chromatic)
Strength (Tristimulus)
Yellowness (ASTM E313)
Yellowness (ASTM D1925)
Whiteness (ASTM E313)
Brightness
DE (FMC2)
If you select one of the following data types, you also need to select the
appropriate color:
•
•
•
•
•
•
Status Density (Status A)
Status Density (Status E)
Status Density (Status I)
Status Density (Status T)
Status Density (HiFi)
Status Density (Hexachrome)
If you select one of the following data types, you also need to select the
appropriate wavelength:
9-15
9
SECTION
NINE
•
•
Status Density (Spectral)
Status Density (Spectral X)
Steps:
To determine and display trend data, complete the following steps.
1.
2.
3.
4.
Once the Trend Options dialog is open, select the desired data
type from the Type list box. (Use the scroll bar to view all types.)
Depending on the data type you selected, select either the desired
illuminant/observer from the Illuminant list box, or the desired
color from the Color drop down list, or the desired wavelength
from the Wavelength drop down list.
For spherical instruments only, select the appropriate radio
button, Included or Excluded.
Click the OK button. This opens the Trend window.
Trend Menu
The Trend menu contains the following functions:
•
•
•
9-16
Copy - This function copies the Trend window to the clipboard.
Print - This function prints the Trend window.
Viewport - This function opens the Set Trend Viewport dialog which
allows you to enter in the Range entry field the amount of samples
displayed at one given time. Click the OK button to accept the range.
V I E W I N G
•
•
Y O U R
D A T A
Control Limits - This function displays the upper and lower control
limits on the trend graph. A check mark appears next to this menu
item when it is active.
Grid - This function displays a grid in the trend graph. A check mark
appears next to this menu item when it is active.
Steps:
To select a Trend menu function, simply select the item from the Trend
pull down menu.
L*A*B* DATA VIEW
The L*a*b* Data item displays the L*a*b* Data window. The L*a*b*
Data window contains the following values for the selected sample and
standard: L*, a*, b*, C*, h°, DH, DE, DEcmc, and DEFMC2. For
spherical instruments only, this window also contains Included and
Excluded radio buttons. You may view included or excluded data by
selecting the appropriate radio button.
L*a*b* Data Menu
The L*a*b* Data menu contains the following functions:
•
•
Illum/Obs - This function allows you to select an illuminant/observer
pair to use in the selected L*a*b* Data window. A standard list of
illuminant/observer pairs is available, as well as a selection for the
Controls window illuminant/observer pair: Controls. A check mark
indicates the selected illuminant/observer.
Print - This function prints the L*a*b* Data window.
9-17
9
SECTION
NINE
Steps:
To select an L*a*b* Data menu function, simply select the item from the
L*a*b* Data pull down menu.
SPECTRAL DATA VIEW
The Spectral Data item displays the Spectral Data window. The Spectral
Data window contains the spectral values for the selected sample and
selected standard at 10 Nanometer intervals. For spherical instruments
only, this window also contains Included and Excluded radio buttons.
You may view included or excluded data by selecting the appropriate radio
button.
The type of spectral data, reflectance or density, is determined in the
Spectral Data View Specific menu.
Spectral Data Menu
The Spectral Data menu contains the following functions:
•
9-18
Reflectance - This function displays the spectral data as Reflectance
values. A check mark appears next to this menu item when it is active.
The short-cut keys for this function are Ctrl+R.
V I E W I N G
•
•
Y O U R
D A T A
Density - This function displays the spectral data as Density values.
A check mark appears next to this menu item when it is active. The
short-cut keys for this function are Ctrl+D.
Print - This function prints the Spectral window. For spherical
instruments only, choose either included or excluded data by selecting
the appropriate radio button, Included or Excluded, in the Spectral
Data window.
Steps:
To select a Spectral Data menu function, simply select the item from the
Spectral Data pull down menu.
STATUS DENSITY DATA VIEW
The Status Density Data… item opens the Status Density View Options
dialog. This dialog allows you to choose the Status Type to display in the
Status Density Data window. The Status Density Data window contains the
density values for the chosen data type.
The following is a list of the Status Types available in the Status Density
View Options dialog.
•
•
•
•
Status A, Status E, Status I, and Status T - display the highest
Cyan, Magenta, Yellow, and Visual density values for the sample and
standard as well as delta values.
Spectral and Spectral X - display the sample and standard density
values for the selected wavelength as well as the delta value. This
wavelength is automatically selected and displayed in the Status
Density View Options dialog. However, you may change it.
HiFi - displays the highest Cyan, Magenta, Yellow, Visual, Red,
Green, and Blue density values for the sample and standard as well as
delta values.
Hexachrome - displays the highest Cyan, Magenta, Yellow, Visual,
Green, and Orange density values for the sample and standard as well
as delta values.
9-19
9
SECTION
NINE
Steps:
To determine and display the status density data, complete the following
steps.
1.
2.
3.
4.
Once the Status Density View Options dialog is open, select the
desired status density type from the Status Type list box.
For spherical instruments only, select the appropriate radio
button, Included or Excluded.
For Spectral or Spectral X status types only, select the wavelength
for the data displayed.
Click the OK button. This opens the Status Density Data window.
FORMULA VIEW
The Formula item opens the Formula window. This window contains the
following items.
•
•
•
•
•
•
9-20
Report… - arrow button opens the New Formula Report dialog. Refer
to Section Six—Formulating.
Find Preferred Formula - button displays the “Preferred Formula.”
Set Current Formula = Preferred Formula - button sets the
currently displayed formula as the “Preferred Formula.”
Cal. Set - shows the calibration set for the formula. Refer to Section
Five—Establishing Your Database.
Substrate - shows the substrate for the formula. The substrate is
determined when formulating. Refer to Section Six—Formulating.
Formula Units - shows the formula units for the formula. The units
are determined by the calibration set. Refer to Section Five—
Establishing Your Database.
V I E W I N G
•
•
Y O U R
D A T A
Ink Information - arrow button opens the Ink Information dialog
which lists the ink amount, ink name, and ink calibration set for each
ink in the formula.
formula - area displays the components and amounts for the formula.
9
Formula Menu
The Formula menu contains one function: Print. This function prints the
Formula window.
Steps:
To print the Formula window, simply select the Print item from the
Formula pull down menu.
NOTES & TAGS VIEW
The Notes & Tags item opens the Notes & Tags window. This window
contains display areas for the currently selected standard and sample. The
Standard Tags and Sample Tags arrow buttons open the Select Tags
dialog. The Standard Notes and Sample Notes arrow buttons open the
Note Editor.
9-21
SECTION
NINE
Attaching notes and tags to a sample is covered in Section Seven—Basic
Techniques.
Steps:
To attach notes and tags to a standard, complete the following steps.
1.
2.
3.
4.
5.
6.
Click the Standard Notes arrow button.
Enter or edit the standard’s note in the Note Editor. Refer to the
Section Seven—Basic Techniques. When complete, the note
appears in the Standard Notes display area.
In the Notes & Tags view window, click the Standard Tags
arrow button. This opens the Select Tags dialog.
Highlight the tag you want to select in the Available Tags list
box and click the Include > button to move it to the Selected
Tags list box. (To remove an ink from the Selected Tags list
box, highlight it and click the Remove < button.)
Repeat step 4 for each tag you want to attach. To create a new tag,
refer to Section Ten—Advanced Software Features.
Click the OK button to attach the tag(s).
Notes & Tags Menu
The Notes & Tags menu contains one function: Print. This function
prints the Notes & Tags window.
9-22
V I E W I N G
Y O U R
D A T A
Steps:
To print the Notes & Tags window, simply select the Print item from
the Notes & Tags pull down menu.
VISUAL COLOR VIEW
The Visual Color item opens the Visual Color window. This window is is
intended to be used as a tool for color difference comparison between a
sample and the standard. The colors that are displayed do not exactly
match the actual colors. For spherical instruments only, this window also
contains Included and Excluded radio buttons. You may view the
included or excluded visual colors by selecting the appropriate radio
button. You may also view the visual colors under different illuminants
through the Visual View Specific menu.
NOTE: Visual color is not supported in 16-color display mode. The 256color display mode must be used with this View item.
Visual Color Menu
The Visual Color menu contains the following functions:
•
•
Illum/Obs - This function allows you to select an illuminant/observer
pair to use in the selected Visual Color window. A standard list of
illuminant/observer pairs is available, as well as a selection for the
Controls window illuminant/observer pair: Controls. A check mark
indicates the selected illuminant/observer.
Print - This function prints the Visual Color window. For spherical
instruments only, choose either included or excluded data by selecting
the appropriate radio button, Included or Excluded, in the Visual
Color window.
9-23
9
SECTION
NINE
Steps:
To select a Visual Color menu function, simply select the item from the
Visual Color pull down menu.
VERBAL COLOR VIEW
The Verbal Color item opens the Verbal Color window. This window
allows you to verbally compare the color difference between a sample and
the standard using L*a*b* or L*C*H* color tolerancing. The Verbal
window indicates the color direction and intensity for either the L*a*b*
color space or the L*C*H* color space.
The following lists the direction indicators for each color space value, L*,
a*, b*, C*, and H*. (The L* direction indicator is the same for both
L*a*b* and L*C*H* tolerancing.)
NOTE: A color space value that is acceptable displays “On Target.”
•
•
•
•
•
L* - direction is indicated by either Light or Dark.
a* - direction is indicated by either Red or Green.
b* - direction is indicated by either Blue or Yellow.
C* - direction is indicated by either Bright or Dull.
H* - direction is indicated by either Red, Green, Blue, or Yellow.
For spherical instruments only, this window also contains Included and
Excluded radio buttons. You may view the included or excluded verbal
colors by selecting the appropriate radio button. You may also view the
verbal colors under different illuminants through the Verbal View Specific
menu.
9-24
V I E W I N G
Y O U R
D A T A
Verbal Color Menu
The Verbal Color menu contains the following functions:
•
•
Illum/Obs - This function allows you to select an illuminant/observer
pair to use in the selected Verbal Color window. A standard list of
illuminant/observer pairs is available, as well as a selection for the
Controls window illuminant/observer pair: Controls. A check mark
indicates the selected illuminant/observer.
Print - This function prints the Verbal Color window. For spherical
instruments only, choose either included or excluded data by selecting
the appropriate radio button, Included or Excluded, in the Verbal
Color window.
Steps:
To select a Verbal Color menu function, simply select the item from the
Verbal Color pull down menu.
INDICES VIEW
There are two Indices views: General and Textile. The following
describes these two views.
General Indices
The General function displays Hunter Lab Data for the selected sample
and standard, and it also displays their delta values. For spherical data
only, you must determine the angle of specular Hunter Lab data to display,
included or excluded. To select the angle for the Hunter Lab Data, simply
select the angle, In (included) or Ex (excluded) from the Angle drop down
list.
9-25
9
SECTION
NINE
Textile Indices
The Textile function displays the following index data. For spherical data
only, indices can be viewed in specular included or excluded by clicking
the appropriate radio button, Included or Excluded.
•
•
•
9-26
Whiteness - An index for evaluation of white and near-white
samples. These samples yield numbers which correlate with visual
rating of whiteness.
AATCC Gray Scale Staining - This feature automates the visual
evaluation procedure defined in the AATCC Technical Manual Evaluation Procedure 2. It is meant to test the staining of undyed
textile specimens in the colorfastness test. The “standard” should be
the undyed textile and the “sample” or “trial” should be the stained
textile. A rating of 5 indicates that little staining occurs, meaning that
the sample has good colorfastness. As the numeric values get lower,
the colorfastness degrades, causing greater staining. Hyphenated
values (e.g., 3-4) indicate that the fastness is halfway between 3 and 4.
All evaluations are performed under D65 10° illumination, per the
specification. If the color difference exceeds 40 DE, the fastness grade
is zero. This method is equivalent to ISO 105-A03.
AATCC Gray Scale Color Change - This feature automates the
visual evaluation procedure defined in the AATCC Technical Manual
V I E W I N G
•
•
Y O U R
D A T A
- Evaluation Procedure 1. It is meant to test the colorfastness of textile
samples by comparing the color of untreated and treated specimens.
The “standard” should be the untreated sample and the “sample” or
“trial” should be the treated or washed sample. A rating of 5 indicates
that little color change occurs, meaning that the sample has good
colorfastness. As the numeric values get lower the colorfastness is
degrading. Hyphenated values (e.g., 3-4) indicate that the colorfastness
is half way between 3 and 4. All evaluations are performed under D65
10° illumination, per the specification. If the color difference exceeds
16 DE, the colorfastness grade will be 0. This method is equivalent to
ASTM D 2616 and ISO 105-A02.
Apparent Strength - This feature is well suited for comparison of
colors with moderate chroma. Dull colors usually fail to have a
significant “dip” or low point in the reflectance curve which shows the
absorption of the dye. Apparent strength is evaluated across the entire
spectrum.
Color at Equivalent Strength - This feature predicts what the
color of a textile would be if the strength of the sample were adjusted
to match the standard. It uses the Apparent Strength value in the
computation to adjust the reflectance curve of the sample. New
colorimeteric data is then computed from the adjusted curve. The
accuracy of this procedure degrades as the strength adjustment
increases. In the rare case that Apparent Strength is zero, then no
adjustment will be performed.
9-27
9
SECTION
NINE
Indices Menu
The Indices menu contains one function: Illum/Obs. This function
allows you to select an illuminant/observer pair to use in the selected
Indices window. A standard list of illuminant/observer pairs is available, as
well as a selection for the Controls window illuminant/observer pair:
Controls. A check mark indicates the selected illuminant/observer.
Steps:
To select an illuminant/observer for Indices, simply select the
illuminant/observer from the Indices pull down menu.
DELETE ALL
The Delete All function removes all of the currently displayed windows,
except the Controls window, from the Ink-Master application screen.
9-28
CHAPTER 10 SECTION TEN
Advanced Software Features
Section Contents
Creating Filters ......................................10-2
Creating Tags ........................................10-12
Using Lot IDs .........................................10-14
Alternate Entry Methods.........................10-16
Alternate Standards ...............................10-19
Visually Editing Tolerances ....................10-20
Advanced Ink Selection Methods ...........10-22
Recycling Waste Ink ..............................10-23
Formulating a Series of Matches............10-24
Formulating From a Trial .......................10-27
Using Batch Add Mode ..........................10-33
Editing Formulas....................................10-37
10
Section Ten discusses Ink-Master functions and features for the advanced
user. All of these features enhance the way Ink-Master works as well as the
way you work.
10-1
S E C T I O N
T E N
CREATING FILTERS
A filter provides a fast means of selecting specific sets of information for
evaluation (e.g., samples, standards, or inks). A filter selects sets of
information based on search criteria. For example, a filter can select all the
samples that were measured into the database on a specific date. For
instructions on how to use filters, refer to Section Seven—Managing Your
Data.
Ink-Master comes with several basic filters for each type, but also allows
you to create, edit, and delete filters. Below lists the three types of filters:
•
•
•
Sample Filter - allows you to select a set of samples (trials and
matches) that share common parameters.
Standard Filter - allows you to select a specific standard.
Ink Filter - allows you to select inks that share common ink tags.
Create, Edit, or Delete a Sample Filter
Creating and editing sample filters is done in the Filter Builder dialog.
This dialog contains the following items.
•
•
•
•
•
10-2
Name - This arrow button allows you to name the filter.
Color - This arrow button opens the Color Search Criteria so you can
specify the search criteria for color data. The color data appears in the
field.
Limit - This arrow button opens the Limit Search Criteria so you can
specify the maximum number of samples selected with the filter. The
limit appears in the field.
Date - This arrow button opens the Date Search Criteria so you can
specify the date range of the samples selected by the filter. The Today
radio button selects the samples measured today. The This Week
radio button selects the samples measured this week. The This
Month radio button selects the samples measured this month. The
This Year radio button selects the samples measured this year. The
Use Above Information radio button selects the samples measured
during the date and time range specified in the From and To fields.
The date and time search criteria appears in the field.
Accept/Reject Status - These three check boxes (Accept, Reject,
and Undetermined) allow you to filter samples from the database
whose status match any of the checked statuses. Any combination of
the boxes can be checked.
A D V A N C E D
•
•
•
S O F T W A R E
F E A T U R E S
OR Tags - This arrow button opens the Select Tags dialog which
allows you to select tags to include in the OR Tags list. OR Tags
search criteria selects samples whose tags match one or more of the
tags in the OR Tags list.
AND Tags - This arrow button opens the Select Tags dialog which
allows you to select tags to include in the AND Tags list. AND Tags
search criteria only selects samples whose tags include all of the tags
in the AND Tags list.
NOT Tags - This arrow button opens the Select Tags dialog which
allows you to select tags to include in the NOT Tags list. NOT Tags
search criteria does not select samples whose tags match any tags in
the NOT Tags list.
10
Opening the Filter Builder Dialog—Steps:
To open the Filter Builder dialog to create or edit a Sample Filter, complete
the following steps.
1.
2.
Select the Sample Filters… function in the Edit Filters pop up
window from the Database menu, or click the Filter arrow
button in the Controls window. This opens the Filters dialog.
Choose to create or edit a Sample Filter:
• To create a Sample Filter, click the Create… button. This
opens the Filter Builder dialog.
10-3
S E C T I O N
T E N
•
To edit an existing Sample Filter, highlight the filter you
want to edit and click the Edit… button. This opens the
filter’s search criteria in the Filter Builder dialog.
Naming Your Sample Filter—Steps:
To enter or edit the Sample Filter name, complete the following steps.
1.
2.
3.
Click the Name arrow button. This opens the Name Search
Criteria dialog.
Enter or edit the name in the Name field.
Click OK.
Setting Color Search Criteria—Steps:
To enter color search criteria, complete the following steps.
NOTE: The color target defaults to the current standard. If you wish to use
a different target, you may enter its L*a*b* values in the Targets fields.
1.
2.
3.
4.
5.
6.
7.
8.
Click the Color arrow button. This opens the Color Search
Criteria dialog.
Select the type of color data from the Type drop down list.
Select the illuminant/observer from the Illum/Obs drop down
list.
Select the tolerance method from the Tolerance drop down list.
If the tolerance method is either DE (L*a*b*) or DE (CMC 2:1),
enter the Delta E tolerance in the DE (method) field.
If the tolerance method is DL*Da*Db* or DL*DC*DH*, enter the
tolerance values in the Tolerance fields.
For spherical instruments only, select the specular search method
(included or excluded) by clicking the Included or Excluded
radio button.
Click OK.
To edit color search criteria, complete the following steps.
1.
2.
3.
4.
10-4
Highlight the color search criteria you want to edit.
Click the Modify button or double-click on the color search
criteria itself. This opens the Color Search Criteria dialog.
Edit any of the search criteria in the same manner as creating
search criteria.
Click OK.
A D V A N C E D
S O F T W A R E
F E A T U R E S
To delete color search criteria, complete the following steps.
1.
2.
Highlight the color search criteria you want to delete.
Click the Delete button.
Setting the Filter Limit—Steps:
To enter or edit the limit for the filter, complete the following steps.
1.
2.
3.
Click the Limit arrow button. This opens the Limit Search
Criteria dialog.
Enter or edit the maximum number of samples to select, or click
Don’t Care if you don’t want to set a maximum number.
Click OK.
Setting Date Search Criteria—Steps:
To enter or edit the date search criteria, complete the following steps.
1.
2.
3.
4.
Click the Date arrow button. This opens the Date Search Criteria
dialog.
Select a date search criteria radio button, or click Don’t Care if
you don’t want to set any date search criteria.
If you select Use Above Information, follow these steps.
• Enter the starting date and time in the From field including
the “AM” or “PM” designation.
• Enter the ending date and time in the To fields field
including the “AM” or “PM” designation.
Click OK.
Setting Status Search Criteria—Steps:
To set the accept, reject, and undetermined status search criteria, complete
the following steps.
1.
2.
3.
To include samples with the Accept status, check the Accept
check box.
To include samples with the Reject status, check the Reject check
box.
To include samples with the Undetermined status, check the
Undetermined check box.
10-5
10
S E C T I O N
T E N
Setting Tags Search Criteria—Steps:
To enter or edit the tags search criteria, complete the following steps.
1.
2.
3.
4.
5.
Click the arrow button for the type of tags search criteria (OR
Tags, AND Tags, or NOT Tags). This opens the Select Tags
dialog.
To include a tag in the search criteria, highlight it in the
Available Tags list and click the Include button.
To remove a tag from the search criteria, highlight it in the
Selected Tags list and click the Remove button.
To create a new tag for the search criteria, click the Create…
button. Refer to the Create/Edit a Tag sub-section.
Click OK.
Saving the Filter Search Criteria—Steps:
To save a new filter or an edited filter, simply click the OK button in the
Filter Builder dialog when all the filter’s search criteria is correct.
Deleting a Filter—Steps:
To delete a filter, complete the following steps.
1.
2.
3.
In the Select Filter dialog, highlight the filter to be deleted.
Click the Delete… button.
Click the Yes button if you are sure you want to delete the filter.
Click the NO button if you do not want to delete the filter.
Create, Edit, or Delete a Standard Filter
Creating and editing standard filters is done in the Search Filter Builder
dialog. This dialog contains the following items.
•
•
•
•
10-6
Name - This arrow button allows you to name the filter.
Color - This arrow button opens the Color Search Criteria so you can
specify the search criteria for color data. You can also paste or
measure target color data in this dialog. The color data appears in the
field.
Limit - This arrow button opens the Limit Search Criteria so you can
specify the maximum number of standards selected with the filter. The
limit appears in the field.
Date - This arrow button opens the Date Search Criteria so you can
specify the date range of the standards selected by the filter. The
Today radio button selects the standards measured today. The This
A D V A N C E D
•
•
•
S O F T W A R E
F E A T U R E S
Week radio button selects the standards measured this week. The
This Month radio button selects the standards measured this month.
The This Year radio button selects the standards measured this year.
The Use Above Information radio button selects the standards
measured during the date and time range specified in the From and
To fields. The date and time search criteria appears in the field.
Sort - This arrow button opens the Sort Search Criteria so you can
select a sorting method. The sort method appears in the field.
Customer - This arrow button opens the Customer Search Criteria
dialog which allows you to specify a range of customers to include in
the search criteria.
Tags - This arrow button opens the Select Tags dialog which allows
you to select tags to include in the Tags list. Tags search criteria only
selects standards whose tags exactly match the tags in the Tags list.
Opening the Search Filter Builder Dialog—Steps:
To open the Search Filter Builder dialog to create or edit a Standard Filter,
complete the following steps.
1.
2.
Select the Standard Filters… function in the Edit Filters pop
up window from the Database menu. This opens the Standard
Search Definition dialog.
Choose to create or edit a Standard Filter:
• To create a Standard Filter, click the Create… button. This
opens the Search Filter Builder dialog.
10-7
10
S E C T I O N
T E N
•
To edit an existing Standard Filter, highlight the filter you
want to edit and click the Edit… button. This displays the
filter’s search criteria in the Search Filter Builder dialog.
Naming Your Standard Filter—Steps:
To enter or edit the Standard Filter name, complete the following steps.
1.
2.
3.
Click the Name arrow button. This opens the Name Search
Criteria dialog.
Enter or edit the name in the Name field.
Click OK.
Setting Color Search Criteria—Steps:
To enter color search criteria, complete the following steps.
1.
2.
3.
4.
5.
6.
7.
8.
9.
Click the Color arrow button. This displays the Color Search
Criteria dialog.
Select the type of color data from the Type drop down list.
Select the illuminant/observer from the Illum/Obs drop down
list.
Select the tolerance method from the Tolerance drop down list.
If the tolerance method is either DE (L*a*b*) or DE (CMC 2:1),
enter the Delta E tolerance in the DE (method) field.
Enter the target values in the Target fields, or click the Paste
button to paste target values in the Target fields, or click the
Measure… button and follow the screen prompts to measure in
target values in the Target fields. For more information about
pasting, refer to Section Seven—Maintaining Your Color Data.
If the tolerance method is DL*Da*Db* or DL*DC*DH*, enter the
tolerance values in the Tolerance fields.
For spherical instruments only, select the specular search method
(included or excluded) by clicking the Included or Excluded
radio button.
Click OK.
To edit color search criteria, complete the following steps.
1.
2.
3.
10-8
Highlight the color search criteria you want to edit.
Click the Modify button or double-click on the color search
criteria itself. The Color Search Criteria dialog appears.
Edit any of the search criteria in the same manner as creating
search criteria.
A D V A N C E D
4.
S O F T W A R E
F E A T U R E S
Click OK.
To delete color search criteria, complete the following steps.
1.
2.
Highlight the color search criteria you want to delete.
Click the Delete button.
10
10-9
S E C T I O N
T E N
Setting the Filter Limit—Steps:
To enter or edit the limit for the filter, complete the following steps.
1.
2.
3.
Click the Limit arrow button. This opens the Limit Search
Criteria dialog.
Enter or edit the maximum number of standards to select, or click
Don’t Care if you don’t want to set a maximum number.
Click OK.
Setting Date Search Criteria—Steps:
To enter or edit the date search criteria, complete the following steps.
1.
2.
3.
4.
Click the Date arrow button. This opens the Date Search Criteria
dialog.
Select a date search criteria radio button, or click Don’t Care if
you don’t want to set any date search criteria.
If you select Use Above Information, follow these steps.
• Enter the starting date and time in the From field including
the “AM” or “PM” designation.
• Enter the ending date and time in the To fields field
including the “AM” or “PM” designation.
Click OK.
Setting Sort Search Criteria—Steps:
To set the sort search criteria, complete the following steps.
1.
2.
3.
Click the Sort arrow button. This opens the Sort Search Criteria
dialog.
Select a sort method from the Sort by drop down list.
Click OK.
Setting Customer Search Criteria—Steps:
To set the customer search criteria, complete the following steps.
1.
2.
3.
4.
10-10
Click the Customer arrow button. This opens the Customer
Search Criteria dialog.
Select a starting customer from the From drop down list, or click
Don’t Care if you don’t want to exclude any customers from the
search. (Customers are listed and searched in alphabetical order.)
Select an ending customer from the To drop down list.
Click OK.
A D V A N C E D
S O F T W A R E
F E A T U R E S
Setting Tags Search Criteria—Steps:
To enter or edit the tags search criteria, complete the following steps.
1.
2.
3.
4.
5.
Click the Tags arrow button. This opens the Select Tags dialog.
To include a tag in the search criteria, highlight it in the
Available Tags list and click the Include button.
To remove a tag from the search criteria, highlight it in the
Selected Tags list and click the Remove button.
To create a new tag for the search criteria, click the Create…
button. Refer to the Create/Edit a Tag sub-section.
Click OK.
10
Saving the Filter Search Criteria—Steps:
To save a new filter or an edited filter, simply click the OK button in the
Search Filter Builder dialog when all the filter’s search criteria is correct.
Deleting a Filter—Steps:
To delete a filter, complete the following steps.
1.
2.
3.
In the Select Filter dialog, highlight the filter to be deleted.
Click the Delete… button.
Click the Yes button if you are sure you want to delete the filter.
Click the NO button if you do not want to delete the filter.
Create, Edit, or Delete an Ink Filter
Creating and editing ink filters is done by selecting ink tags in the Ink
Filter Builder dialog. Refer to the Advanced Ink Selection Methods subsection for using ink filters. Refer to the Creating Tags sub-section for
creating ink tags.
The Ink Filter Builder dialog contains the following items.
•
•
•
Name - This arrow button allows you to name the filter.
OR Tags - This arrow button opens the Select Tags dialog which
allows you to select ink tags to include in the OR Tags list. OR Tags
search criteria selects inks that match one or more of the tags in the
OR Tags list.
AND Tags - This arrow button opens the Select Tags dialog which
allows you to select ink tags to include in the AND Tags list. AND
Tags search criteria only selects inks whose tags include all of the ink
tags in the AND Tags list.
10-11
S E C T I O N
T E N
•
NOT Tags - This arrow button opens the Select Tags dialog which
allows you to select ink tags to include in the NOT Tags list. NOT
Tags search criteria does not select inks whose tags match any ink tags
in the NOT Tags list.
Opening the Ink Filter Builder Dialog—Steps:
To open the Ink Filter Builder dialog to create or edit an Ink Filter,
complete the following steps.
1.
2.
Select the Ink Filters… function in the Edit Filters pop up
window from the Database menu. This opens the Filters dialog.
Choose to create or edit an Ink Filter:
• To create an Ink Filter, click the Create… button. This
opens the Ink Filter Builder dialog.
• To edit an existing Ink Filter, highlight the filter you want to
edit and click the Edit… button. This opens the filter’s
search criteria in the Ink Filter Builder dialog.
Naming Your Ink Filter—Steps:
To enter or edit the Ink Filter name, complete the following steps.
1.
2.
3.
Click the Name arrow button. This opens the Name Search
Criteria dialog.
Enter or edit the name in the Name field.
Click OK.
Setting Tags Search Criteria—Steps:
To enter or edit the tags search criteria, complete the following steps.
1.
2.
10-12
Click the arrow button for the type of tags search criteria (OR
Tags, AND Tags, or NOT Tags). This opens the Select Tags
dialog.
To include a tag in the search criteria, highlight it in the
Available Tags list and click the Include button.
A D V A N C E D
3.
4.
5.
S O F T W A R E
F E A T U R E S
To remove a tag from the search criteria, highlight it in the
Selected Tags list and click the Remove button.
To create a new tag for the search criteria, click the Create…
button. Refer to the Create/Edit a Tag sub-section.
Click OK.
Saving the Filter Search Criteria—Steps:
To save a new filter or an edited filter, simply click the OK button in the
Ink Filter Builder dialog when all the filter’s search criteria is correct.
Deleting a Filter—Steps:
To delete a filter, complete the following steps.
1.
2.
3.
In the Select Filter dialog, highlight the filter to be deleted.
Click the Delete… button.
Click the Yes button if you are sure you want to delete the filter.
Click the NO button if you do not want to delete the filter.
CREATING TAGS
Ink-Master provides a simple way to group important characteristics about
inks, standards, formulas, and samples by attaching tags to them. InkMaster offers two types of tags, Ink Tags and General Tags. Ink Tags are
used only with inks, whereas General Tags can be used with standards,
formulas, and samples. The software provides several basic tags for each
type of tag, and it also allows you to create, edit, and delete tags.
Ink Tags
Ink Tags are used to group inks together by any important characteristic.
Ink tag “maintenance”—creating, editing, and deleting—allows you to
establish ink tags, change ink tags, and remove ink tags from your
database. (If you are selecting tags for an ink, the Select Tag dialog may
also contain a Create… button that opens the Create Tag dialog.)
Steps:
To attach an ink tag, complete the following steps.
1.
2.
Click a “Tags” arrow button. This opens the Select Tags dialog.
Highlight the tag you want to attach in the Available Tags list
box.
10-13
10
S E C T I O N
T E N
3.
4.
Click the Include button. Repeat steps 2 and 3 for each tag you
want to attach to the item. (To remove a tag, highlight it in the
Selected Tags list box and click the Remove button.)
Click the OK button.
Steps:
To create a new ink tag, complete the following steps.
1.
2.
3.
4.
5.
Select the Ink Tags… function in the Edit Tags pop up window
from the Database menu. This opens the Edit Ink Tags dialog.
Click the Create… button. This opens the Create Tag dialog.
Enter the tag in the field.
If you want to create another new ink tag without closing the Edit
Ink Tags dialog, check the Repeat check box.
Click the OK button.
Steps:
To edit an existing ink tag, complete the following steps.
1.
2.
3.
4.
Select the Ink Tags… function in the Edit Tags pop up window
from the Database menu. This opens the Edit Ink Tags dialog.
Click the Edit… button. This opens the Edit Tag dialog.
Edit the tag in the field.
Click the OK button. The ink tag is added to your database.
Steps:
To delete an existing ink tag, complete the following steps.
1.
2.
3.
Select the Ink Tags… function in the Edit Tags pop up window
from the Database menu.
Click the Delete… button. This opens the Delete Tag dialog.
Click the OK button.
General Tags
A General Tag is used to group items (standards, formulas, or samples)
together by an important characteristic. General tag “maintenance”—
creating, editing, and deleting—allows you to establish general tags,
change general tags, and remove general tags from your database. (If you
are selecting tags for an item, the Select Tag dialog may also contain a
Create… button that opens the Create Tag dialog.)
10-14
A D V A N C E D
S O F T W A R E
F E A T U R E S
Steps:
To attach a general tag, complete the following steps.
1.
2.
3.
4.
Click a “Tags” arrow button. This opens the Select Tags dialog.
Highlight the tag you want to attach in the Available Tags list
box.
Click the Include button. Repeat step 2 and 3 for each tag you
want to attach to the item. (To remove a tag, highlight it in the
Selected Tags list box and click the Remove button.)
Click the OK button.
Steps:
To create a new general tag, complete the following steps.
1.
2.
3.
4.
5.
10
Select the General Tags… function in the Edit Tags pop up
window from the Database menu. This opens the Edit Ink Tags
dialog.
Click the Create… button. This opens the Create Tag dialog.
Enter the tag in the field.
If you want to create another new general tag without closing the
Edit Ink Tags dialog, check the Repeat check box.
Click the OK button.
Steps:
To edit an existing general tag, complete the following steps.
1.
2.
3.
4.
Select the General Tags… function in the Edit Tags pop up
window from the Database menu. This opens the Edit Ink Tags
dialog.
Click the Edit… button. This opens the Edit Tag dialog.
Edit the tag in the field.
Click the OK button.
Steps:
To delete an existing general tag, complete the following steps.
1.
2.
3.
Select the General Tags… function in the Edit Tags pop up
window from the Database menu.
Click the Delete… button. This opens the Delete Tag dialog.
Click the OK button.
10-15
S E C T I O N
T E N
USING LOT IDs
Lot IDs provide a method of locating specific samples. Ink-Master allows
you to attach Lot IDs to samples then provides a means of searching for
samples according to Lot ID.
Create/Edit a Lot ID
A Lot ID is attached to a sample either through the Controls window or
when uploading a standard from a spherical instrument. Refer to Section
Eight—Managing Your Data for assigning Lot IDs when uploading
standards.
Steps:
To attach a Lot ID to a sample (or edit a Lot ID) through the Controls
window, complete the following steps.
1.
2.
3.
Use the Sample scroll bar to select the desired sample.
Enter or edit the Lot ID in the Lot ID entry field.
Repeat steps 1 and 2 to attach (or edit) a Lot ID to all desired
samples.
Use Lot ID to Find a Sample
Samples with Lot IDs can be searched for within the selected standard or
across all standards in the database.
Steps:
To find a sample according to a Lot ID, complete the following steps.
1.
2.
3.
4.
5.
10-16
Select the Find Lot ID… function from the Database pull down
menu, or click the Lot ID arrow button in the Controls window.
This opens the Find Lot ID dialog.
Enter the Lot ID in the Lot ID entry field. If you do not enter a
Lot ID, all samples without a Lot ID are retrieved.
If you want to search across all standards, check the Across
Standard check box.
Click the Find button. The standard with the matching Lot ID is
displayed in the application.
If more than one sample is found with the above determined Lot
ID (or lack of), this opens the Find Lot ID Results dialog which
lists the standard, the customer, and the date for each sample
found. Select the desired sample from the list box and click the
Select button. The standard is displayed in the application.
A D V A N C E D
S O F T W A R E
F E A T U R E S
Use Lot ID to Find a Standard
Ink-Master allows you to search for a standard by a Lot ID. If you do not
enter a Lot ID, Ink-Master will find all the standards without Lot IDs.
Refer to Section Ten—Advanced Software Features for more information
on Lot ID’s. You must search for the Lot ID across all standards.
Steps:
To find a standard by Lot ID, complete the following steps.
1.
2.
3.
4.
5.
6.
Select the Find Lot ID… function from the Database menu.
This opens the Find Lot ID dialog.
Enter the Lot ID in the Lot ID entry field.
Check the Across Standards to search across all the standards.
Click the Find… button. This opens the Find Lot ID Results
dialog which displays the standards that match the Lot ID.
Highlight the desired standard.
Click the Select button.
ALTERNATE ENTRY METHODS
The Alternate Entry… button available on some of the measurement
dialogs opens the Alternate Reflectance Entry dialog. This dialog allows
you to select a different method for entering a color’s reflectance data. The
available Alternate Entry methods are listed below.
•
•
•
•
•
Manually (keyboard) - manually entering the reflectance data.
Current Sample - (standards only) using the current sample’s color
data.
Average the Current Set - (standards only) averaging the current
set of samples.
Paste From Clipboard - pasting data in from the clipboard.
Contrast Ratio - measuring a color’s contrast ratio data.
Steps:
To select an alternate entry method, complete the steps below.
1.
2.
Click the radio button next to the method you want to use.
Click the OK button. This either opens a dialog for the alternate
entry method (Manually, Contrast Ratio), or it enters the color
data in the appropriate measurement dialog (Current Sample,
Average the Current Set, Paste From Clipboard).
10-17
10
S E C T I O N
T E N
Manually (keyboard)
When selected, the Manually (keyboard) radio button opens the Enter
Reflectances dialog. You can enter the reflectance values for a color from
400 nm to 700 nm in 10 nm or 20 nm intervals. (Included and Excluded
values may be entered for spherical instruments.)
Steps:
To enter reflectance values with the keyboard, complete the following
steps.
1.
2.
10-18
Select either the 10 nm. data or 20 nm. data interval radio
button.
Enter the reflectance values for the color into the appropriate
column(s) in the table. You can not edit the nm column.
A D V A N C E D
3.
S O F T W A R E
F E A T U R E S
Click the OK button when all the data is entered.
Contrast Ratio
The Contrast Ratio method provides a way to determine the opacity of an
ink. These measurements are done in the Contrast Ratio dialog. This
measurement dialog contains the following items in addition to the Over
Black/Over White measurement dialog. Refer to Section Seven—Basic
Techniques.
•
•
•
Predicted graph - displays the predicted reflectance values for the
color if it was 100% opaque.
Save Options:
• Predicted radio button - saves the predicted color data.
• Over Black radio button - saves the Over Black color data.
• Over White radio button - saves the Over White color data. This
radio button is selected by default.
k1 and k2 fields - default to the calibration set values. It is not
recommended to edit these values. See the Create/Edit a Calibration
Set sub-section. These values are automatically adjusted to equal the
values from the calibration set.
NOTE: You can not edit the substrate for a trial.
Measurement
prompt in red text.
10-19
10
S E C T I O N
T E N
Steps:
To measure the opacity of an ink, complete the following steps.
1.
2.
3.
4.
5.
6.
7.
8.
For spherical instruments only, select In (included) or Ex
(excluded) from the View method drop down list.
Select your averaging method from the Averaging method
drop down list.
Select the desired save option radio button, Predicted, Over
Black, or Over White.
Follow the red text prompts and take your measurement(s).
If you want to paste color data into the graph that has focus,
click the Paste button.
If you want to manually enter the color data, click the
Manual Entry button. Refer to the Manually (Keyboard)
sub-section for instructions.
For standards only. If you want to retrieve substrate color
data, click the Substrate arrow button, highlight a substrate
from the list, and click the Select… button.
Click the OK button. The opacity is automatically entered
into the Note.
ALTERNATE STANDARDS
Ink-Master allows you to use alternate standard descriptions to save
different standards that share the same standard name. An alternate
description then implies that the standard is then saved as an “alternate
standard.” Many alternate standards may exist for one standard name. This
proves useful for a standard on several types of substrates.
Creating an Alternate Standard
If prompted to replace an existing standard with a new standard and you
choose not to replace it, you can save the new standard under the same
name as the existing standard with an alternate description.
Steps:
To assign an alternate standard description to the new standard, complete
the following steps.
1.
2.
10-20
When prompted if you want to save the new standard under an
alternate description, click the Yes button. This opens the
Standard Description dialog.
Enter a description to assign to the new standard in the field.
A D V A N C E D
3.
S O F T W A R E
F E A T U R E S
Click the OK button.
Selecting an Alternate Standard
Standards are selected in either the Find Standard dialog or the Standard
Maintenance dialog. (Alternate standards appear the same in both dialogs.)
Standards are listed in the Standards list box and are indicated by a blue
box icon.
If the box is empty, the standard has no samples associated to it. If the box
is full of “papers,” the standard has samples associated to it. If the box has
a plus sign on it, the standard has alternate standards that are hidden. If
the box has a minus sign on it, the alternate standards (descriptions) are
displayed below the standard name. Alternate standards are represented by
a gray box and the alternate description. The selected alternate standard is
indicated by a red check mark. See below for an example.
Selected Alternate
Standard for 12.5%
Blue
“Papers” indicate
samples attached
to the standard.
Steps:
To select an alternate standard, complete the following steps. Short-cut:
Simply select an alternate standard from the Standard Description
drop down list in the Controls window.
1.
2.
3.
In either the Find Standard dialog or the Standard Maintenance
dialog, highlight the desired standard (with a plus sign on it’s box
icon) in the Standards list box.
Double click on the standard. This displays the hidden alternate
standards.
Highlight the alternate standard you want to select and click the
Select button; or simply double click on it.
VISUALLY EDITING TOLERANCES
This feature allows a tolerance to be adjusted to agree with your customer’s
visual judgments. Accept/Reject/Undetermined status (based on tolerances)
should be properly assigned through the Control window to all standards
under consideration. Refer to Section Seven—Basic Techniques for more
information about assigning Accept/Reject/Undetermined status.
Tolerances can be visually edited in the Visual Tolerance Editor dialog
10-21
10
S E C T I O N
T E N
only for a standard with existing samples. For more information about
tolerances, refer to Section Six—Formulating.
Visual tolerancing is only available for the following types of tolerances:
L*a*b*, L*C*H*, CMC, Delta E, L*a*b* (+/), and DE (FMC2). The
Visual Tolerance Editor dialog contains the following information.
•
•
•
•
•
•
•
L*a*b* graph - This graph displays the standard and all its samples
highlighted with their appropriate Accept/Reject status. The graph
changes as you change your tolerance limits.
The selected tolerance information is displayed below the graph.
Limit entry fields display the limits for the selected tolerance. Each
field has an up arrow button and a down arrow button to adjust the
limits.
Legend - This area displays the color “coding” for the Accept/Rejects
statuses: Accept (cyan), Reject (magenta), and Undetermined (gray).
Reset - This button resets all limits to their original values.
OK - This button accepts the changes and closes the Visual Tolerance
Editor dialog.
Cancel - This button does not accept the changes and closes the
Visual Tolerance Editor dialog.
Steps:
To edit tolerances visually, complete the following steps.
10-22
A D V A N C E D
1.
2.
3.
4.
S O F T W A R E
F E A T U R E S
Highlight the tolerance you want to edit.
Click the Edit Tolerance Visually… button. This opens the
Visual Tolerance Editor dialog.
Enter new tolerance limits in the entry fields or click on the up or
down arrow buttons to adjust the tolerance limits.
Click the OK button to save your changes.
ADVANCED INK SELECTION METHODS
Using an Ink Filter
An Ink Filter allows you to select a set of inks that share the common
parameters of the filter’s search criteria—ink tags. Refer to the Creating
Filters sub-section for creating, editing, or deleting ink filters.
10
Steps:
To select inks using an Ink Filter, complete the following steps.
1.
2.
3.
Select the Available arrow button in the Select Inks dialog, or
select the Ink Filters… function in the Edit Filters pop up
window from the Database menu. This opens the Filters dialog.
Highlight the filter you want to select.
Click the Select button.
Using Ink Sets
Ink sets allow you to save commonly used lists of inks for formulation.
These sets are assigned a name. Ink sets are saved and retrieved through
the formulation Select Inks dialog only.
Steps:
To save an ink set, complete the following steps.
1.
2.
3.
4.
In the Select Inks dialog, select the inks you want to save just as
you would select the inks for a formula.
Click the Save… button. This opens the Ink Sets dialog.
Enter the name for the Ink set in the Name entry field.
Click the OK button.
Steps:
To retrieve an ink set, complete the following steps.
1.
In the Select Inks dialog, click the Load… button. This opens the
Ink Sets dialog.
10-23
S E C T I O N
T E N
2.
3.
From the Existing Ink Sets list box, select the ink set you want
to load.
Click the OK button. The ink set is loaded into the Selected list
box of the Select Inks dialog.
RECYCLING WASTE INK
Ink-Master allows you to use waste ink that is left over from a trial. This
acts as a cost savings since the waste ink can then be used in future
formulas. Ink-Master also allows you to edit some of the ink information,
although, you can not edit the calibration data for a waste ink.
Steps:
To create a waste ink from a trial, complete the following steps.
1.
10-24
In the Controls window, use the Sample scroll bar to select the
trial you want to use.
A D V A N C E D
2.
3.
4.
5.
6.
7.
8.
9.
10.
11.
12.
13.
14.
15.
16.
S O F T W A R E
F E A T U R E S
Select the Waste From Trial… function from the Database
menu. This opens Create Waste From Trial dialog.
Enter the ink’s name in the Ink Name dialog.
Enter the ink ID in the Ink ID field.
Select the ink supplier from the Supplier drop down list.
Enter or edit the Density information. Click the Density arrow
button. Choose the units and enter the mass and the unit volume.
The density is always displayed in the default units. Refer to
Section Four—Software Setup Options. Click OK.
Enter or edit the cost in the Cost field. The cost is always
displayed with default units. Refer to Section Four—Setting Up
Your Software.
Enter or edit the inventory information in the Inventory field.
The inventory is always displayed in the default units. Refer to
Section Four—Setting Up Your Software.
Enter or edit the minimum ink concentration in the Min
Concentration (%) field.
Enter or edit the maximum ink concentration in the Max
Concentration (%) field.
Enter or edit the calibration set’s substrate strength in the
Strength field.
If necessary, enter or edit the percentage of concentrate in the ink
in the Concentrate (%) field.
If necessary, enter or edit the percentage of solvent in the ink in
the Solvent (%) field.
Click the Note arrow button to enter any notes in the Note Editor.
Refer to Section Seven—Basic Techniques.
Click the Tags arrow button to assign tags to the calibration set.
Refer to the Creating Tags sub-section.
Click the OK button.
FORMULATING A SERIES OF MATCHES
Ink-Master allows you to formulate a series of matches. This is possible
with the use of two queues: Request Queue and Results Queue. The
Request Queue allows you to queue up a series of matches to formulate.
The Results Queue allows you to view the matches that have been
formulated through the Request Queue. This sub-section describes how to
queue up a series of matches, formulate a series of matches from queue,
and view the results.
10-25
10
S E C T I O N
T E N
Queue Up Your Matches
To formulate a series of matches, you must first queue up the matches you
want to formulate. Matches are queued up in the Request Queue from the
Combinatorial Formulation dialog. Refer to Section Six—Formulating.
Steps:
To queue up a match to formulate, complete the following steps.
1.
2.
3.
Set the formula conditions in the Combinatorial Formulation
dialog. Refer to Section Six—Formulating.
Click the Add to Queue button. This adds the match
information to the Request Queue.
Repeat steps 1 and 2 for each match you want to queue up.
Formulate from Queue
Once you queue up the matches you want to formulate, you can then
choose to formulate one or all the matches in the Request Queue. For each
match queued to formulate, the Formulation Request Queue dialog lists the
customer, the standard, and the time and date it was added to the queue.
This dialog allows you to formulate one match from the queue, to
formulate all matches in the queue, and to delete a match from the queue.
When a match or matches are formulating, the Combinatorial Formulation
from Queue dialog appears. This dialog contains the same functions as the
Combinatorial Formulation dialog. Refer to Section Six—Formulating.
Once formulation is complete, the Formulate from Queue dialog appears
with formula information, such as the errors that occurred during
formulation and how many matches were made.
EXTRA FEATURE: If any matches are in the Request Queue while
exiting the Ink-Master software, you are prompted to determine whether or
not to formulate the items in the queue. Simply complete these steps.
1.
Click the Yes button to formulate. This opens the Request Queue.
(Click the No button to exit the software. All items in the Request
Queue are unaffected.)
2.
Choose to formulate one or all matches. Follow step 2 below.
Steps:
To formulate matches from the Request Queue, complete the following
steps.
10-26
A D V A N C E D
1.
2.
3.
S O F T W A R E
F E A T U R E S
Open the Request Queue.
• In the Combinatorial Formulation dialog, click the Request
Queue arrow button. OR…
• Select the Request Queue item in the Manage Queue
pop up menu from the Formulation menu.
Choose to formulate one or all matches.
• To formulate one match, highlight the match you want to
formulate, click the Formulate… button. This opens the
Combinatorial Formulation from Queue dialog and begins the
formulate process.
• To formulate all matches, click the Formulate All… button.
This opens the Combinatorial Formulation from Queue dialog
and begins the formulate process.
To delete a match from the Request Queue, simply highlight it
and click the Delete button.
View Your Results
After formulation from queue is complete, you may view your results. (You
may only view one formulation match at a time.) The Results Queue stores
the matches formulated from queue and allows you to select the formula
results to view. This is done in the Formulation Results Queue dialog. This
dialog also allows you to delete a formulated match.
For each match formulated from queue, the Formulation Results Queue
dialog lists the customer, the standard, and the time and date it was
formulated. Viewing results is done in the Combinatorial Formulation
dialog. Refer to Section Six—Formulating.
Steps:
To view a match formulated from queue, complete the following steps.
1.
2.
3.
4.
Open the Results Queue.
• In the Combinatorial Formulation dialog, click the Results
Queue arrow button. OR…
• Select the Results Queue item in the Manage Queue pop
up menu from the Formulation menu.
Highlight the formulated match you want to view.
Click the View… button. This opens the Combinatorial
Formulation dialog. Refer to Section Six—Formulating.
To delete a formulated match from the Results Queue, simply
highlight it in the Formulation Results Queue dialog and click the
Delete button.
10-27
10
S E C T I O N
T E N
FORMULATING FROM A TRIAL
Ink-Master allows you to formulate a match from an actual trial. There are
three steps to formulating from a trial: searching for the trial(s) to
formulate from, viewing the formulation results, and accepting a match
from a trial.
Searching for Trials
The first step to formulating from a trial is to search for the trial(s) to
formulate matches. This is done in the Trial Search dialog. This dialog
allows you to determine the search criteria and contains the following
items.
•
•
•
•
•
•
10-28
DE - This field allows you to set the maximum delta E trial values for
the currently selected standard.
Limit - This field allows you to set the maximum number of trials
retrieved from the trial search.
Date - This field displays the date range for the trial search. The
arrow button opens the Date Search Criteria dialog which allows you
to determine the date range for the trial search. The Today radio
button selects the samples measured today. The This Week radio
button selects the samples measured this week. The This Month
radio button selects the samples measured this month. The This Year
radio button selects the samples measured this year. The Use Above
Information radio button selects the samples measured during the
date range specified in the From and To fields. The date search
criteria appears in the field.
Customer - This arrow button opens the Customer Search Criteria
dialog which allows you to specify a range of customers to include in
the search criteria.
Tags - This arrow button opens the Select Tags dialog which allows
you to determine tags for the trial search criteria. Refer to the Creating
Tags sub-section.
Inks - This arrow button opens the Select Inks dialog which allows
you to select the inks for formulating from a trial. The Calibration
Sets list box lists all the calibration sets. The Available list box lists
all the inks for the highlighted calibration set. The Selected list box
lists all the inks selected for the trial search. The Include> button
moves the highlighted ink in the Available list box to the Selected
list box. The <Remove button moves the highlighted ink in the
Selected list box to the Available list box. The “All” buttons move
A D V A N C E D
•
•
S O F T W A R E
F E A T U R E S
all the inks from one list box to another. Refer to the Advanced Ink
Selection sub-section for more information about the Save and Load
buttons.
Search… - This button searches for the trials within the search
criteria and automatically formulates matches to these trials in the
Formulate From Trial dialog.
Cancel - This button cancels the search and closes the Trial Search
dialog.
NOTE: Trial search criteria also may be set from within the Formulate
From Trial dialog by clicking the Search Criteria arrow button.
10
Steps:
To determine the trial search criteria, complete the following steps.
1.
2.
3.
4.
Select the From Trial… function from the Formulate pull down
menu. This opens the Trial Search dialog.
Enter the search delta E in the DE field.
Enter the maximum amount of trials retrieved in the Limit field.
Click the Date arrow button. This open the Date Search Criteria
dialog.
• Select a date search criteria radio button, or click Don’t
Care if you don’t want to set any date search criteria.
• If you select Use Above Information, follow these steps.
10-29
S E C T I O N
T E N
•
5.
6.
7.
8.
9.
10-30
Enter the starting date and time in the From field
including the “AM” or “PM” designation.
• Enter the ending date and time in the To fields field
including the “AM” or “PM” designation.
• Click the OK button. This returns to the Trial Search dialog.
Click the Customer arrow button. This opens the Customer
Search Criteria dialog.
• Select a starting customer from the From drop down list, or
click Don’t Care if you don’t want to set any customer
search criteria. (Customers are listed and searched in
alphabetical order.)
• Select an ending customer from the To drop down list.
• Click the OK button. This returns to the Trial Search dialog.
Click the Tags arrow button. This opens the Select Tags dialog.
• To include a tag in the search criteria, highlight it in the
Available Tags list and click the Include button.
• To remove a tag from the search criteria, highlight it in the
Selected Tags list and click the Remove button.
• To create a new tag for the search criteria, click the
Create… button. Refer to the Creating Tags sub-section.
• Click the OK button. This returns to the Trial Search dialog.
Click the Inks button. This opens the Select Inks dialog.
• In the Calibration Sets list box, highlight the calibration
set that contains the inks you want to use. All of the inks in
the calibration set appear in the Available list box.
• Highlight the ink you want to select in the Available list box
and click the Include > button to move it to the Selected
list box. (To remove an ink from the Selected list box,
highlight it and click the Remove < button.) Use the “All”
buttons to move all of the inks from one list box to another.
• Click the OK button. This returns to the Trial Search dialog.
Click the Search… button. This opens the Formulate From Trial
dialog and automatically begins formulating matches from the
trials retrieved from the trial search criteria. The number of
formula combinations are displayed next to Formula:
Combinations, and the closest matches are displayed beneath
the Sort Criteria.
To stop the software from formulating, click the Abort button.
A D V A N C E D
S O F T W A R E
F E A T U R E S
Viewing the Results
After the software has formulated ink matches in the Formulate From Trial
dialog, you may view the results in both formula form and color data form.
The formula is displayed in the formula display area below the Substrate
information, and the color data is displayed in the lower right corner of the
Formulate From Trial dialog. To edit the formula, refer to the Editing
Formulas sub-section. For more information about other formula
conditions, refer to Section Six—Formulating.
EXTRA FEATURE: Ink-Master allows you to repeat the trial search from
within the Formulate From Trial dialog. Simply complete the following
steps.
1.
2.
3.
4.
Click the Search Criteria arrow button to open the Trial Search
dialog.
Set the search criteria according to the steps in the Searching For
Trials sub-section..
Once the criteria is selected, click the Search… button to return to
the Formulate From Trial dialog. (This does not automatically
formulate matches from the trials retrieved.)
Click the Formulate button to formulate the trial matches from the
new search criteria.
The formula display area lists the following types of data: correction factor
—cf (if applicable), % Trial, % Match, and Ink Information. Below is a
list of display options for the current trial match’s color data.
•
•
•
•
Text - This radio button lists the L*, a*, b*, C*, h*, DH, and DE
values for the standard and the sample (match), as well as Delta
values.
Reflectance - This radio button displays the standard curve (in
white) and the sample curve in either green (pass) or red (fail) on a
reflectance graph.
L*a*b* - This radio button displays the standard (in white) and the
sample in either green (pass) or red (fail) on a L*a*b* graph.
Visual - This radio button displays a visual representation of the
standard and the sample.
Steps:
To view your formula results, complete the following steps.
10-31
10
S E C T I O N
T E N
1.
2.
3.
In the list box below the Sort Criteria, highlight the formula you
want to view.
To view the ink information for the formula, click the Ink Info.
arrow button in the formula display area. This opens the Ink
Information dialog.
To view the color data for the match, first select the
illuminant/observer from the drop down list above the display
area. For spherical instruments only, select either the Included
radio button or the Excluded radio button for the data type. Then
select the appropriate radio button to display the match’s color
data: Text, Reflectance, L*a*b*, or Visual.
Accepting a Trial Formulation Match
If you want to accept a formula from trial, you may select it to be included
in the standard’s sample set and prepare the formula for use. To prepare a
formula, Ink-Master allows you to view, modify, print, and export the
formula’s report. This is done in the New Formula Report dialog. This
dialog contains the following items.
NOTE: All percentage units are determined by the selected calibration set.
Refer to Section Five—Establishing Your Database. For information about
amount defaults, refer to Section Four—Software Setup Options.
•
•
•
•
•
10-32
Calibration Set - This shows the current calibration set used for the
formula.
Lot ID - This shows the Lot ID of the sample.
Substrate - This shows the name of the substrate for the formula.
Scaled Amount <type of scaling> - This arrow button opens the
Edit Amount dialog where you enter the scaled amount. The scaled
amount is displayed to the right of this item. The type of scaling is
determined by the Formula Scaling radio button currently selected.
The units drop down list allows you to select the units for the scaled
amount.
Ink Display area - This area lists the names of the inks in the
formula as well as their percentages and amounts. The units drop
down list in this area allows you to select the units for the ink
amounts. If these units are changed, all other units in the dialog reflect
this change. If an amount exceeds the inventory amount, it is
indicated by a red asterisk with an “Exceeds Inventory Amount” note
at the bottom of the dialog.
A D V A N C E D
•
•
•
•
•
•
•
•
•
S O F T W A R E
F E A T U R E S
Ink Components - These radio buttons determine the type of ink
component used in the formula.
• Light - This radio button indicates that only Light Inks are used
in the formula. Light, press ready, inks are used as ingredients in
the mixture.
• Heavy - This radio button indicates that Heavy Inks plus solvent
are used to create the press ready ink mixture.
• Concentrate - This radio button indicates that Concentrate,
extender, and solvent are combined to create the press ready ink
mixture.
Formula Scaling - These radio buttons determine the type of scaling
is used to display the formula. The selected type of scaling is displayed
in the Scaled Amount.
• Total - This radio button indicates that the formula is scaled to
the total amount of all the inks, the extender, and the solvent.
• Extender - This radio button indicates that the formula is scaled
to the amount of the extender only.
• Inks - This radio button indicates that the formula is scaled to the
total amount of the inks only.
Extender - This display line shows the percentage and the amount of
the extender in the formula. The units drop down list in this display
line allows you to select the units for the extender amount.
Solvent - This display line shows the percentage and the amount of
the solvent in the formula. The units drop down list in this display line
allows you to select the units for the solvent amount. This display line
is disabled if the Light radio button is selected for the Ink Mixture
type.
Total Amount - This display line shows the percentage and the total
amount of the formula. The units drop down list in this display line
allows you to select the units for the total formula amount.
Cost of Batch - This display line shows the cost of the batch.
Note - This arrow button opens the Note Editor. The note is displayed
in the note box.
Print - This button allows you to print the formula report. If the Auto
Inventory item is checked in the Options pull down menu, the Edit
Inventory Amount dialog is displayed to allow you to edit the
inventory amounts before the report is printed.
<Export> - This button allows you to export the formula report
(possibly to a dispenser). The name of this button is determined in the
Formula Options function, as well as whether or not this function is
enabled. Refer to Section Four—Software Setup Options.
10-33
10
S E C T I O N
T E N
•
Close - This button closes the New Formula Report dialog.
Steps:
To accept a formula and prepare it to be used, complete the following
steps.
1.
2.
3.
4.
5.
6.
7.
8.
9.
10.
11.
12.
13.
14.
15.
16.
In the list box below the Sort Criteria, highlight the formula you
want to select.
Click the Select button in the Formulate From Trial dialog.
Click the Report… button. This opens the New Formula Report
dialog.
Select the units for the inks.
Select the desired Formula Scaling radio button.
Click the Scaled Amount arrow button.
Enter the scaled amount and click OK.
Select the units for the scaled amount.
Select the applicable Ink Components radio button.
Select the units for the extender.
If available, select the units for the solvent.
Select the units for the total amount.
Click the Note arrow button to enter any notes in the Note Editor.
Refer to Section Ten—Advanced Software Features.
If you want to print the report, click the Print button. If prompted,
you may edit the inventory amounts (and units), then click OK.
If you want to export the report, click the <Export> button.
When finished with the report, click the Close button.
USING BATCH ADD MODE
If you are correcting a formula, Ink-Master allows you to perform a batch
add correction. This determines “add amounts” for the formula you are
correcting rather than creating a new formula for the corrections necessary.
This batch add function is available as the Batch Add Mode check box
in the Correction Options area of the Formulate for Correction dialog.
Refer to Section Six—Formulating.
Batch Add Correction
When the Batch Add Mode check box is checked, two additional check
boxes appear: Minimize DE to Meet Max Add of and Minimize Add
to Meet Max DE of. (You may select either of these check boxes or
neither, but you can not select both check boxes.) Each check box has a
field in which you must enter the appropriate information. For the
10-34
A D V A N C E D
S O F T W A R E
F E A T U R E S
Minimize DE to Meet Max Add of check box, you must enter the
percentage value of a maximum add. For Minimize Add to Meet Max
DE of the check box, you must enter a maximum delta E value for the
batch add.
After a batch add correction is performed, formula information displayed
in the formula display area lists the following type of data: correction
factors—cf, Error amount, Add amount, Total amount, Total Add amount,
and Ink Information.
Steps:
To perform a batch add mode correction, complete the following steps.
1.
2.
3.
4.
Check the Batch Add Mode check box. This displays two
additional check boxes.
If desired, select one of the following batch add mode options.
• To minimize the batch add delta E to meet the maximum
batch add, check the Minimize DE to Meet Max Add of
check box.
• To minimize the batch add to meet the maximum batch add
delta E, check the Minimize Add to Meet DE of check
box.
Click the Correct button to correct the formula.
View your results. Refer to Section Six—Formulating.
Accepting a Batch Add Correction
If you want to accept a batch add correction, you may select it to be
included in the standard’s sample set and prepare the formula for use. For
preparing a formula, Ink-Master allows you to view, modify, print, and
export the formula’s report. This is done in the View Formula - Batch Add
dialog. This dialog contains the following items.
10-35
10
S E C T I O N
T E N
NOTE: All percentage units are determined by the selected calibration set.
Refer to Section Five—Establishing Your Database. For information about
amount defaults, refer to Section Four—Software Setup Options.
•
•
•
•
•
•
•
•
•
10-36
Calibration Set - This shows the current calibration set used for the
formula.
Lot ID - This shows the Lot ID.
Substrate - This shows the name of the substrate for the formula.
Amount of Existing Material - This arrow button opens the Edit
Amount dialog where you enter the amount of existing material. The
amount is displayed to the right of this item. The units drop down list
allows you to select the units for the amount of existing material.
NOTE: If these units are changed, all other units in the dialog reflect
this change.
Desired Total Batch Size - This arrow button opens the Edit
Amount dialog where you enter the amount of existing material. The
amount is displayed to the right of this item.
Ink Display area - This area lists the names of the inks in the
formula as well as their percentages and amounts of existing material
and required add material. The units drop down list in this area allows
you to select the units for the ink amounts. If an amount exceeds the
inventory amount, it is indicated by a red asterisk with an “Exceeds
Inventory Amount” note at the bottom of the dialog.
Ink Components - These radio buttons determine the type of ink
component used in the formula.
• Light - This radio button indicates that only Light Inks are used
in the formula. Light, press ready, inks are used as ingredients in
the mixture.
• Heavy - This radio button indicates that Heavy Inks plus solvent
are used to create the press ready ink mixture.
• Concentrate - This radio button indicates that Concentrate,
extender, and solvent are combined to create the press ready ink
mixture.
Extender - This display line shows the percentage and the amount of
the extender in the existing material and required add material. The
units drop down list in this display line allows you to select the units
for the extender amount.
Solvent - This display line shows the percentage and the amount of
the solvent in the existing material and required add material. The
units drop down list in this display line allows you to select the units
A D V A N C E D
•
•
•
•
•
•
S O F T W A R E
F E A T U R E S
for the solvent amount. This display line is disabled if the Light radio
button is selected for the Ink Mixture type.
Total Add Amount - This display line shows the total add amount
for the batch add formula. The units drop down list in this display line
allows you to select the units for the total formula amount.
Cost of Add ($) - This display line shows the cost of the batch.
Note - This arrow button opens the Note Editor. The note is displayed
in the note box. Refer to Section Seven—Basic Techniques.
Print - This button allows you to print the formula report. If the Auto
Inventory item is checked in the Options pull down menu, the Edit
Inventory Amount dialog is displayed to allow you to edit the
inventory amounts before the report is printed.
<Export> - This button allows you to export the formula report
(possibly to a dispenser). The name of this button is determined in the
Formula Options function, as well as whether or not this function is
enabled. Refer to Section Four—Software Setup Options.
Close - This button closes the View Formula - Batch Add dialog.
Red asterisk
indicates that the
ink exceeds the
inventory amount.
Steps:
To accept a batch add correction formula and prepare it to be used,
complete the following steps.
10-37
10
S E C T I O N
T E N
1.
2.
3.
4.
5.
6.
7.
8.
9.
10.
11.
12.
13.
14.
15.
16.
In the Formulate for Correction dialog, click the Select button.
Click the Report… button. This opens the View Formula - Batch
Add dialog.
Select the units for the amount of existing material.
Click the Amount of Existing Material arrow button.
Enter the amount of existing material and click OK.
Click the Desired Total Batch Size arrow button.
Enter the amount of the total batch size and click OK.
Select the units for the inks.
Select the desired Ink Components radio button.
Select the units for the extender.
If available, select the units for the solvent.
Select the units for the total add amount.
Click the Note arrow button to enter any notes in the Note Editor.
Refer to Section Seven—Basic Techniques.
If you want to print the report, click the Print button. If prompted,
you may edit the inventory amounts (and units), then click OK.
If you want to export the report, click the <Export> button.
When finished with the report, click the Close button.
EDITING FORMULAS
Editing formulas gives the user the ability to adjust formula ink
concentrations. This is done in the Edit Formula dialog. Two edit methods
are available: Manual and Auto Fix.
NOTE: If performing a Batch Add correction, concentration level
adjustments add to existing inks.
When selected,
the << Manual
button turns
into the Auto >>
button and the
five auto fix
buttons are
hidden.
10-38
The five auto fix buttons.
A D V A N C E D
S O F T W A R E
F E A T U R E S
10
The Edit Formula dialog contains the following items.
•
display windows - This dialog contains three display windows that
can be set to display text data, reflectance data, L*a*b* data, or visual
data under a selected illuminant/observer. The illuminant/observer is
selected from the illuminant/observer drop down list. For spherical
instruments only, specular included or excluded can be selected for
each window by selecting the appropriate radio button. NOTE: All
adjustments to the formula are reflected in every display window.
• Text - This radio button displays the L*, a*, b*, C*, h°, DH, DE,
and delta difference values for the standard and sample.
• Refl. - This radio button displays the standard (white) and sample
(green = pass; red = fail) reflectance curves.
• L*a*b* - This radio button displays the selected sample (green =
pass, red = fail) and standard in an L*a*b* color space graph. It
lists the CMC tolerance, the Delta Difference, and the tolerance
values. The + (plus) button increases the viewing scale and the (minus) button decreases the viewing scale. The viewing scale
ranges from 1 to 200 times (1, 2, 5, 10, 20, 100, and 200).
• Visual - This radio button displays the color difference
comparison between a sample and the standard. This window type
10-39
S E C T I O N
T E N
•
•
•
•
•
•
•
•
•
should be used for visual assessment only. The colors that are
displayed do not exactly match the actual colors.
Ink percentage & Name radio button list - This lists the ink
percentage and name for each ink in the formula. Each ink is selected
by its radio button.
Fine - This scroll bar allows you to adjust the ink percent of the
selected ink in fine increments.
Medium - This scroll bar allows you to adjust the ink percent of the
selected ink in medium increments.
Coarse - This scroll bar allows you to adjust the ink percent of the
selected ink in coarse increments.
Auto >> - This button allows correction of hue, chroma or lightness
on an identified L*, a*, b*, C*, or h° value. (TIP: Auto fix editing can
also be used to minimize adds in situations where one ink is added
with slight amounts of others. This is accomplished by zeroing all
percentages, selecting the ink to be added, and fixing the desired
value.) This button displays five auto fix buttons, and it changes to the
Manual << button (which, when selected, “hides” the five auto fix
buttons).
• Fix L* - This button fixes the L* attribute using the selected ink.
• Fix a* - This button fixes the a* attribute using the selected ink.
• Fix b* - This button fixes the b* attribute using the selected ink.
• Fix C* - This button fixes the C* attribute using the selected ink.
• Fix h° - This button fixes the h° attribute using the selected ink.
Zero % - This button zeros all the ink percentages for the formula.
Restore % - This button restores all the ink percentages to their
original values before the Edit Formula dialog was opened.
Save - This button saves the changes to the formula and closes the
Edit Formula dialog.
Cancel - This button closes the Edit Formula dialog without saving
any changes to the formula.
Steps:
To manually edit the formula, complete the following steps.
1.
2.
3.
4.
10-40
Click the Formula arrow button. This opens the Edit Formula
dialog.
Define the three displays windows as you desire.
Click the radio button for the ink you want to adjust.
Use the Fine scroll bar, Medium scroll bar, and/or the Coarse
scroll bar to adjust the ink percentage (or percent add for Batch
A D V A N C E D
5.
6.
S O F T W A R E
F E A T U R E S
Add). NOTE: Only batch add correction formulas allow
adjustment of the extender.
Repeat steps 3 and 4 for each ink you want to edit.
When the formula is edited to your satisfaction, click the Save
button.
Steps:
To auto fix the formula, complete the following steps.
1.
2.
3.
4.
5.
6.
7.
Click the Formula arrow button. This opens the Edit Formula
dialog.
Define the three displays windows as you desire.
Click the Auto >> button. This displays the five auto fix buttons.
Click the radio button for the ink you want to adjust.
Click the auto fix button for the attribute you want to adjust.
Repeat steps 4 and 5 for each ink you want to edit.
When the formula is edited to your satisfaction, click the Save
button.
10-41
10
S E C T I O N
10-42
T E N
AAPPENDIX A
Sample Preparation Guide
WHY DO I HAVE TO PREPARE AN INK DATABASE?
The computer, like the colorist, is only as good as the information with
which it is provided. The computer needs to be educated about the inks and
substrates that you use, just as you were when you first began to do color
formulation work. The spectrophotometer and computer work together to
develop color matches, just as the colorist's eyes and brain work together to
formulate colors.
HOW PRECISE DO I NEED TO BE IN PREPARING THE DATA SET?
The computer needs to know how your inks will perform in a formula. To
best determine this, each ink must be entered at various levels. The
computer will expect that your input is completely accurate, therefore, you
must prepare your data set with precision and accuracy.
WHAT WILL I GAIN BY CAREFUL PREPARATION OF THE DATA SET?
By following the instructions within this sample preparation guide and
adapting the recommendations to your process, you should generate an
accurate, predictable data set. The result of which will save you time and
money by making you a more efficient colorist. Time spent now will pay
off in the future.
IMPORTANT CONSIDERATIONS
When creating a data set, the most important considerations are that this
data is repeatable and accurate. You should work to eliminate as many
variables as possible. Repeatability and accuracy needs to be accomplished
at the laboratory level and emulate production. Any loss of accuracy will be
magnified when the computer predicts color matches. Remember “garbage
in” usually results in “garbage out.”
Thus, as the colorist is responsible for the data set, you need to make some
decisions about techniques and equipment in the creation of these ink
displays. The accuracy of the data set in predicting formulations for your
A-1
A
APPENDIX
A
production process relies upon the proper choices for inks, substrates,
sample preparation tools, and techniques.
RECOMMENDATIONS FOR CREATING A PROPER DATABASE
Substrates:
The substrate you use for the creation of your data set should be similar to
the substrate you use most for production. Once a substrate has been
selected, make sure you obtain enough to make the whole data set, as
switching substrates can introduce error.
Typically, two to three calibration sets are required for each of your ink
systems. Once for coated paper, another for uncoated paper, and yet
another for film, if required. The best choice would be bright white paper
stock. Good paper stock, specifically designed for calibrations, can be
purchased from suppliers. (Refer to the Equipment Suppliers sub-section of
this appendix.) Colored papers, such as kraft, can usually be
accommodated at the time of formulation without a specific calibration set.
If you only formulate on a stock such as kraft or foil, you can get a slight
improvement in initial match accuracy by creating an additional
calibration set for that substrate.
If you use mylar film or foil, it should thick enough to allow ease of use.
Thin films can be difficult to print on due to wrinkling.
If mylar substrate is used, the mylar should be tested for its dyne level. Test
kits are available for this purpose. (Refer to the Equipment Suppliers subsection of this appendix.)
Inks:
Select single lots of all the inks that will be present in the data set. Make
sure you have enough in the case that it becomes necessary to remake any
part of the data set. Store these samples and do not use them for any other
type of sampling or lab work.
When entering your inks into the data set, you will need to tell the software
the composition of that ink (concentrate, extender, solvent). By properly
entering this information, you will then be able to track the amount of
Concentrate, Heavy Ink (concentrate + extender), and Light Ink (heavy ink
+ solvent) you use. Remember, Light Ink is “press ready” ink. Ink-Master
expects all formulas in terms of Light Ink.
If you use a U.V. coating in your production, then you should also use it on
all of your samples. A good data set will mimic your production process.
A-2
SAMPLE
PREPARATION
GUIDE
Sample Size:
The sample weight should be large enough as to improve accuracy by
reducing the effect of weighing errors. As a low limit, use 1000 times the
minimum readable amount of your balance. Therefore the minimum batch
size for a balance with .01g readability is 10 grams.
WHAT LAB EQUIPMENT DO I NEED TO CREATE AN INK DATA SET?
Balance:
Used for precise weighing of your ink samples. It should be electronic and
accurate to two decimal places for accuracy in weighing.
Mixing:
As with all processes, you want to duplicate the mixing process that is used
in you production. If mixing is done manually, the same person should be
used for all samples within a data set.
Proofing:
A reliable proofer must be used to insure the uniformity of samples.
Manually operated devices can lead to variation between samples. A good
proofer can repeatedly apply an even ink film through constant pressure
and print speed.
Ink Pipette:
A volumetric measurement of the ink used to create a proof. A variation in
the amount of ink used will obviously change the thickness of the ink film.
Viscosity Cup:
Used to measure the viscosity (how fluid it is) of your Light Ink (press
ready). Any variance in viscosity will result in a variance of ink film
thickness and effect color.
Refer to the Equipment Suppliers sub-section of this appendix for a list of
suppliers.
HOW DO I CHOOSE WHICH TYPE OF DATABASE TYPE TO USE?
Your Ink-Master software can formulate using two different methods,
Single Constant and Multi-Flux. A Multi-Flux data set is used if you add
opaque white or you have high scattering inks. A Single Constant data set
is used for transparent inks.
A-3
A
APPENDIX
A
SPECIAL CONSIDERATIONS FOR A MULTI-FLUX DATA SET
A Multi-Flux data set is used for scattering inks and inks to which opaque
white may be added. To properly characterize these inks, it is necessary
that the inks be measured over white and over black. Various substrates
can be obtained with the black stripe included. Suppliers of these substrates
can be found in the Equipment Suppliers sub-section of this appendix.
Kraft paper should not be used to create a Multi-Flux data set. Instead, you
should use an uncoated white substrate, and then measure the kraft as the
substrate for your match.
WHAT CONCENTRATION LEVELS SHOULD I USE TO CREATE MY
DATA SET?
When creating a data set, the software needs to “see” your inks at various
concentration levels. We recommended you create six different
concentration levels for each ink. Our recommended ink concentration
levels are listed for you in the Recommended Ink Concentration Levels
sub-section.
WHAT OTHER SAMPLES DO I NEED TO CREATE?
You will also need to make cross-mixes. A cross-mix is a sample that
contains 3-5 different inks at known percentages. These samples are used
to test the accuracy of your data set. A properly prepared data set will be
able to correctly predict the known formula of these cross-mix samples. See
the Recommended Ink Concentration Levels sub-section for some
examples of cross-mixes.
CREATING YOUR SAMPLES
To begin creating your samples, you will need to have all necessary
equipment ready, a supply of substrate, and your inks. After selecting the
proper concentration levels and selecting the sample size, you can begin
weighing your samples. You should be very careful in recording the actual
weights of your samples. The software will accept any value, but that value
must be accurate. For example, if you are creating a 10% ink level, but you
overshoot and weigh 10.08%, you can use this level, just enter 10.08% into
the software.
Next, use your standard procedure for mixing, measuring, and proofing
your ink, making sure that you use the exact same procedure for every
letdown.
A-4
SAMPLE
PREPARATION
GUIDE
The first sample you should make should be the lowest level of your black.
This sample should be created twice, repeating the entire process exactly.
These samples should then be measured and compared to one another. The
purpose of this is to check the repeatability of your process. The larger the
difference between these two samples, the more variance exists in your
process. You may need to refine your process to minimize this variance.
It is important that you operate in an environment controlled as much as
possible. Any changes in temperature or humidity will effect both your inks
and substrates. You should also ensure that you keep your ink mixtures
covered, as any evaporation of solvent will change the overall make-up of
your sample.
Your first data set should be small (3-5 inks) so that it can be evaluated
when you attend a formulation class. This will minimize the number of
samples that need to be remade, should there be any necessary changes.
X-RITE INK FORMULATION CLASS
The X-Rite class you attend will teach you the proper use of the instrument
and software that you have purchased. During this training you will receive
instruction on how to make the most of your powerful new tools.
To maximize this learning experience we ask that you do some preparation
and bring the following materials:
•
•
A data set of 3-5 inks
Cross-mixes that use the inks in your data set
A-5
A
APPENDIX
A
EQUIPMENT SUPPLIERS
Substrates
The Leneta Company
15 Whitney Road
Mahwah, NJ 07430
(201) 847-9300
Proofers
IGT Reprotest
1450 E American Lane
Suite 1400
Schaumburg, IL 60173-4973
(847) 330-6322
Viscosity Cups
Norcross Corporation
255 Newtonville Ave.
Newton, MA 02158-1898
(617) 969-7020
Dyne Level Testing—for Mylar
Sherman Supplies (612) 430-9504
Misc. Lab Equipment—Balances, Etc.
VWR Scientific (800) 932-5000
Cole Parmer (800) 323-4340
Paul N. Gardner Company, Inc.
Gardner Building
316 N.E. First Street
Pompano Beach, FL 33060
(954) 946-9454
A-6
SAMPLE
PREPARATION
GUIDE
RECOMMENDED INK CONCENTRATION LEVELS
•
•
•
•
•
•
A
100.00% Ink
50.00% Ink
25.00% Ink
12.50% Ink
6.25% Ink
3.13% Ink
Cross-Mix Example
Below is an example of a 5 ink data set and the cross-mixes that would be
necessary to test the data set.
Cross-Mix #1
Cross-Mix #2
Cross-Mix #3
Cross-Mix #4
Cross-Mix #5
Ink
Yellow
Red
Green
Orange
Red
Blue
Orange
Blue
Green
Red
Blue
Yellow
Yellow
Green
Orange
Mix Percent
70%
25%
5%
70%
5%
25%
5%
70%
25%
70%
5%
25%
5%
70%
25%
A-7
APPENDIX
A-8
A
BAPPENDIX B
Technical Support
B
X-Rite’s commitment to quality does not end with your product purchase.
We stand behind your system with a strong commitment to customer
service. Our technical service departments are fully staffed with qualified
technicians to assist you via phone or fax. When placing a call, please have
the following information close at hand:
• Your software serial number
• Your name and company name
• Your telephone number
• If the problem you are experiencing caused an error message, write the
message down
• Also, write down the steps you were performing before the problem
occurred
• Have the hardware and/or software running within reach of the
telephone
For Service Assistance
Telephone: 1-888-826-3042
Fax: 1-888-826-3043—include the above listed information in your fax
For Software Assistance via Phone
Telephone: 1-888-826-3046
For Software Assistance via E-Mail
Address: [email protected]— include the above listed information
with “Re: Ink-Master Software” at the beginning of your message
For Software Assistance via World Wide Web
1.
2.
3.
4.
Open the main page of the X-Rite Web Site, www.x-rite.com, and
click on Contacting X-Rite.
Click on Product Questions.
Fill out the “form” provided on that page. Be sure to include “Re: InkMaster Software” at the beginning of your product question.
Click on Submit.
B-1
CAPPENDIX C
Technical Glossary
A
Absolute White: A solid white with known spectral data that is used as the
“reference white” for all measurements of absolute reflectance.
When calibrating a spectrophotometer, a white ceramic plaque is measured
and used as the absolute white reference.
Absorb/Absorption: Dissipation of the energy of electromagnetic waves into
other forms as a result of its interaction with matter; a decrease in
directional transmittance of incident radiation, resulting in a modification
or conversion of the absorbed energy.
Achromatic Color: A neutral color—white, gray, or black—that has
no hue.
Additive Primaries: Red, green, and blue light.
When all three additive primaries are combined at 100% intensity, white
light is produced. When these three are combined at varying intensities, a
gamut of different colors is produced. Combining two primaries at 100%
produces a subtractive primary, either cyan, magenta, or yellow:
100% red + 100% green = yellow
100% red + 100% blue = magenta
100% green + 100% blue = cyan
See Subtractive Primaries
Appearance: Manifestation of the nature of objects and materials through
visual attributes such as size, shape, color, texture, glossiness,
transparency, opacity, etc.
Attribute: Distinguishing characteristic of a sensation, perception or mode
of appearance. Colors are often described by their attributes of hue,
saturation or chroma, and lightness.
C-1
C
APPENDIX
C
Analogous Colors: Colors that are close to each other on the color wheel
and are also harmonious—for example, blues and purples are analogous.
Apparent Dot Area: The percentage of dot coverage in a specific area, as
measured using a densitometer and calculated using the Murray-Davies
equation:
Apparent Dot Area =
1 − 10
1 − 10
−( D t )
−( Ds)
× 100
Where: Dt = Density of tint minus density of paper
Ds = Density of solid minus density of paper
Apparent Dot Gain: The difference between the Apparent Dot Area of the
film, as measured by a transmission densitometer, and the Apparent Dot
Area of the proof or printed sheet, as measured with a reflection
densitometer. Indicates how much the dots of ink have spread in the paper
in relation to the original film dot area.
Apparent Trap Equation (Preucil Equation):
% apparent trap =
D OP − D 1
D2
× 100
Where: DOP = Density of 2-color overprint
D1 = Density of first ink down
D2 = Density of second ink down
B
Black: The absence of all reflected light; the color that is produced when an
object absorbs all wavelengths from the light source.
When 100% cyan, magenta, and yellow colorants are combined, the
resulting color—theoretically—is black. In real-world applications, this
combination produces a muddy gray or brown. In four-color process
printing, black is one of the process inks.
C-2
TECHNICAL
GLOSSARY
The letter “K” is used to represent Black in the CMYK acronym to avoid
confusion with Blue’s “B” in RGB.
Brightness: The attribute of visual perception in accordance with which an
area appears to emit or reflect more or less light (this attribute of color is
used in the color model HSB—Hue, Saturation, Brightness).
See Lightness
C
Chroma: The attribute of visual perception in accordance with which an
area appears saturated with a particular color or hue—for example, a red
apple is high in chroma; pastel colors are low in chroma; black, white, and
gray have no chroma.
Chromatic: Perceived as having a hue; not white, gray or black.
Chromatic Attributes: Those attributes associated with the spectral
distribution of light: hue and saturation.
Chromaticity, Chromaticity Coordinates: Dimensions of a color stimulus
expressed in terms of hue and saturation, or redness-greenness and
yellowness-blueness, excluding the luminous intensity. Generally
expressed as a point in a plane of constant luminance.
See CIE xy Chromaticity Diagram.
CIE (Commission Internationale de l’Eclairage): A French name that
translates to International Commission on Illumination, the main
international organization concerned with color and color measurement.
CIELAB (or CIE L*a*b*, CIE Lab): Color space in which values L*, a*, and
b* are plotted at right angles to one another to form a three-dimensional
coordinate system. Equal distances in the space approximately represent
equal color differences. Value L* represents Lightness; value a* represents
the Redness/Greenness axis; and value b* represents the
yellowness/blueness axis. CIELAB is a popular color space for use in
measuring reflective and transmissive objects.
C-3
C
APPENDIX
C
L*, a*, and b* are defined by the following equation:
Y
Yn
1/ 3
L * = 116
− 16
X 1/ 3 Y 1/ 3
−
Yn
X n
1/ 3
1/ 3
Y
Z
b * = 200
−
Zn
Yn
a * = 500
where:
X, Y, Z are tristimulus values XYZ of the object;
Xn, Yn, Zn are tristimulus values for a perfect reflecting diffuser.
See ∆E*ab Color Difference Equation
CIELUV (or CIE L*u*v*, CIE Luv): Color space in which values L*, u*, and
v* are plotted at right angles to one another to form a three-dimensional
coordinate system. Equal distances in the space approximately represent
equal color differences. Value L* represents Lightness; value u* represents
the Redness/Greenness axis; and value v* represents the
yellowness/blueness axis. CIELUV is a popular color space for use in
measuring emissive objects.
Y
Y 0
L * = 116
1/ 3
− 16 when
Y
Y0
> 0.008856
u* = 13L*(u’ - u’0)
v* = 13L*(v’ - v’0)
where
Y: Tristimulus value Y
u’, v’: Chromaticity coordinates from the CIE 1976 UCS diagram.
Y0, u’0, v’0: Tristimulus value and chromaticity coordinates u’, v’ of the
perfect reflecting diffuser.
See CIE UCS (Uniform Color Space) Diagram, See ∆E*uv Color
Difference Equation, Perfect Reflecting Diffuser.
C-4
TECHNICAL
GLOSSARY
CIE Standard Illuminants: Known spectral data established by the CIE for
four different types of light sources. When using tristimulus data to
describe a color, the illuminant must also be defined. These standard
illuminants are used in place of actual measurements of the light source.
CIE Standard Observer: A hypothetical observer having the tristimulus
color-mixture data recommended in 1931 by the CIE for a 2° viewing
angle. A supplementary observer for a larger angle of 10° was adopted in
1964. If not specified, the 2° Standard Observer should be assumed. If the
field of view is larger than 4°, the 10° Standard Observer should be used.
1.5 cm (5/8″)
2° Viewing Angle
C
45 cm (18″)
7.5 cm (3″)
10° Viewing Angle
45 cm (18″)
C-5
APPENDIX
C
CIE UCS (Uniform Color Space) Diagram: The CIE Uniform Color Space
Diagram was defined in 1976 and was intended to provide a more
perceptually uniform color spacing model than the CIE xy Chromaticity
Diagram. The u’ and v’ values can be calculated from the tristimulus
values XYZ or from the chromaticity coordinates xy according the
following formulae:
u' =
v' =
4X
X + 15Y + 3 Z
9Y
X + 15Y + 3 Z
=
=
4x
−2 x + 12 y + 3
9y
−2 + 12 y + 3
where
X, Y, Z: Tristimulus values;
x,y: Chromaticity coordinates.
See ∆E*uv Color Difference Equation.
C-6
TECHNICAL
GLOSSARY
CIE xy Chromaticity Diagram: A two-dimensional graph of the chromaticity
coordinates, x as the abscissa and y as the ordinate, which shows the
spectrum locus (chromaticity coordinates of mono-chromatic light, 380770nm). It has many useful properties for comparing colors of both
luminous and nonluminous materials.
C
See ∆E*ab Color Difference Equation.
CIE Tristimulus Values: Amounts (in percentages) of the three components
necessary in a three-color additive mixture required for matching a color:
in the CIE System, they are designated as X, Y, and Z. The illuminant and
standard observer color matching functions used must be designated; if
they are not, the assumption is made that the values are for the 1931 CIE
2° Standard Observer and Illuminant C.
C-7
APPENDIX
C
CIE XYZ Tristimulus Values: Tristimulus values formulated based on the
color-matching functions— x( λ ) y( λ) z( λ ) —that were defined in 1931 by
the CIE. Defined for measurement of reflective objects using the following
formulae:
780
X =K
∫ S( λ )x ( λ )R ( λ )d λ
380
780
Y =K
∫ S( λ ) y ( λ ) R( λ )d λ
380
780
Z =K
∫ S( λ ) z ( λ ) R ( λ )d λ
380
K =
100
780
∫ S( λ ) y ( λ )d λ
380
where
S( λ ) : Relative spectral power distribution of the illuminant;
x(λ ) y(λ ) z (λ ) : Color-matching functions for the CIE 2° Standard
Observer;
R ( λ ) : Spectral reflectance of object.
CIE xyz Chromaticity Coordinates: Plotted to for the xyY chromaticity
diagram which visually represents the gamut of vision for the 1931 CIE 2°
Standard Observer. Calculated from the CIE XYZ Tristimulus Values
according to the following formulae:
x =
y=
z=
C-8
X
X +Y + Z
Y
X +Y + Z
Z
X +Y + Z
=1− x − y
TECHNICAL
GLOSSARY
CMC (Color Measurement Committee): Of the Society of Dyes and
Colourists in Great Britain. Developed a more logical, ellipse-based
equation for computing ∆E values as an alternative to the rectangular
coordinates of the CIELAB color space.
CMC Color Difference Equation:
∆Ecmc = [(∆L*lSL)2+(∆C*ab/cSC)2+(∆H*ab/SH)2]1/2
where l = 2, c = 1, * and
∆C*ab = (a*2+b*2)1/2
∆H*ab =[(∆a*)2 + (∆b*)2 - (∆C*ab)2]1/2
C
∆L*, ∆a*, and ∆b* are the differences between the sample and the target
color in the L*, a*, and b* values.
SL =
SC =
0.040975 L *
1 + 0.01765 L *
0.0638∆C * ab
unless L* < 16, then SL = 0.511;
1 + 0131
. ∆C * ab
+ 0.638
SH = SC (FT + 1 - F)
and where
( ∆C * ab ) 4
F=
( ∆C * ab ) 4 + 1900
1/ 2
and
T = 0.36 + 0.4cos (hab + 35) ; unless 164° < hab < 345°, then
T = 0.56 + 0.2cos (hab + 168
CMY: The subtractive primaries cyan, magenta, and yellow.
See Subtractive Primaries
Color Bar (or Production Control Bar): A series of ink patches printed on a
press sheet that includes solids of cyan, magenta, yellow, black, and spot
color ink; 25%, 50%, and 75% tints of those colors; and two-color
overprints using those colors.
C-9
APPENDIX
C
Press operators measure these patches determine the density values of the
solids; dot gain values in the tints; and trap percentages of the overprints.
Some color bars also include special patches to check for other effects, such
as slur and doubling.
Color Correction: A photographic or electronic process that is used to
compensate for the deficiencies of process inks and also the deficiencies of
the color separation process. A color correction can also refer to any color
change requested by the client.
Color Difference: The magnitude and character of the difference between
two object colors under specified conditions.
Color Matching Functions: Relative amounts of three additive primaries
required to match each wavelength of light. The term is generally used to
refer to the CIE Standard Observer color matching functions
designated x ( λ ) + y ( λ ) + z ( λ ) .
See CIE Standard Observer.
x (λ)
y (λ)
z (λ)
Color Model: A color measurement scale or system that numerically
specifies the perceived attributes of color. Used in computer graphics
applications and by color measurement instruments.
C-10
TECHNICAL
GLOSSARY
Color Separation: The conversion of the red, green, and blue color
information used in a computer into cyan, magenta, yellow, and black
channels that are used to make printing plates.
Color Sequence: See Sequence.
Color Space: A three-dimensional geometric representation of the colors
that can be seen and/or generated using a certain color model.
Color Specification: Tristimulus values, chromaticity coordinates and
luminance value, or other color-scale values, used to designate a color
numerically in a specified color system.
Color Temperature: A measurement of the color of light radiated by an
object while it is being heated. This measurement is express in terms of
absolute scale, or degrees Kelvin. Lower Kelvin temperatures such as
2400°K are red; higher temperatures such as 9300°K are blue. Neutral
temperature is gray, at 6504°K.
Color Wheel: The visible spectrum’s continuum of colors arranged into
a circle, where complementary colors such as red and green are located
directly across from each other.
Colorants: Materials used to create colors—dyes, pigments, toners, waxes,
phosphors.
Colorimeter: An optical measurement instrument that responds to color in a
manner similar to the human eye—by filtering reflected light into its
dominant regions of red, green, and blue.
Colorimetric: Of or relating to values giving the amounts of three colored
lights or receptors—red, green, and blue.
Complements: Two colors that, when combined, create neutral gray. On a
color wheel complements are directly opposite the axis from each other:
blue/yellow, red/green, and so on.
Contrast: The level of variation between light and dark areas in an image.
Cyan: One of the process ink colors for printing. Pure cyan is the “redless”
color; it absorbs all red wavelengths of light and reflects all blue and green
wavelengths.
C-11
C
APPENDIX
C
D
D50: The CIE Standard Illuminant that represents a color temperature of
5000°K. This is the color temperature that is most widely used in graphic
arts industry viewing booths.
D65: The CIE Standard Illuminant that represents a color temperature of
6504°K. This is the color temperature that is most widely used in viewing
booths outside of the graphic arts industry.
See Kelvin (K).
Daylight Illuminants: See Illuminants D.
Delta (∆): A symbol used to indicate deviation or difference.
Delta Error (∆E): In color tolerancing, the symbol ∆E is often used to
express Delta Error, the total color difference computed using a color
difference equation.
The color difference is generally calculated as the square root of the
combined squares of the chromaticity differences, ∆a* and ∆b*, and the
Lightness difference, ∆L.
∆E*ab Color Difference Equation:
∆E*ab =
[( ∆
L *) + ( ∆a *) + ( ∆b *)
2
2
2
]
1/ 2
∆E*uv Color Difference Equation:
[
∆E*ab = ( ∆L *) + ( ∆a *) + ( ∆b *)
2
2
2
]
1/ 2
Densitometer: A sensitive, photoelectric instrument that measures the
density of images or colors.
See Reflection Densitometer and Transmission Densitometer
C-12
TECHNICAL
GLOSSARY
Density: The ability of a material to absorb light—the darker it is, the
higher the density. Calculated using the following formulae:
Density = log10 1/R
700
R=
∑ Π( λ )β ( λ )d λ
λ = 390
where:
β ( λ ) = the sample’s spectral reflectance intensity at
wavelength λ .
C
Π( λ ) = densitometer response status (T, E, A, M, etc.).
See Color Bar (Production Control Bar), Reflection Densitometer, and
Transmission Densitometer
Device-Dependence: Describes a color space that can be defined only by
using information on the color-rendering capabilities of a specific device.
For example, the RGB color space must be generated by a monitor, a
device which has specific capabilities and limitations for achieving its
gamut of colors. In addition, all monitors have different capabilities and
limitations, as do different scanners, printers, and printing presses.
Device-Independent: Describes a color space that can be defined using the
full gamut of human vision, as defined by a standard observer, independent
of the color-rendering capabilities of any specific device.
Dot Area: See Apparent Dot Area.
Dye: A soluble colorant; as opposed to pigment, which is insoluble.
Dynamic Range: An instruments range of measurable values, form the
lowest amount it can detect to the highest amount it can handle.
E
Electromagnetic Spectrum: The massive band of electromagnetic waves that
pass through the air in different sizes, as measured by wavelength.
Different wavelengths have different properties, but most are invisible—
and some completely undetectable—to human beings. Only wavelengths
that are between 380 and 720 nanometers in size are visible, producing
C-13
APPENDIX
C
light. Invisible waves outside the visible spectrum include gamma rays, xrays, microwaves and radio waves.
Emissive Object: An object that emits light. Usually some sort of chemical
reaction, such as the burning gasses of the sun or the heated filament of a
light bulb.
F
Flair: The phenomenon where the color of an object changes in appearance
under different illuminants. Also see Metamerism, which involves the
relationship between two colors under different lighting.
Fluorescent Lamp: A glass tube filled with mercury gas and coated on its
inner surface with phosphors. When the gas is charged with an electrical
current, radiation is produced which in turn energizes the phosphors,
causing the phosphors to glow.
Four-Color Process: Depositing combinations of the subtractive primaries
cyan, magenta, yellow, and black on paper. These colorants are deposited
as dots of different sizes, shapes, and angles to create the illusion of
different colors.
See Subtractive Primaries
G
Gamut: The range of different colors that can be interpreted by a color
model or generated by a specific device.
Gamut Mapping: Converting the coordinates of two or more color spaces
into a common color space. Often results in tonal range compression.
See Tonal Range Compression
Gray Balance: The specific combination of cyan, magenta, and yellow that
creates a neutral gray.
H-I
HiFi Color: Any system or technique that expands the color gamut of a
printing press, either with more plates, better inks, or both. HiFi Color is
intended to print products that are brighter and more colorful than regular
four-color offset. The term HiFi Color™ was originally coined by Mills
Davis, founder of the HiFi Color Project.
C-14
TECHNICAL
GLOSSARY
Hue: The basic color of an object, such as “red,” “green,” “purple,” etc.
Defined by its angular position in a cylindrical color space, or on
a Color Wheel.
Illuminate: Incident luminous energy specified by its spectral distribution.
Illuminant A (CIE): CIE Standard Illuminant for incandescent illumination,
yellow-orange in color, with a correlated color temperature of 2856°K.
Illuminant C (CIE): CIE Standard Illuminant for tungsten illumination that
simulates average daylight, bluish in color, with a correlated color
temperature of 6774°K.
Illuminants D (CIE): CIE Standard Illuminants for daylight, based on actual
spectral measurements of daylight. D65 with a correlated color temperature
of 6504°K is most commonly used. Others include D50, D55, and D75.
Intensity: Saturation or reflective energy as related to visible wavelengths of
light. Reflectance of wavelengths at high intensity generates high
saturation, or chroma.
K-L
Kelvin (K): Unit of measurement for color temperature. The Kelvin scale
starts from absolute zero, which is -273° Celsius.
L*C*H°: A color space that is similar to CIELAB, except uses cylindrical
coordinates instead of rectangular coordinates. The Lightness value L* is
the same; Chroma C* and Hue angle H° are defined using the following
formulae:
Metric Chroma: C* =
( a *) 2 + (b *) 2
b *
Metric Hue Angle: h° = tan −1 [degrees ]
a *
where
a*,b*: Chromaticity coordinates in the L*a*b* color space.
Light: Electromagnetic radiation in the spectral range detectable by the
human eye (approx. 380 to 720nm).
Light Booth: See Viewing Booth.
C-15
C
APPENDIX
C
Lightness: The attribute of visual perception in accordance with which
an area appears to emit or reflect more or less light. Also refers to the
perception by which white objects are distinguished from gray objects
and light-from dark-colored objects.
Light Source: The element in an instrument or in the visual observing
situation that furnishes the illuminating light.
Luminance: Term used by the CIE to describe color brightness. Represented
by the Y coordinate in the CIE XYZ color space.
M
Magenta: One of the process ink colors for printing. Pure magenta is the
“greenless” color; it absorbs all wavelengths of green from light and
reflects all red and blue wavelengths.
Memory Colors: Familiar colors such as sky blue, grass green, and flesh
tones. In the printing process, these are the most important colors to
faithfully achieve. If any of these are perceived as even slightly incorrect,
the rest of the image will likely seem incorrect, as well.
Metamerism, Metameric Pair: The phenomenon where two colors appear to
match under on light source, yet do not match under a different light
source. Two such colors are called a metameric pair.
Monitor RGB: Same as RGB; monitor RGB simply refers specifically to the
color space that can be achieved by a particular monitor using
combinations of red, green, and blue light.
N
-9
Nanometer (nm): Unit of length equal to 10 meter, or one millionth of a
millimeter. Wavelengths are measured in nanometers.
Neutral: A color that has no hue. Examples are white, gray, or black.
NTSC (National Television Standards Committee): Standards organization
that provides the standard color model for television displays in the United
States.
O-P
Overprint: On a press sheet color bar, overprints are color patches where
two process inks have been printed, one atop the other. Checking the
C-16
TECHNICAL
GLOSSARY
density of these patches allows press operators determine trap value. The
term Overprint also applies to any object printed on top of other colors.
Perfect Reflecting Diffuser: An object or substrate that is perfectly white,
reflecting 100% of wavelengths of light that strike its surface.
Phosphor Dots: Minute particles of phosphor on a monitor screen. On a
color monitor, the red, green, and blue phosphor dots are placed on the
viewing screen in a pattern of dot triads—a phosphor dot of each color
forming one-third of the triad.
Phosphors: Materials that emit light when irradiated by cathode rays, or
when placed in an electric field. The quantity of visible light is
proportional to the amount of excitation energy present.
C
Photoelectric: Pertaining to the electrical effects of light or other
radiation—for example, emission of electrons.
Photoreceptor: The cone - and rod -shaped neurons that cover the retina of
the eye. Photoreceptors are excited by visible wavelengths, then send
signals to the brain where the sensation of color is perceived.
The cone-shaped photoreceptors are sensitive to one of three major regions
of the visible spectrum: some are sensitive to red light, some to green light,
and some to blue. The rod-shaped photoreceptors are sensitive to black and
white.
Pigment: An insoluble colorant; as opposed to a dye, which is soluble.
Pixel: A tiny picture element that contains red, green, and blue information
for color rendering on a monitor or a scanner. When generating colors,
pixels are similar to dots of ink on paper. A monitor resolution description
in terms of pixels-per-inch (ppi) is similar to a printer resolution
description in terms of dots per inch (dpi).
Preucil Equation: See Apparent Trap Equation (Preucil Equation).
Primary Colors: The dominant regions of the visible spectrum: red, green,
and blue; and their opposite colors cyan, magenta, and yellow.
See Additive Primaries, Subtractive Primaries
Prism: Triangular-shaped glass or other transparent material. When light is
passed through a prism, its wavelengths refract into a rainbow of colors.
C-17
APPENDIX
C
This demonstrates that light is composed of color, and indicates the
arrangement of colors in the visible spectrum.
See Visible Spectrum
Process Colors: See Four-Color Process.
R
Reflective Object: A solid object that returns some or all of the wavelengths
of emitted light that strike its surface. A reflective object that returns 100%
of all light it is called a perfect diffuser—a perfectly white surface.
Reflectance: The percentage of light that is reflected from an object.
Spectrophotometers measure an object’s reflectance at various intervals
along the visible spectrum to determine the object color’s spectral curve.
See Spectral Curve, Spectral Data
Reflection Densitometer: An instrument that measures the amount
of incident light that is reflected from the surface of a substrate, such as ink
on paper.
Retina: A light-sensitive membrane lining the inner rear of the eyeball and
connected to the brain by the optic nerve.
RGB: The additive primaries red, green, and blue.
See Additive Primaries
S
Saturation: The attribute of color perception that expresses the amount of
departure from the neutral gray of the same lightness. Also referred to as
chroma.
Sequence: The order in which inks are deposited on paper by a printing
press.
Spectral Curve: A color’s “fingerprint”—a visual representation of a color’s
spectral data. A spectral curve is plotted on a grid comprised of a vertical
axis—the level of reflectance intensity; and a horizontal axis—the visible
spectrum of wavelengths. The percentage of reflected light is plotted at
each interval, resulting in points that form a curve.
C-18
TECHNICAL
GLOSSARY
Spectral Data: The most precise description of the color of an object. An
object’s color appearance results from light being changed by an object and
reflected to a viewer. Spectral data is a description of how the reflected
light was changed. The percentage of reflected light is measured at several
intervals across its spectrum of wavelengths. This information can be
visually represented as a spectral curve.
Spectrophotometer: An instrument that measures the characteristics of light
reflected from an object, which is interpreted as spectral data.
Spectrum: Spatial arrangement of electromagnetic energy in order of
wavelength size.
C
See Electromagnetic Spectrum, Visible Spectrum
Standard: An established, approved reference against which instrument
measurements of samples are evaluated.
Standard Illuminants: See CIE Standard Illuminants.
Standard Observer: See CIE Standard Observer.
Status: Term used for spectral response of reflection densitometers.
Standard Status responses include:
•
•
•
•
•
Status A represents ANSI Status A, which is used in photo finishing
applications.
Status E represents a European response which uses a 47B filter for
yellow.
Status I represents a narrow band response.
Status T represents ANSI Status T.
Spectral X represents a spectral based band pass filter.
Subtractive Primaries: Cyan, Magenta, and Yellow. When all three
subtractive primaries are combined at 100% on white paper, black is
produced. When these three are combined at varying intensities, a gamut of
different colors is produced. Combining two primaries at 100% produces
an additive primary, either red, green, or blue:
100% cyan + 100% magenta = blue
100% cyan + 100% yellow = green
100% magenta + 100% yellow = red
C-19
APPENDIX
C
See Subtractive Primaries
T
Tint: On a press sheet color bar, a patch of halftone dots that represents a
percentage of the solid ink, such as a 25%, 50%, or 75% tint. Tints on the
film are measured to determine apparent dot area, and tints on paper are
measured and compared to the film to determine apparent dot gain.
See Apparent Dot Area, Apparent Dot Gain
Tolerance: The amount of acceptable difference between a known correct
standard and a set of measured samples. Color measurements are evaluated
using the ∆E tolerancing method.
See ∆E Error
Tonal Range Compression: The color space coordinates of a color space
with a larger gamut are reduced to accommodate the smaller gamut of a
destination color space. For example, the gamut of photographic film is
compressed for representation in the smaller CMYK gamut used for fourcolor process printing.
See Gamut
Transmission Densitometer: An instrument that measures the amount of
light that is transmitted through film from a light source.
Transmissive Object: An object that allows light to pass through from one
side to the other. The color of a transmissive object results from the
manipulation of wavelengths of light as they pass through.
Trap: An indication of the ability of a printed ink to accept the next ink
printed, in comparison with the paper’s ability to accept the second ink
down.
See Apparent Trap Equation (Preucil Equation)
Tristimulus: A method for communicating or generating a color using three
stimuli—either additive or subtractive colorants (such as RGB or CMY), or
three attributes (such as lightness, chroma, and hue).
Tristimulus Data: The three tristimulus values that combine to define or
generate a specific color, such as R 255/G 255/B 0. Tristimulus data does
not completely describe a color—the illuminant must also be defined. Also,
C-20
TECHNICAL
GLOSSARY
in device-dependent color models such as RGB, the capabilities of the
viewer or color-rendering device must also be defined.
V
Value: Another term for Chroma or Saturation.
Viewing Booth: A enclosed area with controlled lighting that is used in
graphic arts studios, service bureaus, and printing companies as a stable
environment for evaluating proofs and press sheets. Viewing booths for the
graphic arts industry are generally illuminated using D50 lighting
(otherwise D65 lighting), and are surfaced in neutral gray colors.
See D50 and D65
C
Visible Spectrum: The region of the electromagnetic spectrum between 380
and 720 nanometers. Wavelengths inside this span create the sensation of
color when they are viewed by the human eye. The shorter wavelengths
create the sensation of violets, purples, and blues; the longer wavelengths
create the sensation of oranges and reds.
Colors of the visible spectrum blend seamlessly between major regions of
color, which are arranged in the following order:
Ultra-Violet—Violet—Indigo—Blue—Green—Yellow—Orange—Red—Infra-Red
(Invisible)
(Invisible)
W-X-Y
Wave: A physical activity that rises and then falls periodically as it travels
through a medium.
Wavelength: Light is made up of electromagnetic waves; wavelength is the
crest (peak)-to-crest distance between two adjacent waves. Represented in
equations by the Greek symbol Lambda (λ).
White Light: Theoretically, light that emits all wavelengths of the visible
spectrum at uniform intensity. In reality, most light sources cannot achieve
such perfection.
XYZ Color Model: See CIE XYZ Color Model.
xyY Chromaticity Diagram: See CIE Chromaticity Diagram.
C-21
APPENDIX
C
Yellow: One of the process ink colors for printing. Pure yellow is the
“blueless” color; it absorbs all wavelengths of blue from light and reflects
all red and green wavelengths.
C-22
Index
A
C
Accept status, 7-18
Accept/Reject/Undetermined, 3-3
Accept/Reject/Undetermined status, 10-18
Accepting a trial formulation match, 10-27
Accepting or rejecting a sample, 7-17
Access Levels, 4-2
password, 4-2
Active Window, 3-6
Adding notes & tags to samples, 7-17
Advanced ink selection methods
ink filter, 10-19
ink set, 10-19
Alternate Entry Methods, 10-14
contrast ratio, 10-15
manually (keyboard), 10-14
Alternate standards, 10-17
create, 10-17
select, 10-17
Apparent Strength, 9-25
Auto Arrange, 4-7
Auto inventory, 4-10
Edit Inventory Amount, 4-10
Auto L*a*b*, 4-7
Auto Trend, 4-7
Calibration Data
create, 5-12
delete, 5-15
edit, 5-13
Calibration Inks
calibration data, 5-10
create, 5-8
edit, 5-8
Calibration Methods
multi-flux, 5-4
single constant, 5-4
Calibration Set, 5-4
ink components, 5-5
secondary, 5-5
setting up, 5-4
Clicking, 3-4
Color at Equivalent Strength, 9-25
Combinatorial Formulation dialog, 6-8
Complete Report, 7-9
Concentrate, 5-5
Conformance Report, 7-9
Connecting your instrument, 2-2, 3-3
Control Window, 1-4
Controls Window, 3-3
Copy
samples, 8-2
standards, 8-2
Correction, 6-13
Correction Factors, 6-13
Crosshair Cursor, 3-6
Custom Report, 7-11
create, 7-11
export, 7-14
Customers, 5-2
create, 5-2
delete, 5-2
edit, 5-2
B
Backup database, 8-19
cycle, 8-20
strategy, 8-20
Batch Add Mode, 6-13, 10-29
accept correction, 10-30
correction, 10-29
Index-1
INDEX
D
Database Options, 4-3
Desktop Area, 1-4
display driver settings, 1-4
Display options, 4-7
Double Clicking, 3-5
Download
group names, 8-3
standards, 8-4
Dragging, 3-4
E
Edit formula, 10-37
Ellipsis, 3-2
Export
ink, 8-17
standard, 8-15
F
Filters, 10-2
ink, 10-10
sample, 10-2
standard, 10-6
Finding a standard, 7-20
Finding samples, 7-23
Formulate at exit, 10-25
Formulate for Correction dialog, 6-15
Formulate from queue, 10-25
view results, 10-26
Formulate from trial, 10-27
accept trial match, 10-31
search for trial, 10-27
view results, 10-29
Formulating a Match, 6-9
Formulation
accepting a correction, 6-17
accepting a match, 6-17
formulating an ink match, 6-12
improving the match, 6-15
selecting conditions, 6-11
testing the match, 6-14
Index-2
viewing correction results, 6-16
viewing results, 6-13
Formulation Options, 4-3
Fresnel reflection coefficient, 5-7
G
General Report, 7-10
Getting Help!, 3-7
Grayed item, 3-2
H
Heavy Inks, 5-6
Help Cursor, 3-6
Help Cursor Method, 3-7
Help Glossary Cursor, 3-6
Help Index Method, 3-7
I
Indices
Apparent Strength, 9-26
Color at Equivalent Strength, 9-26
Ink Components, 6-17
Ink-Master main screen, 3-2
Inks
selecting, 6-9
Installing the Security Key, 1-3
Installing the Software, 1-2
Windows 3.1, 1-2
Windows 95, 1-2
Instrument Calibration, 2-4
Instrument Key Operation, 8-5
Instrument Mode, 4-10
Instrument Port, 4-10
Instrument Sample Deletion, 8-6, 8-10
K
Keyboard Keys
Active Window, 3-7
Menu Item, 3-7
Keyboard Keys, 3-6
INDEX
L
P
Light Inks, 5-6
Lot IDs, 10-14
find sample, 10-15
find standard, 10-15
Paste
sample, 8-3
standards, 8-2
Pointing, 3-4
Printing, 7-8
application screen, 7-8
complete report, 7-9
conformance report, 7-9
custom report, 7-14
general report, 7-8
Pull Down Menus, 3-2
M
Main Screen
Controls Window, 3-3
Desktop Area, 3-4
Measure
Over Black/Over White, 7-4
sample color, 7-2
sample color and opacity, 7-4
trial, 7-6
Measuring techniques, 2-4
Menu Bar, 1-4, 3-2
Ellipsis, 3-2
Grayed Item, 3-2
Pull Down Menus, 3-2
Menu Item, 3-6
Mouse, 3-4
Clicking, 3-4
Crosshair Cursor, 3-6
Double Clicking, 3-5
Dragging, 3-4
Help Cursor, 3-6
Help Glossary Cursor, 3-6
Pointing, 3-4
Resize Cursor, 3-6
Selection Tool Cursor, 3-6
Text Cursor, 3-6
Wait Cursor, 3-6
Multi-Flux Graph Selection, 5-11
Multi-Flux ink calibration, 7-4
N
New Formula Report dialog, 6-15
Note Editor, 7-15
Q
Queue up matches, 10-22
R
Record visual assessment of sample, 7-18
Recycling waste ink, 10-20
Reject status, 7-18
Request Queue, 10-22
Resize Cursor, 3-6
Resize Cursor, 3-6
Restore database, 8-21
Results Queue, 10-22
S
Samples
search by Lot ID, 7-21
search with filter, 7-21
Secondary Calibration Sets, 5-5
create, 5-15
detach, 5-17
Security key, 1-2
Select Job dialog box, 1-4
Selection Tool Cursor, 3-6
Series of matches, 10-22
Setting Tolerances, 6-3
Single Constant Graph Selection, 5-11
Single constant ink calibration, 7-2
Index-3
INDEX
Standards, 6-2
create/edit, 6-2
delete, 6-3
measure and find, 7-18
search by Lot ID, 7-20
search by matching sample, 7-20
search by name, 7-19
search for with filter, 7-19
Starting the Software, 1-4
Substrate
create, 5-17
delete, 5-18
edit, 5-18
Substrate Library, 5-17
Suppliers, 5-2
create, 5-3
delete, 5-3
edit, 5-3
T
Tags
general, 10-12
ink, 10-11
Text Cursor, 3-6
Tolerances, 6-3
create/edit, 6-5
DE, 6-4
DECMC, 6-4
Density, 6-5
FMC2, 6-5
L*a*b*, 6-3
L*a*b* Asymmetric, 6-5
L*C*h°, 6-3
Metamerism, 6-4
Strength, 6-4
Whiteness Index, 6-4
Yellowness Index, 6-4
Transfer in
calibration set, 8-18
standard, 8-18
Update prompts, 8-19
Transfer out
calibration set, 8-18
standard, 8-17
Trial, 6-12
Index-4
Tutorial, 1-5
U
Undetermined status, 7-18
Units of Measure, 4-6
Upload
group names, 8-12
standards, 8-13
User Defined Controls, 4-7
User Interface
Getting Help!, 3-7
Keyboard Keys, 3-6
Mouse, 3-4
V
View
arrange icons, 9-4
cascade, 9-3
controls, 9-5
delete all windows, 9-25
FMC2, 9-9
formula, 9-19
general indices, 9-23
L*a*b*, 9-7
L*a*b* data, 9-17
notes and tags, 9-20
spectral, 9-11
spectral data, 9-17
status density, 9-13
status density data, 9-18
textile indices, 9-24
tile, 9-4
tolerance, 9-4
trend, 9-14
verbal color, 9-22
visual color, 9-22
View Defaults, 4-8
View menu, 9-2
View Specific menu, 9-4
Viewing Downloaded Standard Data, 8-10
Visually editing tolerances, 10-18
INDEX
W
Wait Cursor, 3-6
Waste ink
create, 10-20
Window menu, 9-2
Index-5
INDEX
Index-6
P/N 1222-500-01 Rev. D-4/20/99