1
1. TESTS FOR CHANGES
19
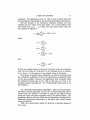
1.5. Distribution-free CUSUM. This non-parametric test is implemented, in general case, as in [2]. The test statistic is KS defined
in [2]. If n is the length of the time series and oi, 02,..., a n denote the
time series values, then the test statistic satisfies the formula:
\KS\ = - max ^ s g n ( a i - M )
71 l<fc<n
i=l
where M denotes the median of time series values, and the sign of
KS matches the sign of the corresponding inner sum for which the
maximum absolute value was reached.
This test is based on the assumption that the number of values in
the series below the median and the number of values above the median
are the same. In case of ties, specifically if values equal to the median
are present in the series, this might not be true. In this case, distinct
weights are used for the values above and below the median to make
sure that the total cumulative sum is unbiased and the assessment of
significance by means of the Kolmogorov-Smirnov test is valid. The
weights for each group of values are equal to the reciprocal of their
quantity, analogously to [2].
If there are missing values in the series, the Distribution-free CUSUM test is applied to the non-missing values, as if they were consecutive in the series. Significance level computed is valid under the
null hypothesis of independent, identically distributed values. As an
option, the point k at which the cumulative sum was greatest is also
displayed.
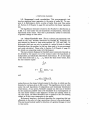
1.6. Cumulative deviations. This parametric test is described
in [1], [2] and [14]. The test statistic is the value denoted by Q in those
papers. If n is the length of the time series and 01, c&2,..., an denote
the time series values, then the test statistic equals:
Q — — maxY^{a>i ~ m)
<J \<k<n
i=l
where m is the mean of time series values, and a is the standard deviation.
Significance level is computed according to the limit distribution
(valid for long time series) given in [1]. For series of 100 observations or
shorter, Buishand [1] gives a table of percentage points for the statistic
divided by the square root of the series length. This measure can also
be computed here as an option, so the significance can be easily looked
up in the table. The same table is reproduced in [14], although it
appears under a different heading. Please note that you do not need
to use such a table if you compute the significance using resampling,
cf. Section 4 of Chapter 3, page 24.