1
Technical Report UMTRI-96-30
December, 1996
Destination Entry and Retrieval with
the Ali-Scout Navigation System
Aaron Steinfeld, Daniel Manes,
Paul Green, and David Hunter
umtri
HUMAN FACTORS
Technical Report Documentation Page
1. Report No.
2. Government Accession No.
3. Recipient’s Catalog No.
UMTRI-96-30
4. Title and Subtitle
5. Report Date
Destination Entry and Retrieval with the
Ali-Scout Navigation System
December, 1996
7. Author(s)
8. Performing Organization Report No.
Aaron Steinfeld, Daniel Manes, Paul Green,
and David Hunter
UMTRI-96-30
9. Performing Organization Name and Address
10. Work Unit no. (TRAIS)
The University of Michigan
Transportation Research Institute (UMTRI)
2901 Baxter Rd, Ann Arbor, Michigan 48109-2150
11. Contract or Grant No.
12. Sponsoring Agency Name and Address
13. Type of Report and Period Covered
Road Commission of Oakland County (RCOC)
31001 Lahser, Beverly Hills, MI 48025 USA
10/94 - 12/96
6. Performing Organization Code
account 032923
14. Sponsoring Agency Code
15. Supplementary Notes
This research was funded by RCOC and the Federal Highway Administration.
After training, 36 drivers retrieved and entered a total of 20 destinations using an AliScout navigation computer and 10 destinations using a touchscreen simulation while
sitting in a vehicle mockup. Retrieval involved keying in part of the destination name,
scrolling through a list of names, or some combination of those methods. Entry
required keying in the destination's name, longitude, and latitude. Tasks using the
real interface were performed under both dusk and nighttime lighting conditions,
although the simulated interface was used only at dusk.
Some of the destination entry and retrieval times were unusually long. As a result,
medians are more typical times than means (although means were used for ANOVA
comparisons). Median retrieval times ranged from 0.4 to 12.0 seconds with an overall
median of 6.2. Median entry times ranged from 39.5 to 67.6 seconds with an overall
median of 51.5. An additional 30 to 60 seconds were required to look up coordinates
in a manual. Mean times for men were 34 percent longer for retrieval and 19 percent
longer for entry than mean times for women—both differences were statistically
significant. The ratio of mean times for older subjects to mean times for young
subjects was 2.8 for retrieval and 2.2 for entry. Performance also varied with context.
For retrieval, the lighting condition was not significant but the simulated Ali-Scout took
about 75 percent longer than the real Ali-Scout. For entry, times were 22 percent
longer at night than at dusk, 37 percent longer using the simulated interface.
Usability problems found involve labeling of keys, the logic for shift key use, and
changing fields. Key size and spacing and the lack of feedback were also concerns.
17. Key Words
18. Distribution Statement
ITS, human factors, ergonomics,
driving, navigation, route guidance,
cartography, usability, input devices,
controls, keyboards
No restrictions. This document is
available to the public through the
National Technical Information Service,
Springfield, Virginia 22161
19. Security Classify. (of this report)
20. Security Classify. (of this page)
21. No. of pages
none
none
91
Form DOT F 1700 7 (8-72)
22. Price
Reproduction of completed page authorized
ii
Destination Entry and Retrieval
with the Ali-Scout Navigation System
UMTRI Technical Report 96-30
Aaron Steinfeld, Daniel Manes,
Paul Green, and David Hunter
University of Michigan,
Ann Arbor, Michigan, USA
1
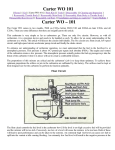
The Ali-Scout Keyboard (95% actual size)
ISSUES
1. How long does it take to enter and retrieve destinations using the Ali-Scout?
2. How does the Ali-Scout compare with other navigation systems?
3. How does performance vary as a function of driver age and sex, ambient
illumination (dusk vs. night), and interface type (real vs. simulated)?
4. What kinds of problems do drivers encounter and how can they be corrected?
5. How accurate are subjects in looking up coordinates in the manual?
2
METHOD
# of Trials
# of Subjects
Age
Men
Women
18 - 30
6
6
40 - 55
6
6
> 65
6
6
Real Ali-Scout Simulated
Ali-Scout
Task
Dusk
Night
Dusk
Retrieve destination
from unit's memory
5
5
5
Enter new destination
5
5
5
Task #1
Task #2
Retrieve destination from memory
• Retrieve "MAIN THEATER"
Scroll through list
OR
Type characters
A1
L
B2
M
C3
N-
D4
O
...
...
MA ...........
Enter new destination into memory
• Enter "KROGERS" with coordinates
(0832250W, 422908N)
Type characters
ONLY
A1
L
B2
M
C3
N-
D4
O
KROGERS ......
(Subject has begun typing "MAIN")
(Subject has typed the destination name)
MA I N T HEA T ER ?
KROGERS
0 83 2250 W 4 22 908N
(Once the "I" is typed, the rest of the name appears)
iii
(Subject has typed the coordinates)
...
...
3
RESULTS
Distribution of trial times for each of the two tasks
0
20
Destination Retrieval
Destination Entry
• Median = 6.23 s
• Mean = 10.48 s
• Median = 51.48 s
• Mean = 64.68 s
40
60
80
100
120 0
100
200
Effect of Age and Sex on Performance
Destination Retrieval
Destination Entry
20
p(Age)<.0001
16 p(Sex)=.0055
p(AxS)=.0388
p(Age)<.0001
90 p(Sex)<.0001
p(AxS)=.0948
12
8
Time (s)
4
Young Middle
2
50
1
Older
Young Middle
Women
Destination Entry
3
Time (s)
400
Men
70
30
300
p(Age)<.0001
p(Sex)=.2799
p(AxS)=.7867
Errors
0
Older
Young Middle
Older
Effect of Condition (Night/Dusk/Simulated) on Performance
Destination Retrieval
Destination Entry
Destination Entry
8 5 p(Dsk/Nt)=.0004
p(Dsk/Sim)<.0001
7 5 p(Nt/Sim)=.0087
p(Dsk/Nt)=.3917
1 6 p(Dsk/Sim)<.0001
p(Nt/Sim)<.0001
12
65
8
55
Time (s)
4
Night
4
1.2
1
.8
.6
Dusk
Sim
Time (s)
45
Night
Dusk
Sim
p(Dsk/Nt)=.5013
p(Dsk/Sim)=.0055
p(Nt/Sim)=.0316
.4
.2
0
Errors
Night
Dusk
Sim
CONCLUSIONS
• Destination entry typically took subjects almost 60 s excluding coordinate
lookup time (30 to over 60 s), while retrieval typically took under 10 s.
• Entry and retrieval times were significantly longer for older vs. younger
subjects and women vs. men.
• Entry and retrieval times were significantly longer for night-condition vs.
dusk-condition trials and simulated-interface vs. real-interface trials.
• The Ali-Scout keys are too small, too close together, and do not provide
enough positive feedback when pressed. Some labels should be improved.
• The shifting and spacing functions are confusing.
• The results raise major concerns regarding the usability of any on-road
navigation system that relies upon longitude and latitude for destination ID.
iv
PREFACE
This report is one of a series supported by the Road Commission of Oakland County,
Michigan, and the Federal Highway Administration, as part of the FAST-TRAC (Faster
and Safer Travel through Traffic Routing and Advanced Controls) Project. (See
Underwood, 1994: Eby, Streff, Wallace, Kostyniuk, Hopp, and Underwood, 1996;
Taylor and Wu, 1995; Kostyniuk, and Eby, 1996 for related research.) This operational
field test combines the SCATS (Sydney Coordinated Automatic Traffic Control
System) equipment and software, the Autoscope video detection system, and the AliScout (Autofahrer Leit und Information System Scout) dynamic route-guidance
system. The goals of this effort are to improve traffic flow and reduce traffic accidents
in Oakland County and the surrounding area.
Ali-Scout is a second generation product developed by Siemens, which provides
real-time, turn-by-turn guidance to drivers who have units installed in their vehicles.
Ali-Scout vehicles communicate with infrared roadside beacons, which send travel
times to the traffic control center and receive sequential routing instructions from the
center.
If navigation products are to be produced, they must be safe and easy to use. The
original program plan called for four human factors studies to examine safety and
usability (1) destination entry and retrieval in the laboratory, (2) route following on the
road using the Ali-Scout in an instrumented car, (3) getting lost (where drivers are
taken off route to see how they and the navigation system recover), and (4) a
comparative evaluation of alternative navigation interfaces. Study 4 was canceled
first, weakening study 2 (as it was intended to provide baseline data for the Ali-Scout).
Subsequently, study 3 was canceled for lack of funding (midway through study 2).
During the original definition of the project, the focus was evaluation of the Ali-Scout
interface, with comparisons occurring in study 4. However, as the project unfolded, it
became clear that a beacon-based system with some of the limitations present in the
Ali-Scout interface was not likely to represent future products in the U.S. Further, the
cancellation of studies 3 and 4 meant that pilot comparison data had to be conducted
in earlier studies, so that the safety of the Ali-Scout interface could be assessed. As a
consequence of these changes, emphasis was shifted towards a more general
assessment of the desired qualities in navigation interfaces and protocols for
assessing them. Such shifts occurred without compromising the intent of the project
as it was initially framed.
Driver navigation-related tasks include (1) calibration and set up, (2) telling the system
where the driver wants to go (destination designation), and (3) following the guidance
instructions. The second and third tasks are more important. The human factors work
carried out in the FAST-TRAC project is described in five reports. Matters related to
destination designation are covered in this report and a subsequent report on models
the prediction of keystroke entry times (Manes, Green, and Hunter, 1996b). Research
relating to following route guidance is covered in three reports, one concerning
equipment used in the evaluation (Katz, Green, and Fleming, 1995), one concerning
turn errors, driving performance, and subjective ratings (Katz, Fleming, Hunter, Green,
and Damouth, 1996), and a third concerning driver eye glances (Manes, Green, and
Hunter, 1996a, in progress).
v
This particular report concerns the second task, destination designation. Relevant
topics include how drivers determine the coordinates for a new destination, how
drivers enter coordinates into the navigation computer, and how they retrieve
previously entered destinations. Times and errors for these tasks were collected.
In addition, this report addresses a larger, more fundamental scientific issue—whether
a touchscreen simulation of the real product is sufficient for usability assessments.
The simulation takes much less time to construct and is easier to modify, facilitating
iterative design.
Several individuals and organizations made important contributions to this effort and
their contributions are gratefully acknowledged.
Amitaabh Malhotra
(formerly of UMTRI)
for programming the Ali-Scout simulation
Patrick Wei, Marie Williams
(formerly of UMTRI)
for programming the Ali-Scout simulation
Sara Naylor
(formerly of UMTRI)
for testing some initial subjects
Finally, the authors would like to thank Cale Hodder of Toyota for encouraging the
authors to include Japanese-style A3 reports (the two-page summary prior to the
Preface) in our technical reports.
vi
TABLE OF CONTENTS
INTRODUCTION .............................................................................1
Why this topic is of interest..............................................................................1
Previous research.............................................................................................1
Research issues explored...............................................................................14
TEST PLAN ....................................................................................1 7
Test participants................................................................................................17
Test materials and equipment........................................................................17
Ali-Scout interface ................................................................................17
Driving simulator...................................................................................22
Miscellaneous equipment...................................................................24
Test activities and their sequence .................................................................24
R E S U L T S .......................................................................................2 9
Data reduction method ....................................................................................29
Overview of the entry and retrieval data.......................................................31
What were typical entry and retrieval times (and error rates) for
destinations? ...................................................................................................33
Did performance change with practice?.......................................................35
How did performance (time and errors) vary as a function
of driver age and sex? ...................................................................................37
What subject factors other than age and sex influenced performance
in this experiment? .........................................................................................40
Were the times and errors the same for real
and simulated interfaces?.............................................................................42
How accurate were subjects in looking up coordinates
in the manual?.................................................................................................47
CONCLUSIONS AND DISCUSSION ..............................................4 9
How can the analysis protocol be improved? .............................................49
What were typical entry and retrieval times (and error rates)
for destinations?..............................................................................................49
Did performance change with practice?.......................................................49
How did time and errors vary as a function of driver age and sex? ........49
What subject factors other than age and sex influenced performance
in this experiment? .........................................................................................50
How did time and errors vary as a function of ambient illumination? .....50
Were the times and errors the same for real and
simulated interfaces?.....................................................................................51
What kinds of problems did drivers of all ages encounter
(and how can they be corrected)?...............................................................51
How accurate were subjects in looking up coordinates
in the manual?.................................................................................................54
How did performance with the Ali-Scout interface compare with other
systems described in the literature?............................................................54
In closing ............................................................................................................56
vii
REFERENCES ................................................................................5 7
APPENDIX A -
MEAN TASK TIMES FOR MOTOROLA
PROTOTYPE 2 ......................................................6 1
APPENDIX B -
DISPLAY UNIT LOCATION ...................................6 3
APPENDIX C -
LIGHT LEVELS FOR THE EXPERIMENTAL
CONDITIONS........................................................6 5
APPENDIX D -
BIOGRAPHICAL FORM..........................................6 7
APPENDIX E -
CONSENT FORM ..................................................6 9
APPENDIX F -
INSTRUCTIONS TO SUBJECTS...........................7 1
APPENDIX G -
EXPERIMENTAL DETAILS....................................7 9
APPENDIX H -
PRACTICE SHEET................................................8 1
APPENDIX I -
RETRIEVAL DATABASE........................................8 3
APPENDIX J -
DISPLAY UNIT POST-TEST QUESTIONNAIRE ....8 5
APPENDIX K -
ANOVA TABLES ...................................................8 7
viii
INTRODUCTION
Why this topic is of interest
One of the more interesting recent developments for motor vehicles has been the
advent of navigation systems. Most of the systems planned or in production identify
the location of a vehicle on an electronic map and provide both visual and voice
directions to driver-selected destinations. In some systems, current traffic conditions
are considered in route calculations. Navigation systems are very popular in Japan
(Treece, 1996) and may see broad market penetration in the U.S.
Such systems can reduce wasted travel, saving drivers time and fuel, and provide for
operational efficiency by optimizing use of the road network. By decreasing driving
under uncertain conditions and eliminating the use of paper maps while driving,
accidents may be reduced. Finally, these systems will offer comfort and convenience
to drivers. However, such positive outcomes are predicated upon the assumption that
these systems are safe and easy to use.
There are two primary driver tasks in using these products: (1) entering and retrieving
stored destinations, and (2) following the directions given by these systems (route
guidance). Secondary tasks include setting and calibrating the system. Route
following deserves the most attention because it occurs while the vehicle is in motion.
Route following is covered in other reports in this project (Katz, Green, and Fleming,
1995; Katz, Fleming, Hunter, Green, and Damouth, 1996). However, destination
designation also must be considered. Generally, destination designation is assumed
to be performed while the vehicle is stopped or parked. However, in many
circumstances, such as driving on an expressway, stopping may be difficult, so
destination designation while in motion may be less risky. There is great concern as to
what a driver can do while in motion (Zwahlen and DeBald, 1986; Zwahlen, Adams,
and DeBald, 1988).
Previous research
Several studies in the literature have examined the entry of location names, street
addresses, and coordinates, a focus of this experiment. The review provided here is
extremely detailed. Those details concern subject samples, tasks, and test protocols,
all necessary to make comparisons of the relative ease of use of alternative interfaces.
One method to enter navigation information is to use a telephone keypad (Figure 1), a
topic addressed by Marics (1990). Keypads require a minimal of instrument panel
space, a premium in contemporary vehicles. Marics examined behavior for entering
names including q, z, apostrophe, and hyphen, characters not present on a keypad but
present in names. Twenty subjects were given a stack of index cards with 20 names
on them and did what they thought was best to enter the names. Table 1 summarizes
the results. Except for entering an apostrophe (which subjects omitted), no single
method was preferred by more than half of the subjects. This makes selecting a
stereotype difficult. For q and z, the most commonly selected key was the asterisk,
selected by about 1/3 of the subjects.
1
ABC
DEF
1
2
3
GHI
JKL
MNO
4
5
6
PRS
TUV
WXY
7
8
9
*
OPER
0
#
Figure 1. Phone Keypad
Table 1. Choices of Keys to Use (in percent)
q and z
apostrophe
hyphen
alpha keys
25
other keys
40
15
35
omitted
5
80
35
mixed strategy
30
5
30
In related work, Detweiler (1990) examined alternative methods for entering text using
a phone keypad. Five methods were examined as described in Table 2 and Figure 2.
Table 2. Description of Methods Used by Detweiler (1990)
Method
Description (to enter K)
Repeat key press 5 twice, once to indicate which group of three letters, a second
time because K is the second of 3 letters (JKL)
Same-row press 5 twice, once to select the JKL key, a second time because 5 is
the second key on the same row (GHI/JKL/MNO)
Top-row
press 5 to select the JKL key, then 2 (on the top row) because K is the
second of 3 letters (JKL)
Modalpress "OPER" to select the second position (it is the second key in on the
position
bottom row), then 5 because K (JKL) is on that key. This method
resembles the same-row and top-row methods, except that it uses the
bottom row and the keys are reversed.
Modifiedpress 5 to select the JKL key, then * (the first special character) to select
modal
K; to select J, press only 5; to select L, press 5 to select the JKL key, then
# (the second special character) to select L
Note: The general approach is the first keystroke selects the key, subsequent
keystrokes indicate the specific character on the key.
2
Repeat-Key Method
JKL
JKL
5
5
WXY TUV TUV
8
9
8
TUV DEF
8
3
GHI
GHI
4
4
MNO MNO MNO
6
GHI
GHI
4
4
6
6
Same-Row Method
JKL
JKL
5
5
WXY PRS TUV WXY DEF
9
8
9
3
TUV
DEF
DEF
3
3
7
1
MNO MNO
6
6
Top-Row Method
JKL
5
ABC WXY
2
9
1
8
GHI
1
4
ABC MNO DEF
2
6
3
Modal-Position Method
OPER
0
JKL
5
*
WXY
#
9
TUV
8
*
DEF OPER GHI
3
0
#
4
MNO
6
Modfied Modal Method
JKL
5
*
WXY
9
#
TUV
8
DEF GHI
*
3
4
#
MNO
6
Figure 2. Key Sequences to Enter "KWV DHO" Using Various Methods.
Fifty adults were timed as they entered 24 six-letter strings. Table 3 shows the results.
There were no statistically significant differences in the entry times, though the error
differences were significant. In part, this was because the repeat key method
minimized finger movements and the probability of striking the wrong key.
Interestingly, GOMS model (Card, Moran, and Newell, 1983) predictions of entry times
(using the Slowman assumption) matched the actual times fairly well, except that the
rank orders of the Modified-Modal and Top-Row methods were reversed. This
provides an indication that GOMS models could be useful for keypad entry tasks.
Table 3. Entry Times and Errors for Various Methods
Method
Repeat key
Modified-modal
Top-row
Same-row
Modal-position
% Errors
6.7
17.1
8.0
10.5
13.0
Entry Time (s)
12.38
12.50
13.50
14.18
14.81
3
GOMS (s)
11.96
13.72
13.50
13.78
14.58
Several studies have reported times for destination entry and other tasks examined
during the development of interfaces for operational field tests. As part of the
ADVANCE project, Loring and Wiklund (1990a) describe and evaluate three
prototypes for keypads allowing destination and other data entry. There were 12
subjects ranging in age from 19 to 68 (mean=41). Figures 3, 4, and 5 show the
designs evaluated. Twelve subjects performed sample tasks using low fidelity
SuperCard prototypes in a laboratory. Table 4 shows the mean times to complete
tasks, though the units are not given in the report. The times are probably in minutes.
Get directions
Next
2nd
3rd...
Pause
1
2
Voice
Help
ABC
1
DEF
2
GHI
3
JKL
4
MNO
5
PQR
6
STU
7
VWX
8
YZ
9
Delete
0
Space
3
4
5
Select
Backup
Figure 3. Design A - Soft Keys and Dedicated Keys
(12 dedicated keys (including arrow cursor keys), 12-key alphanumeric pad,
5 soft keys, and a menu hierarchy with many layers)
4
Get directions
Next
2nd
3rd...
How to use
?
Voice
X
Where am I?
Detour Pause
Format
Figure 4. Design B - Touchscreen and Dedicated Keys
(8 dedicated keys, a touchscreen menu hierarchy with many layers,
and separate mini Qwerty keyboard)
5
Get directions
Next
2nd
Voice
3rd...
X
Format
List
Where am I?
How to use
More features
?
Atlas
Local
map
out-Zoom-in
Detour Pause
Backup
Select route
Select
Traffic
Figure 5. Design C - Dedicated Keys
(18 dedicated keys (including a cursor control knob), a menu hierarchy
with fewer layers, and separate mini Qwerty keyboard)
Table 4. Task Times form Loring and Wiklund (1990a)
Task
Determine present location on a
map
Get info on Symphony Hall from
list of public places
View traffic conditions near present
location
Plan a route to the Grand Hotel in
San Francisco
A: soft keys & B: touchscreen &
dedicated keys dedicated keys
0.911
2.924
C:
dedicated
keys
1.125
3.550
3.032
4.352
2.725
3.461
1.571
3.576
2.974
3.076
In structured interviews, subjects said that design B appeared easiest to use initially,
proved easiest to use after one week, and outranked the other two as the design they
preferred to have in their own cars. They said that design C was the most difficultappearing initially and the hardest to use during the experiment.
Loring and Wiklund (1990b) had 9 subjects (varying in experience but of unknown
age) perform a variety of tasks with prototype 2 of the ADVANCE interface (an
6
illustration of the interface did not appear in their report). Appendix A shows the
adjusted mean times from that baseline evaluation. The range of task times is quite
large, with one task taking over three minutes.
Coleman, Loring, and Wiklund (1991a,b) had 20 subjects enter alphabetic strings
(e.g., street names), numeric strings (e.g., long distance phone numbers), and
alphanumeric strings (street addresses) on 5-inch diagonal touchscreens. Keyboard
styles explored included Qwerty, Qwerty-matrix, and alphabetic. The two Qwerty
keyboards were faster (0.55 seconds per keystroke) than the alphabetic keyboard
(0.73 seconds per keystroke). Differences in errors were not statistically significant.
This suggests that where touchscreen resolution is available, keys should be in a
Qwerty format.
As part of the TravTek project, Dingus, Hulse, Krage, Szczublewski, and Berry (1991)
had subjects perform seven nondriving tasks with a navigation system interface.
Several of them involved entry or retrieval of destinations (select an unfamiliar
address—mean 130 seconds; select a stored destination—mean 50 seconds; store a
destination and route—mean 160 seconds; and use a yellow page feature for a
destination—mean 90 seconds). The error patterns were parallel to the task times.
Both sets of data were markedly affected by age (for example, the mean times for older
subjects were almost double that of younger subjects). Table 5 shows the full set of
times for the sake of completeness.
Table 5. Task Completion Times from
Dingus, Hulse, Krage, Szczublewski, and Berry (1991)
Task
Enter an unfamiliar destination
Retrieve stored destination
Determine areas where congestion is present
Add destination and route to list of those stored
Use yellow pages feature to select a business
Set voice messaging option
Summon emergency service
Time (s)
130
50
240
160
100
40
40
One of the constraints of designing navigation interfaces is the limited space available
on the instrument panel. To address the issue of input-device real-estate
requirements, Sears, Revis, Swatski, Crittenden and Shneiderman (1993) had 24
subjects type on a touchscreen Qwerty keyboard that registered input using a lift-off
strategy (and presented a tone). The four key sizes were 0.57, 0.76, 1.14, and 2.27
centimeters per side, associated with keyboards 6.8, 9.0, 13.2, and 24.6 centimeters
wide (from the Q to P keys). For each keyboard, data was collected for a novice phase
(one practice string and three test strings) and an experienced phase (after 30 minutes
of practice). Mean entry rates ranged from 1.29 to 0.61 characters/second for novices
(from smallest to largest keys) and 0.57 to 0.37 for experienced subjects. For both
groups of subjects, the relationship between entry time and key size was linear.
More to the point of this project, Paelke (1993) (see also Paelke and Green, 1993)
describes an experiment comparing four different interfaces for destination entry.
7
These interfaces were designed to capture the variety of entry themes present in
contemporary products. Sixteen drivers (8 young, 8 old) served as subjects.
Interfaces were presented on a touchscreen CRT, of which a 5-inch (12.7 centimeters)
diagonal section, the size of a typical navigation interface, was visible.
For the double-press method, a matrix of 10 touch areas appeared, with up to four
characters per area (EFGH in Figure 6). Touching one of the multicharacter buttons
caused touch areas to appear, one for each character. Touching the desired character
(E, F, G, or H) caused it to be selected. This design was similar to that used in the
TravTek interface, a field test conducted in Orlando, Florida. This design overcame
limitations of the resolution of the touch interface.
Enter first 4 letters of
STREET :
CRE
A B
C D
E F I J
G H K L
U V
WX
Y Z
E F
1 2
3 4
Done
M N Q R
O P S T
5 6
7 8
9 0
G H
Figure 6. "Double-press" interface design
In the Qwerty interface, the arrangement of touch areas resembled that of a typical
keyboard. While the arrangement was familiar to typists, the keys were smaller than is
typical for keyboards. The arrangement was used for the ADVANCE interface
examined in field trials in Chicago.
8
Enter address N U M B E R
1226
Del
Done
1 2 3 4 5 6 7 8 9 0
Q W E R T Y U I O P
A S D F G H J K L
Z X C V B N M
Figure 7. Qwerty-style keypad interface design
In the phone pad interface, subjects were shown numeric keys on which multiple
letters appeared. (See Figure 8.) So, for example, to enter "ELUM," subjects typed
3586. Because multiple text entries could match any string of digits (e.g., FLUN would
also match), a scrollable list of alternatives was then presented for final selection.
(See Figure 9.)
Enter address NUMBER
3586
DONE
Q Z ABC DEF
1
2
3
GH I JKL MNO
6
4
5
PRS TUV WXY
7
8
9
0
Figure 8. Phone-style keypad entry method
9
Select Street
DONE
COX
CRANBROOK
CREST
CRESTON
CRESTWOOD
CROWN
CULLOUGH
CULVER
CUMBERLAND
Go
Back
Figure 9. Selection screen for double-press and Qwerty name selection
The fourth interface style resembled that in the Zexel navigation system, currently
found in the Pathmaster sold by Rockwell (Figure 10). To move the scrolling list
forward or backward one character in the alphabet, the A and Z keys are pressed. To
move forward or backward one entry in the list, the up and down arrows are used.
Select C I T Y
A
DONE
Z
JASPER
KINGSLAND
KNIGHTSTOWN
LARGO
LAWRENCE
LEWISVILLE
LINDEN
Figure 10. Scrolling List Interface Design
Eight destinations were entered for each interface design while parked or while driving
a very simple simulator. Destination entry times were 43 seconds for the phonepad,
10
44 seconds for the Qwerty, 55 seconds for the scrolling list, and 76 seconds for the
double-press interface. The overall differences in entry methods were highly
significant. Older drivers' entry times were 21 percent longer than those of younger
drivers. Having people drive the simulator while entering destinations increased the
entry times by 28 percent over the baseline (parked) condition. The standard
deviation of lane position increased from 6 inches (baseline) to about 11 inches (dual
task). The order of the error data (from best to worst) was identical to that of the entry
times. Also identical was the order of the GOMS model predictions of performance.
Thus, this experiment demonstrated the utility of GOMS estimates for predicting driver
performance with realistic navigation interfaces.
Eby, Streff, Wallace, Kostyniuk, Hopp, and Underwood (1996) described a pilot test
concerning user perceptions and use of the Ali-Scout interface. A total of 62 drivers
had Ali-Scout units installed in their vehicles for two months. These were mostly
professionals at General Motors and Chrysler (almost 60 percent had a household
income of $100,000 or more). Of them, 45 completed the first survey (one week after
participation) and 36 completed the second (two months after participation). Drivers
also completed a daily log of their trips.
With regard to entering destinations, the following was learned. In terms of frequency
of use, the rank order of destination designation methods was map method (look up
the coordinates on a map), current location (indicate the current location is the
destination), points of interest (find the coordinates in a list of places), and address
range (find the coordinates in a list of street addresses). A more detailed description of
these four methods appears in the Test Plan section of this report. Subjects reported
that the current location and points of interest methods were easy to use and that the
address ranges and map methods were difficult to use. Both surveys indicated the
same results.
About 70 percent of the trips involved a destination already in memory. Table 6 lists
the frequencies. Subjects thought this feature was easy to use; about one-half
indicated that it was "very easy to use."
Table 6. Frequency of destinations Reported in Driver Logs.
Destination
Home
Work
Shopping
Frequency (%) Destination
41
Church, etc.
22
Medical
10
Entertainment
(e.g., movie)
School
7
Child car
Friend's/Relative's home
4
Motel/Hotel
Restaurant/Bar
2
Other
Recreation (e.g., golf course)
2
Frequency (%)
2
1
<1
<1
<1
7
Some 53 percent of the subjects indicated the keyboard was easy to learn, while 29
percent thought it was difficult to learn. The remaining 22 percent were undecided or
did not respond. In terms of ease of use, 49 percent felt it was easy to use, 38 percent
felt is was difficult, and 11 percent felt it was neither easy nor difficult. In terms of
11
reliability, 25 percent thought the keyboard did not function properly. Finally, with
regard to their overall impression, about 47 percent disliked the keyboard to some
degree. This is not a desirable outcome.
Several of the experiments described in this section used simulations of interfaces to
predict performance with real interfaces. To examine the validity of that approach,
Archer and Yuan (1995) presented four pairs of interfaces to 16 MBA students. The
interface examined various ways to enter text into a telephone system. Two interfaces
involved a 12 key phonepad supplemented with four additional keys (alphabet,
number, clear display, send message and clear). In the multipress implementation,
the character key is pressed to select that mode, then the key with the character on it is
pressed multiple times to select that character. (The 2/ABC key is pressed three times
to select C.) This is similar, but not identical to the repeat key method examined by
Detweiler (1990). In the character pick interface, pressing the alphabet key and then a
key, for example 2/ABC, cause the triple A, B, C to appear on a display. To select C,
the 3/DEF key is pressed because it is the third key. This is similar to the top-row
method examined by Detweiler (1990). Also examined were a Qwerty keyboard and a
touchscreen simulation of one. All simulations were implemented in Toolbook.
Three tasks were completed: (1) ordering tickets using a data base with menus, (2)
entering credit card information to pay for the tickets, and (3) entering an address to
which the tickets were to be sent. Subjects then rated the pair of interfaces they used
on 10 characteristics.
Table 7 shows the entry times and errors. The touchscreen simulation took 14 percent
longer and led to 50 percent more errors than the real interface. However, the actual
number of characters entered was only 3 percent greater. The time differences were
not statistically significant, leading the authors to claim that the use of simulations is an
appropriate substitute for real interfaces in usability tests.
Table 7. Entry Times and Errors Reported by Archer and Yuan
Interface
Corrected Task Time (s) Errors (%)
Multipress
487
21.3
Character pick
361
7.2
Touchscreen keyboard
220
9.3
Real keyboard
193
6.2
Not only are evaluations of real interfaces important, but so too are evaluations that
develop a basis for predicting user performance. As an example, Hoffman, Tsang, and
Mu (1995) described two experiments to predict movement times between keys as a
function of key size and spacing. In the first experiment, 10 young men served as
subjects. The square keys were 5, 10, and 15 millimeters on each side separated by
either 1, 5,10, 15, or 20 millimeter gaps. Reciprocal movements were between a
starting key and a second key 1 to 5 keys to the right. The performance measure was
the number of key taps in 10 seconds. The best fitting equation for movement time
(milliseconds), accounting for 95 percent of the variance, was:
12
MT = 187 + 6.68 (ID - 1.18)2 + 13.3(Nkey)
ID = Index of Difficulty = 2 * movement distance/target width
Nkey = number of keys to the second key
target width = key width + finger width, where interkey width > finger width
or
= 2 * (center to center distance) - key width - finger width
To examine the effect of marking the keys, the target key was indicated with a black
spot. An additional 10 young men served as subjects. Only combinations of 1, 3, or 5
keys were examined. Key sizes and spacings remained the same. For the full data
set, 95 percent of the variance in movement time was accounted for by the following
expression:
MT = 169 + 3.45(ID)2 + 10(Nkey)
In summary, the key studies (Paelke, Coleman, Detweiler, etc.) suggest the following.
1. If a touchscreen keyboard is to be used, it should follow a Qwerty format, though
the exact spacing (standard Qwerty, Qwerty matrix) does not matter.
2. For reduced resolution touchscreens, the rank order of interface designs (from best
to worst) is phonepad, Qwerty, scrolling list (Zexel), and double press (TravTek).
3. The rank order of actual keying times and GOMS-predicted keying times are the
same for four representative interfaces. However, prediction errors of actual
performance times can be considerable.
4. Except for omitting apostrophes, there are no majority stereotypes for how drivers
deal with unusual names (those with q, z, or hyphens in them) when using phone
keypads for entry.
5. Of the methods for using phone keypads for name entry, there is no single method
whose performance is clearly superior to others, though the repeat key method is
best.
6. In the Eby, Streff, Wallace, Kostyniuk, Hopp, and Underwood (1996) study of the
Ali-Scout interface, more subjects rated the interface as easy to use than difficult to
use, but the responses were not overwhelmingly positive. Almost half of the
subjects disliked the keyboard to some degree.
7. Touchscreen simulations of user interfaces may offer reasonable performance
predictions.
8. Movement times for alternative keyboard configurations can be predicted using
equations based on Fitts Law.
For other information on design guidance, see Green, Levison, Paelke, and Serafin
(1993).
13
Research issues explored
Thus, while the literature suggests that GOMS predictions may be useful in evaluating
the Ali-Scout keyboard and that the basic Qwerty configuration is preferable, the
usability of the keyboard cannot be determined from the literature. For this reason, an
experiment was conducted to determine if the interface was easy to use by drivers of
all ages for destination entry and retrieval, and to identify usability problems. This
experiment was carried out in parallel with the survey effort described in Eby, Streff,
Wallace, Kostyniuk, Hopp, and Underwood (1996). Specifically, the following
questions were addressed.
1. What are typical entry and retrieval times (and error rates) for destinations?
2. How does the Ali-Scout entry and retrieval times compare with those for other
systems described in the literature?
3. Does performance change with practice?
4. How does performance (time and errors) vary as a function of driver age and sex?
5. What subject factors other than age and sex influence performance in this
experiment?
6. How do time and errors vary as a function of ambient illumination?
7. Are the times and errors the same for real and simulated interfaces?
8. What kinds of problems do drivers of all ages encounter (and how can they be
corrected)?
9. How close are GOMS predictions of times to values from real and simulated
interfaces?
10. How accurate are subjects in looking up coordinates in the manual?
The rationale for these questions is shown in Table 8:
14
Table 8. Rationale for the Issues Examined
Issue
Typical times and errors
Comparison with other
systems
Effects of age, sex, and
other subject factors
Ambient illumination
Real vs. simulated
interfaces
Usability problems
GOMS predictions vs.
real and simulated
interfaces
Looking up coordinates
Rationale/Deeper Issue
To make comparisons (both with other systems and to
gauge improvements), baseline data are needed.
How should a navigation system be designed to be safe
and easy to use?
Will any group have particular problems? This influences
who should be subjects in future usability tests.
Are there lighting problems? Does lighting in tests matter?
Should multiple lighting conditions be examined in future
tests?
Can simulated prototypes, popular in preliminary tests,
predict real system usability? This could reduce the cost of
usability tests needed during development since only a
simulation is needed.
How can the Ali-Scout be improved?
Can predictions be substituted for usability tests where age
is an issue (not examined by Detweiler and touched upon
by Paelke)? This could reduce the number of costly
usability tests needed during development.
Ali-Scout is unique in that it uses longitude and latitude.
Does that create problems?
To speed dissemination of the results, findings concerning the GOMS predictions are
covered in a subsequent report (Manes, Green, and Hunter, 1996b).
15
16
TEST PLAN
Test participants
There were 36 subjects in the experiment: 12 young (18-30), 12 middle-aged (40-55),
12 older (over 65). The young and old groups represent the population extremes. The
middle group comprises the most likely buyers. Within each age group there was an
equal number of men and women. All subjects were licensed drivers (1,000 to 40,000
miles per year, mean of 13,000). The sample was well educated. All but three had at
least some college and 13 had at least one college degree. Vision ranged from 20/13
to 20/22 (corrected) in the young group, 20/13 to 20/40 in the middle aged group, and
20/15 to 20/40 in the older group. Only one subject had previous experience with a
navigation system, and 20 of the 36 had used a touchscreen. Computer use was
moderate on average (3.4 where 3=a few times a month, 4=a few times a week) and
subjects reported they were moderately comfortable typing (mean 3.9, 4=moderately
comfortable). Subjects were midway between very comfortable and moderately
comfortable in using maps.
The subjects included both those who have served in previous UMTRI studies (none of
which concerned destination entry) and new recruits. New recruits were obtained
through friends of the experimenters and other subjects.
Test materials and equipment
Ali-Scout interface
This experiment incorporated a real Siemens Ali-Scout Display Unit as well as a
simulated version. Figures 11 and 12 show frames grabbed from video recordings of
device use. Notice the similarity of the appearance of the two implementations. These
recordings were later used to identify subject actions and times (for the real unit only).
Figure 11. The Real Display Unit
Figure 12. The Simulated Display Unit
17
The Ali-Scout interface consists of four elements, an LCD guidance screen on the left
of the unit face, a text window for destination names, coordinates, entry information,
front panel selection keys, and a fold-out alphanumeric keypad. Figures 13 and 14,
actually taken from the simulation, show the Display Unit closed and open. These
figures are full size on an 8.5 inch x 11 inch page. (Both the real and simulated
Display Units were 7 1/4 inches x 2 1/4 inches (18.4 centimeters x 5.7 centimeters.)
The "found" button was not part of the device but was added to assist in timing use
performance. The button was fabricated out of wood and attached to the zero key of a
Kensington NoteBook KeyPad mounted just behind the Ali-Scout unit.
Figure 13. The Simulated Display Unit with the Door Up
18
Figure 14. The Simulated Display Unit with the Door Down
The simulated Display Unit was created in SuperCard 1.7.1. The program recorded
the times for button presses and, opening and closing the door. The simulated image
of a Display Unit was presented on a ELO Touch Systems Intellitouch monitor (model
E284A-1345) mounted on an Apple Macintosh model M1212 13-inch (33 centimeter)
CRT positioned in the center console of the dashboard. The frame of the display is
visible in Figure 15. The size and appearance of all elements of the simulated display
were identical to the real interface except that there was no tactile feedback when a
key was pressed, something that created major problems for subjects in pilot tests. As
a consequence, in the simulation a tone was presented each time a key was pressed.
This seems to have solved the problem.
The real Display Unit was mounted on a flexible stalk that was positioned by the
experimenter placing the display face 3-1/2 inches (8.9 centimeters) in front of the
touchscreen when in use. A holder for the address cards was mounted just below the
display. Dimensions for the location of both displays and the card holder appear in
Appendix B.
19
Figure 15. Location of Displays
The Ali-Scout unit can store up to 80 destinations. To retrieve a destination, subjects
could use one of three strategies: type in the name of the destination, which appeared
when the characters entered uniquely matched the beginning of that name ("Character
Search"); scroll through the list of names to the entry desired ("Scroll Search"); or type
the first character or two and then scroll the rest of the way ("Hybrid Method").
Table 9 shows the keystrokes necessary to obtain SEARS as a destination. Assuming
the subject had not memorized the data base (there were 21 locations in the main list),
the minimum character strokes required using either method would be 4. The first
down arrow is required to enter the scrolling function.
Table 9. Methods for Character Searching
Location List
AT THE START
...
SAKURA BANK
SEAFOOD BAY
SEARS
VANDENBURG SCH
...
Alphanumeric Method
Entered
Displayed
S
S......
E
SE.....
A
SEA....
R
SEARS
20
Hybrid Method
Entered
Displayed
S
S......
(down arrow) SAKURA BANK
(down arrow) SEAFOOD BAY
(down arrow) SEARS
On occasion, fewer keystrokes may be required by entering two characters prior to
scrolling. Also, if the subject has extensive knowledge of the list, he or she can enter a
character that will place them at the other end and scroll up (e.g., "T" and two up
arrows for SEARS).
To enter a destination, the subject entered in the name first (up to 14 characters
including spaces). Keying was somewhat confusing. Notice that many of the keys
have two characters on them. The right character was shown in white, the left in
yellow. To type the left character, the subject first pressed the yellow up-arrow key (the
lower left key on the keypad) and then the key of interest. So, to type a period, the
sequence would be "YellowUpArrow, " MPeriod." To get to the numeric field, they
pressed the diamond key. In the event that all 14 characters were used, the cursor
moved automatically. The next task was to key in the longitude and latitude of the
destination, either obtained from a map or from lists of street address ranges and
coordinates. Additional details of the entry process are provided later.
Calibration and other functions were also available, but they were not examined.
Figure 16 depicts the complete menu of user-accessible functions.
The location entry tasks used the "New Destination" branch of the menu (Figure 16)
and terminated at the "Input Coordinates" node. Since the experiment only used
portions of the Ali-Scout system, the "Actual Position" submethod was not allowed.
The equipment to determine current position was disconnected.
Also, subjects were not asked to do any of the "Special Features" tasks. However,
they were not prevented from entering this part of the menu.
21
Figure 16. Ali-Scout Menu Structure
The original project plan called for evaluating both real and simulated Display Units
under simulated dusk and night conditions. However, pilot tests showed no
differences due to illumination for the simulated unit, so only the simulated dusk
condition was explored in the main experiment. (Varying light levels were explored for
the real display.) In the simulation, all items to be read (LCD text and key labels) were
highly legible and, because they were generated by a CRT, were back illuminated and
did not require ambient illumination. The worst case was an alphabetic character (J)
on the door (contrast ratio 2.9:1). There were numerous situations in which contrast
ratios of 10:1 were achieved. Appendix C contains the illuminance and luminance
values for the various experimental conditions.
Driving simulator
Interaction with the subjects occurred at two locations in UMTRI. Training and the
collection of subject information was conducted in an office. The data collection
portion of the experiment was conducted in the Driver Interface Research Simulator.
22
The automobile simulator consisted of an automobile cab, a retroreflective wall, and a
variety of computer and video components. Figure 17 is a simplified drawing of the
equipment used in this particular study. It is important to note that subjects never
drove the simulator. It simply provided context. During experimental trials a road
scene was presented simulating sitting on the right shoulder of a two-lane road.
2
12'
1
2
20'
3
5
4
5
6
1
7
6
7
3
8
10
4
14
9
10
11
12
9
8
13
11
12
13
14
1985 Chrysler Laser
mockup with simulated
hood
8'X10' projection screen
with 3M hi-white
encapsulated reflective
sheeting
Ali-Scout Display Unit on a
flexible stalk with a custom
external power supply
3-spoke steering wheel
Sharp color LCD projection
system (model XG-E850U)
4"X13" plexiglas screen
ELO Touch Systems
Intellitouch monitor (model
E284A-1345)
Sharp computer projection
panel (model QA-1650)
3M overhead projector
(model 9550)
Panasonic model GPKS152 lipstick camera with
a 7.5mm lens
Power Macintosh9500/120
Power Macintosh
7100/80AV
JVC KM-1200 Color
Special Effects Generator
with a Panasonic AG-6200
Video Cassette Recorder
Lamp for dusk blocks
Figure 17. Simulator Layout
23
Miscellaneous equipment
In addition to the aforementioned equipment, an Ikegami ITC-47 video camera, a
tripod, and a Panasonic AG-1970 video cassette recorder were used to videotape the
subjects from over their shoulders in the office during the practice and coordinate
identification tasks.
Illuminance was measured with a Minolta T-1 Illumination Meter. The illuminance was
measured at the location of the Display Unit. Luminance was measured with a
Spectra Pritchard Photometer models 1980A-CD and OP. The photometer was
mounted on boxes (and stabilized by ropes from above) so that it was in the same
position as the driver's eyes (off to the side). Some error may have been introduced
because of the awkward posture required by the experimenter to aim and focus the
photometer (lean in through the driver’s window and look through the viewfinder with
the back of his head pressed against the B pillar of the car).
Test activities and their sequence
After the initial greeting, the subject received a general overview of the purpose of the
study, completed biographical and consent forms (contained in the Appendix D and
E), and completed a visual acuity test. Following was a fixed set of activities: learning
how to use the device (and practice with it), the coordinate search tasks (looking up
addresses in books), and the experimental destination retrieval and entry tasks. The
experiment ended with miscellaneous tasks to determine subjects' impressions of the
device. See Table 10 for additional information. See Appendix F for the complete
instructions.
Table 10. Experiment Summary
Activity Name
#
1
Introduction
2
Videotape
3
Practice
Test-use of
manual
Simulator
introduction
Test-keypad
use
4
5
6
Post-test
Description
subject is told purpose of experiment, subject completes
biographical and consent forms
subject watches instructional video on entering and retrieving
destinations
subject retrieves 5 locations, then enters 5 locations
subject looks up 3 destinations in manual (point of interest
name, intersection of 2 roads, street address)
subject is introduced to the touchscreen (practice)
subject completes 5 entry then 5 retrieval tasks (3 times: real
interface at dusk, real at night, simulated at dusk), order was
counterbalanced.
subject's eyesight checked, subject completes questionnaire,
subject is paid, subject's finger anthropometry is recorded
The learning and practice activities began with a five-minute video tape on the
Ali-Scout system (Wallace, Eby, and Gardner, 1995). This tape included instruction on
searching for coordinates and entering destinations. Subsequently, the subject was
24
provided with a reduced version of the manual, a sheet with the command menu
structure (as previously shown), and a practice sheet of instructions. (See
Appendix F.) Subjects used a Display Unit to find a list of locations in a database that
included five dummy and five real locations (the Unused and Retrieved columns of
Table 11), one at a time. When all of the locations had been found, the subjects were
instructed to insert a list of five locations and their coordinates (the Entered columns of
Table 11), one at a time.
Table 11. Practice Databases
Unused List
(dummy)
AMOCO
BECKYS CAFE
ECHO PARK SCH
SIEMENS
STAR DELI
Retrieved List
(real)
BP SERVICE
FIRESTONE
MAYAS DELI
PLUS-BANK 24
SUBWAY
Entered List
Location
Coordinates
CADE GALLERY
0830845W
422908N
HUNAN PALACE
0832531W
422805N
MAIN THEATER
0830840W
422926N
SHELL
0830532W
423534N
VILLAGE MARKET 0830901W
423715N
As can be seen from the listing of coordinates, the length and content of all used
coordinates are comparable across locations. Therefore, most discussion of entered
locations will only focus on the names assigned to the locations.
The last portion of the activities conducted in the office was a coordinate search task
(for which name lengths were not comparable). This required subjects to look up
coordinates in the Ali-Scout manual. Location identifiers were listed on 3 x 5 inch (7.6
x 12.7 centimeter) cards. The experimenter handed the cards one at a time to the
subject to maintain a counterbalanced order. Information requested included Points of
Interest (given the name, find the coordinates in a list), Address Ranges (given an
address, find the coordinates in a list), and Ali-Scout Maps (given two intersecting
roads, find the coordinates on a map). Three different locations were examined for
each information request. The order of formats was counterbalanced across age
groups. (See Appendix G.)
After the practice and coordinate search tasks, the subject was escorted to the driving
simulator. The road scene showed that the subject's car was parked on the side of the
road. After the driver adjusted the seat, the experimenter verified that the subject could
comfortably reach the touchscreen. The interior lighting was adjusted for the test
condition. (In the simulated dusk condition, a small shielded light just above the center
console and a second light in the passenger area were turned on.)
The first block of trials consisted of five retrieval tasks followed by five entry tasks.
(Appendix H lists the database used for retrieval tasks.) For each location in the
database, the minimum number of keystrokes needed to find the location was
determined. The only methods considered for this computation were pure scrolling,
alphanumeric, and a simple version of the hybrid method (the first letter followed by
down arrows).
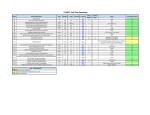
The 20 locations were split into 4 groups of 5 locations, with the minimum number of
keystrokes being equalized among groups. (See Table 12.) Locations were ordered
25
so that the minimum number of keystrokes (averaged across groups by trial) was just
over three. Balancing in this manner facilitates looking at practice effects across
subjects. The minimum number of keystrokes for each location and the locations
chosen are shown in Tables 12 and 13. Note that the sets are slightly unbalanced
(averages shown at the bottom of the table). After the experiment was run, an error
was discovered in computing the minimum number of keypresses to reach the first four
locations. A down or up arrow must be pressed to enter the scroll mode. The
locations that were most readily found through the scroll mode were affected by this
discovery. In addition, the location of VANDENBURG SCH was erroneously believed to
require only one keystroke to reach. A shift activation was mistakenly ignored. The
locations in Table 12 that are shown in bold were originally believed to require one
less keystroke.
Table 12. Minimum Number of Keystrokes for Retrieval
A
2
5
5
3
2
3.4
Stimulus Set
B
C
3
3
4
3
2
1
2
5
5
4
3.2
3.2
Dummy
5
1
4
4
2
3.2
Table 13. Retrieval Lists for Each Stimulus Set
A
SAKURA BANK
BIR ICE ARENA
MONTERREY REST
MOBIL
BIG BOY
B
SEAFOOD BAY
PRINT GALLERY
MAJESTIC CAFE
VANDENBURG SCH
BIR LIBRARY
C
BILL KNAPPS
PRIMOS PIZZA
WOODSIDE HOSP
BIR THEATER
MONGOLIAN BBQ
Dummy
MONTGMRY WARD
ROYAL OAK DELI
SEARS
BIR ART GALLRY
PALACE OF AH
In a manner similar to the retrieval tasks, an effort was made to equalize the total
number of keystrokes and shifts across orders and across entry trials to facilitate
looking at differences due to those factors. (See Appendix I.) There were differences
for the individual entry tasks. (See Table 14.)
26
Table 14. Entry Lists for Each Stimulus Set
Stimulus Set
A
B
C
Dummy
Name
NICKS PLACE
Q GAS
HELENS KITCHEN
YAW GALLERY
GOODYEAR
FARMER JACK
TACO LOCO
FIRST OF AM
JACOBSONS
CHEVRON
LARK REST
UNICORN GRILL
KROGERS
QWIK STOP
TUFFY AUTO
LICHT PARK
NORDSTROM
DISCAFE
OAKLAND MALL
OLIVE GARDEN
# Keystrokes # Shifts
12
1
7
2
15
1
12
1
8
0
12
1
10
1
13
2
9
0
8
1
10
1
14
1
7
0
11
2
11
1
11
1
9
0
7
0
13
1
14
2
The order of presentation of the three conditions—simulated, real display at dusk, and
real display at night, was counterbalanced. (See Appendix G.)
The subject's visual acuity was tested after the experimental blocks had been
completed. Then questions were asked regarding key size, key spacing, display size,
display contrast, and whether the system was logical. (See Appendix J.)
Subsequently, subjects pressed their finger against a transparency on the face of a
copier as if they were pressing a key. A scale on the transparency aided in measuring
the finger contact patch.
After completing the experiment, subjects were thanked and paid $40.
27
28
RESULTS
Data reduction method
An important contribution of this project was the development of software to obtain time
and accuracy data from the videotapes of the trials for the real interface. Specifically,
this software was designed to help obtain the trial time, time between keypresses, and
correctness of each destination designation. This tool was developed because the
Ali-Scout interface is a closed product and connecting recording sensors to the
Display Unit would have destroyed it. For the simulation, however, keypress times and
keys pressed were automatically recorded by the simulation software, thus the datareduction software was required only for trials with the real Ali-Scout unit.
The data-reduction software developed, VCRTimeIt 1.0, controls a Panasonic
AG-DS550 video cassette recorder with single-frame accuracy. The interface (see
Figure 18 on the following page) was written using SuperCard 2.5 for the Macintosh.
With VCRTimeIt, each time the user presses a key on the keyboard, the character for
that key along with the current VCR counter reading (the time) is added to a list field.
The user is free to play the tape at any speed and can choose any key to represent an
event.
Normally, the tape was played back at half speed, with the analyst pressing an
associated key at approximately the same time as a character appeared (or the cursor
moved) on the Ali-Scout display. When subjects pressed buttons that produced no
visual change to the display (such as the shift key), the analyst pressed the associated
key close to the moment the subject released the button. When the keypresses
became frequent (such as when the subject repeatedly pressed the same key)
playback was reduced to one-quarter speed. For alphanumeric entries, the
associated key was the equivalent lower-case character. For special functions, upper
case characters were entered (such as “D” for diamond, “C” for cancel, and "Y" for
shift). Errors introduced from analysts keypresses (to obtain times) were extremely
small. (See Manes, Green, and Hunter, 1996b.)
VCRTimeIt was developed, instead of using existing time study programs, such as
Activity Catalog Tool (A.C.T.) (Segal and Andre, 1993) and EventRecorder (Berger,
Walton, and Wurman, 1993), for four reasons. First, because VCRTimeIt is directly
linked to the VCR, the user can vary the speed and even reverse the direction of the
tape at any point during the analysis, maximizing the speed of the analysis and
allowing for easy error correction. A.C.T. and EventRecorder both require a constant
playback speed throughout the analysis. For both A.C.T. and EventRecorder, pausing
the tape during the analysis is difficult because the user must press a key on the
keyboard and a button on the VCR at the same time. Pausing tends to occur when the
analyst is interrupted or needs a break.
29
Figure 18. VCRTimeIt 1.0 User Interface
Second, VCRTimeIt can automatically cue the tape to any event that has already been
marked, thus allowing the user to easily find and check events of interest, a feature
neither A.C.T. nor EventRecorder support. Third, data collected with VCRTimeIt can be
edited at any time. With A.C.T., the analyst cannot even see the output file until the
analysis is complete. Finally, VCRTimeIt records time data to the nearest 1/30th of a
second, while EventRecorder only does so to the nearest second.
After the initial pass at the data, two blocks of trials (325 total keypresses) for one
subject were reanalyzed to verify that the data-reduction procedure was repeatable.
There were only two discrepancies in the number of keypresses between the original
and repeated analysis, and the time difference between the corresponding keypresses
never exceeded 0.3 seconds, except for a single keypress where the difference was
0.5 seconds. The vast majority of times were either equal or different by 0.1 seconds.
30
Analyst delays were not perceptible since the analyst could predict when events would
occur.
In spite of these checks, there is a possibility that some systematic errors could have
occurred, although these are unlikely to have affected the total destination and
retrieval times (the basis for the data analysis). Perhaps the most probable type of
error would be the analyst missing errant keypresses which had no effect on the
functioning of the Ali-Scout. For example, it would be difficult to tell if a subject
accidentally pushed K instead of the zero button (two adjacent buttons) during
coordinate entry because the system provides no feedback if a letter is pushed when
only a number is allowed. A second type of error would result from the analyst being
unable to distinguish whether the shift key was pushed twice in a row or not at all. This
would be an issue for some subjects who occasionally did not push the buttons hard
enough for them to register.
Because the method for obtaining the entry and retrieval times consisted only of
measuring the time from the first to last keypress, neither the subject’s thinking time
(the time between receiving the card and the first keypress) nor confirmation time (the
time following the final keypress) were captured. This method was used because the
exact time a card was handed to each subject could not be established, and the exact
time the subject finished could not be determined (because the subjects were
inconsistent in their use of the "found" key). An unfortunate side effect of this method is
that zero times were sometimes obtained for one of the destination retrievals
(WOODSIDE HOSP) because only a single keypress was necessary if the character
search method was used.
Overview of the entry and retrieval data
To recap, of the 30 name cards shown to each of the 36 subjects, 15 were destinations
to be entered into the Ali-Scout, and the remaining 15 were to be retrieved from it. The
cards were divided into three sets, referred to in this report as A, B, and C. The cards
in each set were always shown in the same order: The five retrieval cards were shown
first, followed by the five entry cards. Each set was presented under a different
experimental condition (real device with dusk lighting, real device with night lighting,
or the simulated device at dusk), but the card set-condition pairings were rotated so
that each set was seen in each condition exactly one third of the time.
Times were recorded from the first keypress to the keypress completing the entry. This
does not include use of the "found" key since it was used irregularly, nor the 1 to 2
seconds subjects were observed to spend planning their response. There are no
times missing from the data set, so there are 540 (=36 x 15) times for destination entry
and 540 times for destination retrieval. The histograms of these times (Figure 19)
reveal a skew to the right—the extreme outliers are all very long, rather than very short,
times. It is for this reason that median, rather than mean, times give a more accurate
sense of "typical" times, since the median is not influenced by extreme values. The
two panels in Figure 19 have different time scales, selected so all data points could be
displayed. The interquartile range (IQR) is the gap between the 25th and 75th
percentiles (the first and third quartiles) and is a measure of dispersion which is far
less sensitive to outliers than the standard deviation. However, even though medians
31
and IQR are more sensible choices than the traditional mean and standard deviation
for giving an overall sense of subject behavior, ANOVA makes implicit use of means.
Departures from normality were not sufficient to rule out the use of ANOVA. Thus,
means will appear throughout this report wherever comparisons must be made among
groups of times.
120
DESTINATION RETRIEVAL
Count (n=540)
100
(inset: detail of
first 40 seconds)
80
60
median=6.23 s
mean=10.48
40
0
10 20 30 40
inter-quartile range=9.05
20
0
0
20
40
60
60
80
Retrieval Times (s)
100
120
140
DESTINATION ENTRY
50
Count (n=540)
40
30
median=51.48 s
20
mean=64.68
inter-quartile range=39.21
10
0
0
50
100
150
200
250
Entry Times (s)
300
350
400
450
Figure 19. Histograms of retrieval and entry times.
Subjects made many more uncorrected errors, on average, on the entry task than on
the retrieval task. Of the 540 trials, there were only 8 uncorrected errors for retrieval (a
rate of 1.5 percent) but 54 errors for entry (10.0 percent). An uncorrected error is an
instance in which the subject continued with the experiment (believing that the
information on the card had been correctly retrieved or entered) when in fact the
32
destination had not been correctly retrieved or entered. Thus, an error was counted
only if the end result was incorrect, not if the subject typed incorrect keys and then
corrected them while completing the task. More will be said about errors in the next
section.
What were typical entry and retrieval times (and error rates) for
destinations?
Table 15 summarizes the median, maximum, and (for the sake of completeness) mean
for each of the cards, and Figure 20 gives a graphical depiction of the median and
mean values for each destination to give a sense of their variability.
Table 15. Median, Maximum, and Mean times for each of the 30 cards.
Retrieval Times (s)
Place Name
Median Maximum
SAKURA BANK
3.47
101.88
BIR ICE ARENA
12.00 121.75
MONTERREY REST
9.58
120.58
MOBIL
3.98
55.40
BIG BOY
4.57
51.83
SEAFOOD BAY
8.27
94.90
PRINT GALLERY
6.82
16.05
MAJESTIC CAFE
2.37
21.30
VANDENBURG SCH
3.56
52.97
BIR LIBRARY
9.97
58.13
BILL KNAPPS
4.79
62.60
PRIMOS PIZZA
6.15
57.63
WOODSIDE HOSP
0.38
19.35
BIR THEATER
9.83
30.77
MONGOLIAN BBQ
7.27
39.77
Overall
6.23
121.75
Entry Times
Place Name
Median
NICKS PLACE
60.16
Q GAS
47.67
HELENS KITCHEN 5 5 . 2 5
YAW GALLERY
54.19
GOODYEAR
39.45
FARMER JACK
67.55
TACO LOCO
52.50
FIRST OF AM
54.98
JACOBSONS
48.28
CHEVRON
44.00
LARK REST
61.74
UNICORN GRILL
55.59
KROGERS
43.96
QWIK STOP
54.43
TUFFY AUTO
45.67
Overall
51.48
Mean
8.80
19.00
16.34
8.68
7.47
17.10
7.52
3.73
9.68
14.05
8.70
10.93
1.83
12.70
10.69
10.48
(s)
Maximum
209.95
275.88
203.22
252.55
135.73
351.30
151.70
159.20
185.70
100.63
243.73
238.53
101.52
436.45
131.72
436.45
Note: Retrieval always begins with the place name "AT THE START" (the first
alphabetic entry) shown.
33
Mean
77.00
69.55
72.85
67.82
51.05
84.31
57.98
64.55
60.30
46.96
72.03
74.17
47.28
73.18
51.12
64.68
20
18
16
14
12
10
8
6
4
2
0
90
85
80
75
70
65
60
55
50
45
40
35
Overall
Mean
Overall
Median
Medians
Means
Overall
Mean
Overall
Median
Medians
Destination Retrieval (n=15)
Means
Destination Entry (n=15)
Figure 20. Distribution of entry and retrieval of the means
and medians times across locations (in seconds).
Table 15 shows that a median time for the retrieval task from first keypress to final
keypress was a bit more than 6 seconds, yet the maximum time exceeded two
minutes. Similarly, the median entry time is around 51.5 seconds but could be as long
as seven minutes. The times given above for entry are probably closer to reality than
those for retrieval, for a couple reasons. First, because retrieval times are shorter, the
lengths of time spent before the first keypress and after the last (which are missing
from the times recorded in Table 20) are a greater proportion of total retrieval time than
of total entry time. Second, retrieval times—particularly if the subject scrolls through
the whole list to find the desired location—are dependent on the number and
sequence of destinations stored in the memory of the Ali-Scout, whereas entry times
are not.
Table 16 gives the total number of errors for each destination for the 36 subjects. (To
determine error rates, divide the number of errors by 36.) Because entry involves
typing data into the Ali-Scout and retrieval only involves finding data that are already
there, entry errors were much more common than retrieval errors. As noted earlier,
these errors are only of the type that were never corrected by the subjects; Table 21
does not, for example, include information on missed keypresses that were
immediately corrected.
34
Table 16. Numbers of errors for both the retrieval and entry cards.
Retrieval Task Errors
Place Name
Errors
SAKURA BANK
0
BIR ICE ARENA
1
MONTERREY REST
1
MOBIL
0
BIG BOY
0
SEAFOOD BAY
0
PRINT GALLERY
0
MAJESTIC CAFE
0
VANDENBURG SCH
1
BIR LIBRARY
5
BILL KNAPPS
0
PRIMOS PIZZA
0
WOODSIDE HOSP
0
BIR THEATER
0
MONGOLIAN BBQ
0
Overall Rate
1.5%
Entry Task Errors
Place Name
Errors
NICKS PLACE
6
Q GAS
4
HELENS KITCHEN
6
YAW GALLERY
4
GOODYEAR
2
FARMER JACK
2
TACO LOCO
1
FIRST OF AM
4
JACOBSONS
4
CHEVRON
6
LARK REST
0
UNICORN GRILL
5
KROGERS
2
QWIK STOP
6
TUFFY AUTO
2
Overall Rate
10.0%
Although the errors in the retrieval task were too rare to be of any use in analysis, the
specific types of errors committed deserve explanation. The high number of errors in
retrieving BIR LIBRARY was due to four subjects who scrolled until they reached BIR
ART GALLERY and then stopped. The error in BIR ICE ARENA was due to the subject
pressing the right arrow key when a space was appropriate. This sent the Ali-Scout
into entry mode, an action that can only be reversed by pressing cancel and starting
over. The remaining three errors were due to spelling mistakes: BIR LIBRARY was
typed as BUR LIBRARY; MONTERREY REST as MONTERRY REST; and VANDENBURG SCH
as UANDENBERG SCH. This last error, which was due to typing U instead of shift-U,
tended to be difficult for subjects to catch because U and V are difficult to distinguish
on the Ali-Scout’s display.
Did performance change with practice?
To examine learning, entry and retrieval will be treated separately here (as they will be
throughout the analysis). Each subject saw 15 of each type of card, and the question
of interest is whether, on average, subjects did better on the later cards than the earlier
ones. However, the trials, numbered 1 to 15, should not be considered as separate
levels of a single factor in ANOVA since the cards were always ordered the same way
in each group of 5. For example, the "SAKURA BANK" card could only appear on the
first, sixth, or eleventh trial, so even an existing practice effect might not be evident if
the intervening trials consisted of much harder or much easier cards. Thus, the mean
times for each block of 5 trials will be considered: trials 1 to 5, 6 to 10, and 11 to 15.
This gives 3 levels instead of 15, and the cards in each of the 3 levels are exactly the
same, so the effect observed is independent of differences in reaction times for
individual cards.
35
16
RETRIEVAL
15
(not significant)
14
13
12
11
10
9
8 p = 0.062
7
Block 1
Block 2
Block 3
Mean Entry Time (s)
Mean Retrieval Time (s)
Figure 21 shows the three-level block factor described above. Based on an ANOVA
model with one main effect, there was a significant learning effect for the destination
entry task (p<0.0001), but not for the destination retrieval task (p=0.062). Specifically,
for entry, block 2 and block 3 both have significantly shorter entry times than block 1,
but blocks 2 and 3 are not significantly different from each other.
90
ENTRY
85
(significant)
80
75
70
65
60
55 p < 0.0001
50
Block 1
Block 2
Block 3
Figure 21. Effect of practice (block number) on task time.
The error bars are 95 percent confidence limits.
These results suggest that the subjects received enough practice on the retrieval task
prior to the first block, since no significant improvement occurred after that point.
Exploring the block effect a bit further, the age-block interaction is significant
(p=0.0012), and the effect plot in Figure 22 shows that it is the middle-aged and older
subjects for whom the first block was significantly slower than the other two. Young
subjects did not experience such a significant drop in times. Thus, a bit more practice
on the entry task than occurred in this experiment was needed, particularly for the
benefit of the middle-aged and older subjects.
Mean Entry Time (s)
140
ENTRY
120
100
Block 1
Block 2
Block 3
80
60
40
20
Young
Middle
Age
Older
Figure 22. Interaction between age and block number.
The error bars represent 95 percent confidence intervals.
36
The general pattern of errors was similar to the time data, decreasing slightly with
practice, though the effect was not statistically significant. (See Figure 23.) As
mentioned above, a similar analysis for the retrieval task would reveal nothing
because of the small number of errors.
5-card total errors
1.2
ENTRY
1.0
0.8
0.6
0.4
0.2
0.0
-0.2
p=0.47
1
2
3
Block
Figure 23. Total number of errors for the destination entry task as a function of practice
(block number). The error bars represent 95 percent confidence intervals.
How did performance (time and errors) vary as a function of driver age
and sex?
For destination entry, there were enough mistakes overall to allow analysis. The other
available measures of performance, completion time for every entry or retrieval task,
are the primary performance measures used in the analysis. Figure 24 below shows
the individual mean times for both destination entry and destination retrieval. Each
age-sex category (e.g., older females) contains six subjects. Even though medians
give more representative "typical" times, means are plotted in Figure 24 because the
ANOVA tests seen later are based on means. Notice the considerable amount of
scatter in the middle-aged men and the older subjects in general.
37
30
RETRIEVAL
Females
Males
120
25
100
20
15
10
5
0
ENTRY
140
Mean Entry Time (s)
Mean Retrieval Time (s)
35
F M
Young
F M
Middle
80
60
40
20
F M
Older
F M
Young
F M
Middle
F M
Older
Figure 24. Mean times by age and sex.
ANOVA models of destination entry and retrieval times included sex, age, sex by age
interactions, and the effect of subject nested within sex and age. For retrieval time, the
effects of sex (p=0.0055), age (p=0.0001), sex*age (p=0.0388), and subject
(p=0.0001) were all statistically significant. For entry time, sex (p=0.0001), age
(p=0.0001), and subject (p=0.0001) were all significant. ANOVA tables for these
analyses appear in Appendix K.
20
18
16
14
12
10
8
6
4
RETRIEVAL
(interaction significant)
100
Mean Entry Time (s)
Mean Retrieval Time (s)
Figure 25 shows the interaction plots for age and sex. Post-hoc tests reveal that every
age category is significantly different from every other, for each task. Therefore, it is
possible to generalize that women responded more quickly than men and that times
increase with age.
Young
Middle
Age
90
80
70
60
50
40
30
Older
ENTRY
(interaction not significant)
Male
Female
Young
Middle
Age
Older
Figure 25. Age-sex interaction plots for destination retrieval and destination entry.
38
Tables 17 and 18 give median and mean values for each age group and each gender
group. To summarize, median entry times for older subjects were double those of
younger subjects, with middle-aged subjects midway between them for both entry and
retrieval tasks. Men typically took 10 to 20 percent longer than women.
Table 17. Median and mean times for each age group.
Destination Retrieval (s)
Age Group Median Ratio to Mean
Young
Young
4.27
1.00
5.71
Middle-aged
7.27
1.70
9.58
Older
8.59
2.01
16.15
Destination Entry (s)
Age Group Median Ratio to
Young
Young
37.75
1.00
Middle-aged 52.31
1.39
Older
75.52
2.00
Mean
41.41
61.01
91.61
Table 18. Median and mean times for men and women.
Destination Retrieval (s)
Gender
Median Ratio to Mean
Female
Female
5.85
1.00
8.94
Male
6.39
1.09
12.02
Destination Entry (s)
Gender
Median Ratio to Mean
Female
Female
47.68
1.00
58.95
Male
55.57
1.17
70.40
Figure 26 shows the interaction between age and sex in determining the number of
errors made on all fifteen entry cards. An ANOVA with number of mistakes as the
dependent variable concludes that the age effect is significant (p<0.0001), but the sex
effect (p=0.28) and the age-sex interaction (p=0.79) are not. As the figure suggests, a
post hoc test confirms that the older subjects made significantly more errors than either
the young or the middle-aged subjects, but there was no difference between the latter
two groups. The number of errors for the retrieval task is too small to analyze.
Entry Mistakes (out of 15)
3.5
ENTRY
3
2.5
Women
Men
2
1.5
1
.5
0
Young
Middle
Age
Older
Figure 26. Destination entry errors per subject by age and sex.
39
What subject factors other than age and sex influenced performance in
this experiment?
Of the biographical questions (comfort with maps, prior use of a touchscreen,
frequency of computer usage, typing proficiency), only computer usage was
significantly related to performance in this experiment. As a reminder, usage was
measured using a 5-point scale: 1—never; 2—less than once a month; 3—a few times
a month; 4—a few times a week; and 5—every day. The mean response was 3.4, so
the subjects were partitioned into a "below average" (responding 1, 2 or 3) and an
"above average" (4 or 5) group. The two-level factor thus created has a very strong
effect on times (p-values were smaller than 0.0001 in a one-way ANOVA). The means
for the two levels of this computer usage factor are given in Table 19. The interaction
with the age group factor, seen in Figure 27, is very revealing even though it is
significant only in the case of destination entry. Note that the young below-average
group only contained one subject and the older above-average group only contained
two.
Table 19. Median and mean times for above-average
and below-average computer usage.
Computer
Number of
Usage
Subjects
Below average
15
Above average
21
Retrieval (s)
Median Ratio Mean
9.80
1.91 15.56
5.13
-6.85
20
16
12
8
4
0
120
110
100
90
80
70
60
50
40
30
20
Mean
87.77
48.18
ENTRY
(interaction significant)
Mean Entry Time (sec)
Mean Retrieval Time (sec)
RETRIEVAL
(interaction not significant)
Computer Usage
Below Avg
Above Avg
Entry (s)
Median
Ratio
76.63
1.73
44.27
--
Young
Middle
Age
Older
Young
Middle
Age
Figure 27. Interaction between age and computer experience.
The error bars represent 95 percent confidence intervals.
40
Older
In an ANOVA of the number of errors committed in the destination entry task (main
effects of computer usage and age), there were no significant differences due to
computer usage (F(1,32)=0.245, p=0.6243). However, the effect of age was significant
(F(2,32)=7.594, p=0.002), consistent with results examining subject differences
described earlier. Without the age effect in the model, the computer usage effect is
barely significant (p=0.047), mostly because the usage effect is confounded with the
age effect.
How did time and errors vary as a function of ambient illumination?
Because the simulated interface (shown on a CRT) was self-illuminated and legibility
depended little on ambient illumination, the simulated interface was not considered in
the examination of the effects of ambient illumination. Thus, this section compares
only the dusk and night conditions for the real Ali-Scout interface.
For destination retrieval, the mean times were 8.89 seconds for the night condition and
7.77 seconds for the dusk condition. This difference is not significant (p=0.2657) nor is
the interaction of lighting with age (p=0.8863) or sex (p=0.7814) significant. These
results are revealed by the ANOVA summary in Appendix K. For tables of the median
values, see Table 20 in the next section.
However, for destination entry, the same ANOVA model reveals a significant difference
between dusk and night (p=0.0001) as well as a significant interaction between the
lighting effect and the age effect (p=0.0001). (See Appendix K.)
The interaction plot in Figure 28 reveals that the observed significant difference
between the night and dusk conditions for the real interface (night mean=65.7 sec;
dusk mean=54.0 sec) is mostly attributable to the older subjects. In the night condition,
many of the older and some of the middle-aged subjects were unable to see the top
row of the keypad because it is unlit. This forced them to count over to the key they
were looking for, starting with the first or last key in the row. When attempting to enter
a zero, subjects were especially likely, instead, to attempt to enter the letter O (since
that is the only round symbol they could see) or a K (which was the last key of the top
row).
41
Mean Entry Time (s)
120
110
100
90
80
70
60
50
40
30
20
ENTRY
Night
Dusk
Young
Middle
Age
Older
Figure 28. The significant illumination-age interaction for destination entry.
Error bars represent 95 percent confidence intervals.
As stated earlier, there were not enough errors committed during the retrieval task to
analyze dusk-night differences.
Analysis of the errors for the entry task does not reveal any significant difference
between the dusk and night conditions. Each subject saw five cards in the dusk
condition and five in the light condition. This means that there were 180 cards seen in
each condition. There were 14 total errors made in the night condition and 12 made in
the dusk condition (averages per subject of 0.389 and 0.333, respectively). This is not
a significant difference, according to one-way ANOVA (p=0.74). Furthermore, there is
no significant interaction between the lighting condition and either age or sex as far as
the number of errors committed is concerned.
Were the times and errors the same for real and simulated interfaces?
The analysis in this section is very similar to that of the previous section. Whereas the
previous section considered only the dusk lighting and night lighting conditions for the
real Ali-Scout and disregarded the simulated data, this section will consider all three
levels of this condition factor, with the primary emphasis on comparing the simulated
level with the other two levels.
Appendix K shows the same two models for the dusk-night comparison but with the
additional data for the simulated Ali-Scout included. The same qualitative results are
seen for both the retrieval times and the entry times: The condition effect is significant
in each (p=0.0001), and the interaction between condition and age group is significant
in each (p=0.0001). In Table 20, the median and mean times are given for each of the
three conditions. Although the differences between simulated times and other times
are significant for both entry and retrieval, the differences are larger for the retrieval
times. In the interaction plots, shown in Figure 29, the main qualitative difference
between the retrieval and entry tasks occurs with the older subjects. In the retrieval
case, the unique condition is the simulated condition, which is much longer; in the
entry case, the unique condition is the dusk condition, which is much shorter.
42
Table 20. Median and mean times for each condition.
Destination Retrieval (s)
Condition
Median Ratio
Mean
to Sim
Simulated
8.42
1.00
14.78
Night
6.03
0.72
8.89
Dusk
4.79
0.57
7.77
25
20
15
10
5
0
Mean
74.28
65.71
54.04
ENTRY
120
30
Mean Entry Time (s)
Mean Retrieval Time (s)
Simulated
Night
Dusk
RETRIEVAL
35
Destination Entry (s)
Condition
Median Ratio
to Sim
Simulated
58.65
1.00
Night
50.32
0.86
Dusk
44.52
0.76
Young
Middle
Age
100
80
60
40
20
Older
Young
Middle
Age
Older
Figure 29. Interactions between the condition effect and the age effect.
The error bars represent 95 percent confidence intervals.
There were not enough errors committed during the retrieval task to analyze
differences between the simulated Ali-Scout and the real Ali-Scout. However, the
errors for the entry task were much greater in number for the simulated version than for
either of the other two versions. Figure 30 shows the condition effect, identified by
one-way ANOVA as significant (p=0.033). The 28 errors out of 180 trials committed on
the simulated Ali-Scout was at least twice the number committed in either of the
lighting conditions for the real Ali-Scout in the same number of trials (12 errors for the
dusk condition and 14 for the night condition). No interaction between condition and
age group or sex was significant.
43
Errors committed (out of 5)
1.2
ENTRY
1
.8
.6
.4
.2
0
Night
Dusk
Simulated
Condition
Figure 30. Effect of condition on errors committed.
The error bars represent 95% confidence intervals.
What kinds of interface design problems did drivers of all ages encounter
(and how can they be corrected)?
The Ali-Scout (see Figure 31 ) has several usability problems and physical limitations,
some of which affected all subjects and some which affected primarily older subjects.
There were 11 problems worthy of note.
Figure 31 The Ali-Scout navigation system
Problem 1. The most frequently observed usability problem was that almost all
subjects confused the zero button with the (letter) O button because the symbols
representing them are virtually identical (except for color). This was not a size
problem. The mean subjective rating of text size (where 1=too small, 2=just right,
44
3=too large) was 1.9 for the real unit, 1.7 for the simulation (even though the character
sizes were identical). Large age differences were not apparent in the data.
Problem 2. Subjects had trouble locating and understanding the function of the shift
key. Often, subjects simply forgot to use the shift key when it was required. Also, in
darker conditions, many of the older subjects were unable to detect a difference
between yellow and white characters (the shift key was used for characters labeled in
yellow), leaving the location of the symbol on the key as the only cue.
Furthermore, the yellow upward-pointing arrow used to represent the shift key was
ambiguous for some subjects as they tried to use the shift key to move the cursor up a
line or were unable to find any shift key when learning to use the system.
Finally, several subjects tried to hold the shift key down while typing the character (as
with a typewriter) or pushed the shift key twice (because they were unsure whether
their first attempt worked), neither of which produced the desired result.
Problem 3. The space function does not have its own key, but rather appears on the
same key as the “L.” This requires the user to press two keys for each space, one of
the most frequently used characters. Also, the symbol used to represent a space
(essentially the bottom half of a square) was a source of difficulty for nearly all of the
subjects.
Problem 4. Subjects, thinking of the device as a typewriter, often entered a space
character (instead of the right arrow) to move the cursor to the right , causing
characters to be erased instead of skipping past them. During the initial learning
period, very few of the subjects were able to figure out how to enter a space even
though they had just watched a video which mentioned the method. Also, many of the
older subjects and some of the middle-aged subjects forgot how to enter a space by
the time the main part of the experiment began, while the younger subjects tended to
remember but often hesitated.
Problem 5. Many subjects were often confused about how to advance to the next
step when entering destinations. This was seen most frequently when subjects tried to
advance from entering a name to entering coordinates. This was not due to problems
with text legibility. When asked to rate the display contrast (1=not enough, 2=just right,
3=too much), the ratings indicated contrast was close to adequate (mean rating=1.8 for
the real unit, 1.9 for the simulation).
Problem 6. Subjects often used the wrong set of arrows when trying to move the
cursor around, sometimes necessitating a large amount of retyping or error correction.
Interestingly, when asked in the post-test questionnaire if the real and simulated
interfaces were logical, all but one subject responded yes.
Problem 7. The cancel feature required the user to push two buttons simultaneously
(when the panel was closed), which sometimes required subjects to push harder than
felt comfortable. Very few subjects were confident at first that the system actually
intended them to push two buttons simultaneously.
45
Problem 8. The symbols used to represent “cancel” and “enter,” an X’d circle and a
diamond with a vertical line inside it, respectively, were unsuccessful in conveying
meaning.
Problem 9. The size and spacing of the keys were criticized by many of the subjects
for being inadequate, and, prior to the experiment, many subjects expressed doubt
that they would be able to use such a cramped keyboard. In the subjective evaluation,
the mean rating of key size was 1.3 (1—too small, 2—just right, 3—too big) for the real
Ali-Scout unit, 1.5 for key spacing. For the simulated Ali-Scout unit, the ratings were
1.6 and 1.5. There were no age-related differences apparent under statistical
evaluation. However, a quick examination of the results suggested that there may
have been differences had there been a higher resolution for the subjective scale.
The significant difference between women's and men's retrieval and entry times is
undoubtedly the result of many factors, but one which may have some influence is
finger size. Figure 32 shows the results of the anthropometry analysis in which each
subject's finger contact width was measured. The width of an Ali-Scout button is 6.0
millimeters, and the space between adjacent buttons is 3.0 millimeters. This suggests
that 12.0 millimeters is the maximum width of a finger if no contact with other buttons is
to occur. Of the subjects in this study, 11 of the 18 women and 16 of the 18 men had
finger contact patches wider than 12.0 millimeters. In the judgment of the
experimenters, subjects in this sample of adults did not seem to have unusually fat
fingers.
6
Mean = 12.5 mm
St. dev = 1.4 mm
5
Count (n=18)
Men
6
Mean = 13.8 mm
St. dev = 1.7 mm
5
4
4
3
3
2
2
1
1
0
0
10
12
14
16
18
Finger width (mm)
20
10
12
14
16
18
Finger width (mm)
Count (n=18)
Women
20
Figure 32. Distribution of finger contact widths for the 36 subjects, split by gender.
Normal curves with the same mean and standard deviation are overlaid.
Problem 10. The lack of feedback from the key mechanisms made keying difficult.
In particular, since there was no distinct bottoming point, subjects did not always
provide the proper amount of pressure. There were also many instances where
subjects pressed and released a key and then waited for a response but without effect,
as the key had not been pressed hard enough.
46
Problem 11. Finally, the hinged panel on which the bottom two rows of the
keyboard were placed felt flimsy to many of the subjects, causing them to use their
thumb to support it from underneath as they typed.
How accurate were subjects in looking up coordinates in the manual?
A key difference between Ali-Scout and other navigation systems is that Ali-Scout
uses longitude and latitude, not street addresses or intersections, to identify
destinations. As a consequence, users are required to refer to a manual to obtain the
coordinates for each destination they wish to enter into the Ali-Scout. The manual is
divided into three sections: maps (which can be used to look up the coordinates of
street intersections), address ranges, and points of interest. Thus, subjects were
asked to look up three sets of coordinates from each of the three sections.
The associated error data from all coordinate-finding tasks are presented in Table 21.
An error was recorded whenever a subject looked up and reported coordinates that
disagreed with the correct coordinates. When searching for intersections on a map (a
task for which the error rate was almost 30 percent), several subjects obtained
incorrect coordinates from the maps because they traced their finger along the path of
the road rather than the appropriate grid line and thus obtained a number that was off
by several units. Fewer errors were made for the intersection of Auburn and Ryan.
Ryan follows the grid line closely enough for the subject to obtain the correct value no
matter which method is used. Auburn dipped down very suddenly at one point,
making it more likely that the subject would trace his finger along the grid line rather
than the street. These errors tended to be small (1 to 2 tenths of a mile), and since the
Ali-Scout unit goes into autonomous mode before the end of the trip, drivers may still
be able to find the destination.
Table 21. Coordinate-Finding Errors
Task
Intersections
Street Addresses
Points of Interest
Destination Description
On Map 1, Giddings & Walton
On Map 2, Auburn & Ryan
On Map 3, Franklin & Maple
450 12 Mile Rd W
2300 Coolidge Hwy.
4429 Sashabaw Rd
Troy Union School
Glen Oaks Golf Course
Nicholas George Theater
Number
Errors
12
7
12
16
7
2
0
0
0
Errors (%)
33.3
19.4
33.3
44.4
19.4
5.6
0
0
0
28.7
23.2
0
Address-range coordinate errors (which accounted for 23 percent of the trials) were
most likely due to the subject accidentally choosing the wrong range or being unable
to find the correct range because ranges were listed in numerical order by town for
each street, rather than simply numerical order for each street. In addition, one of the
difficulties in finding the correct coordinates for 450 12 Mile Rd W was that it was often
confused with 12 Mile Road, which was listed in the preceding column of the manual.
47
Finally, the absence of errors in finding coordinates for points of interest is most likely
due to the manual listing them in alphabetical order, and the destinations chosen for
this experiment did not require the subject to choose between more than one address.
Although no statistical analysis was performed to determine times for the coordinatefinding task, it is estimated that subjects took from 40 seconds to over 1 minute for
maps, 30 to 45 seconds for address ranges, and 15 to 30 seconds for points of
interest. These experimenter estimates correspond with the error data, and the
reasons for the time differences should follow those outlined previously. In addition,
the times for the map would tend to be longer because the streets are not indexed,
forcing the subject to search the whole map to find the streets. Many of the subjects
took a long time to find 450 12 Mile Rd W because they did not know if numbered
streets were listed by their spelling or at the beginning or end of the section.
48
CONCLUSIONS AND DISCUSSION
How can the analysis protocol be improved?
A major development of this project was the creation of a tool for controlling frameaccurate VCRs and using that tool to obtain reasonably accurate keystroke time data.
The analysis method proved to be reliable. While tools for this purpose are
commercially available, they tend to be quite expensive and are not perfectly matched
to the analysis tasks at hand.
This project would have taken several months less time and cost considerably less if
the navigation system provided a means for directly recording keystroke entries and
screen changes. Navigation hardware developers should incorporate such a
capability in development systems. The absence of such features discourages the
conduct of human factors studies, leading to systems that are more difficult and less
safe to use.
What were typical entry and retrieval times (and error rates) for
destinations?
The mean entry time was 65 seconds; the median was 52 seconds. The mean
retrieval time was 10 seconds; the median was 6 seconds. Thus, entry times were 6
to 9 times greater than retrieval times for stored destinations. The difference between
the means and medians was so great because of the presence of several extremely
long times, which influence the mean more than the median. Because of these
extreme outliers, the median gives a better sense of a "typical" time than the mean.
It should be recalled, however, that these times do not include the subject's thinking
time required for planning and confirmation. By observation, those times were
typically 1 to 2 seconds for entry and 1 to 2 seconds for retrieval. If the subject was
confused, these times could be much longer. Further, for destination entry, a
significant time was required to find coordinates on lists or on maps, a point discussed
later in this section.
Error rates were 1.5 percent for retrieval, 10 percent for entry, nearly a factor of 7
difference.
Did performance change with practice?
Entry times, retrieval times, and entry errors all decreased with practice, but practice
effects were statistically significant only for entry times. From the first to the third
practice block times decreased by about 20 percent. Thus, by some criteria, subjects
were moderately proficient at retrieval-related tasks before the first block.
How did time and errors vary as a function of driver age and sex?
There were large significant differences due to driver age and sex. For retrieval,
median times were 5.9 seconds for women and 6.4 seconds for men (with means of 9
49
and 12 seconds, respectively). These suggest a difference of 9 percent. There were
too few errors to examine either sex or age differences for retrieval.
The median entry times were roughly 48 seconds for women, 56 seconds for men
(with means of 59 and 70 seconds respectively). Hence, men took about 17 percent
longer to enter destinations. However, error rates for the completed entry were about
the same.
Differences due to age were much larger. For retrieval, the young, middle-aged, older
driver median times are 4.3, 7.3, and 8.6 seconds (with means of 5.7, 9.6, and 16.2
seconds). Hence, the young-old times differ by a factor of 2. The median entry times
were 38 seconds for young subjects, 52 seconds for middle-aged subjects, and 76
seconds for older drivers (with means of 41, 61, and 92 seconds, respectively). This is
again a factor of 2 for the young-old difference. The difference is even more than
double when mean times are compared instead of median times because the older
age group tended to include more extreme outliers, with the result that the mean time
for the older group is more skewed than for the other two groups.
Differences in destination entry error rates were even larger. For young and middleaged subjects the error rate was approximately 5 percent. For older subjects, the error
rate was 20 percent, a factor of four difference.
What subject factors other than age and sex influenced performance in
this experiment?
Of the factors examined (comfort with maps, prior touchscreen use, frequency of
computer use, typing proficiency), only computer usage was correlated with
performance. This effect is not simply due to age differences; even though there was
on average more computer experience represented in the sample of young subjects
than in the older group, the effect of computer experience was also seen within age
groups, particularly the middle-age and older groups.
How did time and errors vary as a function of ambient illumination?
Mean retrieval times were approximately 8 seconds under dusk conditions, 9 seconds
at night, a difference (about 10 percent) that was not statistically significant. (Means
are reported here instead of medians because ANOVA is based on means, and this
section and the next concern only comparisons using ANOVA. (The medians may be
found in the results.) Mean entry times were 54 seconds at dusk, 66 seconds at night
(22 percent greater), a statistically significant difference.
Particularly noteworthy were problems older drivers had in the night condition. For
them, retrieval times were 70 seconds at dusk, 100 seconds at night, much greater
than other groups in the sample. While part of the difference may be due to
experimental artifacts (nonuniform illumination of the device with particular difficulty in
seeing the top row), they do not completely account for the age differences. This
finding emphasizes the need to examine the legibility of self-illuminated ITS products
under nighttime conditions using the least capable subjects, namely older drivers.
50
There were no statistically significant dusk-night differences in terms of errors.
Were the times and errors the same for real and simulated interfaces?
No. The mean entry times were 54 and 66 seconds for the dusk and night conditions
with the real interface, and 74 seconds for the simulated interface. (The associated
medians were 44, 50, and 58 seconds.) Thus, tasks using the simulated interfaces
took roughly 25 percent longer to complete. For entry times, the comparable values
were 8, 9, and 15 seconds (with medians of 5, 6, and 8 seconds). In that case, the
difference is much larger, nearly a factor of 2. A major reason for these differences is
how older drivers responded at night.
Also differing was the number of errors (12 for dusk, 14 for night, and 28 for simulated);
the number in the simulated condition was greater by a factor of 2. Even if the times
and errors are different, it may be possible to scale data from simulated interfaces to
predict performance with real interfaces, although interactions with age complicate
scaling.
What kinds of problems did drivers of all ages encounter (and how can
they be corrected)?
Problem 1. Zero and the letter O were confused.
These two characters look alike and were therefore mistaken for each other. Solutions
include adding a slash to the zero and placing a border around the numbers to group
them together. A more radical solution would be to completely redesign the keyboard
so each key face is used for only one character.
Problem 2. Use of the shift was confusing.
While subjects were shown how to use the shift key, some forgot. In part, this was
because the toggling model for shift key use (press shift, then the key to be shifted) did
not fit the typewriter/computer model (hold the shift key down, then press the key to be
shifted). One step in the right direction would be to have the display indicate whether
the system was in shift mode (via a light, tone, or LCD graphic).
Identifying the shift key was a problem. The color differences between the white
(unshifted) -yellow (shifted) keys were not perceptible to some older drivers. This
aspect of the problem could be overcome, in part, by changing the font of one of the
characters on each key or using a more distinguishable color code. Also, the graphic
used to represent shift was easily confused with the various arrow/cursor keys
provided. Additional changes to the shift graphic (e.g., filling it in or indicating that it is
to be used with the right-side character of each letter pair) may help overcome
selection of the wrong key.
51
Problem 3. The space key was too difficult to access.
Use of the space key was quite common in destination entry. However, two keystrokes
were required to enter a space. Further, the typewriter model (a large bar below all
other keys) was not supported by the interface. Providing a space bar that fits the
accepted user model would require redesigning the keyboard. Less costly
improvements include making the space a separate button and using a more easily
understood label for it.
Problem 4. The space key was misused.
Some subjects thought the space key would behave as it does on a typewriter. They
did not understand that spacing over would erase, not merely move the cursor. It is not
apparent how to solve this problem.
Problem 5. How to change fields was unclear.
This occurred after a name was entered and the next step was to enter coordinates.
One option might be a graphic on the keypad showing how the cursor keys could be
used to change fields.
Problem 6. The two sets of arrow keys were confused with each other.
The open-arrow and closed-arrow keys look too similar and their functional difference
is unclear. The open arrow keys controlled the cursor, allowing movement one
character up, down, left, or right. The solid arrow keys (also on the front panel) were
for scrolling up and down in the stored list of destinations and for accessing special
menus (e.g., parking information and route type). One possible way to solve this
problem would be to enclose each set of keys with a border and provide a label
indicating their function.
Problem 7. Having to push two keys simultaneously to cancel was not
intuitive.
Although requiring simultaneous keypresses can prevent accidental activation of
unwanted functions, it is an unfamiliar concept to many and the existence of such a
feature may never be comprehended. A possible solution would be to add a label
such as "push both" underneath the cancel symbol. Also, simultaneous keypresses
would be physically easier if the buttons provided better feedback.
Problem 8. Several key labels were uninformative.
Many subjects did not understand the labels for "cancel" and "enter." One possibility
for "enter" might be the graphic used on some computer keyboards (↵ ).
Problem 9. The keys are too small and too closely spaced.
This was a major problem. Small keys on this device reduce the in-vehicle real estate
required, lessening the degree to which the stalk-mounted display unit blocks access
52
to other instrument panel controls and displays. Compactness also reduces cost.
However, the keys on the Ali-Scout have about one-quarter to one-half the surface
area of keys on a hand-held calculator, a device for which minimum key sizes are
used for portability. As indicated by the finger anthropometry data, finger sizes of the
subjects tested exceeded the width of the keys plus the surrounding space, making it
very difficult for subjects to precisely position their fingers and depress a single key.
Gloved operation, important for Michigan winters, would have been impossible.
Complaints concerning the keys appear in Eby et al. (1996) and were voiced by
subjects here. The solution is straightforward: increase the size and spacing. The
anthropometric data given in this report, combined with the data in Hoffmann, Tsang,
and Mu (1995) could be utilized to predict tradeoffs between entry performance times,
key size, and key spacing. However, some adjustments of those data may be needed
since the Hoffmann et al. research assumes that subjects know where keys are
located. In the experiment conducted here, some visual search for the key was
required because of the nonstandard alphabetic sequencing.
Problem 10. Key feedback was inadequate.
Because there was not a distinct feeling when switch contact was made, subjects
waited for visual feedback from the real device and both visual and auditory feedback
from the simulation to determine when switch closure occurred. Because the feedback
was not instantaneous, subjects tended to press much harder and longer than
necessary.
For simulated interfaces, it is important that a very fast computer be provided. In fact,
earlier versions of the simulation ran on a Mac IIcx and were noticeably slow. While
running the simulation on a PowerMac 7200 (and optimizing the code somewhat)
improved performance, use of a still faster computer would have been closer to reality
since subjects were still noticeably slowed down when trying to repeat the same
keystroke several times in a row. Such computers are now widely available.
Developers planning to use rapid prototypes for interface evaluation need to make
sure that computers are available that are fast enough to run simulations without
perceptible delays, especially in response to keystrokes. As computer performance
improves, this is becoming less of an issue. However, the tendency is to continue to
challenge the boundaries of computer performance by writing more complex
simulations.
In addition to improving system timing, use of the real interface could be enhanced by
providing keys with more distinctive tactile feedback to indicate closure. In the case of
simulated interfaces, some thought needs to be given as to how readily fabricated
collapsible overlays might be used to provide feedback. An alternative might be to
attach a small vibrator to the subject's fingertip (connected to the simulation computer),
that would give the feeling of switch closure.
Problem 11.
The hinged panel was not stable.
When entering data, subjects used a variety of strategies to support the lower panel
and keep it from moving. Providing a more positive stop or latches to hold the panel
open would help.
53
How accurate were subjects in looking up coordinates in the manual?
Subjects made numerous errors in looking up coordinates in the manual. For finding
intersections and street addresses, the error rate was 20 to 30 percent. For points of
interest, there were no errors. This finding does not speak well for the effectiveness of
the documentation. This finding also raises questions about the viability of a system
that requires use of longitude and latitude for on-road navigation. While those
coordinates may work well for users of air, sea, and off-road navigation systems,
drivers rely on street- or landmark-related information for guidance. While the point-ofinterest error data suggest it is possible to design a reliable on-road navigation
interface that requires coordinates, the other two data sets suggest that use of
longitude and latitude are not desired. Users are unlikely to find a navigation system
acceptable if that system directs them to the wrong destination 25 percent of the time
(because they selected the wrong location). While some of those errors are small,
actual misdirection rates should be even greater as entry errors are likely when the
information entered (longitude and latitude) is not meaningful to users.
How did performance with the Ali-Scout interface compare with other
systems described in the literature?
Making comparisons with other studies in the literature is extremely difficult to do
because the tasks and subject samples differ. As was noted previously, age
differences have a major influence on performance, with young-old differences often
differing by a factor of 1.5. Here, when only keying times were examined, the
difference was a factor of 2. However, interface differences tend to be much less. For
example, in Paelke and Green (1993), the ratio of best to worst interfaces
(doublepress/phone pad) was 1.7. Fortunately, some of the subject samples here are
comparable. Dingus, Hulse, Krage, Szczublewski, and Berry (1991) used three age
groups (young, middle, old), while Paelke and Green (1993) had two groups of
subjects (young, old). Loring and Wiklund (1990b) did not identify the ages of their
subjects.
Interfaces examined varied widely in their functionality, so functions provided on one
system are not available on another. Added functionality, if not thoughtfully applied,
can make the completion of core tasks more difficult. In several studies, only a phrase
is provided describing what subjects did, so it is difficult to know if task objectives are
comparable.
Finally, there is some uncertainty about how tasks were timed. While it is believed this
generally occurred from the first button press, planning prior to keying is an important
part of destination entry and retrieval tasks. However, it is challenging to cleanly
delineate when subjects are receiving instructions on how to complete a task and
when they are thinking about how to complete it.
Some thought needs to be given to what the basis for comparison should be. The
times just for keying in this experiment were mean times of 10 seconds for retrieval
and 65 seconds for data entry. An additional 1-2 seconds were required prior to each
task for thinking. A major addition unique to this interface is time to look up the
54
coordinates: 40 to 60 seconds for intersections on maps, 30 to 45 seconds for address
ranges, and 15 to 30 seconds for points of interest.
Aggregating times together, this suggests that about 11 seconds were required for
destination retrieval, but 90 to 120 for destination entry.
Three other experiments described in the literature contain data that may be used for
comparison. Loring and Wiklund (1990b) report several tasks that have similarities to
those explored here. Recalling a trip with a particular name took 33 seconds, a task
that may be similar to the retrieval task explored here, which only took one-third of that
time. Deleting a destination, similar to retrieval but with an added step, took 68
seconds. Telling the device to plan a route to a destination and saving the trip plan
just driven took 85 and 134 seconds, respectively. Thus, compared with an early
version of the interface used for the ADVANCE project, the Ali-Scout interface times
were considerably less for retrieval, but comparable for entry.
Dingus, Hulse, Krage, Szczublewski, and Berry (1991) report that entering an
unfamiliar destination required 130 seconds, storing a route took 160 seconds, and
retrieving a stored destination took 50 seconds. Since the Dingus, et al data is for
using a simulated interface written in SuperCard, the comparable times for this
experiment (also for using a simulation) are 15 seconds for retrieval, and 74 seconds
for entry. It is not apparent whether thinking time was included in the tasks times.
Thus, these times are slightly longer for retrieval, but much less for destination entry.
Paelke and Green (1993) provide time and error data for entry of addresses. In
contrast to the work of Paelke and Green, the destinations examined here were all in a
single county, so entering a city was not required. Furthermore, in contrast to real
systems, there was no need to enter a destination mode prior to beginning destination
entry. Overall times (the mean of the driving and parked conditions) of 43 seconds
were reported for the phonepad, 44 seconds for the Qwerty interface, 55 seconds for
the scrolling list (similar to Zexel/Rockwell Pathmaster/Siemens Tetrastar), and 76
seconds for the double press interface (similar to the TravTek interface). Times for
parked conditions were 10 to 20 percent less than those for driving. It should be noted
that the "driving task" was of low fidelity and subjects did not devote the attention to the
task that they would devote to real driving. Hence, the times for destination entry while
concurrently driving are underestimates.
The 76 seconds reported by Paelke and Green for the TravTek-like interface may be
an overestimate as there were brief instances for which subjects had to wait for the
interface simulation to update, something that was much less of an issue for the real
TravTek interface. The closest comparable task in Dingus, et al. was entering an
unfamiliar destination, a task that required much more than was simulated by Paelke
and Green. While it requires many assumptions, it appears that the times for
destination entry reported by Paelke and Green are equal to or less than those
reported here when only keying is considered, much less when coordinate lookup is
included.
Thus, in spite of these provisos and numerous complaints about the keyboard by
subjects (and conflict with good human engineering practice), destination retrieval was
55
actually quite quick relative to other systems that have been evaluated to date.
However, destination entry was very problematic. The difficulty arose from the use of
longitude and latitude as an intermediate step, and use of a keyboard that was too
small and presented logical uncertainties.
In closing
For the Ali-Scout interface, retrieval times were approximately 10 seconds, while entry
times were just in excess of one minute. When coordinate lookup is included, typical
times for destination entry were 90 to 120 seconds. Destination retrieval appears to be
faster than other interfaces, while destination entry appears to be much slower.
Additional effort needs to be given to describing test conditions in sufficient detail (data
base content, device method of operation, response timing, subject selection) so that
replication is possible. This is often not the case in similar studies.
Differences in time due to gender were on the order of 20 percent, with women being
faster. Age differences were approximately a factor of 2, with older subjects having
problems with the interface under the night condition. Older subjects should be the
sample for legibility assessments.
Entry times for simulated interfaces were much longer than those for real interfaces,
though the general pattern of results was the same. Methods for providing tactile
feedback (the feeling of switch closure) need to be explored. This may occur as a
consequence of research on virtual reality.
Beyond this experiment, one of the major topics of current discussion is what drivers
should be allowed to do while driving. It has been suggested that drivers should not
be allowed to perform any destination entry or destination designation tasks while
driving. This experiment shows that there are large differences between retrieving a
stored destination and entering a destination to store. Furthermore, the literature
suggests that there are large differences due to retrieval/entry method and the
interface implementation. While what people can and cannot do safely while driving
was not explored here, lumping all destination-related activities together does not
make sense. Further, because the time required depends on the method, how a
particular task is carried out needs to be considered. These differences in method are
described in the follow-on report in greater detail.
The research presented here provides engineers and designers with methods to
evaluate navigation-interface usability, normative data on the retrieval and entry of
destinations, estimates of the individual differences, and a list of problems associated
with a contemporary navigation product. This information should be useful to
engineers and designers involved in future navigation systems.
56
REFERENCES
Archer, N.P. and Yuan, Y. (1995). Comparing Telephone-Computer Interface Designs:
Are Software Simulations as Good as Hardware Prototypes, International
Journal of Human-Computer Studies, 42, 169-184.
Beevis, D. and St. Denis, G. (1992). Rapid Prototyping and the Human Factors
Engineering Process, Applied Ergonomics, 23(3), 155-160.
Berger, C., Walton, C., and Wurman, P. (1993). The Event Recorder (version 5.2), Ann
Arbor, MI: The University of Michigan, Office of Instructional Technology.
Card, S.K., Moran, T.P., and Newell, A. (1983). The Psychology of Human-Computer
Interaction, Hillsdale, NJ: Lawrence Erlbaum Associates.
Coleman, M.F., Loring, B.A., and Wiklund, M.E. (1991a). Test of Reduced-Size Touch
Screen Keyboards (technical report), Bedford, MA: American Institutes for
Research.
Coleman, M.F., Loring, B.A., and Wiklund, M.E. (1991b). User Performance on Typing
Tasks Involving Reduced-Size, Touch Screen Keyboards, Vehicle Navigation
and Information Systems Conference Proceedings (VNIS'91), New York:
Institute of Electrical and Electronics Engineers, 534-549.
Detweiler, M.C. (1990). Alphabetic Input on a Telephone Keypad, Proceedings of the
Human Factors Society 34th Annual Meeting, Santa Monica, CA: Human
Factors Society, 212-216.
Dingus, T.A., Hulse, M.C., Krage, M.K., Szczublewski, F.E., and Berry, P. (1991). A
Usability Evaluation of Navigation and Information System "Pre-Drive"
Functions (SAE paper 912794), VNIS'91 Proceedings, Warrendale, PA: Society
of Automotive Engineers, 527-536.
Eby, D.W., Streff, F.M., Wallace, R.R., Kostyniuk, L.P., Hopp, M.L., and Underwood, S.
(1996). An Evaluation of User Perceptions and Behaviors of FAST-TRAC: Pilot
Study Results (Technical Report UMTRI-96-14), Ann Arbor, MI: The University of
Michigan Transportation Research Institute.
Green, P., Boreczky, J., and Kim, S. (1990). Applications of Rapid Prototyping to
Control and Display Design. (SAE paper #900470, Special Publication
SP-809), Warrendale, PA: Society of Automotive Engineers.
Green, P., Levison, W., Paelke, G., and Serafin, C. (1993). Preliminary Human Factors
Guidelines for Driver Information Systems (Technical Report UMTRI-93-21), Ann
Arbor, MI: The University of Michigan Transportation Research Institute (also
published as FHWA-RD-94-087, McLean, VA: U.S. Department of
Transportation, Federal Highway Administration, December, 1995).
57
Green, P. and Olson, A. (1996). Practical Aspects of Prototyping Instrument Clusters,
(SAE paper 960532), Warrendale, PA: Society of Automotive Engineers.
Hoffmann, E.R., Tsang, K.K., and Mu, A. (1995). Data-Entry Keyboard Geometry and
Keying Movement Times, Ergonomics, 38(5), 940-950.
Katz, S., Fleming, J., Hunter, D.R., Green, P., and Damouth, D. (1996). On-the-Road
Human Factors Evaluation of the Ali-Scout Navigation System (Technical
Report UMTRI-96-32), Ann Arbor, MI: The University of Michigan Transportation
Research Institute (in preparation).
Katz, S., Green, P., and Fleming, J. (1995). Calibration and Baseline Driving Data for
the UMTRI Driver Interface Research Vehicle, (Technical Report UMTRI-95-2),
Ann Arbor, MI: The University of Michigan Transportation Research Institute.
Kieras, D. (1988). Towards a Practical GOMS Model Methodology for User Interface
Design, chapter 7 in M. Helander (ed.), Handbook of Human-Computer
Interaction, New York: Elsevier Science.
Kostyniuk, L. and Eby, S. (1996). Natural Use/Yoke Study Survey (EECS-ITS LABFT95-018), Ann Arbor, MI: The University of Michigan Intelligent Transportation
Systems Center.
Loring, B.A. and Wiklund, M.E. (1990a). Report on Test of Low-Fidelity Prototypes
(technical report), Bedford, MA: American Institutes for Research.
Loring, B.A. and Wiklund, M.E. (1990b). Report on Baseline Usability Test of
Motorola's Prototype 2 (technical report), Bedford, MA: American Institutes for
Research.
MacAdam, C.C., Green, P.A., and Reed, M.P. (1993). An Overview of Current UMTRI
Driving Simulators, UMTRI Research Review, July-August, 24(1), 1-8.
Manes, D., Green, P., and Hunter, D. (1996a). Glance Frequencies to the Ali-Scout
Navigation System, (Technical Report UMTRI-96-42), Ann Arbor, MI: The
University of Michigan Transportation Research Institute (in preparation).
Manes, D., Green, P., and Hunter, D. (1996b). Prediction of Destination Entry and
Retrieval Times Using GOMS, (Technical Report UMTRI-96-37), Ann Arbor, MI:
The University of Michigan Transportation Research Institute (in preparation).
Marics, M.A. (1990). How Do You Enter "D'Anzi-Quist" Using a Telephone Keypad?
Proceedings of the Human Factors Society 34th Annual Meeting, Santa
Monica, CA: Human Factors Society, 208-211.
Paelke, G.M. (1993). A Comparison of Route Guidance Destination Entry Methods,
Proceedings of the Human Factors and Ergonomics Society 37th Annual
Meeting-1993, Santa Monica, CA: The Human Factors and Ergonomics Society,
569-573.
58
Paelke, G. and Green, P. (1993). Entry of Destinations into Route Guidance Systems:
A Human Factors Evaluation (Technical Report UMTRI-93-45), Ann Arbor, MI:
The University of Michigan Transportation Research Institute.
Sears, A., Revis, D., Swatski, J., Crittenden, R., and Shneiderman, B. (1993).
Investigating Touchscreen Typing: the Effect of Keyboard Size on Typing
Speed, Behaviour and Information Technology, 12(1), 17-22.
Siemens Automotive (undated) Ali-Scout Navigation System User's Guide, Auburn
Hills, MI: Siemens Automotive.
Segal, L.D. and Andre, A.D. (1993). Activity Catalog Tool (A.C.T.) v2.0 User Manual
(NASA Contractor Report CR 177634), Moffett Field, CA: NASA Ames
Research Center.
Steinfeld, A., Manes, D., Green, P., and Hunter, D. (1996). Destination Entry and
Retrieval with the Ali-Scout Navigation System (Technical Report UMTRI 96-30),
Ann Arbor, MI: The University of Michigan Transportation Research Institute (this
report).
Taylor, W. and Wu, J. (1995). A Database System Containing MOE's of Interest to the
Evaluation (Technical Report EECS-ITS LAB FT95-028), Ann Arbor, MI: The
University of Michigan Intelligent Transportation Center.
Treece, J.B. (1996). In Japan, Car Buyers Put Navigation Devices at the Top of Their
List, Automotive News, September 16, 1996, p. 3, 24.
Underwood, S.E. (1994). FAST-TRAC: Evaluating an Integrated Intelligent VehicleHighway System, Proceedings of the IVHS America 1994 Annual Meeting,
volume 1, 300-311, Washington, D.C.: IVHS America.
Wallace, R.R., Eby, D.W., and Gardner, S.G. (1995). edited version of FAST TRAC
(VHS videotape, 5 min.), Ann Arbor, MI: The University of Michigan
Transportation Research Institute.
Zwahlen, H.T. Adams, C.C.Jr., and DeBald, D.P. (1988). Safety Aspects of CRT Touch
Panel Controls in Automobiles, in Gale, A.G., Freeman, M.H., Haslegrave, C.M.,
Smith, P., and Taylor, S.P., Vision in Vehicles II, Amsterdam, Netherlands:
Elsevier Science, 335-344. .
Zwahlen, H.T. and DeBald, D.P. (1986). Safety Aspects of Sophisticated In-Vehicle
Information Displays and Controls. Proceedings of the Human Factors Society30th Annual Meeting, Santa Monica, CA: The Human Factors Society, 256-260.
59
60
APPENDIX A - MEAN TASK TIMES FOR MOTOROLA PROTOTYPE 2
When
Task
Exploration
find out what the system can do
find out what the system thinks is the current address
find out your current compass heading
reset your present location to 0 Motorola Road. (specify
the full address.)
find out you current location on a map
scroll the map down until you see Dundee Road
zoom out until you can see Interstate 294 labeled
change map view from N-up to heading-up (and back)
display restaurants on the map
find out where the nearest restaurant is
find out the address of the nearest restaurant
adjust the volume
Route Planning set 542 Lindbert Lane as destination. Pick it from a map.
Tell the device to plan a route to your destination
find out how many miles you will drive on your route
access another function of the device
view your current location and your destination on the
same map
select "view from road" as the format for your route
guidance
While Driving
get the next instruction
find out how far it is to your next maneuver
find out how far it is to your next destination
turn the voice down
find out how far you have driven since the beginning of
your trip
replan your route to avoid Doolittle
save the trip plan you just drove
correct a typographical error
Other Tasks
add yourself to the list of drivers
modify your preferences by hiding the "What to Do" box
change current driver to "Clark"
recall the trip plan name "Sales Calls"
add another leg to the trip plan "Sales Calls" 3450
Bayberry Rd, Northbrook
Delete the first left from the trip plan "Sales Calls"
Tailor the first leg by setting preference to min. distance
get help on the task you are doing now
delete the trip plan named "Steve's House"
delete the driver name "Jon"
61
Mean
Time (s)
5.75
20.14
4.22
117.33
12.56
9.63
19.50
9.89
40.56
7.88
72.33
32.75
86.56
86.00
25.44
32.25
8.44
20.00
4.67
2.29
6.14
4.56
51.75
194.67
134.00
1.00
44.78
44.33
30.25
32.89
96.44
19.88
35.63
1.00
67.78
26.89
62
APPENDIX B - DISPLAY UNIT LOCATION
Top View
Touchscreen
face of CRT
Display Unit
3 1/2
2
4 1/4
c
Car (approximate)
13 1/2
1/2
Front View
Eye brow
1 1/2
Display Unit
3/8
1
Found
1 1/4
3 3/4
7 1/4
Found Button
3/4 in high x 1 1/4 wide
Location of Actual Ali-Scout unit
63
2 1/4
Note: Since the Ali-Scout display unit was mounted on a gooseneck and was moved
aside periodically for other studies, the location varied slightly from subject to subject
(plus or minus one inch).
c
Car (approximate)
c
CRT
1/2
2
1 1/2
2
Simulated
Display Unit
4 3/4
10
Found
card holder
3/4
1/2
7 3/4
13
Simulated display unit is
roughly centered in display area
Note card holder is 4 1/2 in h
by 6 1/2 w
Location of Simulated Display Unit (shown on CRT)
64
APPENDIX C - LIGHT LEVELS FOR THE EXPERIMENTAL CONDITIONS
Illuminance Character Character Character Luminance (cd/m2)
(lux)
Location
Used
Color Character Background
door up
‹
white
15.10
1.00
door dn
J
white
7.17
2.47
Simulated Dusk
31.8
O
yellow
7.40
2.47
‹
white
9.83
1.83
display
T
black
1.14
3.56
door up
‹
white
2.10
0.19
door dn
J
white
1.03
0.24
Dusk
28.2
O
yellow
1.19
0.24
‹
white
2.43
0.25
Real
display
T
black
2.03
3.03
door up
‹
white
0.86
0.06
door dn
J
white
0.44
0.09
Night
14.7
O
yellow
1.30
0.09
‹
white
1.30
0.15
display
T
black
1.54
2.62
note: the T from the display is "at the starT"
65
66
APPENDIX D - BIOGRAPHICAL FORM
University of Michigan Transportation Research Institute
Human Factors Division
Subject:
Date:
Biographical Form
Name: __________________________
Male
Female (circle one)
Age: _______________________
Occupation: __________________________
Education (circle highest level completed):
some high school
high school degree
some trade/tech school trade/tech school degree
some college
college degree
some graduate school
graduate school degree
Other: _____________________________________________________
(If retired or student, note it and your former occupation or major)
What kind of car do you drive the most?
Year: _____________
Make: _____________ Model: _____________
Annual mileage: ____________
Have you ever driven a vehicle with a navigation system?
yes
no
How comfortable are you using maps?
very
comfortable
moderately
comfortable
neutral
Have you ever used a touchscreen?
yes
moderately
uncomfortable
very
uncomfortable
no
How often do you use a computer?
never
less than
once a month
a few times
a month
a few times
a week
every
day
How comfortable are you typing (on a standard typewriter or computer keyboard)?
very
comfortable
moderately
comfortable
neutral
moderately
uncomfortable
very
uncomfortable
TITMUS VISION: (Landolt Rings)
1
2
3
4
5
6
7
8
9
10
11
12
13
14
T
R
R
L
T
B
L
R
L
B
R
B
T
R
20/200 20/100 20/70 20/50 20/40 20/35 20/30 20/25 20/22 20/20 20/18 20/17 20/15 20/13
67
68
APPENDIX E - CONSENT FORM
Evaluation of Destination Entry and Retrieval
Participant Consent Form
In cars of the future, you may have an in-car navigation system which would tell
you how to reach destinations. To use it, you'll need to tell the system where you want
to go. We are looking at how to enter and retrieve these destinations for a navigation
system. Responses from typical drivers such as you, will help improve this system.
While sitting in a vehicle mockup, you will respond to a simulated or a real
navigation unit. By pressing buttons destinations can be entered or retrieved. A
computer will record how long it takes to use the system. With your permission, we will
videotape you. We will not record your face at any time. We will not release any
identifying information, so your responses will remain confidential.
The experiment takes about 2 hours for which you will be paid $40. There will
be opportunities for you to take a break if needed. If you have any problems
completing this experiment, you can withdraw at any time. You will be paid
regardless.
______________________________________________________________
I have read and understand the information above.
______________________________
Print your name
_____________________
Date
______________________________
Sign your name
_____________________
Witness (experimenter)
It is OK to videotape me:
yes
no
69
(circle one)
70
APPENDIX F - INSTRUCTIONS TO SUBJECTS
BEFORE SUBJECT ARRIVES
(Tavern)
• Highlight the current subject on the coordinate and entry/retrieval patterns
• Put the coordinate cards in order according to the coordinate pattern
• Put the entry/retrieval stacks in order according to the entry/retrieval pattern
• Open a new VHS tape and label it “Destination Entry Subject ## Date”
• Turn on all audio/video equipment
• Insert and cue the Ali-Scout video
• Write all necessary information on the subject forms
(Sim Lab)
• Turn on the two computers
• Duct tape the Sim lab door so it doesn’t lock
• Plug in the microphone
• Place the “road side” transparency and glare guard on the overhead
• Set up the car for either the touchscreen or Ali-Scout
• Lock the steering wheel
• Make a copy of the “ALISCOUT” file and rename the copy “DE.S##.R#.CX#”
INTRODUCTION
and I will be the person running the study today. If you have any
My name is
problems completing this study, you can withdraw at any time. You will be paid
regardless.
•
Have the subject read the consent form along with you
In cars of the future, you may have an in-car navigation system which would tell you
how to reach destinations. To use it, you'll need to tell the system where you want to
go. We are looking at how to enter and retrieve these destinations for a navigation
system. Responses from typical drivers such as you, will help improve this system.
While sitting in a vehicle mockup, you will respond to a simulated or a real navigation
unit. By pressing buttons, destinations can be entered or retrieved. A computer will
record how long it takes to use the system. With your permission, we will videotape
you. We will not record your face at any time. We will not release any identifying
information, so your responses will remain confidential.
•
Have the subject fill out the consent and bio forms
71
PRACTICE
The first part of this study is a short learning period to become acquainted with the
navigation unit. I have a tape for you to watch that will provide a brief introduction.
Pay special attention to how the Ali-Scout works and how the shift key is used.
•
•
•
•
•
•
Watch the Ali-Scout video
Rewind and eject the tape
Have the subject read the retrieval instructions
Insert the subject tape
Push Record
Turn off the big TV
For practice, please retrieve and enter the following sample destinations using the
practice unit.
•
Provide the practice sheet and paired manual
Dummy List
Amoco
Beckys Cafe
Echo Park Sch
Siemens
Star Deli
Retrieve List
BP Service
Firestone
Mayas Deli
Plus-Bank 24
Subway
Location
Cade Gallery
Hunan Palace
Main Theater
Shell
Village Market
72
Enter List
Coordinates
0830845W
422908N
0832531W
422805N
0830840W
422926N
0830532W
423534N
0830901W
423715N
COORDINATE FINDING
To understand how people find coordinates for this navigation system, we are going to
have you use the manual to find some navigation coordinates. We will be videotaping
you from an angle that will not show your face. Please do not write in the manual.
•
Run the coordinate finding series
Coordinate List
List
1
2
3
1
2
3
1
2
3
•
•
Format
Ali-Scout Maps
On Map 1, Giddings & Walton
On Map 2, Auburn & Ryan
On Map 3, Franklin & Maple
Address Ranges
450 12 Mile Rd W.
2300 Coolidge Hwy.
4429 Sashabaw Rd
Points of Interest
Troy Union School
Glen Oaks Golf Course
Nicholas George Theater
Coordinates
red
blue
0831540W
0830420W
0831810W
424040N
423820N
423240N
near middle
1/2way to edge
bottom edge
0830635W
0831101W
0832212W
423017N
422939N
424211N
middle of range
start
end
0830722W
0832116W
0831425W
423625N
423050N
422803N
Eject the tape
Turn off all audio/video equipment
73
Coordinate Pattern
Demographics
Subject Sex Age Group
1
F
1
2
F
1
3
F
1
4
F
2
5
F
2
6
F
2
7
F
3
8
F
3
9
F
3
10
M
1
11
M
1
12
M
1
13
M
2
14
M
2
15
M
2
16
M
3
17
M
3
18
M
3
19
F
1
20
F
1
21
F
1
22
F
2
23
F
2
24
F
2
25
F
3
26
F
3
27
F
3
28
M
1
29
M
1
30
M
1
31
M
2
32
M
2
33
M
2
34
M
3
35
M
3
36
M
3
Coordinate Finding
Format Order
M
A
P
P
M
A
A
P
M
M
A
P
P
M
A
A
P
M
M
A
P
P
M
A
A
P
M
M
A
P
P
M
A
A
P
M
M
A
P
P
M
A
A
P
M
M
A
P
P
M
A
A
P
M
M
A
P
P
M
A
A
P
M
M
A
P
P
M
A
A
P
M
M
A
P
P
M
A
A
P
M
M
A
P
P
M
A
A
P
M
M
A
P
P
M
A
A
P
M
M
A
P
P
M
A
A
P
M
List
1
3
2
3
2
1
2
1
3
3
2
1
2
1
3
1
3
2
1
3
2
3
2
1
2
1
3
3
2
1
2
1
3
1
3
2
74
Order
2
3
1
2
3
1
1
2
3
1
2
3
3
1
2
3
1
2
1
2
3
1
2
3
3
1
2
3
1
2
2
3
1
2
3
1
2
3
1
2
3
1
1
2
3
1
2
3
3
1
2
3
1
2
1
2
3
1
2
3
3
1
2
3
1
2
2
3
1
2
3
1
MAIN EXPERIMENT
We will now move on to the next part of the study.
•
•
•
•
•
•
Walk the subject to the Sim Lab
Turn on the power strip of the sound cart and push 2, 3, eff, and autotake
Insert the tape
Push record
Make sure the counter is advancing and the picture is clear
Turn on the overhead and PC projector
•
--> Set up the car for the next block according to the pattern list (where “Light” =
sunroof and dashboard lights and “Dark” = headliner light)
Have the subject get in the car and (if necessary) show him how to adjust the seat
•
Just before using the simulated Ali-Scout
• Run the Touchscreen control panel and have the subject calibrate the touchscreen
• Run Touchscreen Trainer to make sure the calibration was correct
• Put the frame on the touchscreen
• Open the simulation program and fill in the appropriate information (output file =
DE.S##.R#.CX#)
•
Turn off the room lights
When I hand you a card, please use the system to find the location listed on the card.
When you have found it please press the “FOUND” key then the cancel key (the X’d
circle) and put the card in the envelope. I will then give you another card. Do you
have any questions? Please turn on the system.
•
Run the retrieval series
The next phase involves entering some locations into the unit. When I hand you a
card, enter the information listed on it. When you have finished entering the
information into the unit, please press the “FOUND” key and put the card in the
envelope. Do you have any questions? Please turn on the system.
•
•
•
•
•
•
Run the entry series
Have the subject hand you the cards from the envelope
Have the subject close the door and turn off the Ali-Scout
Sort the cards
Turn on the room lights
If necessary, have the subject step out of the car
75
•
Clear all unwanted destinations from the Ali-Scout and select “AT THE START” as
the current destination or quit the simulator -->
Retrieval Lists
A
Sakura Bank
Bir Ice Arena
Monterrey Rest
Mobil
Big Boy
B
Seafood Bay
Print Gallery
Majestic Cafe
Vandenburg Sch
Bir Library
C
Bill Knapps
Primos Pizza
Woodside Hosp
Bir Theater
Mongolian BBQ
Dummy
Montgmry Ward
Royal Oak Deli
Sears
Bir Art Gallry
Palace of AH
Entry Lists
Set
A
B
C
Dummy
•
•
•
Name
Nicks Place
Q Gas
Helens Kitchen
Yaw Gallery
Goodyear
Farmer Jack
Taco Loco
First of Am
Jacobsons
Chevron
Lark Rest
Unicorn Grill
Krogers
Qwik Stop
Tuffy Auto
Licht Park
Nordstrom
Discafe
Oakland Mall
Olive Garden
Coordinates
0831732W
423814N
0831654W
424038N
0831649W
424002N
0831303W
423302N
0830508W
423006N
0830937W
423159N
0831932W
423750N
0832459W
424307N
0830905W
424054N
0831707W
423032N
0832250W
423236N
0830848W
422919N
0830506W
422923N
0832353W
423936N
0831642W
422737N
0830731W
423051N
0831211W
422959N
0831732W
423814N
0830638W
423203N
0830828W
423047N
Rewind and eject the tape
Turn off the power strip of the audio cart
Turn off the touchscreen, car lights, overhead projector, and PC projector
76
Entry/Retrieval Pattern
Demographics
Subject Sex Age Group
1
F
1
2
F
1
3
F
1
4
F
2
5
F
2
6
F
2
7
F
3
8
F
3
9
F
3
10
M
1
11
M
1
12
M
1
13
M
2
14
M
2
15
M
2
16
M
3
17
M
3
18
M
3
19
F
1
20
F
1
21
F
1
22
F
2
23
F
2
24
F
2
25
F
3
26
F
3
27
F
3
28
M
1
29
M
1
30
M
1
31
M
2
32
M
2
33
M
2
34
M
3
35
M
3
36
M
3
Destination Retrieval/Entry Blocks
1 (Cards)
Sim ( A )
Light ( C )
Dark ( B )
Sim ( B )
Dark ( C )
Light ( A )
Sim ( C )
Light ( B )
Dark ( A )
Sim ( C )
Dark ( A )
Light ( B )
Sim ( B )
Light ( A )
Dark ( C )
Sim ( A )
Dark ( B )
Light ( C )
Sim ( A )
Light ( C )
Dark ( B )
Sim ( B )
Dark ( C )
Light ( A )
Sim ( C )
Light ( B )
Dark ( A )
Sim ( C )
Dark ( A )
Light ( B )
Sim ( B )
Light ( A )
Dark ( C )
Sim ( A )
Dark ( B )
Light ( C )
2 (Cards)
Dark ( C )
Sim ( B )
Light ( A )
Light ( C )
Sim ( A )
Dark ( B )
Dark ( B )
Sim ( A )
Light ( C )
Light ( A )
Sim ( B )
Dark ( C )
Dark ( A )
Sim ( C )
Light ( B )
Light ( B )
Sim ( C )
Dark ( A )
Dark ( C )
Sim ( B )
Light ( A )
Light ( C )
Sim ( A )
Dark ( B )
Dark ( B )
Sim ( A )
Light ( C )
Light ( A )
Sim ( B )
Dark ( C )
Dark ( A )
Sim ( C )
Light ( B )
Light ( B )
Sim ( C )
Dark ( A )
77
3 (Cards)
Light ( B )
Dark ( A )
Sim ( C )
Dark ( A )
Light ( B )
Sim ( C )
Light ( A )
Dark ( C )
Sim ( B )
Dark ( B )
Light ( C )
Sim ( A )
Light ( C )
Dark ( B )
Sim ( A )
Dark ( C )
Light ( A )
Sim ( B )
Light ( B )
Dark ( A )
Sim ( C )
Dark ( A )
Light ( B )
Sim ( C )
Light ( A )
Dark ( C )
Sim ( B )
Dark ( B )
Light ( C )
Sim ( A )
Light ( C )
Dark ( B )
Sim ( A )
Dark ( C )
Light ( A )
Sim ( B )
CONCLUSION
The data entry tasks are completed. I would now like to check your eyesight.
•
•
Make sure eyesight condition is the same as when testing was done
Test the subject’s eyesight
We will now go back to the office to fill out some final forms.
•
Walk the subject back to the office
Please fill out this question sheet. If you have additional comments please use the
space provided.
•
Have the subject fill out the question sheet
Please fill out this form so that I can pay you.
•
•
•
Have the subject fill out the payment form
Walk the subject towards the stairs
Pay the subject
Before you go, I would like to measure your finger size so that I can evaluate the size
and placement of the buttons on the navigation unit.
•
•
Walk the subject to the copy room
Make a copy of the subject’s finger using the cardboard with plastic window
AFTER SUBJECT LEAVES
(Sim Lab)
• Unplug the microphone
• Turn off the two computers
• Remove the duct tape from the door
(Tavern)
• Clear all unwanted destinations from the Ali-Scout and select “AT THE START” as
the current destination
• Cross off the current subject on the coordinate and entry/retrieval patterns
• Lock the door and return the key to the desk
(343B)
• Staple all the paperwork and put it in the file
78
APPENDIX G - EXPERIMENTAL DETAILS
Coordinate Search Task Counterbalancing
Subject
Sex
1
F
2
F
3
F
4
F
5
F
6
F
7
F
8
F
9
F
10
M
11
M
12
M
13
M
14
M
15
M
16
M
17
M
18
M
repeat for 19-36
Age
young
middle
old
young
middle
old
young
middle
old
young
middle
old
young
middle
old
young
middle
old
Format
Order
M A P
P M A
A P M
M A P
P M A
A P M
M A P
P M A
A P M
M A P
P M A
A P M
M A P
P M A
A P M
M A P
P M A
A P M
List Order
1
3
2
3
2
1
2
1
3
3
2
1
2
1
3
1
3
2
2
1
3
1
3
2
3
2
1
1
3
2
3
2
1
2
1
3
3
2
1
2
1
3
1
3
2
2
1
3
1
3
2
3
2
1
Note: Format order codes are:
P—Points of Interest (given the name, find the coordinates in a list),
A—Address Ranges (given an address, find the coordinates in a list)
M—Ali-Scout Maps (given two intersecting roads, find the coordinates on a
map).
List order is a code for what subjects saw in the first, second, and third blocks.
Balancing Outcome for the Entry Tasks
1st Location
2nd Location
3rd Location
4th Location
5th Location
A
B
C
Dummy
Overall
Average
# Keystrokes #
11.3
10.0
10.5
11.3
10.3
10.8
10.4
10.6
10.8
10.7
79
Shifts
1.0
1.0
0.8
1.0
1.0
1.0
1.0
1.0
0.8
1.0
Counterbalanced Sequence for Conditions
Demographics
Subject Sex
Age
Group
1
F
1
2
F
1
3
F
1
4
F
2
5
F
2
6
F
2
7
F
3
8
F
3
9
F
3
10
M
1
11
M
1
12
M
1
13
M
2
14
M
2
15
M
2
16
M
3
17
M
3
18
M
3
repeat for 19-36
Block Order with Conditions
1 (Set)
2 (Set)
3 (Set)
Sim (A)
Dusk (C)
Night (B)
Sim (B)
Night (C)
Dusk (A)
Sim (C)
Dusk (B)
Night (A)
Sim (C)
Night (A)
Dusk (B)
Sim (B)
Dusk (A)
Night (C)
Sim (A)
Night (B)
Dusk (C)
80
Night (C)
Sim (B)
Dusk (A)
Dusk (C)
Sim (A)
Night (B)
Night (B)
Sim (A)
Dusk (C)
Dusk (A)
Sim (B)
Night (C)
Night (A)
Sim (C)
Dusk (B)
Dusk (B)
Sim (C)
Night (A)
Dusk (B)
Night (A)
Sim (C)
Night (A)
Dusk (B)
Sim (C)
Dusk (A)
Night (C)
Sim (B)
Night (B)
Dusk (C)
Sim (A)
Dusk (C)
Night (B)
Sim (A)
Night (C)
Dusk (A)
Sim (B)
APPENDIX H - PRACTICE SHEET
Please find the following locations in the order they are shown. Press the
FOUND button after finding each one.
BP SERVICE
FIRESTONE
MAYAS DELI
PLUS-BANK 24
SUBWAY
Please enter the following locations and their coordinates in the order
shown.
Location
Coordinates
CADE GALLERY
0830845W
422908N
HUNAN PALACE
0832531W
422805N
MAIN THEATER
0830840W
422926N
SHELL
0830532W
423534N
VILLAGE MARKET
0830901W
423715N
81
82
APPENDIX I - RETRIEVAL DATABASE
Location
AT THE START
BIG BOY
BILL KNAPPS
BIR ART GALLRY
BIR ICE ARENA
BIR LIBRARY
BIR THEATER
MAJESTIC CAFE
MOBIL
MONGOLIAN BBQ
MONTERREY REST
MONTGMRY WARD
PALACE OF AH
PRIMOS PIZZA
PRINT GALLERY
ROYAL OAK DELI
SAKURA BANK
SEAFOOD BAY
SEARS
VANDENBURG SCH
WOODSIDE HOSP
Group
A
C
D
A
B
C
B
A
C
A
D
D
C
B
D
A
B
D
B
C
Type
1
3
3
5
5
5
5
2
3
4
5
5
3
4
4
1
2
4
4
1
1
Scroll
0
2
3
4
5
6
7
8
9
10
11
12
13
14
15
16
17
18
19
20
21
Hybrid
1
2
3
4
5
6
7
2
3
4
5
6
2
3
4
1
2
3
4
1
1
Min
0
2
3
4
5
5
5
2
3
4
5
5
2
3
4
1
2
3
4
2
1
Note: The scroll and min columns are fixed. To enter the scroll mode, an arrow key
must be pressed.
83
84
APPENDIX J - DISPLAY UNIT POST-TEST QUESTIONNAIRE
Please place a check in the appropriate box for each question. There is additional
room for comments, if needed.
1 . Are the keys the right size?
too small
Simulated
just right
too large
Real
2 . Is the spacing between the keys the right size?
too small
just right
Simulated
too large
Real
3 . Is the text on the display the right size?
too small
just right
Simulated
too large
Real
4 . Does the screen have the right amount of contrast?
not enough
just right
too much
Simulated
Real
5 . Does the system behave in a logical manner?
no
yes
Simulated
Real
85
86
APPENDIX K - ANOVA TABLES
ANOVA summary table for destination retrieval time.
Source
df Sum of Squares Mean Square
Sex
1
1280.602
1280.602
Age Group
2
10027.110
5013.555
Sex * Age Group
2
1078.592
539.296
Subject (Sex, Age Group)
30
15078.253
502.608
Residual
504
83080.785
164.843
F-Value P-Value
7.769
.0055
30.414
.0001
3.272
.0388
3.049
.0001
ANOVA summary table for destination entry time.
Source
df Sum of Squares Mean Square
Sex
1
17696.433
17696.433
16.726
.0001
Age Group
2
230400.068
115200.034
108.882
.0001
Sex * Age Group
2
5009.592
2504.796
2.367
.0948
30
220173.228
7339.108
6.937
.0001
504
533244.526
1058.025
Subject (Sex, Age Group)
Residual
F-Value P-Value
ANOVA summary of lighting condition effect and some interactions for destination
retrieval. The dependent variable is retrieval time (dusk and night only).
Source
Subject (Sex, Age Group)
Condition
Sex
Age Group
Condition * Sex
Condition * Age Group
Residual
df Sum of Squares Mean Square
32
7196.522
224.891
1
111.690
111.690
1
316.444
316.444
2
3433.222
1716.611
1
2
320
1.840
44.363
28755.190
1.840
22.182
89.860
F-Value P-Value
2.503
.0001
1.243
.2657
3.522
.0615
19.103
.0001
.020
.247
.8863
.7814
ANOVA summary of lighting condition effect and some interactions for destination
entry. The dependent variable is entry time (dusk and night only).
87
Source
df Sum of Squares Mean Square
Subject (Sex, Age Group) 32
107579.594
3361.862
Condition
1
12267.156
12267.156
Sex
1
18328.816
18328.816
Age Group
2
154795.652
77397.826
Condition * Sex
1
939.898
939.898
Condition * Age Group
2
15874.079
7937.039
Residual
320
215852.002
674.538
F-Value P-Value
4.984
.0001
18.186
.0001
27.172
.0001
114.742
.0001
1.393
.2387
11.767
.0001
ANOVA summary of condition effect and some interactions
for destination retrieval. The dependent variable is retrieval time.
df Sum of Squares Mean Square
Source
Subject (Sex, Age Group) 32
504.901
16156.845
Condition
2549.029
5098.057
2
Sex
1280.602
1280.602
1
Age Group
5013.555
10027.110
2
Condition * Sex
196.883
393.767
2
Condition * Age Group
552.815
2211.261
4
Residual
151.971
75377.700
496
F-Value P-Value
.0001
3.322
.0001
16.773
.0039
8.427
.0001
32.990
.2747
1.296
.0062
3.638
ANOVA summary of condition effect and some interactions
for destination entry. The dependent variable is entry time.
Source
Subject (Sex, Age Group)
df Sum of Squares Mean Square F-Value P-Value
.0001
7036.963
225182.820
32
7.380
Condition
2
37178.876
18589.438
19.495
.0001
Sex
Age Group
1
2
17696.433
230400.068
17696.433
115200.034
18.559
120.814
.0001
.0001
Condition * Sex
2
3089.331
1544.665
1.620
.1990
Condition * Age Group
4
20026.051
5006.513
5.251
.0004
496
472950.268
953.529
Residual
88