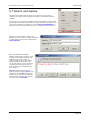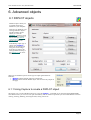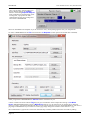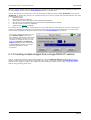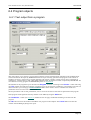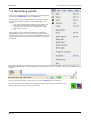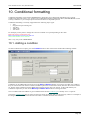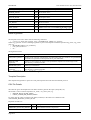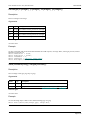
1
For help and support from OASYS Ltd please contact:
UK
Arup Group Ltd
The Arup Campus
Blythe Gate
Blythe Valley Park
Solihull
West Midlands
B90 8AE
United Kingdom
Tel:
+44 (0) 121 213 3399
Fax:
+44 (0) 121 213 3302
Email: [email protected]
Web: www.oasys-software.com/dyna
China
Arup
39/F-41/F
Huai Hai Plaza
Huai Hai Road (M)
Shanghai
China 200031
Tel:
+86 21 3118 8875
Fax:
+86 21 3118 8882
Email: [email protected]
Web: www.oasys-software.com/dyna/cn
India
Arup
Plot 39, Ananth Info Park
Opp. Oracle Campus
HiTec City
Madhapur Phase II
Hyderabad 500081
India
Tel:
+91 40 4436 9797/98
Email: [email protected]
Web: www.oasys-software.com/dyna
or contact your local Oasys Ltd distributor
LS-DYNA, LS-OPT and LS-PrePost are registered trademarks of Livermore Software Technology Corporation
User manual Version 12.0, October 2014
Preamble
Introduction
Development Status
Systems supported
Revision History
Text conventions used in this manual
1. Setting up and running REPORTER
1.1 Setting up REPORTER
1.2 Running REPORTER
1.3. A 1 minute introduction to REPORTER
2. Menu Layout
2.1 Basic menu layout
2.2 Mouse and keyboard usage for the screen-menu interface
2.3 Using the "file filter" boxes.
2.4 Log file
2.5 View Controls
2.6 Running a script file
2.7 Preferences
2.8 Program Locations (D3PLOT, PRIMER and T/HIS)
3. Opening and closing templates and reports
3.1 Creating a new template
3.2 Reading an existing template or report
3.3 Reading a library template
3.4 Saving a template
3.5 Saving a report
4. Inserting and editing pages
4.1 Adding a new page
4.2 Adding a new page from the library
4.3 Deleting pages
4.4 Duplicating pages
4.5 Reordering pages
4.6 Changing the current page
4.7 Changing the page properties
4.8 Inserting pages from file
4.9 Importing and exporting pages
4.10 Page masters
4.11Page Setup
4.12 Generating a single page
5. Inserting and editing simple objects
5.1 Using the Grid and Snap options
5.2 Setting line style, thickness, colour, and fill colour
5.3 Inserting basic shapes
5.4 Editing shapes, image, and text objects
5.5 Copying objects and using the clipboard
5.6 Reordering items on the page
5.7 Search and replace
5.8 Locking items
6. Advanced objects
6.1 D3PLOT objects
6.2 T/HIS objects
6.3 PRIMER objects
6.4 Program objects
6.5 File objects
6.6 Library objects
6.7 Table objects
6.8 Autotable objects
6.9 Script objects
6.10 Note objects
7. Generating and outputting reports
7.1 Effect of object order on generating a report.
7.2 Generating reports
7.3 Outputting a generated report
7.4 Combining output from multiple reports
8. Working with Variables
8.1 User defined variables
8.2 Predefined variables
8.3 Creating and editing variables
8.4 Creating a variable using an external program/script
8.5 Creating a variable using a FAST-TCF script
8.6 Creating a variable from the command line
8.7 Creating a variable from javascript
REPORTER
0.1
0.1
0.2
0.2
0.2
0.11
1.1
1.1
1.2
1.2
2.1
2.1
2.3
2.4
2.6
2.8
2.10
2.10
2.14
3.1
3.1
3.1
3.1
3.2
3.2
4.1
4.1
4.1
4.2
4.2
4.2
4.3
4.3
4.3
4.4
4.4
4.5
4.5
5.1
5.1
5.1
5.2
5.5
5.10
5.11
5.13
5.14
6.1
6.1
6.8
6.10
6.13
6.15
6.17
6.20
6.23
6.27
6.28
7.1
7.1
7.2
7.4
7.11
8.1
8.1
8.2
8.3
8.4
8.5
8.6
8.6
Page i
REPORTER
User manual Version 12.0, October 2014
8.8 Deleting a variable
8.9 Inserting a variable
8.10 Using variables in D3PLOT and T/HIS command files and FAST-TCF scripts.
8.11 Saving all the variables to a file after generating a report
8.12 Variable expressions
9. Hyperlinks
9.1 Adding basic hyperlinks
9.2 Adding hyperlinks in D3PLOT external data (blob) plots
10. Conditional formatting
10.1. Adding a condition
10.2. Condition types
11. Scripting
11.1 Example scripts
A. Command line arguments and oa_pref options
A.1 Command line arguments
A.2 oa_pref options
B. Library objects
B.1. Standard library programs
B.2. Standard library pages
B.3. Standard library images
B.4 Adding pages to the library
B.5 Adding scripts to the library
B.6 Adding images to the library
B.7 User defined library directories
B.8 Standard library templates
C. FAQ
C.1 Running REPORTER
C.2 Generating output
C.3 Extending REPORTER
C.4 Other questions
Answers
D. JavaScript class reference
global class
Colour class
File class
Image class
Item class
Page class
Reporter class
Template class
Window class
Variable class
E. Writing external programs/scripts
Returning variables from programs
Accessing existing variables in REPORTER
Example program: Extracting the smallest timesteps (Text output)
F. Unicode support
F.1 Output formats that support unicode
Installation organisation
Version 12.0 Installation structure
Page ii
8.6
8.7
8.10
8.11
8.11
9.1
9.1
9.1
10.1
10.1
10.3
11.1
11.1
A.1
A.1
A.2
B.1
B.1
B.4
B.5
B.6
B.7
B.8
B.9
B.10
C.1
C.1
C.1
C.1
C.1
C.1
D.1
D.2
D.7
D.18
D.32
D.41
D.45
D.48
D.52
D.64
D.72
E.1
E.1
E.1
E.3
F.1
F.1
G.1
G.1
User manual Version 12.0, October 2014
REPORTER
Preamble
Introduction
REPORTER is a tool to automate the post processing of LS-DYNA models. It allows you to create a standard template
for a report. With command files and scripts it links with D3PLOT, PRIMER, and T/HIS, and other programs to create
the necessary images and graphs when you come to generate an actual report from this template. It can also be run in
batch mode so that when a model has finished being analyzed a report can be automatically generated according to a
pre-built template.
Page 0.1
REPORTER
User manual Version 12.0, October 2014
Development Status
This manual documents the sixth release of REPORTER (12.0 with Oasys Ltd LS-DYNA Environment 12.0 ). The
code is still being developed.
Systems supported
REPORTER is available for Win32 and Linux (32 and 64 bit)
Revision History
Version 12.0
•
•
•
•
•
•
•
•
•
•
•
•
•
•
•
•
•
•
•
•
Circles and ellipses were not rendered correctly in pdf files. Now fixed.
Fixes bug 25848.
REPORTER could crash if a library image was inserted very near the top or right hand edge of a page. This has
been fixed.
Fixes bug 24988.
FAST-TCF objects did not use the job filename when generating. FAST-TCF would look in the directory for
the job. If there were multiple jobs in the same directory it could choose the wrong file. This has been fixed.
Fixes bug 24979.
Extra commands added to a D3PLOT capture which were longer than 80 characters did not work. This has been
fixed.
Fixes bug 24933.
Objects can now be locked on the page so they cannot accidentally be moved.
Enhancement 23503.
REPORTER will now prompt the user to replace variables in the macro after doing a capture in PRIMER. For
each matched text string you can choose whether to replace it with a variable or you can do "Yes to All" or "No
to All".
Enhancement 21309.
A new Batch() method has been added to JavaScript so scripts can test if REPORTER is running in batch mode.
Enhancement 23990.
A Duplicate method has been added to the Page class.
Enhancement 17602.
Static methods GetAll and GetFromName have been added to the Variable class.
Enhancement 22772.
Report hyperlinks can now have the form ’#page title’ to link to another page in the report.
Enhancement 22974.
A DeletePage() method has been added to the Template class in JavaScript.
Enhancement 22974.
A new EditVariables method has been added to the Template class so that a variables editing panel can be called
from JavaScript.
Enhancement 22387.
A System() method has been added to JavaScript.
Enhancement 15772.
Script objects can now be shown as a button in presentation mode. Clicking the button runs the script.
Enhancement 22387.
A single script object in a template can now be set to run automatically when the template is opened.
Enhancement 22387.
A new Window class has been added to JavaScript to enable standard dialogs to be used.
Enhancement 22387.
T/HIS objects can now be defined with a JavaScript instead of a FAST-TCF script.
Enhancement 22387.
New Page and Item classes have been added to JavaScript.
Enhancement 22387.
Library templates can now be opened directly from the File menu.
Enhancement 22387.
A File.Delete() method has been added.
Enhancement 22387.
Version 11.2
•
•
Less than signs (<) in text and textbox objects created corrupt pptx files. This has been fixed.
Fixes bug 24613.
If the Variable constructor was used to redefine an existing variable in a script REPORTER would give an error
Page 0.2
User manual Version 12.0, October 2014
REPORTER
if you tried to get any of the variable properties later in the script. This has been fixed.
Fixes bug 23586.
Version 11.1
•
•
•
•
•
If a D3PLOT object with multiple captures was updated again in D3PLOT to delete or replace captures
REPORTER could produce errors when generating or change the order of the captured images. This has been
fixed.
Fixes bug 22227.
If a D3PLOT object was made that had more than 20 captures and the template saved to file , REPORTER
would not be able to read the file again. This has been fixed.
Fixes bug 22226.
D3Plot objects using a command file (instead of capturing) did not work in version 11. This has been fixed.
Fixes bug 22147.
When saving old style T/HIS objects (i.e. using a command file instead of a FAST-TCF script) the command
file was not saved. This has been fixed.
Fixes bug 22117.
Opening the HTML manual did not work on Linux. This has been fixed.
Fixes bug 21989.
Version 11.0
•
•
•
•
•
•
•
•
•
•
•
•
•
•
•
When writing PowerPoint files REPORTER now correctly writes animated gifs.
Fixes enhancement 17601.
REPORTER could crash if you created a table that used a library program for a cell and you saved the output of
the program to a variable. This has been fixed.
Fixes bug 21346.
The library program which reported the LS-DYNA version and revision from the otf file did not work correctly
for new (R7) LS-DYNA output because there is now a new ’SVN Version’ line in the otf file. Additionally the
version and revision were expected to be to be a single ’word’. This has been fixed.
Fixes bug 21243.
Outlines were not written for Oasys Ltd. or File Image type objects to PowerPoints. Now added.
Fixes bug 21242
REPORTER would hang when reading a template file if one of the page titles in the file contained an ampersand
(&). This was because the ampersand was not escaped properly when writing the template. This has been fixed.
Fixes bug 21235
You can now specify an outline border for file image objects.
Fixes enhancement 18206
REPORTER can now use D3PLOT to generate multiple images in one session. The second and subsequent
images are automatically created as image file objects linked to the d3plot object.
Fixes enhancements 7777 and 13034
A JavaScript can now be run for D3PLOT and PRIMER objects.
Fixes enhancement 15550
When capturing an image from D3PLOT, REPORTER now automatically shows the images.
Fixes enhancements 7779 and 10668.
A new PRIMER object has been added.
Fixes enhancements 8095 and 16530
REPORTER can now write PowerPoint pptx files directly.
Fixes enhancement 11858
REPORTER can now combine multiple reports into a single pptx/pdf/html.
Fixes enhancements 7712, 8956, 9020 and 10742
REPORTER could think that a script had changed when cancelling from the editor if the script was created on
windows but edited on unix.
Fixes bug 7769
When writing a pdf file jpeg images are now written as jpegs rather than pngs as they can be much smaller.
Fixes enhancement 17920
Added the ability to see the item generation order.
Fixes enhancement 18489
Version 10.2
•
•
•
REPORTER did not automatically change LS-DYNA filenames from h3hsp to %DEFAULT_JOB%.otf (and
visa-versa) when importing a library page. This has been fixed.
Fixes bug 19200
REPORTER could crash when writing a pdf file that had overflow pages in an auto-table if there was an error
when the report was generated. This has been fixed.
Fixes bug 19197
The "cropping" button was the default focus in the D3Plot object edit menu (i.e. was applied when hitting enter)
rather than the "OK" button. This has been fixed.
Page 0.3
REPORTER
•
•
User manual Version 12.0, October 2014
Fixes bug 19113
REPORTER was not able to create and import image files which were not JPEG when generating a D3Plot
captured object. This has been fixed.
Fixes bug 18403
REPORTER could crash if the user added a page to the reporter_library/pages area which contained certain
REPORTER items. This has been fixed.
Fixes bug 18432
Version 10.1
•
•
If the page layout is changed from landscape to portrait or visa versa any items that are off the page are
automatically moved to stay on the page
Fixes bug 14307
If multiple conditional formatting conditions were set for a table, autotable, textbox or file object background,
then REPORTER would display the last condition matched rather than the first one. This has been corrected.
Fixes bug 17794
Version 10.0
•
•
•
•
•
•
•
•
•
•
•
•
•
•
•
•
•
•
•
•
•
•
•
•
•
Added the -loghtml command line options to allow the log file to be saved as html instead of plain text.
Added a Templates tab to preferences to allow the user to change whether existing files should be overwritten
when generating images for multiple pages in T/HIS. This is saved as a property of each template
Added the -iconise and -oasys_batch command line options
Checkbox for turning on/off error checking during generation when an error was found was not working
correctly.
Fixes bug 15143
Added the ability to set the format of a variable on the variable edit panel.
Closes enhancement 8819.
Fixed problem with rounding errors on spinbox input values on edit panels.
Fixes bug 15548.
When resizing/moving a table object, the relative width/height of the columns/rows is now maintained.
Closes enhancement 15546.
Added a new library script for reading variables from a CSV file.
Closes enhancement 15476.
The "P" key can now be used to swap between design view and presentation view.
Closes enhancement 9333.
"Fit page" is now the default zoom level when opening a file.
Closes enhancement 13863.
Added the ability to use the control key plus the mouse scroll wheel to zoom in and out of the page.
Closes enhancement 15516.
Added the ability to distribute selected items evenly horizontally or vertically either to the page or within the
currently selected items.
Closes enhancement 15509.
Added the ability to align items to the top/bottom/left/right of the the page.
Closes enhancement 9300.
You can now specify an outline border for Oasys Ltd. image objects.
Closes enhancement 15503.
The escape key can now be used to deselect any selected objects. It is still used to quit out of fullscreen mode.
Closes enhancement 15530.
The total number of pages in the document is now displayed at the top of the window.
Closes enhancement 15513.
Added preferences to allow the user to specify the format of the default DATE and TIME variables.
Closes enhancement 15529.
Modified the default variable DATE so that it just shows the date rather than the date and time. A new default
variable TIME has been added
Closes enhancement 15453.
The maximum number of pixels you can crop off an image edge has been increased from 1000 to 10000.
Closes enhancement 15451.
Textboxes were not copied when duplicating a page. This has been fixed.
Fixes bug 15441.
Added the ability to write the output of a library program to a variable.
Closes enhancement 9031.
Added the ability to align multiple objects together. Option are left, centre, right, top, middle or bottom.
Closes enhancement 9300.
Added the ability to select multiple objects on a page. Multiple objects can be dragged, cut/copied/pasted,
saved/imported, generated, resized etc.
Closes enhancements 8980, 9106, 9300.
Added the ability to format a variable. For example if a number, how many decimal places.
Closes enhancement 13867.
The text on the status bar could get overwritten during generation of items. Now fixed.
Page 0.4
User manual Version 12.0, October 2014
•
•
•
REPORTER
Fixes bug 14230.
Setting the background colour of various object types via conditional formatting has been added.
Closes enhancement 9026.
It is now possible to set the background colour of cells in tables.
Closes enhancement 15319.
A note object has been added for adding notes to the design view of a report.
Closes enhancement 13825 .
Version 9.4.2
•
•
" Hyperlinks for HTML files are now converted to relative links.
Fixes bug 16138.
If you inserted a normal program into a template by selecting the program tool and dragging an area Reporter
would think that the object was a library program, not a ’normal’ program.
Fixes bug 15133.
Version 9.4
•
•
•
•
•
•
•
•
•
•
•
•
•
•
•
•
•
•
Reporter could crash when accessing variables after using the JavaScript method Template.GetVariableValue()
with a variable name that did not exist in the template.
Fixes bug 14347.
If a job file was selected before doing a capture for a T/HIS object REPORTER would not try to substitute
DEFAULT_DIR (and other variables) in the filename. Now fixed.
Fixes bug 14329.
If you modified an items outline, fill or text colour or modified its line thickness or style this did not flag the
template as requiring a save. This has now been fixed.
Additionally templates which require saving are now marked with a * in the window title.
Fixes bug 13960.
Exiting from REPORTER using File->close and using the top right window close button now gives the same
error message and options to save any modified templates. Previously the messages were different and this
caused confusion to some users.
Fixes bug 13430.
D3PLOT objects with multiple filenames would not work if one (or more) of the filenames contained spaces.
This was due to a bug in D3PLOT. Now fixed.
Fixes bug 12409.
When writing PowerPoint output blank table cells were given the default font size by PowerPoint. As this is very
large it caused the table row to be larger.
Fixes bug 13874.
User defined script directories can now be defined by using the library_directory preference. This allows users to
add their own library scripts if REPORTER is installed in a read only location.
Closes enhancement 13503.
If a library program is added it is now possible to set the font, size, style and justification in the menu.
Additionally if you edit an existing library program this menu is now used instead of the ’normal’ program menu.
When generating a report more feedback is now given in the status bar so you know what REPORTER is doing
(e.g. running a D3PLOT object in background).
Closes enhancement 13888.
Report generation can now be stopped at any point by a new ’Stop’ button in the status bar.
Closes enhancements 10708 and 11271.
D3PLOT and T/HIS can now be run from REPORTER without any windows being mapped by either giving the
-batch command line option to REPORTER or by setting the batch mode checkbox in File->Program locations.
Additionally REPORTER can be minimised during report generation so you can use other programs.
Closes enhancement 10709.
HTML output has been improved for tables. Previously cell heights could be too high on Internet Explorer and
additionally text that was too big for a cell was not cropped.
Fixes bug 13846.
Once a ’Capture’ has been done for D3PLOT or FAST-TCF objects the ’Capture’ button is changed to say
’Update capture’ as it was not clear that pressing the button again would allow you to change the existing capture
rather than starting again from scratch.
Closes enhancement 13757.
PowerPoint output could sometimes only be done once for each Reporter session.
Now fixed.
Fixes bug 13873.
Page ranges set by the user in the printer dialog were ignored and the whole report was printed. Now fixed.
Fixes bug 13887.
The Hyperlink dock box was not mapped correctly when a hyperlink was clicked. A similar problem occurred
with the ’master page’ dock box.
Fixes bug 13827.
Clicking on a hyperlink that referred to a non-existant report could crash Reporter.
Fixes bug 13836.
PDF output for table cells was not cropped if it was too large for the cell.
Page 0.5
REPORTER
•
•
•
•
•
User manual Version 12.0, October 2014
Fixes bug 13883.
If you edited an existing FAST-TCF object that used variables somewhere in the script and you pressed capture
to change the script REPORTER prompted you to try to replace text with variables in the new script but no
replacements were done. Now been fixed.
Fixes bug 13833.
Image cropping has been added for Image, ImageFile, D3PLOT and Fast-tcf objects.
Closes enhancement 12854.
Text wrapping, border style, border colour and background colour have been added to the textfile object.
Closes enhancement 8631.
A new text colour button has been added to the Style toolbox to change the colour of text (previously the outline
colour button changed the colour of text). This was necessary as the new textbox objects have fill colour, border
colour and text colour.
A new textbox object has been added to Reporter.
Closes enhancements 9107, 7800 and 3881.
Version 9.3.1
•
•
•
•
•
•
•
•
•
•
•
•
•
•
•
•
•
Visual basic output did not work on windows for text file items that had more than one line of text. Now fixed.
Fixes bug 13165.
Images for advanced objects in HTML output were scaled incorrectly. Now fixed.
Fixes bug 13159.
Reporter now shows files with extension .pptx as well as extension .ppt when writing PowerPoint files.
Writing text objects to a PowerPoint file did not work correctly with PowerPoint 2007 (the text was written with
a single letter on each line). Additionally:
• File objects had a black background if a visual basic macro from Reporter was read into PowerPoint
2007.
• Justification of text objects was not correct if a visual basic macro from Reporter was read into
PowerPoint 2007.
• Tables had the wrong border and background colours in PowerPoint 2007.
• The colour of some lines could be incorrect in PowerPoint 2007.
Now fixed.
Fixes bugs 13022 and 13138.
Output from writing text objects to a Powerpoint file and to a visual basic macro could be inconsistent. The
textboxes produced when writing a PowerPoint file directly were not resized to fit the text, and textboxes
produced from a visual basic macro would have different margins to those produced when writing a PowerPoint
file directly. This is now fixed.
Reporter would not play a d3plot command file with ’button click’ data correctly. The button click data would be
stripped from the command file and the commands treated as dialogue commands. Now fixed.
Fixes bug 13027.
In an automatically generated table column text entries containing variables would not generate correctly (the
variable would be replaced by a blank string) if the variable name was in lower case. Now fixed.
Fixes bug 12995.
On some platforms when generating a report, a warning message from T/HIS and D3PLOT could be passed to
REPORTER in two or more chunks (it should be passed to reporter as a single string). REPORTER would
mistakenly think that the second and subsequent chunks were error messages and try to alert the user that an
error occured. This has now been fixed.
Fixes bug 12738.
If a library object failed to generate properly (e.g. if the otf filename was incorrect) then the next time that
Reporter generated the report you could get ’Cannot get File data in File destructor’ errors. This has been fixed.
Fixes bug 12629.
When writing tables to powerpoint directly or writing a visual basic macro, the colour and width of table borders
was ignored. Now fixed.
Fixes bug 12733.
The -maximise command line option and maximise oa_pref option did not work correctly on some screens. This
has now been fixed.
Fixes bug 12941.
The hostname library script would fail if the hostname of the machine contained a hyphen (-).
Fixes bug 12413.
When drawing a polygon with the image.Polygon() function you could not define the line colour as ’none’ (it
always gave a black outline). This has now been fixed.
Fixes bug 9585.
If you edited a normal table after generating program data in any of the cells the program output was lost during
the edit. This has now been fixed.
Fixes bug 12348.
If you saved output to html (or vba, pdf) and the file existed you were asked twice if you wanted to overwrite it.
Fixes bug 12428.
Variable expressions were not correctly evaluated when used in text. Instead of the variable value being
evaluated the entire string was evaluated which could sometimes mean that the expression could not be
evaluated correctly. This has now been fixed.
Fixes bug 12347.
Powerpoint output was incorrect for several object types:
Page 0.6
User manual Version 12.0, October 2014
REPORTER
• Bold, italic and underlined text was shown as normal text.
• Arrowheads were not drawn on arrows.
• Rectangles and ovals without fill were still drawn with fill.
• Dashed and dotted lines were drawn as solid lines.
• Autotable cells could have the wrong font style and justification.
This has now been fixed.
Fixes bug 12433.
Version 9.3 (October 2008)
•
•
•
•
•
•
•
•
•
•
•
•
•
•
•
•
•
•
•
•
When doing conditional formatting the default font for each condition is now the same as the existing font before
you asked for conditions (so for example you have to change only the colour). Previously the defult font was
always 10pt Courier. Closes enhancement 11906.
If you double click on a variable in the Edit variable menu it now edits the variable. Closes enhancement 11904.
In design mode, programs that use library scripts now have %REPORTER_HOME%/reporter_library/scripts
removed from the beginning of the text that is shown on the object so it is easier to see what the program is.
Fixes bug 7701.
A library script has been added to read a reporter variables file. Closes enhancement 11902.
Printing did not work for autotable objects. This has now been fixed. Fixes bug 11848
The library directory for Reporter has been renamed to ’reporter_library’. Existing scripts which use ’library’ will
be modified when Reporter reads the file.
In the menu that is mapped when the user right clicks on an object, Edit and Delete were next to each other.
Occasionally people pressed Delete by mistake. A space has been added to the menu either side of the Delete
button to make it harder to delete the object by accident. Fixes bug 11332.
When the dyna filetype preference was changed in Reporter it did not change the filetypes for any existing
objects in the template.
Additionally, when opening a template, if the preference was set to the Oasys Ltd. filetypes, Reporter would
silently change any ’d3hsp’, ’d3thdt’ and ’d3plot’ definitions to ’%DEFAULT_JOB.otf’, ’%DEFAULT_JOB.thf’
and ’%DEFAULT_JOB.ptf’ and there was no way to undo this change.
Now if you change the preference interactively Reporter looks to see if any filenames need updating. If they do
then it asks you if you want to change them.
Similarly, if you read a template Reporter checks and asks you if you want to change them. However, this is not
done if the batch option has been set.
Fixes bugs 9782, 10613 and 11438.
Library scripts which retrieve data from the end otf file have been made significantly quicker. Fixes bug 9479
It is now possible to have D3PLOT and FAST-TCF objects that do not return images to REPORTER. Fixes
bugs 9028 and 9108.
A new ’Expression’ variable type has been added that allows user to do simple maths with variables. e.g.
(%THREE%+%ONE)*%THREE%/%TWO%. In fact it will evaluate the expression as a JavaScript expression
so Math.sqrt(), Math.sin() etc are also available. Fixes bugs 9010, 9017 and 9111.
After reading in a template, Reporter now shows the first page, not the last page. Fixes bug 9006.
All dialog boxes in Reporter now have a maximise button to make them easier to resize if they need to be made
bigger (e.g. if editing a FAST-TCF object). Fixes bug 8793
Normal table objects have now been added to Reporter. Closes enhancements 7233, 7703 and 7704.
Postscript output has been removed from Reporter for version 9.3. Use pdf output instead.
Added File.Mkdir() method to create a directory.
Added File.APPEND constant to enable appending to files.
Library scripts in tables did not work if there was a space in the installation directory of Reporter. Additionally
any variables that were used as arguments would not have been expanded correctly (they would get the value
from the current template instead of the value from the reporter_variables file). Fixes bug 9451.
Added pdf_image_downsample, pdf_image_downsample_resolution and pdf_image_downsample_threshold
preferences to allow image downsampling when writing pdf files.
Added use_file_vars preference to enable filenames returned from D3PLOT and T/HIS to be replaced with
directory/file variables automatically if they match
Version 9.2.3 [Build 36] (21/11/2006)
•
•
•
•
•
•
•
•
Reporter would create a corrupt pdf file if a page contained a zero size image. This has now been fixed. Fixes
bug 9315
If special characters like > and < were used in a condition name Reporter could not read the template file. Now
fixed. Fixes bug 9220.
Fixed problem with text in pdf files not printing properly on some printers. Fixes bugs 9134 and 9212.
The output from a table can now be written to a CSV file during generation. Closes enhancement 9133.
Reporter now gives the user the ability to stop report generation if an error occurs. Closes enhancement 9126.
Some objects with a line colour and/or fill colour of none were not being rendered properly (black was used
instead). This has now been fixed. Fixes bug 9081.
Reporter would get the start in directory wrong for T/HIS and D3PLOT if there was a single jobfile that
contained spaces. This could cause T/HIS to crash. This has now been fixed. Fixes bug 9038.
Library scripts could not be used as table items (an error occured when they were run). This has now been fixed.
Fixes bug 9024.
Page 0.7
REPORTER
•
•
•
•
•
•
User manual Version 12.0, October 2014
It is now possible to generate a single page of a report. Closes enhancement 9011.
Powerpoint could be left open after writing a powerpoint file. This would happen if the -exit command line
argument was given after the -ppt argument. This has now been fixed. Additionally Powerpoint will now not be
closed if there is an existing presentation open in Powerpoint. Fixes bug 8998.
The extension orp was not automatically appended when exporting a page (if the filename has no extension). It is
now added if required. Additionally ps is added for postscript, pdf for Acrobat, htm for HTML (html on unix),
bas for Visual basic macros, and ppt for Powerpoint. Fixes bug 8988.
If a library page (e.g. checking page) was inserted into a template and the Oasys Ltd. filenaming scheme was
used (file.thf instead of d3thdt etc.) the objects would not generate properly as they referred to d3thdt, d3hsp etc.
This has now been fixed. Fixes bug 8954.
Reporter is now more intelligent when pasting multiple copies of an item. Additionally the pasted item is now
selected. Fixes bug 8861.
On Solaris 10 it was possible what errors when generating T/HIS objects did not get logged properly. This meant
that sometimes the user was not notified that an error occured. This has now been fixed. Fixes bug 8487.
Version 9.2.1 [Build 35] (26/7/2006)
•
•
•
•
•
•
•
•
Switching between templates on HP unix machines caused Reporter to get stuck in a loop refreshing the screen
until the mouse was moved out of the template. This has now been fixed
Multiple spaces in arguments to external programs were simplified to a single space. This was incorrect and has
now been fixed. Fixes bug 8857.
Recapturing from T/HIS could fail if there were multiple models. This has now been fixed. Fixes bug 8842.
When capturing from D3PLOT and T/HIS on Windows sometimes DEFAULT_DIR was not replaced in the
filename. This occured if slashes (/ or \) did not match between the variable and filename. Now fixed.
Additionally, now if DEFAULT_DIR does not match REPORTER will try to use other Directory variables to
match. Fixes bugs 8314 and 8758.
Compounded variables (i.e. variables that contained variables) did not expand correctly. Now fixed. Fixes bug
8669.
Arguments to an external program which used variables that contained spaces would not be passed to the
program correctly. Now fixed. Fixes bug 8666.
Brackets (,),[,],{,} and slashes \,/ in arguments to an external program could cause Reporter to hang. Now fixed.
Fixes bug 8665.
Fixed bug that caused spurious pages to be created when a page was duplicated. Fixes bug 8716.
Version 9.2 [Build 34] (24/5/2006)
•
•
•
•
•
•
•
•
•
•
Fixed bug that caused the current page number on a master page to be incorrect when printing. Fixes bug 8628.
Fixed bug that caused corrupt pdf output if there were images on the master page. Fixes bug 8629.
Fixed problems with missing output from running external programs
Adding a new page while an object was selected would erroneously leave the selection handles drawn on the
new page. Now fixed. Fixes bug 8530.
Fix problem in javascript File class that caused errors in File destructor.
Output from T/HIS and D3PLOT was not written to the logfile for Solaris 10. Now fixed.
Errors and warnings from D3PLOT and T/HIS are now fed to REPORTER via stderr so they now correctly
come through as errors and REPORTER is aware of them.
The log window is now raised when it is mapped as previously it could get lost behind the main window.
Hyperlink rectangle produced in pdf files for text objects with hyperlinks is now correct if the text object used
variables. Fixes bug 8405.
Objects that are not visible are now not selectable. Fixes bug 8404.
Version 9.2 Beta 4 [Build 33] (4/4/2006)
•
•
•
•
•
•
•
Fix problem with centre justified text in HTML (it was not positioned correctly as the style was incorrect).
Hyperlinks from objects other than tables containing variables now work correctly.
Hyperlinks now open a report in presentation mode (this was broken in an earlier release).
Output from program items with hyperlinks is now correctly written when writing a report.
Cursor used when hovering over hyperlinks is now correct on Windows
Replacing subsequent variables in table cell contents and hyperlinks would fail if the first variable in the text did
not exist. This is now fixed.
Fixed JavaScript compiling problems on SGI that caused crashes.
Version 9.2 Beta 3 [Build 30] (20/2/2006)
•
•
•
•
Add unicode support for writing pdf files. Partially fixes enhancement 7799 (no ps support yet). Unicode
characters can be used in text objects and table headers.
Add ability for capturing from T/HIS to read a cvs file. As no jobfile is returned N/A is shown. Fixes bug 8151.
D3Plot objects can now use multiple models and/or windows. When using capture new models can be opened.
When you return to Reporter all of the models and windows are remembered. Fixes enhancement 7237.
Object coordinates can now be specified by using 2 corners or by using a corner and width/height. This can be
Page 0.8
User manual Version 12.0, October 2014
•
•
•
•
•
•
•
•
•
•
•
•
•
•
•
•
•
•
•
•
•
•
•
•
•
•
•
•
•
•
•
•
•
•
•
•
•
•
•
•
•
•
REPORTER
set by a preference. Fixes enhancement 7811.
You can now search and replace strings in objects. Fixes enhancement 7820.
Text items can now be vertically justified as well as horizontally. This should help line up output from text items
and program items. Fixes enhancement 7812.
D3PLOT and T/HIS are now passed the ’-maximise’ command line argument to ensure that they are full screen.
The FAST-TCF and T/HIS tools are now combined into one tool as people found having two tools confusing.
Fixes enhancement 7818.
Reporter now has different cursors depending on which tool is used. Fixes enhancement 7817.
Variables can now be given a type to help manage/distinguish them.
File and directory variables can now be browsed for. Fixes dynatrack cases 7688 and 6857.
You can now find and loop over all the warnings and errors written to the logfile.
If an error occurs when generating Reporter now shows a dialog box to tell the use and gives the ability to show
the error. Fixes bug 7771
Added this changelog to the help menu in Reporter.
Added ability to create, drag etc in presentation mode. Fixes dynatrack bug 7766.
Added ’hand’ tool to presentation view which allows you to follow hyperlinks etc.
Added a ’write Report’ option in the file menu to make saving as a report easier (previously you had to do
SaveAs and change filetype). Fixes enhancement 7778.
Reporter now remembers the directory from the last file you selected and uses that as the start directory for the
next file selection. Fixes enhancement 7714.
Added powerpoint size as a page size. Fixes enhancement 7709.
Existing bitmaps are now deleted before generating advanced objects. This is to guard against picking up old
data by mistake. Fixes enhancement 7772.
Variables now have their own menu. Fixes enhancement 7819.
Variables are now saved by default when generating. Fixes enhancement 7687.
Now gives an error if a save did not work because a file or directory is write protected.
Automatically replace job names with DEFAULT_DIR and DEFAULT_JOB when capturing. Can be turned off
with a preference. Fixes enhancement 7657.
A default size is now given to an object if the user doesn’t drag when creating an object. This size can be set with
an oa_pref option. Fixes enhancement 7696.
CURRENT_PAGE variable now works correctly on a master page when writing pdf, vba and ppt. Fixes bug
7892
Colour buttons now set correctly for WindowsXP style in Colour Dialog. Fixes bug 7647
Added conditional formatting for textfile objects. Fixes bug 7606
Shift and Ctrl keys now constrain lines, arrows, rectangles and ellipses when dragging. Fixes bug 7733
version.js script bug fixed. Fixes bug 7695.
The initial text properties are now set correctly for text file items. Fixes bugs 7647 and 7605.
LSTC/OASYS Ltd. filenaming can now be set as a preference. Fixes bug 7692 and enhancement 7630
Images are now embedded when saving as a report. Fixes bug 7660.
Online manual now linked to Reporter from Help menu
Reporter now prompts you to save a template before closing if any changes have been made
Variables can now be used in condition values
When the mouse enters the report you now get the keyboard focus
-log= argument now works.
bug fix 7774. Reporter now traps template files that don’t exist on the command line and skips remaining
arguments but does not skip -exit or -log= so it doesn’t hang
Change name to Reporter.
Unicode support added for text object strings (no postscript or pdf support)
The -generate command line option now always generates the report. Previously it only generated in design
mode. This meant that if you opened a report you could not generate it (as it is opened in presentation mode)
’\’ characters in filenames etc are now converted to ’/’ characters on unix machines.
Change logic for multiple models in T-HIS to that Presenter passes the directory of the first model as the
-start_in argument.
Added us-ncap.js library script to plot US-NCAP graph
Added fontAngle and fontJustify properties to javascript Image class to give more control of text rendering
Version 9.2 [Build 21] (14/11/2005)
•
•
•
•
•
•
•
•
•
•
Added maximise preference for Presenter
Presenter now reads the start_in and vba_directory preferences
Presenter now picks up variables from T-HIS correctly when there are multiple analyses
In the variables dialog the whole row is now highlighted when you select a variable instead of just the first
column.
When adding a library program Presenter now checks to see if any compulsory arguments are missing.
When a new file is created a new page is now automatically started.
Added more error checking to data_file_from_variables.js script (bug fix 7635)
Added LogPrint, LogWarning and LogError methods to global javascript object
Added File->close option (was previously under Window->close but obviously people expect it to be under the
file menu! (bug fix 7637)
If you change drawing mode when in presentation mode you are now automatically taken back to design mode
(bug fix 7636)
Page 0.9
REPORTER
•
•
•
•
•
•
•
•
•
•
•
•
•
•
•
•
•
•
•
•
•
•
•
•
•
•
•
•
•
•
•
•
•
•
•
•
•
•
•
•
•
•
•
•
•
•
•
•
•
•
•
•
User manual Version 12.0, October 2014
If you right click on an object when in any drawing mode you will change to select mode, select the item and
map the popup menu (bug fix 7634).
Added ability to reorder pages (enhancement 7571)
Variable values and descriptions are now escaped properly when saving so special characters can be used (&,<,>
etc)
When capturing a FAST-TCF script, if the job file is not empty it is read into T/HIS (previously it was only
done if there was a script as well)
When you edit a text item a crosshair is now shown at the point the text is justified to
If you paste an item on the same page it is now offset from the original by the nudge distance so it is obvious to
the user that a new item has been pasted. If you paste into a different page or template it will be placed in the
original position
Right clicking on the page when you do not have a selected item now gives you the option to paste an item at
that location (if you have copied or cut an item previously)
Table items can now be written directly to PowerPoint
Table items can now be written to vba
Add -ppt command line option to write powerpoint files
Subroutines in visual basic macros written by Presenter are now automatically split if necessary to keep them
below the 64k limit for VBA (previously there was one Subroutine per page)
If a table with overflow pages is read from a report, the overflow pages are now correctly displayed. Previously
you would have to regenerate or edit the table.
Added support for multiple models for T-HIS and Fasttcf scripts
PRESENTER_DEFAULT_DIR is now set to the user home directory instead of the temp directory when
starting. Setting it to the temp directory caused lots of problems (e.g. the next time you start Presenter that
directory probably won’t exist!)
New library script added to create D3Plot data files from csv file
Bug fix. When dragging new items they were sometimes not drawn properly (Presenter thought that they were
off the screen when they were not)
Dragging a new item is now double buffered so you don’t get flicker
New library script added to create D3Plot data files from variables file
Presenter now tries to preserve variables in FAST-TCF scripts when the user uses the capture feature to update
the script.
If user does not type extension when saving file ’.opt’ is now automatically added to the filename.
Added Ctrl+V shortcut for Paste item
Bug fix. When you save a template using SaveAs the template name is now updated after the save to the new
name
Bug fix. When a report was generated the template could lose the keyboard focus so PgUp, PgDown etc did not
work properly.
Bug fix. Presenter crashed when double clicking on page if in line, arrow mode etc
Add ability to load and save fasttcf scripts from editing panel
Added next page and previous page to Page menu
Added window menu with window list, tile, cascade etc
When a file is opened or a new file is created it now appears maximised instead of a window
Fixed bugs in page setup dialog (not initialised properly for some page sizes and orientations)
Fixed bugs when writing advanced item images to vba and ppt. They were not sized correctly
Fixed bug that caused Presenter to crash on windows when paging up/down and selecting items
Changed comments.js script so that newlines are added correctly.
Revise and fix javascript destrructor and garbage collection problems
Add javascript method Close to template object
Add ability to include debug information in logfile from D3Plot and T/HIS
Bug fix 7218. Printing advanced items positioned them incorrectly
Add Star method to Image class
Add ability to change linecap and linejoin styles in Image class
Added Polygon, Polyline and Fill methods to Image class
T/HIS is now called with display=X instead of display=batch so that FAST-TCF works correctly
Bug fix 6841. When changing the visibility of items by using the checkboxes in the view menu the template did
not update immediately. It now does.
Bug fix 6948. Presenter could crash when inserting an image if it was close to the edge of the page. Now fixed.
Bug fix 6950. If a keyword file/otf file did not have a title the scripts to return the title returned an empty string.
Some people thought that the script was not working. If there is no title the scripts now return ’no title’
Bug fix 6953. Scripts containing errors caused Presenter to crash on linux.
Bug fix 6954. Insert Variable dialog box was being mapped with the ’Save variables’ buttons from the
File->variables dialog box. Now removed. Additionally, I have changed the dialog caption to something more
sensible.
Bug fix 6957. When duplicating a page image items did not get duplicated.
Builds now automatically add the date compiled (which is shown in the help about dialog box)
Bug fix. total_mass.js did not work. Now fixed.
Add overflow pages for automatically generated tables which have too many rows to fit on one page (in the area
allocated to the table) Currently works for drawing, printing, postscript, html and pdf
Add direct PowerPoint output for windows version
Write JavaScript API documentation
Bug fix 6655. Scripts could run very slowly on Windows machines but very quickly on HP workstations. This
Page 0.10
User manual Version 12.0, October 2014
REPORTER
•
was because the script i/o was written using the C++ standard library. It has been rewritten in C and is now
significantly faster.
The variable PRESENTER_DEFAULT_DIR is now initially set to the same value as PRESENTER_TEMP
when creating a new template. This is so that if you capture from D3Plot or T/HIS the images you create are put
in a sensible location until you change PRESENTER_DEFAULT_DIR to whatever value you want.
FlexLM licensing has now been added to Presenter. The dll lmgr9a.dll must be given out and put in the same
directory as the executable for windows.
You can now change the script used in T/HIS when capturing. If you press ’Capture...’ for a second time. T/HIS
will replay the FAST-TCF script and you can then update as required an resave.
Enhancement 6508. You can now edit the command file used in D3Plot when capturing. Additionally you can
now change the settings that D3Plot creates. If you press ’Capture...’ again D3Plot will now replay the settings
and properties file and you can then update as required and resave.
Bug fix 6688. Right clicking on an object when in presentation mode and anything other than select mode
caused Presenter to crash. This has been fixed.
Bug fix 6654. When capturing from D3Plot, if the image file was longer than 80 characters, Presenter would not
correctly write the command file. This has now been fixed.
Bug fix 6653. If a library javascript file was missing Presenter could crash. Presenter will now write an error to
the logfile window
Comment lines in oa_pref files are now correctly skipped
Added this ChangeLog
Initial internal releases of Reporter.
•
•
•
•
•
•
•
•
•
Version 9.0
Build
Date
Description
0 - 0.9
1.0
Initial internal releases of REPORTER
November 2003
First release
Text conventions used in this manual
Typefaces
Four different typfaces are used in this manual:
Manual Text
This typeface is used for text in this manual
Computer type
This one is used to show what the computer types.
Operator type
This is used to show what you must type
Button text
This is used for screen menu buttons and headings
Page 0.11
REPORTER
Page 0.12
User manual Version 12.0, October 2014
User manual Version 12.0, October 2014
REPORTER
1. Setting up and running REPORTER
1.1 Setting up REPORTER
1.1.1 Prerequisites
Oasys Ltd LS-DYNA Environment software
You should already have the standard Oasys Ltd LS-DYNA Environment software T/HIS (including FAST-TCF) and
D3PLOT installed, and have flexlm licenses for the software.
The folders that the Oasys Ltd LS-DYNA Environment software is installed in must not have any special characters in
folder names (e.g. &, !, ~, ’, "). Just use letters, numbers spaces and underscores for folder names.
e.g. the following example is invalid: C:\Program Files\Ove Arup & Partners\Oasys11
this is valid: C:\Program Files\Ove Arup\Oasys11
1.1.2 REPORTER installation - Win32
How to install REPORTER on windows.
Installing files
Double click on the Oasys Ltd LS-DYNA Environment setup file (.exe file) to run it. REPORTER should then install
and be ready to run. The installation process should automatically associate .ort and .orr files with REPORTER so you
can double click on them to read the files in REPORTER.For further details please see the instalation guide.
Flexlm and licensing
REPORTER uses Flexlm licensing. For REPORTER to run you must have a valid license for REPORTER or
alternatively a license for D3PLOT, PRIMER or T/HIS.
Problems
If REPORTER does not run then check the following.
1.
Do you have a license to run REPORTER? If not contact Oasys Ltd.
2.
Do you have D3PLOT and T/HIS installed?
3.
Do you have licenses for D3PLOT and T/HIS?
1.1.3 REPORTER installation - Linux
How to install REPORTER on Linux. This is only a brief guide
Installing files
Run the setup program that comes with Oasys Ltd LS-DYNA Environment11.0 . This will install REPORTER in the
Oasys11directory. For further details please see the installation guide.
Flexlm and licensing
REPORTER uses Flexlm licensing. For REPORTER to run you must have a valid license for REPORTER or
alternatively a license for D3PLOT, PRIMER or T/HIS.
Page 1.1
REPORTER
User manual Version 12.0, October 2014
Problems
If REPORTER does not run then check the following.
1.
Do you have a license to run REPORTER? If not contact Oasys Ltd.
2.
Do you have D3PLOT and T/HIS installed?
3.
Do you have licenses for D3PLOT and T/HIS.
1.2 Running REPORTER
REPORTER is run by selecting the REPORTER button menu of the Oasys Ltd shell.
Alternatively, you can right click on the button to give starting options for REPORTER.
1.3. A 1 minute introduction to REPORTER
REPORTER is designed to help you post-process analyses automatically. The idea is that you create a template which
contains the intructions or ’recipe’ for how to process an analysis. When you run REPORTER on an analysis, it takes
this template, applies it to the analysis and creates a report which you can save in HTML, pdf etc.
For example you may want to run a set of standard checks on an analysis after it has run to check that the analysis
teminated normally, there was not too much added mass, the energy balance is OK etc. You would create a checking
template in REPORTER and then this would be applied to each analysis you want to check.
A summary of the steps required to make a template is:
1.
Start REPORTER. See Running REPORTER for more details.
2.
Create a template. See Creating a new template for more details.
3.
Create pages (and/or a master page) if required. See Inserting and editing pages for more details.
4.
Add objects on to pages. These can be simple things such as lines, text etc or advanced things like D3PLOT or
Page 1.2
User manual Version 12.0, October 2014
5.
6.
REPORTER
T/HIS objects. See Inserting and editing simple objects and Advanced objects for more details.
Use variables to make the template generic. See Working with Variables for more details.
Save the template. See Saving a template for more details.
Once you have created a template you can apply it to analyses as many times as you want.
1.
Start REPORTER . See Running REPORTER for more details.
2.
Open the template. See Opening a template for more details.
3.
Set the current analysis variable(s). See User defined variables for more details.
4.
Generate the report. See Generating reports for more details.
5.
Create output such as report, HTML, pdf etc. See Outputting a generated report for more details.
Page 1.3
REPORTER
Page 1.4
User manual Version 12.0, October 2014
User manual Version 12.0, October 2014
REPORTER
2. Menu Layout
2.1 Basic menu layout
REPORTER runs with in a single window, owned by the window manager. A typical REPORTER session will look
like this
Within this main window there are a number of sections
• "Menu Bar" Access to the main pull down menus.
• "File toolbar" toolbar for opening, saving, and creating report template.
• "View toolbar" toolbar for changing the view.
• "Design" toolbar to switch between the presentation and design view.
• "Style" toolbar to modify the line type, colour, etc of objects in the report.
• "Tools" toolbar for creating and editing shapes and advanced objects.
• "Main Report Area" Main working area.
File toolbar
The file toolbar gives a quick way to create a new template, open a template or save a
template. See chapter 3 for more details.
Page 2.1
REPORTER
User manual Version 12.0, October 2014
View toolbar
The view toolbar gives a quick way of zooming in and out of the template. This is the
same as using the Zoom submenu from the View menu. There are also 2 buttons which
control the grid and snap tools.
Design toolbar
The first two buttons on the design toolbar buttons allow you to swap between the "design"
view (swiss army knife icon) and the "presentation" view (directors chair icon) . See chapter 7
for more details. By default the Design toolbar is docked on the left hand side. However you
can drag it and make it a floating menu if you wish. The "p" keyboard shortcut can be used to
toggle between "design" view and "presentation" view.
The third button (numbered list icon) allows you to turn on/off the generation order. See section 2.5.4 for more details.
Style toolbar
The style toolbar allows you to change the line width, line style, line colour, fill colour and
text colour for shapes. See chapter 5 for more details. By default the Style toolbar is docked
on the left hand side. However you can drag it and make it a floating menu if you wish.
Page 2.2
User manual Version 12.0, October 2014
REPORTER
Tools toolbar
The tools toolbar contains the various objects which you can place on the page. These may be
simple objects such as lines, rectangles, text etc or more complicated objects such as a
D3PLOT object or a library program. Hopefully the icons should be self explanatory but if
you let the mouse hover over the button a brief text description will temporarily be shown
over the button and a longer text description will be shown in the status bar. By default the
Tools toolbar is docked on the left hand side. However you can drag it and make it a floating
menu if you wish.
See chapters 5 and 6 for more details.
2.2 Mouse and keyboard usage for the screen-menu
interface
Most screen-menu operations are driven with the left mouse button only, but there are exceptions:
• Text in the dialogue area and text boxes requires keyboard entry;
• Text strings saved in the cursor "cut" buffer may be "pasted" into dialogue areas and text boxes using the
middle mouse button.
The primitive "widgets" in the menu interface are used as follows:
Buttons
Screen buttons are depressed by clicking on them. Some button remain set when they have been
selected, these buttons will appear depressed.
Buttons may be set by REPORTER itself, for example the cursor arrow button on the right, to
indicate that this option is in force. They may also be greyed out, to indicate that the option is not
currently available (e.g. the hand button on the right).
Page 2.3
REPORTER
User manual Version 12.0, October 2014
"Popup" window invocation: Some buttons when selected will invoke a "popup" window, from
which a selection can be made. The popup is invoked by clicking on the triangle.
Text boxes
To enter text in a text box: first make it "live" by
clicking on it then type in text into the screen that
appears. You can use the left and right arrow keys
for line editing within a box, text entry takes place
after the current cursor position. The cursor is
shown as a flashing vertical bar.
Right clicking the mouse button in a text box maps
the menu on the right which allows you to copy
and paste text from the clipboard and (where
applicable) insert a variable (see chapter 8).
2.3 Using the "file filter" boxes.
Wherever REPORTER requires you to enter a filename you will be presented with a text box into which to type it.
However, to the right of this text box you will also see a ? button, which may be used to invoke a basic file filter box.
The appearance of this is operating system dependent.
Page 2.4
User manual Version 12.0, October 2014
REPORTER
Basic UNIX file filter box
The files can be filtered according to file types by using the File type popup, in this case the pathname is
/u/mid/milest/REPORTER_DEMO/test/ and the pattern is *.ort (REPORTER template) and *.orr
(REPORTER report).
The main window show a list of the directories within the present one and a list of files that match the filter selection.
Files or directories can be selected by double-clicking on them.
To go back up the directory tree you need to select the
of the parent directories.
button, or you can click on the Look in popup to select any
The File name box shows the current selection.
The Open button closes the file filter box and opens the selected file
The Cancel button closes the file filter box without opening any files
As an alternative to selecting a file and pressing Open you can double-click (quickly) on the file to make your
selection.
The left hand area of the menu shows commonly used directories. In this case temp, reporter. You can add
directories to the list by dragging them from the main area and dropping them. Clicking on one of these directories
updates the main area to that directory.
Page 2.5
REPORTER
User manual Version 12.0, October 2014
Basic"Windows" file filter box
Double-click on the directory required, then on the filename you wish to open.
To open files that do not have the (*.orr) extension you will need to select All files (*.*) from the Files of type
pull-down menu.
2.4 Log file
REPORTER creates a log file as it runs. This log file shows how REPORTER is trying to run
programs, how it is creating images etc.
If any problems or warnings are generated they will be written to this log file. This can then be
used to solve any problems.
The logfile is accessible from Logfile in the Help menu. A typical log file window is shown
below.
Page 2.6
User manual Version 12.0, October 2014
REPORTER
You can save the contents of the log to a file using the Save option. If warnings or errors have been given the Next
warning and Next error buttons allow you to cycle through the warnings/errors.
Page 2.7
REPORTER
User manual Version 12.0, October 2014
2.5 View Controls
What is and isn’t displayed on the screen and how far zoomed in or
out the page is can be controlled from the View menu
2.5.1 Object display options
What of type of object are visible on screen can be controlled by selecting or deselecting the various buttons to the left
of the relevant object in the View menu.
2.5.2 Full screen view
The Full screen option in the View menu will enlarge the "Main report area" of the REPORTER window to fill the
whole of the screen. You can return to the normal REPORTER window by pressing the ESC key.
2.5.3 Design/Presentation view
The Design view and Presentation view checkboxes allow you to swap between design and presentation view. See
chapter 7 for more details.
2.5.4 Generation order
The Generation order checkbox allows you to turn off whether the order that objects will be generated in is shown. The
order is important if you are using variables to make sure that variables are not used before they are defined. To help
with this REPORTER can show the order that the objects are generated in.
Page 2.8
User manual Version 12.0, October 2014
REPORTER
When the generation order button is
turned on REPORTER shows a number
next to each item that will be generated.
The number is the order that the items
will be generated on this page. In the
image on the right you can see that the
first 5 library programs in the table are
generated one after another but the last
one is generated later on (8th on the
page). Showing the numbers helps to
identify problems with objects being
generated in the wrong order (e.g.
perhaps the last library program should
have been generated 6th on the page
instead of 8th). See chapter 7 for more
details on generation order.
When the generation order button is
turned off the numbers are not shown.
The numbers are only shown in the
design view. They are not shown in any
output generated from REPORTER.
Page 2.9
REPORTER
User manual Version 12.0, October 2014
2.5.5 Zoom
Clicking on the Zoom option in the View menu will bring up the
Zoom menu.
• 25% 150% etc - will zoom in or out relative to the
standardised size at 100%
• fit page - will scale the page so that it fits into the window
• Actual size - will resize the page to the actual size that the
work is (100%)
• fit width - will scale the page so that the width of the page
will fit the screen
• fit height - will scale the page so that the height of the page
will fit the screen
2.6 Running a script file
To run a javascript script in REPORTER use the Script->Run script file... function. This is equivalent to running a
script from the command line or inserting a script object onto a page. For more details on scripting see the scripting
chapter.
2.7 Preferences
2.7.1 Preferences - Grid
The colour, style and size of the grid drawn on the page can be altered with these preferences. A grid can help you
Page 2.10
User manual Version 12.0, October 2014
REPORTER
layout objects on the page. Note that the grid size does not have to be the same as the snap size.
2.7.2 Preferences - Templates
When generating image files for D3PLOT and T/HIS this preference controls what do do if an image with the same
name exists. By default (selected) REPORTER will overwrite the image. However, you many want to run the same
template multiple times for different models in the same directory. With this unselected a new image will be created for
each model.
This preference is not a programme wide preference. It is actually stored with the template and read/written as a
property so this must be set for each active template.
2.7.3 Preferences - Library
This preference controls the size of thumbnails that are drawn for library images.
Page 2.11
REPORTER
User manual Version 12.0, October 2014
2.7.4 Preferences - LS-DYNA
The filename convention preference determines how LS-DYNA filenames are referred to by REPORTER in library
scripts etc. If you are using the Oasys Ltd SHELL then you should use Arup naming.
2.7.5 Preferences - VBA
When you write a VBA script from REPORTER you must give the directory that the script will be run from. This is
because any images that are referred to must be included by an absolute filename so REPORTER needs to know where
the images will be placed. This preference allows you to change the location.
Page 2.12
User manual Version 12.0, October 2014
REPORTER
2.7.6 Preferences - Editing
When creating or editing objects in REPORTER that occupy a rectangular area on the page the position and size of the
object can be given by 2 different methods.
1.
By giving the coordinates of 2 opposite corners of the rectangle.
2.
By giving the coordinates of one corner and the width and height of the object. The default is to use the bottom
left corner.
Snap will make object coordinates round to the snap size. e.g. in the image on the right snap is set to 1.0mm, so item
coordinates will be rounded to the nearest mm. This can help layout objects on the page.
The nudge distance is the amount that a selected item will be moved when the arrow keys are used. Note that if you
have snap active this may give unexpected results. For example if you have snap set to 1mm and nudge set to 0.5mm
every time you nudge an item REPORTER will round the coordinates to the nearest mm (as snap is 1mm). If you want
to move objects by less than the snap distance then turn snap off.
Page 2.13
REPORTER
User manual Version 12.0, October 2014
2.8 Program Locations (D3PLOT, PRIMER and T/HIS)
This option can be selected from the File menu. It is used to define the location of the D3PLOT, PRIMER and T/HIS
software. This option is useful if you want to use the 64bit executables instead of the 32bit executables for D3PLOT,
PRIMER and/or T/HIS. If you want to set this option permanently then you can use the oa_pref options:
reporter*d3plot
reporter*primer
reporter*this
If REPORTER is started in batch mode with the -batch command line argument then on Windows D3PLOT,
PRIMER and T/HIS will be run without any windows being shown. Setting the Run programs in batch mode
checkbox will set this option when running REPORTER interactively.
It may occasionally be necessary to pass extra arguments to D3PLOT, PRIMER or T/HIS when generating a report.
Extra arguments to pass can be given in the D3PLOT, PRIMER and T/HIS Additional arguments to pass
textboxes.
Page 2.14
User manual Version 12.0, October 2014
REPORTER
3. Opening and closing templates and
reports
Templates can be created, opened,
or saved by either using the File
menu or the File Buttons
3.1 Creating a new template
A new template can be created from either the New file option in the File menu or by using the New file button.
3.2 Reading an existing template or report
An existing report template can be opened from either the Open file option in the File menu or by using the open file
button.
3.3 Reading a library template
REPORTER has a number of built in templates to create reports for standard automotive crash test protocols
(EuroNCAP, IIHS etc.) and can be opened using the Open Library Template menu. For further information see
Appendix B.8.
Page 3.1
REPORTER
User manual Version 12.0, October 2014
3.4 Saving a template
A template can be saved by choosing the Save as option in the File menu and then changing the file type to
template.
3.5 Saving a report
A report can be saved by using the Save as option in the File menu and setting the file type to report. The difference
between a report and a template is that a template is the instructions or recipe of how to construct the report. To actually
create the report you have to generate it and then create some sort of output. This could mean running D3PLOT
command files, programs, FAST-TCF scripts etc.
Alternatively, once the report has been created you can save the whole thing as a report. This saves the output of
programs, command files etc. with the template so when you next read the file the results are already available (the
report does not need to be regenerated).
Page 3.2
User manual Version 12.0, October 2014
REPORTER
4. Inserting and editing pages
A report is generally made up of a number of different pages. Only one page is shown on
the screen at any one time. Moving through the pages of the report, adding, deleting, and
reordering pages are all controlled form the Page menu.
4.1 Adding a new page
A new page can be added by using the New page
option in the Page menu. This will bring up a
Page layout window from which you can give
the new page a title,and set the background colour.
4.2 Adding a new page from the library
A new page can also be added by selecting an existing page layout from the library by using the Insert from library
option in the Page menu. This will bring up a Insert page from library window from which you can select a page
layout.
Page 4.1
REPORTER
User manual Version 12.0, October 2014
Highlight the page layout you want by clicking on it with the mouse and then clicking on then OK button to create the
new page. The Cancel button will exit you from this window with out creating a new page. (See the library object
appendix for more details on using the library).
4.3 Deleting pages
You can delete the present page you are working on by using the Delete page option in the Page menu, or you can
delete all the pages in the report template by using the Delete all option in the Page menu. Both of these option will
bring up a confirmation window in which you need to confirm the delete operation.
4.4 Duplicating pages
You can copy the current page by using the Duplicate page option in the Page menu. This will make a copy of the
current page, and insert it after that page. The current page will also be changed to this newly created page.
4.5 Reordering pages
You can change the order of the pages in the report by using the Reorder pages option in the Page menu. This will
bring up the reordering window.
Page 4.2
User manual Version 12.0, October 2014
REPORTER
The pages are listed by the page number and title.
The page order can be modified by clicking on the
page you want to move in the Pages box. This
will highlight that page, which can then be moved
by using the Move up and Move down buttons.
Once finished the OK button will save the new
order and exit the window. The Cancel button
allow you to exit this window without making any
changes to the page order.
4.6 Changing the current page
You can change the current page you are working on by using the Prev page and Next page option in the Page
menu to change the current working page to the previous or next page in the report. You can also move through the
pages by using the Page Up and Page Down keys. If you have a mouse which has a wheel then the wheel can also
be used to move through the pages.
4.7 Changing the page properties
You can change the title of the current page by using
the Properties option in the Page menu. This will
bring up an edit page properties window. The new
page title is entered into the Title text box and the
colour can be chaged by clicking on the Choose
button. Clicking on the OK button will save the
changes and exit this window. The Cancel button
will exit this window with out making any changes to
the page title
4.8 Inserting pages from file
You can insert all the pages from another template file into the current template by using the Insert option on the
Page menu, and then selecting the required template file from the File window.
Page 4.3
REPORTER
User manual Version 12.0, October 2014
4.9 Importing and exporting pages
Individual pages can be exported from a template using the Export page option. These pages can then be used in the
page library or can be imported into another template by using Import page. Individual pages should be saved with
the extension .orp so REPORTER can find them.
4.10 Page masters
Page masters can be used to automatically add objects to every page in the report. For example you may want to have
your project name written on the bottom right corner of every page in the report. You could do this by having a standard
page and either use the page library or import it each time you want to create a new page. This will work, however if in
the future you want to edit the project name, you would need to edit each page individually.
An alternative is to use page masters. A master page can be created and any objects that you put on that page will
automatically appear on every page in the template.
4.10.1 Creating a page master
To create a new page master use Page ... Page master.
In this version of REPORTER only one page master can be created per REPORTER
template.
A page master is a type of template used to keep each page looking the same (eg such
as using a company logo)
The normal page creation window can then be used to create the page. A normal blank page is created on which you can
place objects as required. An extra toolbar called Master appears (as seen below). By default this is docked at the
bottom left below the Tools toolbar.
To close the master page and return to a normal page select Close master from the Master
toolbar.
4.10.2 Changing a page master
To change the page master use Page ... Page master to get to the page master in use (only one page master per
REPORTER template). Once you have finished editing the page you can close it and return to the normal pages.
Page 4.4
User manual Version 12.0, October 2014
REPORTER
4.11Page Setup
To set up the page settings choose the Page setup option from the
File menu. This allows you to change the page size and orientation.
If the page size and/or orienation is changed objects on existing
pages are automatically moved to ensure that they are not outside
the page boundaries.
4.12 Generating a single page
Instead of generating the entire report you can generate a single page by using the Generate page option in the Page
menu. However, note that if some of the objects on the page require data that would be generated on previous pages and
those pages have not yet been generated the page generation will not work.
Page 4.5
REPORTER
Page 4.6
User manual Version 12.0, October 2014
User manual Version 12.0, October 2014
REPORTER
5. Inserting and editing simple objects
REPORTER allows you to create and edit a number of different shapes through the use of the
various Tools and Style button options.
5.1 Using the Grid and Snap options
5.1.1 Grid
The grid option can be turned on by clicking on the Grid button. This will create a grid of dots on the screen with a
pitch equal to the grid size, this is to help you in aligning objects in the report. These dots will not appear in the
generated report. The size and attributes of the grid can be modified by using the Grid tab in the preferences.
5.1.2 Snap
The snap option can be turned on by clicking on the Snap button. This will create an invisible grid with a pitch equal to
the snap grid size. When positioning and sizing object the point you select will not be the exact position of the mouse
pointer but the nearest point on the snap grid.
The size and attributes of the grid can be modified by using the Editing tab in the preferences.
5.2 Setting line style, thickness, colour, and fill colour
5.2.1 Line style
The line style can be set using the Line style button.
Clicking on this will bring up a Line style window from which the line style can be selected.
5.2.2 Line thickness
The line thickness can be set by either clicking on the Line thickness button or by entering the
thickness into the text box next to the Line thickness button.
Page 5.1
REPORTER
User manual Version 12.0, October 2014
Clicking on the button will bring up a Line thickness window from which the line thickness can
be selected.
Line
Colour
Fill
The fill, line or text colour can be set using the Fill colour button the Line colour button or Colour
the Text colour button, the current colour is displayed to the right of the button:
Text
colour
Clicking on this will bring up the Colour window.
The new colour can be selected from those on display or by clicking on the More colours button a set of red, green,
and blue sliders can be brought up which you can use to create you own new colour. For the Fill colour you can also
select no colour which will give you a transparent Fill colour allowing object below to show through. The Done
button will exit this window setting the fill or line colour to the new colour. The Cancel button will exit you without
changing the colour.
5.2.3 Fill, Line and Text Colour
5.3 Inserting basic shapes
5.3.1 Lines and arrows
You can create a line or arrow by using the Line and Arrow tools.
To create a line click and drag the mouse from the point you want the line to start from to the point you want the line to
end at. It is the same procedure for creating an arrow with the arrow head appearing at the end point of the line. The line
type, thickness, and colour will be set to the current settings.
5.3.2 Rectangles
You can create a box by using the Rectangle tool.
To create a box click and drag the mouse from one corner of the box to the other. If the shift key is held down while
doing this a perfect square can be created.
If the Ctrl key is held down then the initial click position will be the centre of the rectangle instead of one corner. The
Page 5.2
User manual Version 12.0, October 2014
REPORTER
line type, line thickness, line colour, and shape fill colour will be set to the current settings.
5.3.3 Ellipses and circles
You can create a oval or circle by using the Ellipse tool.
To create an ellipse click and drag the mouse from one corner to the other of a rectangle into which the ellipse will be
drawn. If the shift key is held down while doing this a perfect circle can be created. If the Ctrl key is held down
then the initial click position will be the centre of the ellipse instead of one corner. The line type, line thickness, line
colour, and shape fill colour will be set to the current settings.
5.3.4 Text
A single line of text can be added by using the Text tool.
To add text click on the point you want the text to be, this will bring up a Text window.
Text can be added using the Enter text
box. You can also enter variables in the
text by right clicking in the text box or
pressing Ctrl+I which will allow you to
bring up an Insert variables window
from which to select a variable.
The font, style, and size are set in the
relevant boxes.
The horizontal and vertical justification of
the text can be set independently to enable
you to position the text how you want.
Changing the vertical alignment can help
when trying to align text with program
items.
The text colour will be set to the current
text colour setting. The OK button will
exit this window and create the text. The
Cancel button will exit this window
without creating any new text. Also a
Hyperlink... button (see section 9)
allows the user to set the text up as
hyperlink and the Conditions... button
(see section 10) enables the user to apply
conditional formatting to the text.
5.3.5 Textbox
Text inside a box (with multiple lines if necessary) can be added by using the Textbox tool.
To add a textbox click and drag the mouse from one corner of the textbox you want to create to the other. This will
bring up a Textbox window.
Page 5.3
REPORTER
User manual Version 12.0, October 2014
Text can be added using the Text box.
You can also enter variables in the text
by right clicking in the text box or
pressing Ctrl+I which will allow you to
bring up an Insert variables window
from which to select a variable.
The font, style, and size are set in the
relevant boxes.
The horizontal and vertical justification
of the text can be set independently to
enable you to position the text how you
want.
The text colour will be set to the current
line colour setting. The OK button will
exit this window and create the text. The
Cancel button will exit this window
without creating any new text. Also a
Hyperlink... button (see section 9)
allows the user to set the text up as
hyperlink and the Conditions... button
(see section 10) enables the user to apply
conditional formatting to the text.
The background and border colour for
the textbox can be set using the fill and
line colour buttons in the style toolbar.
The border style can also be set with the
line style and line thickness buttons in
the sytle toolbar.
The margins for the textbox can be
changed by using the Margins...
button.
Margins
The Edit margins dialogue
box allows you to change
the margins around the text
in a textbox.
The margins can be set
independantly for the top,
bottom, left and right sides
of the textbox.
5.3.6 Images
Bitmap, GIF, and JPEG Image can be added by using the Images button
To add and image click on the point where you want the bottom left corner of the image to be, this will bring up a
Image window.
Page 5.4
User manual Version 12.0, October 2014
REPORTER
Enter the image filename
into the Image text box or
click on the Choose...
button to call up a File
window from which to
select the image file. You
can also enter variables by
right clicking in the text
box which will allow you
to bring up a Insert
variables window from
which to select a variable.
The OK button will close
this window and add the
image to the page.
The Cancel button will
exit this window without
adding an image.
The Cropping... button
(see section 5.4.2 below)
can be used to crop the
image before showing it.
Also the Hyperlink...
button (see section 9)
allows the user to set the
image up as hyperlink.
5.4 Editing shapes, image, and text objects
You can edit a existing shape, image, or piece of text
by first clicking on the Select tool to select the
editing tool and left clicking on the object. Multiple
objects can be selected by holding down the SHIFT or
CTRL keys when clicking on the objects, or by left
click mouse dragging a selection box around multiple
objects. The object(s) are then drawn with yellow
boxes or "handles" which allow you to resize the
object(s). Additionally the cursor changes to indicate
that you can now move the object(s). If you click and
drag when over the object(s) you can move them
around the page. The cursor keys can also be used to
"Nudge" the items around. If you move the mouse
over one of the yellow "handles" you can resize the
object(s). The cursor changes appropriately to
indicate how the object(s) will be resized. The escape
key can be used to deselect all currently selected
objects.
You can also right click on an object regardless of the mode the cursor is in. If the object is not already selected, it is
selected and then a popup menu is displayed.
Page 5.5
REPORTER
Right clicking when editing an object will bring up a small popup menu.
• Edit will bring up an Edit window for the object. The Edit window
will vary depending on what type of object is being edited.
• Delete will delete the object(s). This can also be done by pressing
the Delete key while editing the object(s).
• Cut will cut the object(s) from its current page/place and make them
available to be pasted in another place.
• Copy will make a copy of the selected object(s) and keep them
stored in the computers memory until they are pasted or another item
is copied.
• Save will save a copy of the object(s). This can then be imported
elsewhere using Edit Import....
• Locked allows you to lock an item on the page so it cannot be
moved by dragging with the mouse. See section 5.8 for more details.
• Generate will perform any actions required to make the output for
the object(s). See section 7 for more details.
• Send to back will send the selected item(s) behind all the rest of
the items on the page.
• Send back one will send the selected item(s) behind the next item
behind it.
• Bring forward one will bring the selected item(s) in front of the
next item in front of it.
• Bring to front will bring the selected item(s) in front of all other
items on the page.
• Align Page Left will align the selected item(s) horizontally with
the left hand side of the page.
• Align Page Centre will centre the selected item(s) horizontally on
the page.
• Align Page Right will align the selected item(s) horizontally with
the right hand side of the page.
• Align Page Top will align the selected item(s) vertically with the
top of the page.
• Align Page Middle will centre the selected item(s) vertically on
the page.
• Align Page Bottom will align the selected item(s) vertically with
the bottom of the page.
Also note that some of these options are also available through the Edit
menu.
When multiple items are selected, you also get the following options
on the popup menu
• Align Left will align the selected items horizontally with the
left most selected item.
• Align Centre will centre the selected items horizontally
with respect to the left most and right most selected items.
• Align Right will align the selected items horizontally with
the right most selected item.
• Align Top will align the selected items vertically with the
top most selected item.
• Align Middle will centre the selected items vertically with
respect to the top most and bottom most selected items.
• Align Bottom will align the selected items vertically with
the bottom most selected item.
• Distribute Page Vertical will evenly distribute the
selected items vertically on the page.
• Distribute Page Horizontal will evenly distribute the
selected items horizontally on the page.
• Distribute Vertical will evenly distribute the selected items
vertically between the top most and bottom most selected
items.
• Distribute Horizontal will evenly distribute the selected
items horizontally between the left most and right most
selected items.
Page 5.6
User manual Version 12.0, October 2014
User manual Version 12.0, October 2014
REPORTER
5.4.1 Shapes
For shapes the window allows you to change the maximum and minimum coordinates of the shape.
The OK button will exit the window and update the shapes coordinates. The Cancel button will exit the window
without making any changes to the shape.
5.4.2 Images
For images the window allows you to change the coordinates of the bottom left corner of the image, the image and the
resolution.
The OK button will exit the window and update the image coordinates as well as the resolution to whatever is set. The
Cancel button will exit the window without making any changes to the image. An image can also have a hyperlink.
For more details see section 9.
Page 5.7
REPORTER
Image cropping
The Cropping... button
allows you to crop parts of
the image before it is
shown. Pressing the button
maps the panel shown on
the right. This allows you to
input how many pixels will
be cropped from the left,
right, top and bottom of the
image before showing it.
Type the values or use the
up and down arrows to set
the values you require.
Pressing OK will update
the cropping information
for the image. Pressing
Cancel will abort without
changing the values.
5.4.3 Text
For text the window allows you to
change the coordinates of the text, the
text itself and the various text parameters
(see Section 5.3.4 for more details).
The OK button will exit the window and
update the text. The Cancel button will
exit the window without making any
changes to the text.
Page 5.8
User manual Version 12.0, October 2014
User manual Version 12.0, October 2014
REPORTER
5.4.4 Textbox
For textboxes the window allows you
to change the coordinates of the
textbox, the text itself and the various
text parameters (see Section 5.3.5 for
more details).
The OK button will exit the window
and update the text. The Cancel button
will exit the window without making
any changes to the text.
5.4.5 Changing colour and line styles
When you select an object the colour, line style and line thickness buttons are updated with the properties of the
selected object. Changing any of these while and object is selected will change the property of the object.
Page 5.9
REPORTER
User manual Version 12.0, October 2014
5.5 Copying objects and using the clipboard
If you want to copy the object to another page, select the item and use the
Copy option from the Edit menu. This copies the object onto the ’clipboard’.
Once you have an object on the clipboard you can Paste it onto any page in
the template (including the page that you copied the object from). If you paste
the object back onto the same page the object will be offset slightly. If you
paste the object onto a different page it will be placed in the same position on
the page.
You can also right click on the page at any point and then select Paste item
here. This will paste the item at the current cursor location.
Alternatively you can save the object to a file by using the Save clipboard
function. Currently only a single object can be saved. Objects saved from
REPORTER should be given the extension .oro (REPORTER Object).
Empty clipboard will remove any objects from the clipboard.
To import an object (that has previously been exported from the clipboard) use
the Import... option in the Edit menu.
Page 5.10
User manual Version 12.0, October 2014
REPORTER
5.6 Reordering items on the page
The order in which items are drawn on the page can be changed by 2 different ways in REPORTER. The order is
important as it determines the order in which scripts, programs etc will be run. For more details see section 7.1.
The first method can be used when editing objects. Once an item is selected you can right click with the mouse and use
the ordering options in the popup to change the object.
One way of thinking about the object order is to think of a series of ’layers’ or transparencies in a stack. Each ’layer’ or
transparency contains one object. The order in which the transparencies are stacked changes the order in which things
are seen. This is exactly the same as layers in various photo editing software.
Send to back will make the object the first object drawn on the page (back layer)
Send back one will move the object back a layer
Bring forward one will move the object forward a layer
Bring to front will make the object the last object drawn on the page (top layer)
Page 5.11
REPORTER
User manual Version 12.0, October 2014
The second method is to use the reorder items... option in the Page menu. This
brings up a window as shown below. The object stacking order is shown. Clicking on
an entry highlights that entry with a green selection box.
You can use the Move up and Move down options to change the stacking order of
the selected item. Once the objects are in the order you want OK will update the page.
Cancel will abort the operation without making any changes.
Page 5.12
User manual Version 12.0, October 2014
REPORTER
5.7 Search and replace
The search and replace function allows to to search for a text string (or
variable) in all objects in the template and replace it with another string (or
variable).
For example, you may make a template which contains D3PLOT objects that
have the directories hard wired instead of using a variable for the directory. If
you want to generalise the template you can use Search and Replace... to
replace every instance of the directory name in the template with a variable.
Enter the search and replace strings in the
dialog box. You can insert a variable if required
by right clicking in the text box and selecting
Insert Variable.
Each time REPORTER finds an
instance of the string in an object in the
template a confirmation dialog will be
mapped giving you the option to
replace or skip the string. The object
will be selected on the screen so you
can see which object you are replacing
in and a brief text description wil be
given for the object and field that you
are looking at.
Cancel will abort the search and
replace operation. Pressing Yes will do
the replace, pressing No will skip this
instance. If you want to just replace all
instances without confirming each one
in turn then press Yes to All.
Page 5.13
REPORTER
User manual Version 12.0, October 2014
5.8 Locking items
It may be useful to ’lock’ objects on the page so that they cannot be moved
by dragging. The Locked option in the context menu (available by right
clicking on a selected item) allows you to do this.
To lock at object first select it and then click on the Locked option. If an
object is locked it will be shown with a tick symbol. It can be unlocked by
clicking on Locked again.
Multiple objects can be locked or unlocked at the same time. Toggling the
Locked option will change the locked property of all of the selected items.
Once an item has been locked it cannot be dragged on the page. It can still be moved by using the arrow keys and the
size and/or position can be altered in the edit panel.
You can see which items are locked in design view. A locked item will be drawn with a small padlock symbol.
Page 5.14
User manual Version 12.0, October 2014
REPORTER
6. Advanced objects
6.1 D3PLOT objects
D3PLOT objects allow you
to include output from
D3PLOT in your template.
There are two different ways
of using D3PLOT objects.
The first (and by far the
easiest) is to use the
Capture... button to create
the object. The second is to
use an existing D3PLOT
command file to create the
output from D3PLOT.
If the Bitmap output type is
chosen, the Cropping...
button can be used to crop
away parts of the image
from the top, bottom, left
and right before showing it.
See section 5.4.2 for more
details.
There are two different options for the type of output generated from
D3PLOT.
• Bitmap indicates that the output is a bitmap file.
• Blank indicates that the D3Plot object will not create any output on
the page
6.1.1 Using Capture to create a D3PLOT object
The easiest way to create a D3PLOT object is to use the Capture... command. If you press the button REPORTER
starts D3PLOT for you. You can now open the model(s) and do whatever operations you want inside D3PLOT such as
rotating, zooming, blanking, selecting the state, setting colours etc.
Page 6.1
REPORTER
User manual Version 12.0, October 2014
Once you are happy with the image you
have in D3PLOT press the Capture
button in the floating Reporter Objects
menu. D3PLOT will automatically create
a settings file, a properties file and a
command file for the current image and
return them to REPORTER.
These are embedded in the template so you do not have to worry about packaging them with your template file.
To return to REPORTER use the File menu and select => Reporter (which replaces the normal Exit command).
When you get back to REPORTER the Job files textbox is filled in for you.
A tab is created in the menu with the Tag that you gave in D3PLOT. In the example here the tag is von Mises
stress. REPORTERautmatically assigns a Bitmap file name for you. If required you can change this to whatever
name you require. Note that the format if the file is given from the extension you give. By default D3PLOT will return a
png image to REPORTER. If you wanted to create a jpeg image change the extension in the textbox to ’.jpg’.
The Command file is greyed out as it has been automatically created by D3PLOT and does not need any editing.
Page 6.2
User manual Version 12.0, October 2014
REPORTER
However, if you wanted to add some extra dialogue commands to be done in D3PLOT when generating the object you
can use the Edit... button next to the Command File textbox to add/edit them.
You can also specify two JavaScripts to run when generating the D3PLOT object; a Pre JavaScript and a ’normal’
JavaScript. To explain why there are two possible JavaScripts we need to consider the order that D3PLOT uses when
creating the image. It is:
1.
Read the ptf files
2.
Run Pre JavaScript (if defined)
3.
Read properties and settings files stored in REPORTER template
4.
Run any extra Command file dialogue commands from REPORTER (if defined).
5.
Run the ’normal’ JavaScript (if defined)
6.
Read external data file (if defined)
For virtually all cases the ’normal’ JavaScript file in step 5 will do what you want. However if you use a JavaScript to
create a user defined data component then this must be run before the properties and settings files are read (as that is
where the data component for the plot is stored). In this case a Pre JavaScript has to be used.
If you want to change the image you can
press Update capture again at any
time. D3PLOT will start again and restore
the current attributes you have set. You
can make any changes etc that you want
by pressing Update in the Reporter
Objects floating window and returning
to REPORTER again. The old settings
file and properties files will be
overwritten.
6.1.2 Creating multiple images from a single D3PLOT session
You are not limited to making a single image in D3PLOT. Using the Reporter Objects floating menu you can
capture as many images as you want in a single D3PLOT session. A tab will be created in the Edit D3Plot object
window for each image you capture. For example as well as making a von Mises stress image we may also want to
make an image showing plastic strain.
Page 6.3
REPORTER
User manual Version 12.0, October 2014
Each image has its own properties and settings file and optionally extra command files and/or a JavaScript. In
REPORTER an Image file is created for the second and subsequent images and these are linked to the ’parent’
D3PLOT object.
To help show which objects are linked together they are coloured differently to normal objects. The first group will be
red, the second green, the third blue...
If you modify the ’parent’ D3PLOT object the ’child’ Image file objects will be added/updated/deleted as required.
Page 6.4
User manual Version 12.0, October 2014
REPORTER
6.1.3 Using datafiles to create ’blob’ plots
If a Data file is
given then that is
passed to D3PLOT
to create an external
data plot or ’blob’
plot. An example
plot is shown below.
In a data plot
D3PLOT
superimposes data
values on the 3
dimensional shape.
For example, below
this is used to show
HIC values for
Euro-NCAP
analyses at various
positions on the
bonnet.
The easiest way of
creating a data file is
to use the standard
library program in
REPORTER. See
appendix B and the
D3PLOT manual for
more details.
Page 6.5
REPORTER
Page 6.6
User manual Version 12.0, October 2014
User manual Version 12.0, October 2014
REPORTER
6.1.4 Using a command file to create a D3PLOT object
The alternative method to
create a D3PLOT object is
to create a command file
yourself in D3PLOT (which
creates the image). In this
case the Image file must
correspond to the name of
the image you create in the
command file. GivCe the
name of the Command
file and the Job file.
This method is not
recommended and is present
only to keep old templates
working. Use the Capture
method instead.
6.1.4 Editing D3PLOT objects
The position and size of D3PLOT objects can be edited in exactly the same way as the simple shape objects. See section
5 for more details.
If you have created the D3PLOT object using the Capture... then the text on the button will change to Update
capture... You can modify/update the existing captures if required. See section 6.1.1 for more details.
Page 6.7
REPORTER
User manual Version 12.0, October 2014
6.2 T/HIS objects
T/HIS objects allow you to
include output from T/HIS in
your template.
There are three different ways
of using T/HIS objects. The
first (and by far the easiest) is
to use the Capture... button
to create a FAST-TCF script
for the object that T/HIS will
run.
The second is to write your
own FAST-TCF script.
The third is to use an existing
T/HIS command file to create
the output from T/HIS.
If the Bitmap output type is
chosen, the Cropping...
button can be used to crop
away parts of the image from
the top, bottom, left and right
before showing it. See section
5.4.2 for more details.
There are three different options for the type of output generated from T/HIS.
• Bitmap indicates that the output is a bitmap file.
• Blank indicates that the T/HIS object will not create any output on the page
• Text indicates that the output is text. This is only valid for the FAST-TCF script
type. This option would be used if you wanted the output from a FAST-TCF table
or HIC command etc.
The Postscript option which was present in version 9.2 is no longer supported by
REPORTER. It is only there to allow old (pre version 9.2 templates to be read in). You
should not use this type. This has been removed in version 9.3.
Page 6.8
User manual Version 12.0, October 2014
REPORTER
6.2.1 Using Capture to create a T/HIS object
The easiest way to create a T/HIS object is to use the Capture...
command.
First make sure that the Type is set to FAST-TCF script.
If you press the Capture... button REPORTER starts T/HIS for you. You
can now open the model(s) and do whatever operations you want inside
T/HIS to get the cruves that you want on the screen. Once are happy with
the graph you have in T/HIS press the File menu and selectReturn to
Reporter (which replaces the normal Exit command).
T/HIS will automatically create a FAST-TCF script for the current graph
and return it to REPORTER. This is embedded in the template so you do
not have to worry about packaging it with your template file.
When you get back to
REPORTER the Image file
and Job file are filled in for
you.
If you want to change the
script you can press Update
c apture... again at any
time. T/HIS will start again
and replay the script. You
can make any changes etc
that you want and return to
REPORTER again. The old
script will be overwritten.
Page 6.9
REPORTER
User manual Version 12.0, October 2014
6.2.2 Using your own FAST-TCF script to create a T/HIS object
If you want to make your own FAST-TCF script in a T/HIS object then fill in the Image file and Job file yourself.
You can load an existing FAST-TCF script by using the Load... button or type in the script. In this case the Image
file must correspond to the name of the image you create in the script.
6.2.3 Using a command file to create a T/HIS object
The alternative method to
create a T/HIS object is to
create a command file
yourself in T/HIS (which
creates the image).
Make sure that Type is set to
T/HIS command file.
In this case the Image file
must correspond to the name
of the image you create in the
command file. Give the name
of the Command file and the
Job file.
6.2.4 Editing T/HIS objects
T/HIS objects can be edited in exactly the same way as the simple shape objects. See section 5 for more details.
If you have created the T/HIS object using the Capture... then the text on the button will change to Update
capture... You can modify/update the existing capture if required. See section 6.2.1 for more details.
6.3 PRIMER objects
PRIMER objects allow you to include output from PRIMER in your template. To create one select the
Primer tool from the Tools toolbar and click and drag a rectangle on the page. The Edit Primer object
information window will then be shown.
Page 6.10
User manual Version 12.0, October 2014
REPORTER
If you want to create an image using PRIMER to put in the report (e.g. an image showing yield stress or element
timestep) select Bitmap for the Type. In this case the Cropping... button can be used to crop away parts of the image
from the top, bottom, left and right before showing it (see section 5.4.2 for more details). Alternatively if you do not
want any output but just want to run Primer to create some other sort of output or run a JavaScript set the Type to
Blank.
6.3.1 Using Capture to create a PRIMER object
To start PRIMER press the Capture button. PRIMER will then automatically record a macro containing all of the
commands that you do. When you have finished do File and => Reporter to return to REPORTER.
REPORTER will then prompt you to replace any filenames in the macro with variables. You can choose which
variables you would like to replace. Alternatively you can replace any variables yourself manualls later on (see below).
The Edit Primer object information window will then be updated as shown below.
Page 6.11
REPORTER
User manual Version 12.0, October 2014
REPORTER will automatically give a name for the bitmap file but you can change it to whatever you want. If required
you can edit the macro by using the Edit... button next to the Macro file textbox (which in the above image shows that
it contains 25 lines). This is useful to replace any filenames with variables if required (right click with the mouse or
press Ctrl+I in the macro to insert variables). The macro will be saved in the REPORTER template.
As well as using a macro a JavaScript can also be specified to run in PRIMER. The Edit... button next to the
JavaScript textbox can be used to load and edit a JavaScript. The JavaScript will be saved in the REPORTER
template.
6.3.2 Editing PRIMER objects
PRIMER objects can be edited in exactly the same way as the simple shape objects. See section 5 for more details.
If you want to modify an existing capture you can use Update capture. PRIMER will restart and replay the macro
you have recorded. Any new commands that you do will then get appended to the macro.
Page 6.12
User manual Version 12.0, October 2014
REPORTER
6.4 Program objects
6.4.1 Text output from a program
This option allow you to specify a program from which the text that would normally outputted to the standard output
will be inserted into the report by REPORTER when the report is finally generated. The program can be written in
anything you want: C, Fortran etc,a scripting language such as Perl or Python, a shell script on unix, a batch file on
windows etc. All that matters is that output which would normally be directed to stdout is captured by REPORTER. For
more details on writing programs for REPORTER please see Appendix E.
The filename of the program/script is entered in the Program: text box or clicking on the Choose... button will bring
up a File window from which to select the program/script. You can also enter variables by right clicking in the text box
which will allow you to bring up a Insert variableswindow from which to select a variable. The various text
parameters such as font and size can also be set.
The text parameters such as font, justification, size etc can be set for the text that will be captured from the program.
If the program needs arguments then any number can be added by using the Add button.
The Conditions... button (see section 10) enables the user to apply conditional formatting to the text from the
program.
The OK button will exit this window and add the new program to the template. The Cancel button will exit this
window without adding anything to the report
Page 6.13
REPORTER
User manual Version 12.0, October 2014
6.4.2 Editing program objects
Program objects can be edited in exactly the same way as the simple shape objects. See section 5 for more details.
Page 6.14
User manual Version 12.0, October 2014
REPORTER
6.5 File objects
6.5.1 Text files
To insert text from a file, select the File Text from the Insert menu.
The Choose... button allows the user to select the file by browsing the computer. The positioning and style of the text
can be changed.
The OK button will exit this screen and create the object/save the changes made.
The Cancel button will exit this screen without creating the object/saving the changes.
The text parameters such as font, justification, size etc can be set for the text that will be read from the file.
The text, background and fill colour and the border line style can be set using the style toolbar. See section 5.2 for more
details.
The margins for the textbox can be changed by using the Margins... button.
The Conditions... button (see section 10) enables the user to apply conditional formatting to the text.
By default text is not wrapped so long lines will be clipped to the width of the object. If you want text to be wrapped
onto multiple lines use the Wrap text checkbox.
Page 6.15
REPORTER
User manual Version 12.0, October 2014
6.5.2 Image files
To insert an image from a file, select the File Image from the Insert menu.
The Choose... button allows the user to select the file by browsing the computer. The positioning of the image can be
changed.
The Cropping... button can be used to crop away parts of the image from the top, bottom, left and right before
showing it. See section 5.4.2 for more details.
The OK button will exit this screen and create the object/save the changes made.
The Cancel button will exit this screen without creating the object/saving the changes.
Page 6.16
User manual Version 12.0, October 2014
REPORTER
6.6 Library objects
6.6.1 Library images
This option allows the user to
view and select an image from
the selection held in the image
library. The resolution and
positioning of the image can
also be set. The OK button will
exit this windows and add the
new object to the template. The
Cancel button will exit this
window without adding
anything to the report.
See appendix B.3 ’Standard
library images’ - to insert library
images.
Page 6.17
REPORTER
User manual Version 12.0, October 2014
6.6.2 Library program/script
This option allows you to specify a program/script from the library, the output of which will be inserted into the report
by REPORTER when the report is finally generated. (See the library object appendix for more details about using the
library)
Once you have selected this option you need to click and drag to create an area in the report where the output is to
appear. Then the relevant Insert window will be brought up.
From this window you can select the program/script you want from the program list by clicking on it with the mouse.
Depending on the program/script a number of argument boxes may appear into which you need to specify any
arguments required by the script. By right clicking or pressing Ctrl+I in these you can bring up a Insert variables
window from which to select a variable to use for the argument.
The output from the program/script can be set to a variable using the Set to variable input box or Select button.
The font properties can be set using the Text properties section. The text colour will be set to the current text colour
Page 6.18
User manual Version 12.0, October 2014
REPORTER
setting.
The Conditions... button (see section 10) enables the user to apply conditional formatting to the text.
The OK button will exit this windows and add the new object to the template. The Cancel button will exit this window
without adding anything to the report.
6.6.3 Editing library objects
Library objects can be edited in exactly the same way as the simple shape objects. See section 5 for more details.
Page 6.19
REPORTER
User manual Version 12.0, October 2014
6.7 Table objects
A table allows you to easily line things up on a page in REPORTER. To create a table drag the area on the page that
you want to be a table. The menu to the right is then mapped.
6.7.1 Changing the number of rows or columns in the table
By default a table will have 2 rows and 2 columns and initially each cell in the table will be blank. The number of rows
and/or columns is changed using the Rows and Columns spin boxes in the Attributes section. As the values are
changed the Cells section in the menu will be updated accordingly.
Page 6.20
User manual Version 12.0, October 2014
REPORTER
6.7.2 Changing the margins for cells in the table
The margins for the cells in
the table can be changed
using the margins button in
the Attributes section.
6.7.3 Seeing what is in each cell
The attributes section
of the menu shows a
simplified view of the
table in a spreadsheet
form in the Cells
section. Cells which
have text present in
them are shown using
the correct font, font
colour and size so
you can quickly see
you have the correct
settings.
Page 6.21
REPORTER
User manual Version 12.0, October 2014
6.7.4 Changing cells
To change a cell (or cells) click on the cell in the simplfified view (or multiple select using Shift and/or Ctrl). The
selected cells are highlighted in the simplified view and the Cell properties section of the menu becomes active.
The font can be changed with the Font... button and hyperlinks and conditional formatting applied to the cell text using
the Hyperlink... and Conditions... buttons.
By default all cells will have the same with and height but you can use the Width and Height spinboxes to alter the
width of this cell (and hence the width of all cells in the same column) and the height(and hence the height of all cells in
the same row). To reset widths and/or heights back to be the same use the Reset heights and Reset widths buttons
in the Attributes section.
Instead of just using text in the generated data you can run a program instead which could be a standard library program
or an external program. In this case the output from the program will be put in the table cell instead. To use a program
change the Cell type from Text to Program using the popup. Once this is done the Choose... and Library... buttons
and the Program arguments section become active
Page 6.22
User manual Version 12.0, October 2014
REPORTER
6.8 Autotable objects
An autotable object in REPORTER is a table which REPORTER will create when the report is generated. An an
example, you may want to run multiple analyses and produce a summary table with one line in a table for each analysis.
The autotable object allows you to do this.
The above image shows the menu to create a table for a set of pedestrian headform analyses. We want to create a table
with 5 columns (as shown below) ; the impact zone, the x, y, and z impact points and the calculated HIC.
Page 6.23
REPORTER
User manual Version 12.0, October 2014
To do this we would run each of the analyses and post-process them with a REPORTER template. Each analysis would
calculate the ZONE, X, Y, Z and HIC and store them as variables. These variables would then be saved to a file called
reporter_variables. The autotable object in the summary template can then pick up these
reporter_variables files and use them to create the table rows. One row will be created for each file that is read.
6.8.1 Selecting variables files for the table
To create the autotable you need to select where REPORTER will read the reporter_variables files from. This
is done in the Attributes section.
In this example REPORTER will look for any reporter_variables files recursively from the directory
/data/DEMO/CONFERENCE/PEDESTRIAN_HEAD/NCAP_RUNS_2. Alternatively you can select a file which will
contain a list of directories for REPORTER to look for any reporter_variables files. Note that for the file case
REPORTER does not look recursively from that directory, it looks in that directory only.
6.8.2 Setting the header and generated row heights
To set the height of the header row and any rows which are generated by REPORTER use the Header height and
Generated data height options in the Geometry section.
6.8.3 Adding columns to the table
To add a column to the table use the Add button in the Column properties section.
Page 6.24
User manual Version 12.0, October 2014
REPORTER
This will create a new column with the default name Column 1. This is what will be shown as the column header.
You can change the name in the Name: textbox and change the font used with the Font... button.
Once the column has been created you can decide how the data should be generated. Continuing the example above the
first column is the zone so we change the column name to ZONE. The individual analyses that were post-processed by
REPORTER saved the zone for the analysis in the variable ZONE, so for the generated data we want to input the text
%ZONE% which means the value of variable ZONE. REPORTER will first look for any variables in the
reporter_variables file. If it finds the variable then the value will be used. If REPORTER cannot find a variable
in the reporter_variables file it will then look for a variable with the same name in the current template and use
that value.
Page 6.25
REPORTER
User manual Version 12.0, October 2014
The font can be changed with the Font... button and hyperlinks (e.g. see the ZONE column in the above example
output) and conditional formatting (e.g. see the HIC column in the above example output) applied using the
Hyperlink... and Conditions... buttons.
Instead of just using text in the generated data you can run a program instead which could be a standard library program
or an external program. In this case the output from the program will be put in the table instead.
You can add as many columns to the table as necessary in exactly the same way.
Page 6.26
User manual Version 12.0, October 2014
REPORTER
6.9 Script objects
Script objects are JavaScript scripts which REPORTER can run using an embedded JavaScript interpreter. REPORTER
also extends JavaScript by defining a number of classes for things specific to REPORTER. See appendix D for a
reference to these classes.
To insert a script select the script tool and then click and drag an area on the page. This will draw the area that the script
will occupy and then map the script window:
You can load a script into the window with the Load... button and save the script to file with the Save... button.
Scripts do not make any output on the page themselves (i.e. the area on the page that the script occupies will not have
anything drawn on it from the script) but they can create output indirectly. For example, a script could create a bitmap
using the Image class in REPORTER and then this bitmap could be imported with an image file object.
As a simple example the script above print things to the logfile window using the LogPrint function. This doesn’t do
anything useful in itself, but shows how you can produce useful diagnostic messages. This generates the following
output in the logfile window.
Page 6.27
REPORTER
User manual Version 12.0, October 2014
For more information on scripting please see chapter 11.
6.10 Note objects
Note objects are used to add simple notes to your REPORTER template. They are only displayed in design view. To
add a note when in design view, click on the note icon and click on the position on the page you wish to add a note. The
following window will be mapped:
The name is what is displayed on the screen. The note is what is displayed when you hover the mouse over the note on
the screen:
Page 6.28
User manual Version 12.0, October 2014
REPORTER
Page 6.29
REPORTER
Page 6.30
User manual Version 12.0, October 2014
User manual Version 12.0, October 2014
REPORTER
7. Generating and outputting reports
7.1 Effect of object order on generating a report.
The order the various objects are layed out on a page relates to the order in which they will be processed by
REPORTER when it generates a report. So if you have a program/script that creates a variable in it’s output, that
program/script will need to be on the same page or an earlier page than the object that first uses the generated variable.
If it is on the same page it also needs to be earlier in the order of objects on the page than any objects that uses that
variable.
The following series of example shows what will and won’t work. In all the examples Object 1 (red) and Object 2
(cyan) both use a variable (VAR1) generated by Script 1 (green) as an input.
In this case Object 1 is on an earlier page than Script 1 so the variable VAR1 hasn’t been created yet. In this situation
REPORTER will give a warning and uses a blank for the variable VAR1 in Object 1. Object 2 however comes after
Script 1 so the variable VAR1 has been created and Object 2 can be generated normally
In this case Object 1 is on the same page as Script 1, but comes before it in the order of items on the page so there
variable VAR1 hasn’t been created yet. In this situation REPORTER will give a warning and uses a blank for the
variable VAR1 in Object 1. Object 2 however comes after Script 1in the order of items on the page, so the variable
VAR1 has been created, and Object 2 can be generated normally.
Page 7.1
REPORTER
User manual Version 12.0, October 2014
7.2 Generating reports
Once a report template has been created a report can be generated
by selecting the Generate option in the File menu.
Generating a file causes all of the objects on the page to perform
any necessary actions to create the output for that object. For
example:
• Text objects could expand variables into the actual values
• File objects would read the text/image file and show it
• Program objects would be "run" to generate the output.
• Tables will be created
• etc.
If any objects are to be created from D3PLOT or T/HIS then
REPORTER will start the relevant program to produce the object
and then insert the object into the report. REPORTER will also run
any specified programs/scripts and insert the output into the report
as required.
During report generation feedback is given in the status bar showing what REPORTER is doing. For example in the
image below REPORTER is currently generating output for object ’oasys21’ on page 1 and the report generation is 29%
complete.
You can stop report generation at any time by pressing the Stop button in the status bar.
To switch between the the design view (showing the report template) and the presentation view
(showing the final report) you use the layout buttons
Page 7.2
User manual Version 12.0, October 2014
REPORTER
The images below show an example of a report template before and after generating the page.
Design view before generating report
Presentation view after generating report
Page 7.3
REPORTER
User manual Version 12.0, October 2014
7.2.1 Using the cursor in presentation mode
When you first go into presentation mode after generating a template the cursor mode changes to the
"hand" cursor. In this mode you cannot select or edit any objects. The cursor is used for following
hyperlinks. This is likely to be extended to other functions in future releases of REPORTER.
You can change the mode back to the select mode in which case all of the normal operations which you can
do in design mode can be done including editing. Additionally if you choose any of the other modes you
can create new objects even though you are in presentation mode.
7.3 Outputting a generated report
REPORTER can create various types of output by using the
various write option in the File menu. Currently the types are:
• Print - print report onto a printer
• Write Report - will write the ffile as a report (images etc
included with the temple)
• Write pdf - will write an acrobat pdf file
• Write html - will write an HTML web page
• Write ppt vba - will write visual basic file for Microsoft
PowerPoint.
• Write pptx - writes a PowerPoint file directly.
7.3.1 Printing
On Windows, the Print command will bring up the standard windows printer dialog.
On unix, it will bring up
the dialog.
Page 7.4
User manual Version 12.0, October 2014
REPORTER
Extra options can be given
by pressing the Options
>> button.
The Copies tab allows
you to choose what pages
should be printed and how
many copies.
The Options tab allows
you to choose double sided
printing and black and
white or colour output.
The Properties button
allows you to set the page
size and margins.
Page 7.5
REPORTER
User manual Version 12.0, October 2014
7.3.2 Pdf files
Write pdf will save the report as a pdf (Adobe Acrobat) file. Select the name of the pdf file you want to write.
7.3.3 HTML
Write html will save the report as a html file for the web. Select the name of the html file you want to write.
REPORTER will then create a html page using frames containing the report. There will be a html file for each page in
the report and a contents page. All the necessary images and files will be placed in a subdirectory of the main html file
which is called <name>.html_files. So for example if you create a file example.html, REPORTER will create
a directory called example.html_files as well and put any extra files in there. So if you want to move the html
file to somewhere else remember to move example.html and the directory example.html_files.
7.3.4 PowerPoint files
Visual basic file for PowerPoint
REPORTER can write a visual basic macro that can be played in PowerPoint to generate a presentation.
Note. From version 11.0 REPORTER can write pptx files directly on Windows and Linux so it is recommended that
you use that method rather than using a visual basic macro. Support for writing visual basic macros may be removed in
future versions.
To create a powerpoint presentation macro follow these steps.
1. Powerpoint visual basic macros which import images can only work if the command to import the image uses the
absolute filename for the image. When REPORTER writes a visual basic macro which will use images it MUST
know the directory where this macro will be run so it can make absolute filenames for images. By default
REPORTER will assume that you will run the visual basic macro from C:\temp. This can be changed by either:
• Setting the preference reporter*vba_directory for REPORTER before you start.
• Changing the preference in REPORTER using File->preferences... See section 2.7.5 for more details.
• Changing the definition of scriptFolder at the top of the vba file that REPORTER writes.
2. Generate the report contents
3. Write a visual basic macro from REPORTER using Write ppt vba. REPORTER will write the visual basic file
and will also create a directory containing any images in your presentation. The directory name is the filename
with _images appended. e.g. if you write a file powerpoint.bas, REPORTER will create a directory
powerpoint.bas_images that contains all the images.
4. Copy/ftp the visual basic file and the directory of images to the location you specified with the
reporter*vba_directory preference in 1. above (or C:\temp which is the default if you have not
specified the preference).
5. Start PowerPoint and create a new presentation with no slides in it.
For PowerPoint versions older than PowerPoint 2007
Page 7.6
User manual Version 12.0, October 2014
6.
Start the visual basic editor by doing
Tools->Macro->Visual Basic
Editor.
7.
Import the visual basic file into the editor by doing
File->Import file and selecting the file.
8.
Return back to powerpoint by doing File->Close
and return to Microsoft Powerpoint.
REPORTER
Page 7.7
REPORTER
9.
User manual Version 12.0, October 2014
In Powerpoint do
Tools->macro->macros....
There should be a macro
called reporter. Select it
and press Run.
10. Save the powerpoint presentation.
For PowerPoint versions 2007 and higher
6.
Make sure the Developer tab is visible by clicking on the Office button
, selecting Powerpoint
Options and selecting Show Developer tab in the Ribbon in the Popular section.
Page 7.8
User manual Version 12.0, October 2014
7.
Start the visual basic editor by selecting Visual Basic from the Developer ribbon
8.
Import the visual basic file into the editor by doing
File->Import file and selecting the file.
9.
Return back to powerpoint by doing File->Close
and return to Microsoft Powerpoint.
REPORTER
10. In PowerPoint select Macros from the Developer Ribbon
Page 7.9
REPORTER
User manual Version 12.0, October 2014
There should be a macro
called reporter. Select it
and press Run.
11. Save the powerpoint presentation.
Writing PowerPoint files directly
REPORTER can write PowerPoint files directly for Windows and Linux. Older versions of REPORTER (before
version 11.0) could only do this for Windows if you had PowerPoint installed on your machine. This is no longer the
case. Since version 11 REPORTER can write PowerPoint ’pptx’ files directly for Windows and Linux.
Select Write pptx and give the name of the PowerPoint file you want to create. REPORTER will write the file.
Notes on PowerPoint output
When you use textboxes, text files and tables in REPORTER the output is clipped to the size of the object defined on
the page. PDF and HTML output also support this but it is not possible to control the size of a ’textbox’ in PowerPoint
(in PowerPoint a table is made up of a collection of ’textboxes’). When writing PowerPoint output be aware of the
following limitations.
1.
If the text is too wide to fit in the ’textbox’ it will automatically be wrapped onto multiple lines by PowerPoint.
2.
If the combined height of the text, the top margin and the bottom margin is greater than the height of the textbox
PowerPoint will increase the height of the textbox to make it hight enough.
If the Powerpoint output is not aligned correctly or is not what you see in REPORTER it is likely to be caused by these
problems. Adjusting the size of the object, the text size or the margins will help to fix any problems.
Page 7.10
User manual Version 12.0, October 2014
REPORTER
7.4 Combining output from multiple reports
If REPORTER generates several templates and saves them as reports (see section 3.4 for more details) then it is
sometimes useful to combine the output into a single pdf, html or pptx file. The easiest way to do this is to use the
REPORTER options in the SHELL. See the SHELL manual for more details.
It can also be done on the command line in REPORTER by using the -combine command line argument. For
example, if you wanted to combine the output from 3 reports to a pdf file and a PowerPoint file this could be done with
the command:
reporter11.exe -combine report1.orr report2.orr report3.orr -pdf=combined.pdf
-ppt=combined.pptx -exit
Page 7.11
REPORTER
Page 7.12
User manual Version 12.0, October 2014
User manual Version 12.0, October 2014
REPORTER
8. Working with Variables
A main feature of REPORTER is that you create a template from which a report can be generated. This allows you to
create a standard template for a project and then use that template to automatically create a report for a number of model
runs. This is mainly achieved through the use of variables.
Variables are defined with a name and a value which can be a number or a text string, for example.
Variable Name
CURRENT_PAGE
Value
2
MODEL_DIR
/data/test/ tube1
JOB_FILE
tube_test1
The main advantage of using variables is that if you have used variables when defining the various objects in the report
template, rather than having to go through the report and change all the various filenames and directory paths when you
want to generate a report from a new model, all you need to do is change the variables. This can be done manually by
editing the template in REPORTER or you could insert a program/script into the template that would calculate and
define all the necessary variables when REPORTER generates a report.
8.1 User defined variables
For example, if you want to create a report template that has a number of images that are created by a D3PLOT
command file. If you want to use the template to generate reports for a number of models, the problem is that the
various filenames and directory paths will be different for each model. e.g:
Model
Directory Path
Job Name
Crush Tube 1
/data/test/tube1
tube_test1
Crush Tube 2
/data/test/tube2
tube_test2
Crush Tube 3
/data/test/tube3
tube_test3
To get round this problem you can use a variable for the directory path called MODEL_DIR and a variable for the job
name called MODEL_NAME. When inserting the D3PLOT objects (see Section 6 for more detail about inserting
D3PLOT objects) use the variables for the directory path and job name. The variables need to be enclosed by % signs to
distinguish them from the rest of the text string.
Page 8.1
REPORTER
User manual Version 12.0, October 2014
When generating a report for Crush Tube 2 model the variables would be defined as follows:
Variable Name Value
MODEL_DIR /data/test/tube2
MODEL_NAME tube_test2
When REPORTER generates the report it will substitute in the values of the relevant variables, so the 3 text strings
would become
Bitmap File
/data/test/tube2/def.bmp
Job File
/data/test/tube2/tube_test2.ptf
Command File /data/test/deflection.tcf
To generate a report for one of the other templates all I you need to do is change the value of these 2 variables.
8.2 Predefined variables
REPORTER already has a number of variables defined. They are:
Variable
Description
CURRENT_PAGE
The current page in the report (can be used when a report is generated)
TIME
The current time (can be used when a report is generated)
DATE
The current date (can be used when a report is generated)
DEFAULT_DIR
A default directory for a job
DEFAULT_JOB
A default jobname
REPORTER_HOME The directory REPORTER is installed in
REPORTER_TEMP A temporary working directory
TOTAL_PAGES
The total number of pages (can be used when a report is generated)
To add the date to each page you can
insert a text object (see Section 5 for
more detail on text objects) with the
relevant variables substituted in.
So if the page number was 2 and the date
was Wednesday 9 April 2003 at 11:00
when the report was generated the text
string would come out as
Date Wed Apr 9 11:00:00 2003
Page 8.2
User manual Version 12.0, October 2014
REPORTER
8.3 Creating and editing variables
Variables can be viewed, edited, and created by using the Edit... option in the Variables menu. Selecting this option
will bring up the Variables window.
Some of the variable such as CURRENT_PAGE and REPORTER_HOME are standard variables that are predefined
by REPORTER. and these cannot be edited or deleted, other user defined variables can be edited or deleted as you
chose.
You can create a new variable by selecting
New. Then in the New variable box at the
bottom of the window enter the necessary
details into the text boxes.
•
•
•
Variable name - enter the variable name you want to use to refer to this variable. Variable names should only
use letter (A-Z) or numbers (0-9) and underscores. REPORTER will automatically convert the name into
uppercase and replace any spaces with underscores when the new variable is created.
Variable description - enter the description for the variable. This is only for reference and is not actually
used by REPORTER. However, it is strongly recommended that you give meaningful descriptions for variables.
Variable value - enter the value for the variable. This can be any text string or number you want.
Page 8.3
REPORTER
•
User manual Version 12.0, October 2014
Variable type - the variable type allows you to give an indication what the variable will be used for. The
following types are predefined in REPORTER.
• Directory
• Expression
• File(absolute)
• File(basename)
• File(extension)
• File(tail)
• General
• Number
• String
Additionally you can give your own variable types if it helps you to manage variables. The Directory and
File types also allow you to choose a directory/file interactively using the Browse... button. The different
File types allow you to extract certain parts of the filename from the file you choose. For example selecting a
file ’/data/demo/test.key’ by using Browse... would result in the following:
Variable type Part of file that is extracted
File(absolute)
/data/demo/test.key
File(basename) test
File(extension) key
•
File(tail)
test.key
Format - the format settings allow you to specify how the variable value is displayed within the REPORTER
presentation view. Available options are:
• Floating point number - displays a number variable as a floating point number. The number of decimal
places can be specified using the precision setting.
• Scientific number - displays a number variable as a scientific number. The number of decimal places can
be specified using the precision setting.
• General number - this uses the shorter of the floating point or scientific methods above..
• Integer - displays a number variable as an integer.
• Uppercase - displays a string type variable in uppercase.
• Lowercase - displays a string type variable in lowercase.
The setting used here is applied to everywhere the variable is displayed in the report, unless a local format
setting is used. The format setting does not change the underlying value of the variable.
You then click on the OK button to store this new variable. The Cancel button will just exit you from this window.
The only variables which can be edited are the user defined ones you create yourself. To edit a variable select the
Variable option in the File menu to bring up the Variables window. You can edit the description or value of a
variable by clicking on the relevant description or value in the variable list and pressing Edit. You cannot edit the
variable name. If you want to rename the variable you will have to delete the existing variable and re-create it using the
new name.
For more information on doing simple maths with variables (by using the expression type) see section 8.12.
8.4 Creating a variable using an external program/script
Rather than using the Variables window to create and define a variable it is also possible to use a program/script to
create a variable. (See Appendix E for some examples of programs/scripts)
When REPORTER generates a report and it runs an external program/script, any output lines that take the form
VAR <NAME> VALUE="<value>" DESCRIPTION="<description>"
or
VAR <NAME> VALUE="<value>"
will not inserted into the report as text but will be used to create a variable where
• <NAME> - will become the variable name
• <value> - will become the value of the variable
• <description> - will become the variable description
here are a couple of examples
Program/Script Output
Variable Name Description Value
VAR MODEL_DIR VALUE="/data/test"
MODEL_DIR
VAR SPEED VALUE="1000" DESCRIPTION="Impact Speed" SPEED
Page 8.4
(none)
/data/test
Impact speed 1000
User manual Version 12.0, October 2014
REPORTER
So if you inserted a program/script object "Text output from a program/script" (see Section 9 for more detail on
inserting program/script objects) that’s output was
VAR SPEED VALUE="1000"
then REPORTER would create a variable called SPEED with the value 1000, and because there is no other output then
the inserted text object would come up blank when the report was generated. If the output however was
VAR SPEED VALUE="1000"
Impact Speed: %SPEED%
then REPORTER would create a variable called SPEED with the value 1000, and also create the following text object
with the new variable SPEED substituted in.
Impact Speed: 1000
8.5 Creating a variable using a FAST-TCF script
Rather than using the Variables window to create and define a variable it is also possible for a FAST-TCF script to
create and define variables. You can create a variable in FAST-TCF from one of the following curve results. (See the
FAST-TCF section of the T/HIS manual for more details)
Property output
keyword
Minimum x
Maximum x
Minimum y
minx
maxx
min
X at minimum y
xatmin
Y at minimum x
yatmin
Minimum y in window t1 t2
minw
X at minimum y in window t1 t2
xminw
Maximum y
max
X at maximum y
xatmax
Y at maximum x
yatmax
Maximum y in window t1 t2
maxw
X at maximum y in window t1 t2
xmaxw
Average in window t1 t2
ave
Hic
Hicd
3ms
Y at X
hic
hicd
3ms
yatx
X when Y is passed after gate time xygate
X at first non-zero Y
X at last non-zero Y
Y value at last non-zero Y
xnonz
xfail
yfail
TTI
tti
The values for these results need to have already been calculated in the script before you use them to create a variable.
The syntax to create a variable takes one of these two forms:
var <NAME> <curve> <result> <description>
or
var <NAME> <curve> <result>
• <NAME> - will become the variable name
• <curve> - is the curve tag or number
• <result> - is the result type (min,max,ave,hic,hicd,3ms)
• <description> - will become the variable description
REPORTER will set the value of the variable to be the value of the result type for the specified curve. Here are a couple
Page 8.5
REPORTER
User manual Version 12.0, October 2014
of examples
FAST-TCF data
FAST-TCF script
Curve
No.
Value of the result (Result
Type)
REPORTER data
Variable
Description Value
Name
var DEFORM 1 ave
1
20 (ave)
DEFORM
(none)
20
var SPEED 2 max Impact
Speed
2
1000 (max)
SPEED
Impact
speed
1000
8.6 Creating a variable from the command line
Variables can be defined in REPORTER when starting from the command line with the -var option. For example to
define variable MODEL_DIR you could do:
reporter11.exe -varMODEL_DIR=/data/test/tube1
If the variable contains spaces then it must be quoted.
reporter11.exe -varMODEL_DIR="C:\directory with spaces\tube1"
You can also specify the variable type on the command line if required. For more details see appendix A.
8.7 Creating a variable from javascript
You can create variables from javascript scripts in REPORTER with the Variable constructor. For example
var fred = new Variable(reporter.currentTemplate, "MODEL_DIR", "current model
directory", "/data/test1");
For more details see the Variable javascript reference.
8.8 Deleting a variable
You can delete an user defined variable by clicking on the Delete button when the relevant variable in the variable list
is selected. Please note that this will delete the variable without bringing up any conformation box.
Page 8.6
User manual Version 12.0, October 2014
REPORTER
8.9 Inserting a variable
Certain inputs for such things as
filenames, text, and program/script
arguments can use variables rather
than a straight text string. You can
insert a variable at the current
cursor position by right clicking on
the text box
From the popup menu select
Insert variable.
An Insert variable window from which you can select the variable will then be brought up.
Page 8.7
REPORTER
User manual Version 12.0, October 2014
From this window you select the variable you want from the list and click on the OK button to insert the variable and
exit this window. The Cancel button will exit this window with out inserting a variable.
Note in this panel you can set a local format setting for the variable. This is a format that is applied to this instance of
variable when viewed in presentation model. The available options are:
• Floating point number - displays a number variable as a floating point number. The number of decimal places
can be specified using the precision setting.
• Scientific number - displays a number variable as a scientific number. The number of decimal places can be
specified using the precision setting.
• General number - this uses the shorter of the floating point or scientific methods above..
• Integer - displays a number variable as an integer.
• Uppercase - displays a string type variable in uppercase.
• Lowercase - displays a string type variable in lowercase.
This local format setting overrides any global format setting for this variable specified on the main variables panel.
However, the format set here is only applied to this instance of the variable.
Page 8.8
User manual Version 12.0, October 2014
REPORTER
When entered into a text string the variable needs to be enclosed by % signs put at either end of the variable name to
distinguish it from the rest of the text string. In this example the variable CURRENT_PAGE has appeared in the text box
as%CURRENT_PAGE% .
8.9.1 Manually inserting a variable
It is also possible for you to manually enter a variable in by simply typing in the variable name enclosed by % signs.
When the report is generated the %CURRENT PAGE% part of the text string will be replaced with the value of the
variable. If a local format is set, this will be displayed within the % signs.
8.9.2 Controlling the precision/decimal places of a variable
The precision of a variable can be set in the Insert variable window when inserting it. See the section above on
variable format. Alternatively the precision can be set when typing in the variable.
For example, for a variable called ACCELERATION, if a local format of a two decimal place floating point number is
specified, the variable ACCELERATION will appear as %ACCELERATION(2f)%. When generated, this will
appear as the formatted value. A complete list of the formats is available in the table below.
Format
Fixed
Exponential / scientific
General. uses exponential format or fixed format (whichever is the most
concise)
Integer
Lower case
Upper case
Example
Input
string
%NAME(2f)% 1234.5678
12.345678
%NAME(2e)%1234.5678
12.345678
%NAME(2g)%1234.5678
12.345678
%NAME(i)% 1234.5678
12.345678
%NAME(s)% Reporter
%NAME(S)% Reporter
Output
string
1234.56
12.35
1.23e+03
1.23e+01
1.23e+03
12
1235
12
reporter
REPORTER
Page 8.9
REPORTER
User manual Version 12.0, October 2014
8.10 Using variables in D3PLOT and T/HIS command files
and FAST-TCF scripts.
It is also possible to use variables in a D3PLOT or T/HIS command file or FAST-TCF script that is referred to by a
D3PLOT or T/HIS object inserted in the template (see Section 6 for more details on inserting D3PLOT and T/HIS
objects).
8.10.1 Command files
For a command file you will need to first create the command file using an actual value for the variable and then
manually edit the command file to replace this value with the variable name enclosed in % signs.
Example
For example, if you have a simple T/HIS command file that reads in a THF file, creates a curve of x displacement for
node 30, and then creates a bitmap image of the curve.
READ
31
3
2
3
0
0
0
0
THF
32
3
2
11
0
0
0
0
cube5.thf
4
3
6
5
0
0
0
0
Nodes
4
3
2
12
0
0
0
0
Node 30
3
4
3
14
0
0
0
0
APPLY
5
3
2
2
0
0
0
0
PLOT
1
3
2
1
0
0
0
0
IMAGES
31
3
2
15
0
0
0
0
cube5.bmp
38
3
6
12
0
0
0
0
CAPTURE
38
3
2
25
0
0
0
0
I you want to use the variable MODEL_NAME for the filenames instead of cube5, and the variable NODE instead of the
node number 30. manually edit the command file to give the following. (Note that the position of the numbers on the
right hand side should not modified)
READ
31
3
2
3
0
0
0
0
THF
32
3
2
11
0
0
0
0
%MODEL_NAME%.thf
4
3
6
5
0
0
0
0
Nodes
4
3
2
12
0
0
0
0
Node %NODE%
3
4
3
14
0
0
0
0
APPLY
5
3
2
2
0
0
0
0
PLOT
1
3
2
1
0
0
0
0
IMAGES
31
3
2
15
0
0
0
0
%MODEL_NAME%.bmp
38
3
6
12
0
0
0
0
CAPTURE
38
3
2
25
0
0
0
0
8.10.2 FAST-TCF scripts
For a FAST-TCF script when you enter the script you need to replace the relevant parts with the variable name
enclosed in % signs
Example
For example, a simple FAST-TCF script that will do the same thing as the T/HIS command file above.
node 30 disp x tag XDISP
bitmap cube5.bmp XDISP
So to make the same changes as the T/HIS command file above (substituting in the variables MODEL_NAME and NODE)
gives the following.
Node%NODE% disp x tag XDISP
bitmap %MODEL_NAME%.bmp XDISP
Page 8.10
User manual Version 12.0, October 2014
REPORTER
8.11 Saving all the variables to a file after generating a
report
After REPORTER generates a report, it can automatically save any variables to a file. The file will be called
reporter_variables. This can be very useful for processing multiple analyses. For example, you could perform
several analyses which all dump their variables to a file, and then a summary template could create a table using these
files (see section 6 .5 for more details).
At the bottom of the variables window there is a checkbox to turn on this option. You can then give a directory to save
the variables into.
You can select the directory or use a variable if required. The directory defaults to %DEFAULT_DIR% and is on by
default.
8.12 Variable expressions
Sometimes it is useful to do some simple maths on variables in REPORTER. Creating a script to do something this
simple is tedious. If you use the Expression variable type then REPORTER will evaluate this when required to
produce the result. For example assume that you have 2 variables, FORCE and AREA and you want to calculate a stress.
You can do this by:
1.
Make a new variable STRESS.
2.
Set the type to Expression.
3.
Give the value %FORCE%/%AREA% (see secion 8.3 for more details) by either typing directly or using the right
mouse button and Inserting variables with the menu.
Then if you have some text in the report such as "The stress is %STRESS%" REPORTER will evaluate the stress as
required.
The expression can contain +, -, / and * to do addition, subtraction, division and multiplication respectively and can use
brackets to enforce which order the expression is evaluated in. The expression is actually evaluated as a JavaScript
program so more complex expressions can be formed by using the standard JavaScipt functions (e.g. the Math class).
e.g. the following are all valid expressions
• %FORCE%/%AREA%
• Math.sqrt(%X%*%X% + %Y%*%Y%)
• Math.min(%X%, %Y%) * Math.sin(Math.PI)
Page 8.11
REPORTER
User manual Version 12.0, October 2014
8.12.1 Rounding values in variable expressions
As the expression is evaluated as a JavaScript program (see the previous section) we can use some of the core functions
in JavaScript to alter the variable value. For example, in our example of calculating a variable STRESS from an
expression %FORCE%/%AREA% this could have a large number of significant figures in the result.
E.g. if FORCE=10 and AREA=3 then stress is 3.33333333333333 which is far more significant figures than we require.
We can use the core JavaScript function toFixed() to change the number of digits to appear after the decimal point. If
we wanted 2 decimal places then we could change the expression to
(%FORCE% / %AREA%).toFixed(2)
which would change the value of STRESS to 3.33.
Other useful functions are:
• toExponential(n) which formats the number in exponential (scientific) notation with n digits after the decimal
point.
• toPrecision(n) which formats the number with n significant figures.
Page 8.12
User manual Version 12.0, October 2014
REPORTER
9. Hyperlinks
REPORTER currently allows you to create hyperlinks from the following object types
• Text objects
• Image objects
• Table cells
• D3Plot images with external data plots (’blob’ plots).
9.1 Adding basic hyperlinks
Objects that support hyperlinks will have a Hyperlink... button. Pressing it maps the hyperlink window.
REPORTER can write HTML and pdf and can also save a generated report. As all of these formats support hyperlinks
you cannot give a single hyperlink that will work for all of the formats. For this reason REPORTER allows you to give
different links for each type. For example in the image below the link is different for each type. If you do not want links
for a particular type then leave it blank.
Hyperlinks can be relative or absolute (if you use a relative hyperlink then it is relative to the current document).
9.2 Adding hyperlinks in D3PLOT external data (blob) plots
The data file which D3PLOT uses to create blob plots supports hyperlinks. This enables the user to be able to click on
one of the data values on the image and open the report for that data point. The easiest way to create a data file for
D3PLOT is with one of the D3PLOT data file library scripts. e.g. below shows the script for generating a data file from
reporter_variables files.
Page 9.1
REPORTER
User manual Version 12.0, October 2014
Arguments 7, 8 and 9 allow you to give your hyperlinks in exactly the same way as a basic hyperlink.
Page 9.2
User manual Version 12.0, October 2014
REPORTER
10. Conditional formatting
Conditional formatting can be used in REPORTER to change how text is displayed, depending on if a specific
condition has been met. This is very similar to the conditional formatting in Microsoft Excel, but REPORTER can use
as many conditions as you wish per object instead of the limit of 3 imposed by Excel.
Conditional formatting is currently supported for the following object types:
• Text
• Programs/scripts returning text
• Text files
• Table cells
• Text boxes
For example you may want to change the colour of a number in a report depending on the value.
Red if the value is greater than 100
Blue if the number is between 50 and 100
Green if the number is less than 50
This is very easy to do in REPORTER.
10.1. Adding a condition
To add a condition for an object, press the Condition button. This will start the conditional formatting window.
Conditions can be added and removed by using the Add and Remove buttons. If you have more than one condition,
they are tested in the order shown. If the first condition passes the test then that is used, otherwise the second is tested
etc. If none of the conditions pass the default font properties for the object are chosen. As the order that they are
evaluated is important you can use the Move up and Move down buttons to change the order.
Once a condition has been added it is given a default name and the condition type is initially set to ’is equal to’
Choose the condition type that you want (see the next section for details) and give the necessary values. For example in
the image below the condition will be true if the value is a number between 10.0 and 100.0.
Page 10.1
REPORTER
User manual Version 12.0, October 2014
Once you have the correct condition type, the Format... button can be used to select the font properties that you want
to assign for this condition. In the window (shown below) you can set the font, the style, justification, font size and
colour properties.
When you change the font properties, the preview updates to show what the text will look like for this condition.
Additionally you can rename the condition to a more meaningful name if required. e.g. in the image below we have
made a condition called Danger which will format the text in bold red if the value is a number between 10 and 100.
This process can be repeated as necessary to add as many conditions as you wish.
Page 10.2
User manual Version 12.0, October 2014
REPORTER
10.2. Condition types
Condition
type
Description
is equal to
Treats the value as a string. Strips leading and trailing white space from the string and compares it
to the conditon value. TRUE if the strings are identical. This can also be used to compare integers
but should not be used to compare floating point numbers.
is not equal to
As above, but TRUE if the strings are different
is greater than
Treats the value is a real number. It first tries to convert the value and the condition value to real
numbers. If this fails the condition is FALSE. If it succeeds then the condition is TRUE if the value
is greater than the condition value.
is less than
As above, but TRUE if the value is less than the condition value.
is between
As above, but TRUE if the value is between the two condition values.
is not between
As above, but TRUE if the value is not between the two condition values.
contains string
Treats the value as a string. TRUE if the value contains the condition string.
does not
contain string
Treats the value as a string. TRUE if the value does not contain the condition string.
matches regex
Treats the value as a regular expression. TRUE if the regular expression matches.
does not
match regex
Treats the value as a regular expression. TRUE if the regular expression does not match.
10.2.1 Regular expressions
REPORTER understands most of the basic operators of perl regular expressions. This section gives a brief introduction
into regular expressions (or regexps). For more details please see a suitable book on regular expressions such as
Programming Perl.
Regexps are built up from expressions, quantifiers, and assertions. The simplest form of expression is simply a
character, e.g. x or 5. An expression can also be a set of characters. For example, [ABCD], will match an A or a B or a
C or a D. As a shorthand we could write this as [A-D]. If we want to match any of the captital letters in the English
alphabet we can write [A-Z]. A quantifier tells the regexp engine how many occurrences of the expression we want,
e.g. x{1,1} means match an x which occurs at least once and at most once. We’ll look at assertions and more complex
expressions later.
We’ll start by writing a regexp to match integers in the range 0 to 99. We will require at least one digit so we will start
with [0-9]{1,1} which means match a digit exactly once. This regexp alone will match integers in the range 0 to 9. To
match one or two digits we can increase the maximum number of occurrences so the regexp becomes [0-9]{1,2}
meaning match a digit at least once and at most twice. However, this regexp as it stands will not match correctly. This
regexp will match one or two digits within a string. To ensure that we match against the whole string we must use the
anchor assertions. We need ^ (caret) which when it is the first character in the regexp means that the regexp must match
from the beginning of the string. And we also need $ (dollar) which when it is the last character in the regexp means
that the regexp must match until the end of the string. So now our regexp is ^[0-9]{1,2}$. Note that assertions, such as
^ and $, do not match any characters.
If you’ve seen regexps elsewhere they may have looked different from the ones above. This is because some sets of
characters and some quantifiers are so common that they have special symbols to represent them. [0-9] can be replaced
with the symbol \d. The quantifier to match exactly one occurrence, {1,1}, can be replaced with the expression itself.
This means that x{1,1} is exactly the same as x alone. So our 0 to 99 matcher could be written ^\d{1,2}$. Another way
of writing it would be ^\d\d{0,1}$, i.e. from the start of the string match a digit followed by zero or one digits. In
practice most people would write it ^\d\d?$. The ? is a shorthand for the quantifier {0,1}, i.e. a minimum of no
occurrences a maximum of one occurrence. This is used to make an expression optional. The regexp ^\d\d?$ means
"from the beginning of the string match one digit followed by zero or one digits and then the end of the string".
Our second example is matching the words ’mail’, ’letter’ or ’correspondence’ but without matching ’email’, ’mailman’,
’mailer’, ’letterbox’ etc. We’ll start by just matching ’mail’. In full the regexp is, m{1,1}a{1,1}i{1,1}l{1,1}, but since
each expression itself is automatically quantified by {1,1} we can simply write this as mail; an ’m’ followed by an ’a’
Page 10.3
REPORTER
User manual Version 12.0, October 2014
followed by an ’i’ followed by an ’l’. The symbol ’|’ (bar) is used for alternation, so our regexp now becomes
mail|letter|correspondence which means match ’mail’ or ’letter’ or ’correspondence’. Whilst this regexp will find the
words we want it will also find words we don’t want such as ’email’. We will start by putting our regexp in parentheses,
(mail|letter|correspondence). Parentheses have two effects, firstly they group expressions together and secondly they
identify parts of the regexp that we wish to capture. Our regexp still matches any of the three words but now they are
grouped together as a unit. This is useful for building up more complex regexps. It is also useful because it allows us to
examine which of the words actually matched. We need to use another assertion, this time \b "word boundary":
\b(mail|letter|correspondence)\b. This regexp means "match a word boundary followed by the expression in parentheses
followed by another word boundary". The \b assertion matches at a position in the regexp not a character in the regexp.
A word boundary is any non-word character such as a space a newline or the beginning or end of the string.
For our third example we want to replace ampersands with the HTML entity ’&’. The regexp to match is simple: &, i.e.
match one ampersand. Unfortunately this will mess up our text if some of the ampersands have already been turned into
HTML entities. So what we really want to say is replace an ampersand providing it is not followed by ’amp;’. For this
we need the negative lookahead assertion and our regexp becomes: &(?!amp;). The negative lookahead assertion is
introduced with ’(?!’ and finishes at the ’)’. It means that the text it contains, ’amp;’ in our example, must not follow the
expression that preceeds it.
Characters and Abbreviations in regular expressions
Element
Meaning
c
Any character represents itself unless it has a special regexp meaning. Thus c matches the character c.
\c
A character that follows a backslash matches the character itself except where mentioned below. For
example if you wished to match a literal caret at the beginning of a string you would write \^.
\a
This matches the ASCII bell character (BEL, 0x07).
\f
This matches the ASCII form feed character (FF, 0x0C).
\n
This matches the ASCII line feed character (LF, 0x0A, Unix newline).
\r
This matches the ASCII carriage return character (CR, 0x0D).
\t
This matches the ASCII horizontal tab character (HT, 0x09).
\v
This matches the ASCII vertical tab character (VT, 0x0B).
\xhhhh
This matches the Unicode character corresponding to the hexadecimal number hhhh (between 0x0000 and
0xFFFF). \0ooo (i.e., \zero ooo) matches the ASCII/Latin-1 character corresponding to the octal number
ooo (between 0 and 0377).
. (dot)
This matches any character (including newline).
\d
This matches a digit.
\D
This matches a non-digit.
\s
This matches a whitespace.
\S
This matches a non-whitespace.
\w
This matches a word character
\W
This matches a non-word character
Sets of Characters
Square brackets are used to match any character in the set of characters contained within the square brackets. All the
character set abbreviations described above can be used within square brackets. Apart from the character set
abbreviations and the following two exceptions no characters have special meanings in square brackets.
Page 10.4
User manual Version 12.0, October 2014
REPORTER
^
The caret negates the character set if it occurs as the first character, i.e. immediately after the opening square
bracket. For example, [abc] matches ’a’ or ’b’ or ’c’, but [^abc] matches anything except ’a’ or ’b’ or ’c’.
-
The dash is used to indicate a range of characters, for example [W-Z] matches ’W’ or ’X’ or ’Y’ or ’Z’.
Using the predefined character set abbreviations is more portable than using character ranges across platforms and
languages. For example, [0-9] matches a digit in Western alphabets but \d matches a digit in any alphabet.
Quantifiers
By default an expression is automatically quantified by {1,1}, i.e. it should occur exactly once. In the following list E
stands for any expression. An expression is a character or an abbreviation for a set of characters or a set of characters in
square brackets or any parenthesised expression.
E?
Matches zero or one occurrence of E. This quantifier means "the previous expression is optional" since it
will match whether or not the expression occurs in the string. It is the same as E{0,1}. For example dents?
will match ’dent’ and ’dents’.
E+
Matches one or more occurrences of E. This is the same as E{1,MAXINT}. For example, 0+ will match ’0’,
’00’, ’000’, etc.
E*
Matches zero or more occurrences of E. This is the same as E{0,MAXINT}. The * quantifier is often used
by a mistake. Since it matches zero or more occurrences it will match no occurrences at all. For example if
we want to match strings that end in whitespace and use the regexp \s*$ we would get a match on every
string. This is because we have said find zero or more whitespace followed by the end of string, so even
strings that don’t end in whitespace will match. The regexp we want in this case is \s+$ to match strings
that have at least one whitespace at the end.
E{n}
Matches exactly n occurrences of the expression. This is the same as repeating the expression n times. For
example, x{5} is the same as xxxxx. It is also the same as E{n,n}, e.g. x{5,5}.
E{n,}
Matches at least n occurrences of the expression. This is the same as E{n,MAXINT}.
E{,m}
Matches at most m occurrences of the expression. This is the same as E{0,m}.
E{n,m}
Matches at least n occurrences of the expression and at most m occurrences of the expression.
(MAXINT is implementation dependent but will not be smaller than 1024.)
If we wish to apply a quantifier to more than just the preceding character we can use parentheses to group characters
together in an expression. For example, tag+ matches a ’t’ followed by an ’a’ followed by at least one ’g’, whereas (tag)+
matches at least one occurrence of ’tag’.
Note that quantifiers are "greedy". They will match as much text as they can. For example, 0+ will match as many zeros
as it can from the first zero it finds, e.g. ’2.0005’.
Assertions
Assertions make some statement about the text at the point where they occur in the regexp but they do not match any
characters. In the following list E stands for any expression.
^
The caret signifies the beginning of the string. If you wish to match a literal ^ you must escape it by writing
\^. For example, ^#include will only match strings which begin with the characters ’#include’. (When the
caret is the first character of a character set it has a special meaning, see Sets of Characters.)
$
The dollar signifies the end of the string. For example \d\s*$ will match strings which end with a digit
optionally followed by whitespace. If you wish to match a literal $ you must escape it by writing \$.
\b
A word boundary. For example the regexp \bOK\b means match immediately after a word boundary (e.g.
start of string or whitespace) the letter ’O’ then the letter ’K’ immediately before another word boundary (e.g.
end of string or whitespace). But note that the assertion does not actually match any whitespace so if we
write (\bOK\b) and we have a match it will only contain ’OK’ even if the string is "Its OK now".
Page 10.5
REPORTER
User manual Version 12.0, October 2014
\B
A non-word boundary. This assertion is true wherever \b is false. For example if we searched for \Bon\B in
"Left on" the match would fail (space and end of string aren’t non-word boundaries), but it would match in
"tonne".
(?=E)
Positive lookahead. This assertion is true if the expression matches at this point in the regexp. For example,
const(?=\s+char) matches ’const’ whenever it is followed by ’char’, as in ’static const char *’. (Compare with
const\s+char, which matches ’static const char *’.)
(?!E)
Negative lookahead. This assertion is true if the expression does not match at this point in the regexp. For
example, const(?!\s+char) matches ’const’ except when it is followed by ’char’.
Page 10.6
User manual Version 12.0, October 2014
REPORTER
11. Scripting
REPORTER has a JavaScript interpreter embedded in it to enable you to perform complex operations through scripts.
There are currently 3 ways to run a script in REPORTER.
• Running a library script installed in the /library/scripts directory.
• Inserting a script object onto a page. This does not create any direct output itself, but can create output which
other objects in the template use.
• Running a script from the command line with the -script option.
While most people associate JavaScript with web pages and html it is a full-featured programming language.
Additionally JavaScript is not Java! JavaScript is completely unrelated to Java.
Hopefully, enough people are familiar enough with JavaScript through the internet to be able to use it in REPORTER.
JavaScript has all of the functionality you would expect from a programming language, such as:
• variables (strings, numbers, booleans, objects, arrays)
• functions
• control flow statements such as if, while, do, for, switch etc.
• objects
• arrays
• regular expressions
• maths functions (sin cos, log, sqrt etc)
Additionally, REPORTER extends JavaScript by defining several new object classes specifically for REPORTER. A
detailed reference on these classes is given the JavaScript class reference appendix. Over time this functionality may be
extended. If you need to do something which is not possible with the current functionality then contact Oasys Ltd.
This chapter is not intended to be an introduction or a tutorial for JavaScript. There are many resources on the web for
that. However a few examples are given to show the sort of things that are possible with scripts. Additionally, there are
several good books on JavaScript. Highly recommended is JavaScript, The Definitive Guide by David Flanagan,
published by O’Reilly, ISBN: 0-596-00048-0.
Probably the best way to see what sort of things are easily possible in REPORTER using JavaScript is to look at the
library scripts which are given out with REPORTER in the /library/scripts directory. For more details of the scripts see
the library scripts appendix.
11.1 Example scripts
Example 1: Percent change in two values
Problem
Take two input variables VALUE and VALUE_BASE
Calculate new variable PERCENT = 100*(VALUE - VALUE_BASE) / VALUE_BASE)
Check if VALUE_BASE=0 and if so don’t do the division but set PERCENT to 100
Solution
var percent;
// Get variable values from template
var value = reporter.currentTemplate.GetVariableValue("VALUE");
var base_value = reporter.currentTemplate.GetVariableValue("VALUE_BASE");
// Check that the variables exist
if (value == null) throw Error("no VALUE variable\n");
if (base_value == null) throw Error("no VALUE_BASE variable\n");
// Extract numbers from variables
var v = parseFloat(value);
var bv = parseFloat(base_value);
// Check that the variables are valid numbers
Page 11.1
REPORTER
User manual Version 12.0, October 2014
if (isNaN(v)) throw Error("VALUE " + value + " is not a valid number\n");
if (isNaN(bv)) throw Error("VALUE_BASE " + base_value + " is not a valid
number\n");
// Check for zero (very small) base value
if (Math.abs(bv) < 1.0e-20)
percent = 100;
else
percent = 100*((v-bv)/bv);
// Create new variable PERCENT
var pvar = new Variable(reporter.currentTemplate, "PERCENT",
"Percent change", percent.toFixed(2));
Discussion
Variables in REPORTER are stored in each template so to get the values of the variables VALUE and VALUE_BASE we
need to get the template that we are using. The easiest way to do this is to use the currentTemplate property of the
reporter object that is created when REPORTER starts. Once we have the template there is a method
GetVariableValue that allows us to get a variable value.
GetVariableValue returns the value of the variable as a string or null is the variable does not exist. We can easily
check for this and terminate with an error if the variable is missing.
We want to get the numerical values of the variables and check if they are valid numbers. The standard javascript
functions parseFloat() and isNaN()allow us to do this.
To check if the value is zero (or very small) we use the standard Math.abs() function and calculate a value
accordingly.
To create a new variable we use the Variable constructor. This takes the template, the variable name, description and
value as arguments. Finally, maths in javascript is performed in double precision so the value we calculated will be
given to many significant figures. We are not interested in this so we use the standard Number.toFixed() function
to limit the number of decimal places to 2.
The source code for this example is available here.
Example 2: Magnitude from the three vector components
Problem
Given three variables X, Y and Z calculate the vector magnitude and store it in a variable LENGTH.
Solution
// Get variable values from template
var x = reporter.currentTemplate.GetVariableValue("X");
var y = reporter.currentTemplate.GetVariableValue("Y");
var z = reporter.currentTemplate.GetVariableValue("Z");
//
if
if
if
Check
(x ==
(y ==
(z ==
that the variables exist
null) throw Error("no X variable\n");
null) throw Error("no Y variable\n");
null) throw Error("no Z variable\n");
// Extract numbers from variables
var X = parseFloat(x);
var Y = parseFloat(y);
var Z = parseFloat(z);
//
if
if
if
Check that
(isNaN(X))
(isNaN(Y))
(isNaN(Z))
the variables are valid numbers
throw Error("X " + x + " is not a valid number\n");
throw Error("Y " + y + " is not a valid number\n");
throw Error("Z " + z + " is not a valid number\n");
// Calculate magnitude
Page 11.2
User manual Version 12.0, October 2014
REPORTER
var length = Math.sqrt(X*X + Y*Y + Z*Z);
// Check for valid magnitude
if (isNaN(length)) throw Error("Bad vector magnitude\n");
// Create new variable LENGTH
var lvar = new Variable(reporter.currentTemplate, "LENGTH",
"vector magnitude", length);
Discussion
This is done using very similar methods to example 1. The only differences here are using the function Math.sqrt()
and we do not use the standard Number.toFixed() function as the length could be smaller than 2 decimal places.
Instead we could use Number.toPrecision() or Number.toExponential() if we wanted to format the
result instead of leaving it with several decimal places.
The source code for this example is available here.
Example 3: Setting a character variable according to the result of a
calculation
Problem
Input variable = PERCENT
If (abs(PERCENT) < 5.0) then new variable RESULT = ’OK’
otherwise ’not OK’
Solution
var result;
// Get variable value from template
var percent = reporter.currentTemplate.GetVariableValue("PERCENT");
// Check that the variable exist
if (percent == null) throw Error("no PERCENT variable\n");
// Extract number from variable
var p = parseFloat(percent);
// Check that the variable is a valid number
if (isNaN(p)) throw Error("PERCENT " + percent + " is not a valid number\n");
// Check for less than 5
if (Math.abs(p) < 5.0)
result = "OK";
else
result = "not OK";
// Create new variable RESULT
var rvar = new Variable(reporter.currentTemplate, "RESULT",
"is it OK?", result);
Discussion
This uses exactly the same methods as examples 1 and 2. The only difference is that the value used in the Variable
constructor is a character string, not a number.
The source code for this example is available here.
Page 11.3
REPORTER
User manual Version 12.0, October 2014
Example 4: Reading a T/HIS curve file and operating on it
Problem
input variables = CURVE_FILE and GATE_TIME.
read the T/HIS curve file, calculate average y-value of all points that occur after x-value=GATE_TIME. Return the
average in a new variable Y_AVERAGE
Solution
var count, line, x, y, X, Y, ytot, ny;
// Get variable values from template
var curveFile = reporter.currentTemplate.GetVariableValue("CURVE_FILE");
var gateTime = reporter.currentTemplate.GetVariableValue("GATE_TIME");
// Check that the variables exist
if (curveFile == null) throw Error("no CURVE_FILE variable\n");
if (gateTime == null) throw Error("no GATE_TIME variable\n");
// Check curve file exists
if (!File.Exists(curveFile)) throw Error("Curve file " + curveFile + " does not
exist\n");
// Check gateTime is a valid number
var t = parseFloat(gateTime);
if (isNaN(t)) throw Error("Gate time " + gateTime + " is not a valid number\n");
// create a new File object
var file = new File(curveFile, File.READ);
// Zero variables
count = 0;
ytot = 0;
ny = 0;
// Keep reading lines from the file until we get to the end of the file
while ( (line = file.ReadLine() ) != File.EOF)
{
if (line.charAt(0) == ’$’)
continue;
else if (line.match(/CONTINUE/))
break;
else
{
count++;
// Skip the four title lines at the top of the curve file
if (count > 4)
{
// strip leading and trailing apaces
line = line.replace(/^\s+/, "");
line = line.replace(/\s+$/, "");
result = line.match(/([0-9eE+\-\.]+)\s*,?\s*([0-9eE+\-\.]+)/);
if (result != null)
{
x = result[1];
y = result[2];
// Extract numbers
X = parseFloat(x);
Y = parseFloat(y);
// Check that they are valid numbers
if (isNaN(X)) throw Error("X " + x + " is not a valid
number\n");
if (isNaN(Y)) throw Error("Y " + y + " is not a valid
number\n");
Page 11.4
User manual Version 12.0, October 2014
REPORTER
// If greater than gate time then include value
if (X > t)
{
ny++;
ytot += Y;
}
}
}
}
}
// Close the file
file.Close();
// If we have read any values calculate average and set variable
if (ny)
{
ytot /= ny;
// Create new variable LENGTH
var ave = new Variable(reporter.currentTemplate, "Y_AVERAGE",
"average Y value", ytot);
}
Discussion
This example uses the File class which REPORTER defines to read the T/HIS curve file. The function
File.Exists() can be used to test if a filename is valid. Then the File constructor, ReadLine() and
Close() functions are used to read the data from the file.
To extract the xy data pairs from the file we use a regular expression. This is perhaps the most complicated part of the
program. We want to be able to read x and y values that can be separated by a comma, one or more spaces, or both. If
we break the expression ([0-9eE+\-\.]+)\s*,?\s*([0-9eE+\-\.]+) into it’s constituent parts we get:
([0-9eE+\-\.]+). The [] groups characters that we allow to match. - and . have special meanings so they have
to be escaped with a \ character. So this means we are allowing any of the characters 0123456789eE+-. to match.
The [] specifies a single character so we use + to mean one or more. Finally, using () captures the expression so we
can extract the value that matched. So this will match values such as ’10’, ’1.2345’, ’1.0e+05’, ’-23.4’
\s*,?\s*. The \s matches a single space. A * means that it will try to match 0 or more spaces (as many as are
present). The , matches a comma and the ? means match either 0 or 1 of them. So this expression means "Match 0 or
more spaces followed by 0 or 1 commas followed by 0 or more spaces".
More details on regular expressions can be found in the Conditional formatting chapter as these can use regular
expressions.
Once we have extracted the data values with the regular expression we can easily calculate the average and make a new
variable using the techniques in the first 3 examples.
The source code for this example is available here.
Page 11.5
REPORTER
Page 11.6
User manual Version 12.0, October 2014
User manual Version 12.0, October 2014
REPORTER
A. Command line arguments and oa_pref
options
A.1 Command line arguments
The following command line arguments are available in REPORTER. Unless stated otherwise, all command line
options are evaluated in the order that they are given.
Argument
Description
file.orr or
-file=file.orr
-pdf=file.pdf
Opens REPORTER file "file.orr"
-html=file.html
-print=printer
Creates a HTML file "file.html"
Prints report to printer
Creates a pdf file "file.pdf"
-varNAME[::type]=value[::description] Creates a variable "NAME" in REPORTER with value
"value" and description "description". ::description and
::type can be omitted. If the type is omitted it defaults to
"General".
-vba=file.bas
Create a powerpoint macro visual basic file "file.bas"
-ppt=file.ppt
Create PowerPoint file "file.ppt". Note: Not available on unix.
Only available on Windows if Powerpoint is installed.
-log=logfile
Save the logfile REPORTER produces in the file "logfile" as
plain text after processing all the command line options.
-loghtml=logfile
Save the logfile REPORTER produces in the file "logfile" as
HTML after processing all the command line options.
-generate
Generate a report (previously read with -file argument).
Note: this is not required if you use any of the -ps, -pdf,
-html, -vba or -ppt options (they do this automatically)
-report=file.orr
Saves generated report (previously read with -file
argument) to file.orr
Runs javascript script script.js.
-script=script.js
-argfile=argfile
Reads command line arguments from file argfile, one
argument per line. This could be useful if you want to read lots
of variables on the command line and you reach the command
line length limit.
-exit
Automatically exit after processing all other command line
options
-iconise
Start REPORTER iconised. This is useful for running reporter
from scripts when you want to continue working on something
else and you do not want the REPORTER window to interfere.
-new
Create a new template.
-batch
Batch mode. This stops REPORTER prompting the user. For
example, normally if an error occurs when generating
REPORTER brings up a warning box allowing the user to
look at the error. Giving the -batch argument stops this.
Note that this does NOT make REPORTER run without the
user interface (see -iconise)
-oasys_batch
On Windows run D3PLOT and T/HIS without any windows
being shown.
Combine multiple report output into pdf, html or pptx.
-combine
Page A.1
REPORTER
User manual Version 12.0, October 2014
So for example:
reporter -file=/job/templates/example.orr
/
-pdf=/local/output.pdf
/
-print=printer
/
-varKEYWORD=/job/keyword/example.key::example deck /
-html=/local/example.html
/
-exit
Will:
1.
2.
3.
4.
5.
6.
Load the file "/job/templates/example.orr" into REPORTER
Install a variable called KEYWORD with value "/job/keyword/example.key" and description "example deck"
Create a pdf file "/local/output.pdf"
Print the file on printer "printer"
Create a HTML file "/local/example.html"
automatically exit
A.2 oa_pref options
The "oa_pref" preferences file.
This file contains code-specific preferences that can be used to modify the behaviour of Oasys Ltd LS-DYNA
Environment products. It is optional and, where entries (or the whole file) are omitted REPORTER will revert to its
default settings.
"oa_pref" naming convention and locations
The file is called "oa_pref"
It is looked for in the following places in the order given:
• The site-wide admin directory ($OA_ADMIN)
• The site-wide "Oasys Ltd LS-DYNA Environment" directory ($OA_INSTALL)
• The user’s home directory: $HOME (Unix/Linux) or $USERPROFILE (Windows)
The first encountered file will be used, so this file can be customised for a particular job or user at will.
Files do not have to exist in any of these locations, and if none exists the programme defaults will be used.
On Unix and Linux:
$HOME on Unix and Linux is usually the home directory specified for each user in the system password file.
The shell command "printenv" (or on some systems "setenv") will show the value of this variable if set.
If not set then it is defined as the "~" directory for the user. The command "cd; pwd" will show this.
On Windows:
$USERPROFILE on Windows is usually C:\Documents and Settings\<user id>\
Issuing the "set" command from an MS-DOS prompt will show the value of this and other variables.
Generally speaking you should put
• Organisation-wide options in the version in $OA_INSTALL,
• User-specific options in $HOME / $USERPROFILE
Page A.2
User manual Version 12.0, October 2014
REPORTER
"oa_pref" file syntax
The syntax used for Primer is:
reporter*<keyword>: <argument>
for example:
reporter*default_item_width: 10.0
The rules for formatting are:
The
• <programme>*<option>: string must start at column 1;
This
• string must be in lower case, and must not have any spaces in it.
The
• <argument> must be separated from the string by at least one space.
Lines
• starting with a "#" are treated as comments and are ignored.
"oa_pref" options valid for REPORTER
Preference
date_format
Type Description
<string>Format for printing default date variable
default_item_height<real> Default width given to item (mm) if it is not
dragged when creating
default_item_width <real> Default height given to item (mm) if it is not
dragged when creating
default_grid
<real> Default grid spacing (mm)
default_snap
<real> Default snap size (mm)
default_nudge
<real> Default nudge distance (mm)
file_names
<string>Controls output file names. LSTC = d3plot,
d3thdt, d3hsp etc, OASYS/ARUP = job.ptf,
job.thf job.otf etc
Valid arguments
Day Month Day Year,
dd/mm/yyyy, mm/dd/yyyy,
yyyy/mm/dd
0.0 - 999.9
Default
Day Month
Day Year
0.0 - 999.9
10.0
0.0 - 999.9
0.0 - 999.9
0.0 - 999.9
OASYS, ARUP, LSTC
5.0
1.0
5.0
OASYS
10.0
The following options control the library location in REPORTER
Preference
Type
Description
Valid
arguments
library_directory<string> User defined library directory for
REPORTER
maximise
<logical>Maximise window when REPORTER
started
Default
$OA_INSTALL/reporter_library
TRUE, FALSE FALSE
The following options control how objects are edited
Preference
coordinate_method
Type Description
<string>Method used for editing
object coordinates
object_reference_corner<string>Corner used as reference
when editing objects
placement
<string>Location for initial
window on multi-screen
display
Valid arguments
Opposite corners, Width and height
Default
Width and
height
TopLeft, TopRight, BottomLeft, BottomRight BottomLeft
LEFT, RIGHT, BOTTOM, TOP,
LEFT_BOTTOM, LEFT_TOP,
RIGHT_BOTTOM, RIGHT_TOP
<none>
The following options control pdf output
Preference
Type
Description
pdf_image_downsample
<logical>Downsample images in pdf files
Valid
arguments
TRUE,
FALSE
Default
FALSE
Page A.3
REPORTER
User manual Version 12.0, October 2014
pdf_image_downsample_resolution<integer>Resolution to downsample images to
pdf_image_downsample_threshold <real> Factor above pdf_image_downsample_resolution
before downsampling is done
10 - 3000
1.0 - 10.0
150
1.5
The following options control which other Oasys Ltd LS-DYNA Environment programmes are used by REPORTER
Preference
d3plot
d3plot_args
Type
Description
Valid arguments
<string> D3PLOT executable to use
<string> Extra command line arguments to pass to
D3PLOT
primer
<string> PRIMER executable to use
primer_args
<string> Extra command line arguments to pass to
PRIMER
this
<string> T/HIS executable to use
this_args
<string> Extra command line arguments to pass to T/HIS
start_in
<string> Directory to start REPORTER in
time_format
<string> Format for printing default time variable
hh:mm:ss, hh:mm:ss A, hh:mm,
hh:mm A
use_default_vars<logical>Use default vars in filenames when capturing if TRUE, FALSE
possible
use_file_vars <logical>Use file/directory vars in filenames when
TRUE, FALSE
capturing if possible
Default
<none>
<none>
<none>
<none>
<none>
<none>
<none>
hh:mm:ss
TRUE
TRUE
The following options control unicode
Preference
cjk_default
Type Description
<string>Default language for ambiguous CJK
Kanji
chinese_characters<string>Style for chinese characters in pdf
files
japanese_font
<string>Font for japanese characters in pdf
files
Valid arguments
Chinese, Japanese, Korean
Default
Japanese
Simplified, Traditional
Traditional
Kozuka Mincho Pro, Kozuka
Gothic Pro
Kozuka Mincho
Pro
The following options control visual basic output
Preference
vba_directory
Type
<string>
Description
Directory script will be run from
Valid argumentsDefault
C:\temp
Editing/changing preferences
There is currently no interactive preferences editor for REPORTER. To change preferences for REPORTER please use
the interactive preferences editor in Oasys Ltd SHELL, D3PLOT, T/HIS or PRIMER or edit the preferences file by
hand.
Page A.4
User manual Version 12.0, October 2014
REPORTER
B. Library objects
B.1. Standard library programs
REPORTER has a number of buit in scripts to retrieve data from the keyword or otf files. New scripts can be added as
required. See Adding scripts to the library. By default REPORTER looks for library programs in the subdirectory
reporter_library/scripts in the directory where REPORTER is installed. Other directories can be added if
required. See User defined library directories for more details.
D3PLOT data file programs
Create a D3Plot data file
from a cvs file
Create a data file which is suitable for use by D3PLOT. The data will be extracted
from a csv (comma separated value) file. See section 6.1
Create a D3Plot data file
from generated data files
Create a data file which is suitable for use by D3PLOT. The data will be extracted
from reporter_variables files. See section 6.1
Error programs
Read PRIMER error file
Read an error file produced by doing a model check in PRIMER and extract the errors
Keyword file programs
The following programs retrieve information from a keyword file.
Analysis title
Prints the title of the analysis from the *TITLE
card.
Comments between *KEYWORD and *TITLE
Prints any comment lines in the keyword file
between the *KEYWORD and *TITLE keywords.
The $ will be removed from each line.
An optional second argument can be used to
impose a maximum limit on the number of lines
printed.
Create variables for parameters used in analysis
Extract title and LCSS curve from
*MAT_PIECEWISE_LINEAR_PLASTICITY_TITLE
cards
Include files used in analysis
Prints a list of all the include files used in the
analysis. By default the full pathname of include
files is written. An optional second argument can
be used to give the names relative to the master
file
Initial velocity card used in analysis
Prints the first line of any
*INITIAL_VELOCITY cards in the keyword
file. The script will also recursively look in
include files for *INITIAL_VELOCITY cards.
Timestep from *CONTROL_TIMESTEP card
Reads the DT2MS value from the
*CONTROL_TIMESTEP card
Page B.1
REPORTER
User manual Version 12.0, October 2014
NCAP
Create a US-NCAP graph
Create a graph for US-NCAP star rating using HIC and chest acceleration (3ms clip)
OTF file programs
The following programs retrieve information from an OTF file.
Mass info
Added mass at end of
analysis
Prints the mass added to the analysis by mass-scaling at the end of the analysis. This will
also look at otf files generated from restarts (otf01, otf02 etc)
Added mass at start
of analysis
Prints the mass added to the analysis by mass-scaling at the start of the analysis.
Percentage final
added mass
Prints the percentage mass added to the analysis by mass-scaling at the end of the analysis.
This will also look at otf files generated from restarts (otf01, otf02 etc)
Percentage initial
added mass
Prints the percentage mass added to the analysis by mass-scaling at the start of the analysis.
Total mass in
analysis
Prints the mass of the model at the start of the analysis
Timestep info
Mass-scaled timestep (DT2MS)
echo in OTF file
Prints the DT2MS value from the *CONTROL_TIMESTEP card echoed to
the OTF file.
Smallest initial timestep
Prints the element with the smallest timestep from the 100 smallest
timesteps. The line has the form:
<element_type> <element_number> timestep =
<timestep>
Timing info
Elapsed time for analysis
Prints the total elapsed time for the analysis.
Start time for analysis
Prints the date and time that the analysis finished.
Problem cycle for analysis
Prints the cycle in the analysis that the problem terminated.
Problem time for analysis
Prints the time in the analysis that the problem terminated.
Start time for analysis
Prints the date and time that the analysis started (same as Analysis date).
Terminition
time(ENDTIM) echo in
OTF file
Prints the termination time from the *CONTROL_TERMINATION card echoed to the
OTF file. This will also look at otf files generated from restarts (otf01, otf02 etc).
Other OTF programs
Analysis date
Prints the date and time that the analysis started
Analysis precision
Prints the precision (single/double) LS-DYNA used for the analysis
Analysis title
Prints the title of the analysis echoed to the OTF file.
Page B.2
User manual Version 12.0, October 2014
REPORTER
CPU time for analysis
Prints the total CPU time used for the analysis. This will also look at otf files generated
from restarts (otf01, otf02 etc)
Check on the quality
of the run
Looks to see if the analysis terminated normally, if the initial and final added masses, the
total energy fluctuation and hourglass energy are below (user definable) limits. Either
prints OK or NOT OK.
Hostname analysis
run on
Prints the hostname of the machine the analysis was run on.
LS-Dyna version and
revision
Prints the version and revision of LS-DYNA used to run the analysis
Normal or Error
termination message
Prints N o r m a l or E r r o r termination message from LS-DYNA.
Number of CPUs used
for analysis
Prints the number of CPUs used for the analysis
OS analysis run on
Prints the operating system level of the machine the analysis was run on.
Platform analysis run
on
Prints the platform of the machine the analysis was run on.
Pedestrian
Create a contour
image of HIC for
pedestrian HIC
results in a CSV
file
Creates an image showing contours of HIC from values in a csv file. See
http://www.oasys-software.com/dyna/en/downloads/extras.shtml#pedestrianarea for more
details.
Create a contour
image of HIC for
pedestrian HIC
results in reporter
variables files
Creates an image showing contours of HIC from values in reporter variables files. See
http://www.oasys-software.com/dyna/en/downloads/extras.shtml#pedestrianarea for more
details.
Variables
Read a REPORTER variable file
Read a variables file written by another REPORTER template and install the
variables from it into the current template
Read variables from a CSV file
Read variables from a CSV file (one variable per row).
Read variables from a CSV file
(data in rows)
Read variables from a CSV file (one variable per column)
Page B.3
REPORTER
User manual Version 12.0, October 2014
B.2. Standard library pages
REPORTER comes with some standard pages which can be installed from a library. They are shown in the image
below. The pages are available in landscape and portrait versions. The information on the page is the same in either
case.
Type
Description
Checking page
Information for the analysis extracted from the OTF file and an energy balance plot from T/HIS.
Include Files
A list of any include files that were used in the analysis
Initial velocity
and last state
Images captured from D3PLOT of the initial velocity in the analysis and of the last state.
Standard page
A blank page with a standard footer
Pedestrian area
from CSV
Information and a contour plot of HIC values for pedestrian HIC analyses. See
http://www.oasys-software.com/dyna/en/downloads/extras.shtml#pedestrianarea for more details.
Pedestrian area
from variables
files
Information and a contour plot of HIC values for pedestrian HIC analyses. See
http://www.oasys-software.com/dyna/en/downloads/extras.shtml#pedestrianarea for more details.
New pages can be added as required. See Adding pages to the library.
Page B.4
User manual Version 12.0, October 2014
REPORTER
B.3. Standard library images
REPORTER comes with some standard images which can be installed from a library. They are shown in the image
below.
New images can be added as required. See Adding images to the library.
Page B.5
REPORTER
User manual Version 12.0, October 2014
B.4 Adding pages to the library
To add a new page layout to the library you need to:
• Create a the page in REPORTER.
• Export the page, saving it with extension .orp using Page->Export... (see exporting pages for more details).
• Copy the exported page into the /library/pages/ directory of your Oasys Ltd LS-DYNA Environment
installation.
It will then be shown the next time you start REPORTER. Note that the title of the page is what will be shown in the
library page tree so make sure that the page has a sensible title. This can be changed using Page->properties... (see
Changing the page properties for more details).
So, for example, if you have a page called ’New library page’ and you put it in the /library/pages/ directory you
will get:
If you want the page to be shown in a different branch of the tree then edit the file using a text editor and change the file
as follows. The first line should look like:
<REPORTER FILETYPE=’page’ VERSION=’92’>
If I wanted a branch in the tree to be ’Arup/Example library pages/portrait’ I would change this to
<REPORTER FILETYPE=’page’ VERSION=’92’ FOLDER=’Arup/Example library
pages/portrait’>
The page would then be shown in the tree as:
Page B.6
User manual Version 12.0, October 2014
REPORTER
B.5 Adding scripts to the library
REPORTER has a javascript interpreter built into it. The scripts which are available in the library are run inside
REPORTER
To add a new script to the library save it into the /library/scripts/ directory of your Oasys Ltd LS-DYNA
Environment installation. Then you need to add the following special comment at the top of the file.
/* A description of your script
PROGRAM::<script_name>
DESC::<description>
FOLDER::<folder>
(optional)
RETURN::<output_type>
[+-]ARG::<description>[::<default text>]
(repeat for as many arguments as
required)
EXPAND_ARGS::false
(optional)
END_INFO
*/
Note the /* at the beginning and */ at the end.
The lines have the following meaning:
PROGRAM
<script_name> is the name of the javascript program. It should have the extension js
DESC
<description> is a description of the program/script that will appear in the Insert program
from library window
FOLDER
The programs in the Insert program from library window are shown in a ’tree’ view.
<folder> indicates which folder or ’branch’ of the tree the program is shown in. This is the same
as for library pages above.
RETURN
<output_type> is the type of output the program returns. Currently the only value supported is
text.
ARG
<description> is the argument description that will appear in the Insert program from
library window. Optionally the line can be prefixed with a + or - sign. If a - sign is used the
argument is optional. If a + sign is used (default) the argument is mandatory. Optionally an
argument can be followed by <default_text> which will be used as a default for the
argument in the window.
EXPAND_ARGS
Normally any variables in program arguments get expanded to their actual values and so you
would omit this line. There may be instances where you do not want to expand them. In this case
use the line EXPAND_ARGS::false (e.g. see data_file_from_variables.js).
END_INFO
This line indicates the end of the informat and must be included
For example, the following lines
/*
PROGRAM::example.js
DESC::Example program
FOLDER::examples/programs
RETURN::text
ARG::argument1::default1
ARG::argument2
-ARG::argument3::default3
END_INFO
*/
would give the output:
Page B.7
REPORTER
User manual Version 12.0, October 2014
Rules for writing scripts
As REPORTER runs the scripts internally, they have to be written in a specific way. The following guidelines should
be used for writing custom scripts for REPORTER. If these guidelines are too restrictive or you do not want to work
this way, remember that you can write external programs for REPORTER in any language you choose. See Appendix E
for more details.
• Scripts must be written in javascript! REPORTER contains a javascript interpreter. Other languages are NOT
supported.
• To output text back to REPORTER use the output function.
• See the scripting chapter for javascript scripting.
• See the Javascript class reference appendix for extra javascript classes that REPORTER defines.
The scripts in the /library/scripts directory give an indication of what is possible with internal scripts. For more
details refer to the individual scripts.
The functionality will be extended over time. If you have requests for new features contact Oasys Ltd.
B.6 Adding images to the library
To add an image to the library copy it into the /library/images directory of your Oasys Ltd LS-DYNA Environment
installation. It will then be shown next time you start REPORTER. The image should be a bmp, jpg, png or gif image.
Note that if you add images to the library and then use the image in a template, the image will not work for installations
that do not have this library image. This is fine if you are using this internally in your company, but be careful when
giving a template to another person/company. The way round tis problem is to save your template as a report once it has
been generated. When you save as a report any images are embedded to this is then portable. See Outputting a
generated report for more details.
Page B.8
User manual Version 12.0, October 2014
REPORTER
B.7 User defined library directories
By default REPORTER looks for library programs in a subdirectory reporter_library/scripts in the
directory where REPORTER is installed. Extra library programs can be added to this directory using the above logic.
However, this may not be possible due to file permissions. For this reason it is possible to specify another directory for
REPORTER to use an addition to the default directory. This can be done using the library_directory oa_pref
option. If this option is set then REPORTER will also treat this directory as a user defined reporter_library
directory.
Currently only scripts are supported as user library items (i.e. images and pages are currently not supported). User
scripts should be put in a subdirectory scripts of your library_directory.
For example, if library_directory is set to /home/user/reporter_library then you should put your
scripts in /home/user/reporter_library/scripts.
In future versions of REPORTER it may be possible to have user defined pages and images.
Page B.9
REPORTER
User manual Version 12.0, October 2014
B.8 Standard library templates
A number of standard templates have been created for automotive crash test protocols, included as part of the
installation. They are located in the subdirectory reporter_library/templates in the directory where
REPORTER is installed.
The templates can be selected from within Reporter and, after asking a few questions to get information needed to
generate the report, calculate results according to the protocol the template is following, e.g. EuroNCAP Front Impact.
They can also be run in a batch mode.
Generally the templates contain a front summary page showing the overall score for the test, with further pages
containing tables showing individual measurements and graphs.
The reports can be written out as PDF, HTML or PPTX files as normal.
There are two generic types of templates:
• Single analysis templates (Front Impacts, Side Impacts...)
• Multiple analysis templates (Pedestrian Head Impacts, Pedestrian Leg Impacts)
The way they work is slightly different, but generally they follow the same process. The next sections will describe how
to use the templates.
Assumptions
The following assumptions are made about the models to be post-processed. If they are not true of your model then the
templates may not work correctly:
Page B.10
User manual Version 12.0, October 2014
•
•
REPORTER
Humanetics dummies should be used for any occupants.
Intrusion measurements are made with springs.
Use *ELEMENT_DISCRETE with a low stiffness value on the *MAT_ SPRING_ELASTIC card.
Node 1 should be attached to the structure that is being measured and Node 2 should be attached to a nodal rigid
body where there will be no deformation (normally at the rear of the vehicle), e.g. to measure the steering
column intrusion in an ODB impact:
One spring will be needed for each intrusion measurement. For the case above there are three springs overlaying
each other; one for intrusions in X, one in Y and one in Z. A vector should be used to define the orientation and
should be aligned with the X, Y or Z global axis depending on the measurement being made.
B.8.1 Single analysis templates
All the single analysis templates follow the same process, so we’ll use the EuroNCAP Front ODB Impact template as an
example for how to use them. The section will describe how to run them interactively using the menus in REPORTER,
but it is also possible to run them in batch mode.
Page B.11
REPORTER
User manual Version 12.0, October 2014
Select the template
Use the File -> Open Library Template menu to select the template you want.
Note that this menu is created when REPORTER is loaded by looking for any *.ort files in the subdirectory
reporter_library/templates in the directory where REPORTER is installed. The tree structure is created
from the FOLDER and MENU_NAME properites in the header of the file, e.g.
<REPORTER FILETYPE=’template’ VERSION=’120’ TOTAL_ITEMS=’132’ TOTAL_PAGES=’28’
FOLDER=’EuroNCAP/Adult Occupant Protection’ MENU_NAME=’2014 - Front ODB Impact’>
If these properties are not present, then the template is just listed in the first dropdown menu as the name of the template
with any ’_’s removed.
This means you can create your own templates, text edit the header properties to create your own menu structure, put
them in the reporter_library/templates directory and REPORTER will add them to the menu.
Generate the template
After selecting the template REPORTER should prompt you to select the keyword file of the job you want to
post-process:
After pressing ’OK’ a file selector is mapped for you to select the keyword file.
In order to correctly extract the results needed for the protocol the template needs model information such as Node IDs,
Beam IDs, the unit system, etc. This needs to be supplied to the template either from a .CSV file or from comments
written in the keyword file after the *END keyword. The template will help you to create this information (you should
only need to do this ONCE for a particular vehicle programme so long as IDs remain the same). Further information
on the format of the data can be found in section B.8.4.
The template will scan the keyword file to see if it contains the required information after the *END keyword. If it does
you will be asked if you want to use it:
Page B.12
User manual Version 12.0, October 2014
REPORTER
If you press ’Yes’ then the next few questions will not be asked.
If you press ’No’ or the keyword file doesn’t contain the required information after the *END keyword you will be asked
if you have a .CSV file with the information instead:
If you have a .CSV file, press ’Yes’ and select it in the file selector.
If you press ’No’ REPORTER will inform you that it will start PRIMER so you can select the required information
interactively:
After pressing ’OK’ PRIMER will start, the model will be read in and a window will be open for you to interactively
select the required information:
Page B.13
REPORTER
User manual Version 12.0, October 2014
You can select the information either by picking the entities in the graphics window, typing it in to the textbox or
selecting it from a list of *DATABASE_HISTORY_XXXX entities in the popup menu. If they are defined with the _ID
option then the names will be used instead of the numbers, e.g.
After you have selected the information you can need to save it either as a .CSV file or post *END data. Next time you
use the template, perhaps on a slightly modified model, you should be able to reuse this data without having to go back
into PRIMER each time (so long as the IDs of entities you want to extract data from stay the same).
Page B.14
User manual Version 12.0, October 2014
REPORTER
PRIMER will close and REPORTER will ask for the directory containing the analysis results (which may be different
to the location of your kewyord file).
Press OK and select the directory.
Finally you will be asked for a directory where REPORTER should write any images.
Press OK and select the directory.
REPORTER should now have all the information it needs. T/HIS will load and carry out the post-processingg
according to the selected protocol, generating the required graphs. Once this is finished, REPORTER will ask a final
question asking you how/if you want to save the report:
If you don’t want to save the report, just press ’Cancel’. If you do, select the format(s) you want to save it in, press ’OK’
and select where you want to save it in the file selector that will pop up.
The final report should look something like this, with a front summary page showing the protocol scores in tables and
as an image; a page to change subjective modifiers that can’t be calculated automatically from the analysis; tables and
graphs showing the analysis results and protocol scores in more detail:
Page B.15
REPORTER
User manual Version 12.0, October 2014
Subjective modifiers
In general most data can be extracted automatically from the analysis results and then processed according to the
protocol. However, some data is subjective and requires the user to look at the analysis results and manually set the
values.
For example, the EuroNCAP front ODB impact test has some modifiers which are applied as penalty points to the
calculated scores, e.g. if an airbag doesn’t deploy correctly a 1 point penalty is applied.
These subjective values can be set on the second page of the report after it has been generated. This lists all the
subjective modifiers and their current value and a button to edit them:
Page B.16
User manual Version 12.0, October 2014
REPORTER
Press the ’Set Modifiers’ button and then set the values in the window that pops up:
Page B.17
REPORTER
User manual Version 12.0, October 2014
After setting the values and pressing ’OK’ the template will recalculate the scores. This allows you to carry out ’what-if’
type analyses.
B.8.2 Multiple analysis templates
For the pedestrian impact protocols multiple analyses are run with impacts on different parts of the vehicle. The scores
for each impact are combined to calculate an overall score for the test.
There are two multiple analysis type templates:
• Pedestrian headform impacts
• Pedestrian legform impacts
Generally they follow the same process, but they are different enough that we’ll go through an example of how to use
them both.
The section will describe how to run them interactively using the menus in REPORTER, but it is also possible to run
them in batch mode.
Page B.18
User manual Version 12.0, October 2014
REPORTER
Pedestrian headform
Select the template
Use the File -> Open Library Template menu to select the template you want.
Generate the template
After selecting the template REPORTER should prompt you to select the LST file for the adult head impacts.
The LST file is a simple text file that lists the file locations of each model keyword file. If you use PRIMERs model
build process to create the models it is created automatically. If not, you can create it manually or as part of your own
process for building the models. Further details are given in section B.8.4. The names of the models are important as
they tell the template the location/zone of the impactor. If you have used the pedestrian markup script in PRIMER, they
will be named correctly.
After pressing ’OK’ a file selector is mapped for you to select the LST file. If you do not want to process the adult head
impacts or you don’t have an LST file, press cancel in the file selector.
In order to correctly extract the results needed for the protocol the template needs model information such as Node IDs
and the unit system etc. This needs to be supplied to the template from comments written in the LST file and the
template will help you to create this information. Further information on the format of the data can be found in section
B.8.4.
The template will scan the LST file to see if it contains the required information. If it does you will be asked if you want
to use it:
Page B.19
REPORTER
User manual Version 12.0, October 2014
If you press ’No’ or the LST file does not contain the required informtion REPORTER will inform you that it will start
PRIMER so you can select the required information interactively:
After pressing ’OK’ PRIMER will start, the first model in the LST file will be read in and a window will be open for you
to interactively select the required information. Select the information in the same way as described in the single
analysis template section.
On returning to REPORTER you should be prompted to select the LST file for the child head impacts. This follows the
same process as for the adult LST file. If you do not want to process the child head impacts or you don’t have an LST
file, press cancel in the file selector. So long as you have selected at least one LST file, the template should generate.
Finally you will be asked for a directory where REPORTER should write any images.
Press OK and select the directory.
REPORTER should now have all the information it needs. T/HIS will load and carry out the post-processingg
according to the selected protocol, generating the required graphs. Once this is finished, REPORTER will ask a final
question asking you how/if you want to save the report:
Page B.20
User manual Version 12.0, October 2014
REPORTER
If you don’t want to save the report, just press ’Cancel’. If you do, select the format(s) you want to save it in, press ’OK’
and select where you want to save it in the file selector that will pop up.
The final report should look something like this, with a front summary page showing the protocol scores in tables and
as an image; a pages to set default scores; a page to set test point and blue zone scores; and pages of head acceleration
graphs for each impact point:
Page B.21
REPORTER
User manual Version 12.0, October 2014
Set default scores
Some points do not need to be tested and can be defaulted either to Green (max score) or Red (min score).
You can manually set default scores on the second page by pressing the ’Set Defaults’ button.
Page B.22
User manual Version 12.0, October 2014
REPORTER
This will bring up a window where you can set the default values either to GREEN, RED or leave blank.
Page B.23
REPORTER
User manual Version 12.0, October 2014
Once you have set the values and pressed ’OK’ the scores will update automatically.
Alternatively, you can get the template to automatically default points to GREEN when the LST file is read in. This
requires a special comment ’$DG:’ before each file location. e.g.
$DG:C:\Model\A_1_1\a_1_1.key
C:\Model\A_1_2\a_1_2.key
$DG:C:\Model\A_1_3\a_1_3.key
will default the score for the 1st and 3rd model to GREEN and will not attempt to read any results for them.
This can be done automatically if you use the pedestrian markup script in PRIMER. You can select an area where you
want the points to default to green and PRIMER will add the ’DG:’ comments to the correct lines in the LST file.
Test points
The results from the analyses are scaled using a correction factor, which is calculated based on results from a number of
real world verification tests. The correction factor is calculated by dividing the actual tested total score of the
verification points by the predicted total points of these verification points.
The correction factor is then applied to all points execept for defaulted and blue points.
To specify the test points press the ’Set Test Points’ button on the third page:
Page B.24
User manual Version 12.0, October 2014
REPORTER
This will bring up a window where you can enter the test point row, column and value (HIC) for up to 20 test points:
Page B.25
REPORTER
User manual Version 12.0, October 2014
Once you have set the values and pressed ’OK’ the scores will update automatically.
If no test points are specified a correction factor of 1.0 is used.
Blue zones
Some impact point locations may give unpredictable results when analysed and in these cases test data can be used
instead. These are specified as blue points, either singly or grouped together in adjacent pairs to form a blue zone. Up to
8 blue zones can be specified. The test results of the blue points are applied to each point in the zone.
To specify blue points press the ’Set Blue Zone’ button on the third page:
Page B.26
User manual Version 12.0, October 2014
REPORTER
This will bring up a window where you can enter the test point row, column and value (HIC) for up to 8 blue zones:
Page B.27
REPORTER
User manual Version 12.0, October 2014
Once you have set the values and pressed ’OK’ the scores will update automatically.
Pedestrian legform
Select the template
Use the File -> Open Library Template menu to select the template you want.
Generate the template
After selecting the template REPORTER should prompt you to select the LST file for the lower leg impacts.
The LST file is a simple text file that lists the file locations of each model keyword file.If you use PRIMERs model
build process to create the models it is created automatically. If not, you can create it manually or as part of your own
process for building the models. Further details are given in section B.8.4. The names of the models are important as
they tell the template the location/zone of the impactor. If you have used the pedestrian markup script in PRIMER, they
will be named correctly.
Page B.28
User manual Version 12.0, October 2014
REPORTER
After pressing ’OK’ a file selector is mapped for you to select the LST file. If you do not want to process the lower leg
impacts or you don’t have an LST file, press cancel in the file selector.
In order to correctly extract the results needed for the protocol the template needs model information such as Node IDs
and the unit system etc. This needs to be supplied to the template from comments written in the LST file and the
template will help you to create this information. Further information on the format of the data can be found in section
B.8.4.
The template will scan the LST file to see if it contains the required information. If it does you will be asked if you want
to use it:
If you press ’No’ or the LST file does not contain the required informtion REPORTER will inform you that it will start
PRIMER so you can select the required information interactively:
After pressing ’OK’ PRIMER will start, the first model in the LST file will be read in and a window will be open for you
to interactively select the required information. Select the information in the same way as described in the single
analysis template section.
On returning to REPORTER you should be prompted to select the LST file for the upper leg impacts. This follows the
same process as for the lower LST file. If you do not want to process the upper leg impacts or you don’t have an LST
file, press cancel in the file selector. So long as you have selected at least one LST file, the template should generate.
Finally you will be asked for a directory where REPORTER should write any images.
Page B.29
REPORTER
User manual Version 12.0, October 2014
Press OK and select the directory.
REPORTER should now have all the information it needs. T/HIS will load and carry out the post-processingg
according to the selected protocol, generating the required graphs. Once this is finished, REPORTER will ask a final
question asking you how/if you want to save the report:
If you don’t want to save the report, just press ’Cancel’. If you do, select the format(s) you want to save it in, press ’OK’
and select where you want to save it in the file selector that will pop up.
The final report should look something like this, with a front summary page showing the protocol scores in tables and
as an image and pages of tabulated results and graphs for each impact point:
Page B.30
User manual Version 12.0, October 2014
REPORTER
B.8.3 Running the templates in batch mode
As well as running the templates interactively they can also be run in batch mode, in which case the user is not
prompted with questions, but must supply the information through a command line argument.
To run a template in batch, type in the following at a command prompt:
reporter12.exe -batch -file=template_name -varTEMPLATE_ARGS=args_filename
[Add the -pdf, -html, -ppt command line arguments to write the report out in the format you want].
Where:
template_nameThe full path and filename of the template you want to use, e.g.
C:\oasys12\reporter_library\templates\EuroNCAP_Front_ODB_Impact_2014.ort
Note that you should enclose it in "s if the path contains any spaces.
args_filename The full path and filename of the arguments file, e.g. C:\my_directory\arguments_file.txt
Note that you should enclose it in "s if the path contains any spaces.
The args_filename is a CSV file containing the arguments to pass to the template in comma separated
’arg_name’,’arg_value’ pairs. For the EuroNCAP Front ODB Impact template the file can contain the following:
KEYWORD_FILE,<keyword_filename>
CSV_FILE,<csv_filename> [OPTIONAL]
RESULTS_DIR,<results_directory> [OPTIONAL]
IMAGES_DIR,<images_directory> [OPTIONAL]
As with the interactive case where the template behaves differently depending on the users response to the questions,
Page B.31
REPORTER
User manual Version 12.0, October 2014
the interactive case will work differently depending on what arguments are supplied, e.g.:
KEYWORD_FILE
specified
No
Yes
Yes
Post *END data in keyword
file
No
Yes
CSV_FILE
specified
No
No
Outcome
Template will not run
Template will not run
Template will run using the post *END
data
Yes
Yes
Yes
Template will run using the CSV file
data
Yes
No
Yes
Template will run using the CSV file
data
If RESULTS_DIR or IMAGES_DIR are not specified then they are set to the keyword file directory.
Further info on the batch file arguments for each template can be found in section B.8.4.
Page B.32
User manual Version 12.0, October 2014
REPORTER
B.8.4 CSV file and Batch details
CNCAP ODB 2012 Template
Template Description
This template will generate a report for a front ODB impact based on the 2012 CNCAP protocol.
CSV File Details
The CSV file gives the template the extra data it needs to generate the report (entity IDs, etc).
The format is a list of comma separated ’var_name’,’var_value’ pairs, e.g.
• DRIVER_HEAD_NODE,100000
• PASSENGER_HEAD_NODE,200000
For entity IDs, the value can either be the label (a number) or the name if it is defined on the
*DATABASE_HISTORY_XXXX_ID card.
Required variables are:
Name
Type
Description
ACCN_PEDAL_INTRUSION_SPRING_X
Spring ID for acceleration pedal intrusion in the X direction
ACCN_PEDAL_INTRUSION_SPRING_Z
Spring ID for acceleration pedal intrusion in the Z direction
A_PILLAR_INTRUSION_SPRING
Spring ID for A-Pillar intrusion
BRAKE_PEDAL_INTRUSION_SPRING_X
Spring ID for brake pedal intrusion in the X direction
BRAKE_PEDAL_INTRUSION_SPRING_Z
Spring ID for brake pedal intrusion in the Z direction
CLUTCH_PEDAL_INTRUSION_SPRING_X
Spring ID for clutch pedal intrusion in the X direction
CLUTCH_PEDAL_INTRUSION_SPRING_Z
Spring ID for clutch pedal intrusion in the Z direction
DRIVER_CHEST_NODE_X
Node
ID for driver chest acceleration in the X direction
DRIVER_CHEST_NODE_Y
Node
ID for driver chest acceleration in the Y direction
DRIVER_CHEST_NODE_Z
Node
ID for driver chest acceleration in the Z direction
DRIVER_CHEST_TRANSDUCER
Spring ID for driver chest compression
DRIVER_DUMMY_VERSION
String Driver dummy version. Can be
V7_HUMANETICS_HIII_50TH_MALE or
V8_HUMANETICS_HIII_50TH_MALE. Use
V7_HUMANETICS_HIII_50TH_MALE for V7 and
earlier Humanetics dummies. Use
V8_HUMANETICS_HIII_50TH_MALE for V8 and
later Humanetics dummies. This is needed because
the method for calculating chest deflections changed
in V8. Up to V7 the chest transducer rotation is
converted to compression using a linear function. In
V8 a third order polynomial function is used.
DRIVER_HEAD_NODE
Node
DRIVER_LEFT_FEMUR_LOADCELL
Beam ID for driver left knee femur force
DRIVER_LEFT_KNEE_TRANSDUCER
Spring ID for driver left knee deflection
DRIVER_LEFT_LOWER_TIBIA_LOADCELL
Beam ID for driver left lower tibia femur force
DRIVER_LEFT_UPPER_TIBIA_LOADCELL
Beam ID for driver left upper tibia femur force
DRIVER_NECK_LOADCELL
Beam ID for driver neck force
ID for driver head acceleration
Page B.33
REPORTER
User manual Version 12.0, October 2014
DRIVER_RIGHT_FEMUR_LOADCELL
Beam ID for driver right knee femur force
DRIVER_RIGHT_KNEE_TRANSDUCER
Spring ID for driver right knee deflection
DRIVER_RIGHT_LOWER_TIBIA_LOADCELL
Beam ID for driver right lower tibia femur force
DRIVER_RIGHT_UPPER_TIBIA_LOADCELL
Beam ID for driver right upper tibia femur force
PASSENGER_CHEST_NODE_X
Node
ID for passenger chest acceleration in the X direction
PASSENGER_CHEST_NODE_Y
Node
ID for passenger chest acceleration in the Y direction
PASSENGER_CHEST_NODE_Z
Node
ID for passenger chest acceleration in the Z direction
PASSENGER_CHEST_TRANSDUCER
Spring ID for passenger chest compression
PASSENGER_DUMMY_VERSION
String Passenger dummy version. Can be
V7_HUMANETICS_HIII_50TH_MALE or
V8_HUMANETICS_HIII_50TH_MALE. Use
V7_HUMANETICS_HIII_50TH_MALE for V7 and
earlier Humanetics dummies. Use
V8_HUMANETICS_HIII_50TH_MALE for V8 and
later Humanetics dummies. This is needed because
the method for calculating chest deflections changed
in V8. Up to V7 the chest transducer rotation is
converted to compression using a linear function. In
V8 a third order polynomial function is used.
PASSENGER_HEAD_NODE
Node
PASSENGER_LEFT_FEMUR_LOADCELL
Beam ID for passenger left knee femur force
PASSENGER_LEFT_KNEE_TRANSDUCER
Spring ID for passenger left knee deflection
PASSENGER_LEFT_LOWER_TIBIA_LOADCELL
Beam ID for passenger left lower tibia femur force
PASSENGER_LEFT_UPPER_TIBIA_LOADCELL
Beam ID for passenger left upper tibia femur force
PASSENGER_NECK_LOADCELL
Beam ID for passenger neck force
PASSENGER_RIGHT_FEMUR_LOADCELL
Beam ID for passenger right knee femur force
PASSENGER_RIGHT_KNEE_TRANSDUCER
Spring ID for passenger right knee deflection
ID for passenger head acceleration
PASSENGER_RIGHT_LOWER_TIBIA_LOADCELL Beam ID for passenger right lower tibia femur force
PASSENGER_RIGHT_UPPER_TIBIA_LOADCELL
Beam ID for passenger right upper tibia femur force
STEERING_COL_INTRUSION_SPRING_X
Spring ID for steering column intrusion in the X direction
STEERING_COL_INTRUSION_SPRING_Z
Spring ID for steering column intrusion in the Z direction
UNIT_LENGTH
String Model’s length unit. Can be m, cm, mm, inch or ft.
UNIT_MASS
String Model’s mass unit. Can be tonne, kg, lb, slug or gm.
UNIT_TIME
String Model’s time unit. Can be s, ms or us.
Batch Arguments
The template can be run in batch with the following command:
• reporter.exe -batch -file=template_name -varTEMPLATE_ARGS=args_filename
Where args_filename is a file containing arguments to pass to the template in comma separated ’arg_name’,’arg_value’
pairs, e.g.
• KEYWORD_FILE,C:\my_model.key
• CSV_FILE,C:\data.csv
• etc...
The arguments can be:
Name
Page B.34
Description
User manual Version 12.0, October 2014
REPORTER
CSV_FILE (optional)
Filename of the CSV file containing the extra data (entity IDs, etc). If this is not specified the
data needs to be specified in the keyword file as post *END data.
IMAGES_DIR
(optional)
Directory to write images to. If this is not specified the template will write images in the
same directory as the keyword file.
KEYWORD_FILE
Model keyword filename.
RESULTS_DIR
(optional)
Directory to look for results. If this is not specified the template will look for results in the
same directory as the keyword file.
EuroNCAP FFB 2015 Template
Template Description
This template will generate a report for a front FFB impact based on the 2015 EuroNCAP protocol.
CSV File Details
The CSV file gives the template the extra data it needs to generate the report (entity IDs, etc).
The format is a list of comma separated ’var_name’,’var_value’ pairs, e.g.
• DRIVER_HEAD_NODE,100000
• PASSENGER_HEAD_NODE,200000
For entity IDs, the value can either be the label (a number) or the name if it is defined on the
*DATABASE_HISTORY_XXXX_ID card.
Required variables are:
Name
Type
Description
DRIVER_CHEST_TRANSDUCER
Spring ID for driver chest compression
DRIVER_DUMMY_VERSION
String Driver dummy version. Can be
V6_HUMANETICS_HIII_5TH_FEMALE or
V7_HUMANETICS_HIII_5TH_FEMALE. Use
V6_HUMANETICS_HIII_5TH_FEMALE for V6 and earlier
Humanetics dummies. Use
V7_HUMANETICS_HIII_5TH_FEMALE for V7 and later
Humanetics dummies. This is needed because the method for
calculating chest deflections changed in V7. Up to V6 the
chest transducer rotation is converted to compression using a
linear function. In V7 a third order polynomial function is
used.
DRIVER_HEAD_NODE
Node
DRIVER_LEFT_FEMUR_LOADCELL
Beam ID for driver left knee femur force
DRIVER_NECK_LOADCELL
Beam ID for driver neck force
DRIVER_RIGHT_FEMUR_LOADCELL
Beam ID for driver right knee femur force
PASSENGER_CHEST_TRANSDUCER
Spring ID for passenger chest compression
PASSENGER_DUMMY_VERSION
String Passenger dummy version. Can be
V6_HUMANETICS_HIII_5TH_FEMALE or
V7_HUMANETICS_HIII_5TH_FEMALE. Use
V6_HUMANETICS_HIII_5TH_FEMALE for V6 and earlier
Humanetics dummies. Use
V7_HUMANETICS_HIII_5TH_FEMALE for V7 and later
Humanetics dummies. This is needed because the method for
calculating chest deflections changed in V7. Up to V6 the
chest transducer rotation is converted to compression using a
linear function. In V7 a third order polynomial function is
used.
PASSENGER_HEAD_NODE
Node
ID for driver head acceleration
ID for passenger head acceleration
Page B.35
REPORTER
User manual Version 12.0, October 2014
PASSENGER_LEFT_FEMUR_LOADCELL
Beam ID for passenger left knee femur force
PASSENGER_NECK_LOADCELL
Beam ID for passenger neck force
PASSENGER_RIGHT_FEMUR_LOADCELL Beam ID for passenger right knee femur force
STEERING_COL_INTRUSION_SPRING_X
Spring ID for steering column intrusion in the X direction
STEERING_COL_INTRUSION_SPRING_Y
Spring ID for steering column intrusion in the Y direction
STEERING_COL_INTRUSION_SPRING_Z
Spring ID for steering column intrusion in the Z direction
STEERING_WHEEL_AIRBAG
String Flag to say if there is a steering wheel airbag or not. Can be
YES or NO.
UNIT_LENGTH
String Model’s length unit. Can be m, cm, mm, inch or ft.
UNIT_MASS
String Model’s mass unit. Can be tonne, kg, lb, slug or gm.
UNIT_TIME
String Model’s time unit. Can be s, ms or us.
Batch Arguments
The template can be run in batch with the following command:
• reporter.exe -batch -file=template_name -varTEMPLATE_ARGS=args_filename
Where args_filename is a file containing arguments to pass to the template in comma separated ’arg_name’,’arg_value’
pairs, e.g.
• KEYWORD_FILE,C:\my_model.key
• CSV_FILE,C:\data.csv
• etc...
The arguments can be:
Name
Description
CSV_FILE (optional)
Filename of the CSV file containing the extra data (entity IDs, etc). If this is not specified the
data needs to be specified in the keyword file as post *END data.
IMAGES_DIR
(optional)
Directory to write images to. If this is not specified the template will write images in the
same directory as the keyword file.
KEYWORD_FILE
Model keyword filename.
RESULTS_DIR
(optional)
Directory to look for results. If this is not specified the template will look for results in the
same directory as the keyword file.
EuroNCAP ODB 2014 Template
Template Description
This template will generate a report for a front ODB impact based on the 2014 EuroNCAP protocol.
CSV File Details
The CSV file gives the template the extra data it needs to generate the report (entity IDs, etc).
The format is a list of comma separated ’var_name’,’var_value’ pairs, e.g.
• DRIVER_HEAD_NODE,100000
• PASSENGER_HEAD_NODE,200000
For entity IDs, the value can either be the label (a number) or the name if it is defined on the
*DATABASE_HISTORY_XXXX_ID card.
Required variables are:
Name
Page B.36
Type
Description
User manual Version 12.0, October 2014
REPORTER
ACCN_PEDAL_INTRUSION_SPRING_X
Spring ID for acceleration pedal intrusion in the X direction
ACCN_PEDAL_INTRUSION_SPRING_Z
Spring ID for acceleration pedal intrusion in the Z direction
A_PILLAR_INTRUSION_SPRING
Spring ID for A-Pillar intrusion
BRAKE_PEDAL_INTRUSION_SPRING_X
Spring ID for brake pedal intrusion in the X direction
BRAKE_PEDAL_INTRUSION_SPRING_Z
Spring ID for brake pedal intrusion in the Z direction
CLUTCH_PEDAL_INTRUSION_SPRING_X
Spring ID for clutch pedal intrusion in the X direction
CLUTCH_PEDAL_INTRUSION_SPRING_Z
Spring ID for clutch pedal intrusion in the Z direction
DRIVER_CHEST_TRANSDUCER
Spring ID for driver chest compression
DRIVER_DUMMY_VERSION
String Driver dummy version. Can be
V7_HUMANETICS_HIII_50TH_MALE or
V8_HUMANETICS_HIII_50TH_MALE. Use
V7_HUMANETICS_HIII_50TH_MALE for V7 and
earlier Humanetics dummies. Use
V8_HUMANETICS_HIII_50TH_MALE for V8 and
later Humanetics dummies. This is needed because
the method for calculating chest deflections changed
in V8. Up to V7 the chest transducer rotation is
converted to compression using a linear function. In
V8 a third order polynomial function is used.
DRIVER_HEAD_NODE
Node
DRIVER_LEFT_FEMUR_LOADCELL
Beam ID for driver left femur force
DRIVER_LEFT_KNEE_TRANSDUCER
Spring ID for driver left knee deflection
DRIVER_LEFT_LOWER_TIBIA_LOADCELL
Beam ID for driver left lower tibia force
DRIVER_LEFT_UPPER_TIBIA_LOADCELL
Beam ID for driver left upper tibia force
DRIVER_NECK_LOADCELL
Beam ID for driver neck force
DRIVER_RIGHT_FEMUR_LOADCELL
Beam ID for driver right femur force
DRIVER_RIGHT_KNEE_TRANSDUCER
Spring ID for driver right knee deflection
DRIVER_RIGHT_LOWER_TIBIA_LOADCELL
Beam ID for driver right lower tibia force
DRIVER_RIGHT_UPPER_TIBIA_LOADCELL
Beam ID for driver right upper tibia force
PASSENGER_CHEST_TRANSDUCER
Spring ID for passenger chest compression
PASSENGER_DUMMY_VERSION
String Passenger dummy version. Can be
V7_HUMANETICS_HIII_50TH_MALE or
V8_HUMANETICS_HIII_50TH_MALE. Use
V7_HUMANETICS_HIII_50TH_MALE for V7 and
earlier Humanetics dummies. Use
V8_HUMANETICS_HIII_50TH_MALE for V8 and
later Humanetics dummies. This is needed because
the method for calculating chest deflections changed
in V8. Up to V7 the chest transducer rotation is
converted to compression using a linear function. In
V8 a third order polynomial function is used.
PASSENGER_HEAD_NODE
Node
PASSENGER_LEFT_FEMUR_LOADCELL
Beam ID for passenger left femur force
PASSENGER_LEFT_KNEE_TRANSDUCER
Spring ID for passenger left knee deflection
PASSENGER_LEFT_LOWER_TIBIA_LOADCELL
Beam ID for passenger left lower tibia force
PASSENGER_LEFT_UPPER_TIBIA_LOADCELL
Beam ID for passenger left upper tibia force
PASSENGER_NECK_LOADCELL
Beam ID for passenger neck force
PASSENGER_RIGHT_FEMUR_LOADCELL
Beam ID for passenger right femur force
ID for driver head acceleration
ID for passenger head acceleration
Page B.37
REPORTER
User manual Version 12.0, October 2014
PASSENGER_RIGHT_KNEE_TRANSDUCER
Spring ID for passenger right knee deflection
PASSENGER_RIGHT_LOWER_TIBIA_LOADCELL Beam ID for passenger right lower tibia force
PASSENGER_RIGHT_UPPER_TIBIA_LOADCELL
Beam ID for passenger right upper tibia force
STEERING_COL_INTRUSION_SPRING_X
Spring ID for steering column intrusion in the X direction
STEERING_COL_INTRUSION_SPRING_Y
Spring ID for steering column intrusion in the Y direction
STEERING_COL_INTRUSION_SPRING_Z
Spring ID for steering column intrusion in the Z direction
STEERING_WHEEL_AIRBAG
String Flag to say if there is a steering wheel airbag or not.
Can be YES or NO.
UNIT_LENGTH
String Model’s length unit. Can be m, cm, mm, inch or ft.
UNIT_MASS
String Model’s mass unit. Can be tonne, kg, lb, slug or gm.
UNIT_TIME
String Model’s time unit. Can be s, ms or us.
Batch Arguments
The template can be run in batch with the following command:
• reporter.exe -batch -file=template_name -varTEMPLATE_ARGS=args_filename
Where args_filename is a file containing arguments to pass to the template in comma separated ’arg_name’,’arg_value’
pairs, e.g.
• KEYWORD_FILE,C:\my_model.key
• CSV_FILE,C:\data.csv
• etc...
The arguments can be:
Name
Description
CSV_FILE (optional)
Filename of the CSV file containing the extra data (entity IDs, etc). If this is not specified the
data needs to be specified in the keyword file as post *END data.
IMAGES_DIR
(optional)
Directory to write images to. If this is not specified the template will write images in the
same directory as the keyword file.
KEYWORD_FILE
Model keyword filename.
RESULTS_DIR
(optional)
Directory to look for results. If this is not specified the template will look for results in the
same directory as the keyword file.
EuroNCAP ODB 2015 Template
Template Description
This template will generate a report for a front ODB impact based on the 2015 EuroNCAP protocol.
CSV File Details
The CSV file gives the template the extra data it needs to generate the report (entity IDs, etc).
The format is a list of comma separated ’var_name’,’var_value’ pairs, e.g.
• DRIVER_HEAD_NODE,100000
• PASSENGER_HEAD_NODE,200000
For entity IDs, the value can either be the label (a number) or the name if it is defined on the
*DATABASE_HISTORY_XXXX_ID card.
Required variables are:
Name
Page B.38
Type
Description
User manual Version 12.0, October 2014
REPORTER
ACCN_PEDAL_INTRUSION_SPRING_X
Spring ID for acceleration pedal intrusion in the X direction
ACCN_PEDAL_INTRUSION_SPRING_Z
Spring ID for acceleration pedal intrusion in the Z direction
A_PILLAR_INTRUSION_SPRING
Spring ID for A-Pillar intrusion
BRAKE_PEDAL_INTRUSION_SPRING_X
Spring ID for brake pedal intrusion in the X direction
BRAKE_PEDAL_INTRUSION_SPRING_Z
Spring ID for brake pedal intrusion in the Z direction
CLUTCH_PEDAL_INTRUSION_SPRING_X
Spring ID for clutch pedal intrusion in the X direction
CLUTCH_PEDAL_INTRUSION_SPRING_Z
Spring ID for clutch pedal intrusion in the Z direction
DRIVER_CHEST_TRANSDUCER
Spring ID for driver chest compression
DRIVER_DUMMY_VERSION
String Driver dummy version. Can be
V7_HUMANETICS_HIII_50TH_MALE or
V8_HUMANETICS_HIII_50TH_MALE. Use
V7_HUMANETICS_HIII_50TH_MALE for V7 and
earlier Humanetics dummies. Use
V8_HUMANETICS_HIII_50TH_MALE for V8 and
later Humanetics dummies. This is needed because
the method for calculating chest deflections changed
in V8. Up to V7 the chest transducer rotation is
converted to compression using a linear function. In
V8 a third order polynomial function is used.
DRIVER_HEAD_NODE
Node
DRIVER_LEFT_FEMUR_LOADCELL
Beam ID for driver left femur force
DRIVER_LEFT_KNEE_TRANSDUCER
Spring ID for driver left knee deflection
DRIVER_LEFT_LOWER_TIBIA_LOADCELL
Beam ID for driver left lower tibia force
DRIVER_LEFT_UPPER_TIBIA_LOADCELL
Beam ID for driver left upper tibia force
DRIVER_NECK_LOADCELL
Beam ID for driver neck force
DRIVER_RIGHT_FEMUR_LOADCELL
Beam ID for driver right femur force
DRIVER_RIGHT_KNEE_TRANSDUCER
Spring ID for driver right knee deflection
DRIVER_RIGHT_LOWER_TIBIA_LOADCELL
Beam ID for driver right lower tibia force
DRIVER_RIGHT_UPPER_TIBIA_LOADCELL
Beam ID for driver right upper tibia force
PASSENGER_CHEST_TRANSDUCER
Spring ID for passenger chest compression
PASSENGER_DUMMY_VERSION
String Passenger dummy version. Can be
V7_HUMANETICS_HIII_50TH_MALE or
V8_HUMANETICS_HIII_50TH_MALE. Use
V7_HUMANETICS_HIII_50TH_MALE for V7 and
earlier Humanetics dummies. Use
V8_HUMANETICS_HIII_50TH_MALE for V8 and
later Humanetics dummies. This is needed because
the method for calculating chest deflections changed
in V8. Up to V7 the chest transducer rotation is
converted to compression using a linear function. In
V8 a third order polynomial function is used.
PASSENGER_HEAD_NODE
Node
PASSENGER_LEFT_FEMUR_LOADCELL
Beam ID for passenger left femur force
PASSENGER_LEFT_KNEE_TRANSDUCER
Spring ID for passenger left knee deflection
PASSENGER_LEFT_LOWER_TIBIA_LOADCELL
Beam ID for passenger left lower tibia force
PASSENGER_LEFT_UPPER_TIBIA_LOADCELL
Beam ID for passenger left upper tibia force
PASSENGER_NECK_LOADCELL
Beam ID for passenger neck force
PASSENGER_RIGHT_FEMUR_LOADCELL
Beam ID for passenger right femur force
ID for driver head acceleration
ID for passenger head acceleration
Page B.39
REPORTER
User manual Version 12.0, October 2014
PASSENGER_RIGHT_KNEE_TRANSDUCER
Spring ID for passenger right knee deflection
PASSENGER_RIGHT_LOWER_TIBIA_LOADCELL Beam ID for passenger right lower tibia force
PASSENGER_RIGHT_UPPER_TIBIA_LOADCELL
Beam ID for passenger right upper tibia force
STEERING_COL_INTRUSION_SPRING_X
Spring ID for steering column intrusion in the X direction
STEERING_COL_INTRUSION_SPRING_Y
Spring ID for steering column intrusion in the Y direction
STEERING_COL_INTRUSION_SPRING_Z
Spring ID for steering column intrusion in the Z direction
STEERING_WHEEL_AIRBAG
String Flag to say if there is a steering wheel airbag or not.
Can be YES or NO.
UNIT_LENGTH
String Model’s length unit. Can be m, cm, mm, inch or ft.
UNIT_MASS
String Model’s mass unit. Can be tonne, kg, lb, slug or gm.
UNIT_TIME
String Model’s time unit. Can be s, ms or us.
Batch Arguments
The template can be run in batch with the following command:
• reporter.exe -batch -file=template_name -varTEMPLATE_ARGS=args_filename
Where args_filename is a file containing arguments to pass to the template in comma separated ’arg_name’,’arg_value’
pairs, e.g.
• KEYWORD_FILE,C:\my_model.key
• CSV_FILE,C:\data.csv
• etc...
The arguments can be:
Name
Description
CSV_FILE (optional)
Filename of the CSV file containing the extra data (entity IDs, etc). If this is not specified the
data needs to be specified in the keyword file as post *END data.
IMAGES_DIR
(optional)
Directory to write images to. If this is not specified the template will write images in the
same directory as the keyword file.
KEYWORD_FILE
Model keyword filename.
RESULTS_DIR
(optional)
Directory to look for results. If this is not specified the template will look for results in the
same directory as the keyword file.
EuroNCAP Pedestrian Head 2014 Template
Template Description
This template will generate a report for pedestrian head impacts based on the 2014 EuroNCAP protocol.
LST File Details
The Adult LST file gives the template the data it needs to generate the report (model keyword file locations, entity IDs,
etc).
The format is a list of comma separated ’$var_name’,’var_value’ pairs, and then a list of the keyword files. The variable
names must start with a ’$’. The model keyword files must be in the form ZONE_ROW_COLUMN.key. If you have
used the pedestrian markup tool in PRIMER to create the models they will automatically be labelled correctly. Where:
• ZONE should be ’a’
• ROW is the grid point row
• COLUMN is the grid point column
e.g.
•
•
$ADULT_HEAD_NODE_ID,100000
$UNIT_LENGTH,mm
Page B.40
User manual Version 12.0, October 2014
•
•
•
•
REPORTER
$UNIT_MASS,tonne
$UNIT_TIME,s
C:\Model\A_2_1\a_2_1.key
C:\Model\A_2_-1\a_2_-1.key
For entity IDs, the value can either be the label (a number) or the name if it is defined on the
*DATABASE_HISTORY_XXXX_ID card.
Required variables are:
Name
Type Description
$ADULT_HEAD_NODE_ID Node ID for adult head acceleration
$UNIT_LENGTH
String Model’s length unit. Can be m, cm, mm, inch or ft.
$UNIT_MASS
String Model’s mass unit. Can be tonne, kg, lb, slug or gm.
$UNIT_TIME
String Model’s time unit. Can be s, ms or us.
LST File Details
The Child LST file gives the template the data it needs to generate the report (model keyword file locations, entity IDs,
etc).
The format is a list of comma separated ’$var_name’,’var_value’ pairs, and then a list of the keyword files. The variable
names must start with a ’$’. The model keyword files must be in the form ZONE_ROW_COLUMN.key. If you have
used the pedestrian markup tool in PRIMER to create the models they will automatically be labelled correctly. Where:
• ZONE should be ’c’
• ROW is the grid point row
• COLUMN is the grid point column
e.g.
•
•
•
•
•
•
$CHILD_HEAD_NODE_ID,100000
$UNIT_LENGTH,mm
$UNIT_MASS,tonne
$UNIT_TIME,s
C:\Model\C_1_1\c_1_1.key
C:\Model\C_1_-1\c_1_-1.key
For entity IDs, the value can either be the label (a number) or the name if it is defined on the
*DATABASE_HISTORY_XXXX_ID card.
Required variables are:
Name
Type Description
$CHILD_HEAD_NODE_ID Node ID for child head acceleration
$UNIT_LENGTH
String Model’s length unit. Can be m, cm, mm, inch or ft.
$UNIT_MASS
String Model’s mass unit. Can be tonne, kg, lb, slug or gm.
$UNIT_TIME
String Model’s time unit. Can be s, ms or us.
Batch Arguments
The template can be run in batch with the following command:
• reporter.exe -batch -file=template_name -varTEMPLATE_ARGS=args_filename
Where args_filename is a file containing arguments to pass to the template in comma separated ’arg_name’,’arg_value’
pairs, e.g.
• ADULT_LST_FILE,C:\adult.lst
• CHILD_LST_FILE,C:\child.lst
• etc...
The arguments can be:
Page B.41
REPORTER
User manual Version 12.0, October 2014
Name
Description
ADULT_LST_FILE
Adult .lst filename.
CHILD_LST_FILE
Child .lst filename.
IMAGES_DIR
(optional)
Directory to write images to. If this is not specified the template will write images in the
same directory as the keyword file.
EuroNCAP Pedestrian Head 2015 Template
Template Description
This template will generate a report for pedestrian head impacts based on the 2015 EuroNCAP protocol.
LST File Details
The Adult LST file gives the template the data it needs to generate the report (model keyword file locations, entity IDs,
etc).
The format is a list of comma separated ’$var_name’,’var_value’ pairs, and then a list of the keyword files. The variable
names must start with a ’$’. The model keyword files must be in the form ZONE_ROW_COLUMN.key. If you have
used the pedestrian markup tool in PRIMER to create the models they will automatically be labelled correctly. Where:
• ZONE should be ’a’
• ROW is the grid point row
• COLUMN is the grid point column
e.g.
•
•
•
•
•
•
$ADULT_HEAD_NODE_ID,100000
$UNIT_LENGTH,mm
$UNIT_MASS,tonne
$UNIT_TIME,s
C:\Model\A_2_1\a_2_1.key
C:\Model\A_2_-1\a_2_-1.key
For entity IDs, the value can either be the label (a number) or the name if it is defined on the
*DATABASE_HISTORY_XXXX_ID card.
Required variables are:
Name
Type Description
$ADULT_HEAD_NODE_ID Node ID for adult head acceleration
$UNIT_LENGTH
String Model’s length unit. Can be m, cm, mm, inch or ft.
$UNIT_MASS
String Model’s mass unit. Can be tonne, kg, lb, slug or gm.
$UNIT_TIME
String Model’s time unit. Can be s, ms or us.
LST File Details
The Child LST file gives the template the data it needs to generate the report (model keyword file locations, entity IDs,
etc).
The format is a list of comma separated ’$var_name’,’var_value’ pairs, and then a list of the keyword files. The variable
names must start with a ’$’. The model keyword files must be in the form ZONE_ROW_COLUMN.key. If you have
used the pedestrian markup tool in PRIMER to create the models they will automatically be labelled correctly. Where:
• ZONE should be ’c’
• ROW is the grid point row
• COLUMN is the grid point column
e.g.
•
•
•
•
$CHILD_HEAD_NODE_ID,100000
$UNIT_LENGTH,mm
$UNIT_MASS,tonne
$UNIT_TIME,s
Page B.42
User manual Version 12.0, October 2014
•
•
REPORTER
C:\Model\C_1_1\c_1_1.key
C:\Model\C_1_-1\c_1_-1.key
For entity IDs, the value can either be the label (a number) or the name if it is defined on the
*DATABASE_HISTORY_XXXX_ID card.
Required variables are:
Name
Type Description
$CHILD_HEAD_NODE_ID Node ID for child head acceleration
$UNIT_LENGTH
String Model’s length unit. Can be m, cm, mm, inch or ft.
$UNIT_MASS
String Model’s mass unit. Can be tonne, kg, lb, slug or gm.
$UNIT_TIME
String Model’s time unit. Can be s, ms or us.
Batch Arguments
The template can be run in batch with the following command:
• reporter.exe -batch -file=template_name -varTEMPLATE_ARGS=args_filename
Where args_filename is a file containing arguments to pass to the template in comma separated ’arg_name’,’arg_value’
pairs, e.g.
• ADULT_LST_FILE,C:\adult.lst
• CHILD_LST_FILE,C:\child.lst
• etc...
The arguments can be:
Name
Description
ADULT_LST_FILE
Adult .lst filename.
CHILD_LST_FILE
Child .lst filename.
IMAGES_DIR
(optional)
Directory to write images to. If this is not specified the template will write images in the
same directory as the keyword file.
EuroNCAP Pedestrian Legform 2013 Template
Template Description
This template will generate a report for pedestrian leg impacts based on the 2013 EuroNCAP protocol.
LST File Details
The Lower Legform LST file gives the template the extra data it needs to generate the report (model keyword file
locations, entity IDs, etc).
The format is a list of comma separated ’$var_name’,’var_value’ pairs, and then a list of the keyword files and impact
zones e.g. The variable names must start with a ’$’. The lines with the model keyword files need to have three columns
of data separated by commas: FILENAME,BLANK,ZONE. If you have used the pedestrian markup tool in PRIMER
to create the models they will automatically be labelled correctly. Where:
• FILENAME is the keyword filename
• BLANK is a blank column
• ZONE is the impact zone, e.g. L1A, L1B, L2A, L2B, etc.
e.g.
•
•
•
•
•
•
•
$TIBIA_NODE_ID,100000
$KNEE_DISPLACEMENT_SPRING_ID,200000
$KNEE_ANGLE_SPRING_ID,300000
$UNIT_LENGTH,mm
$UNIT_MASS,tonne
$UNIT_TIME,s
C:\Model\L1A\l1a.key,,L1A
Page B.43
REPORTER
•
User manual Version 12.0, October 2014
C:\Model\L1B\l1b.key,,L1B
For entity IDs, the value can either be the label (a number) or the name if it is defined on the
*DATABASE_HISTORY_XXXX_ID card.
Required variables are:
Name
Type
Description
$KNEE_ANGLE_SPRING_ID
Spring ID for knee angle
$KNEE_DISPLACEMENT_SPRING_ID Spring ID for knee displacement
$TIBIA_NODE_ID
Node
ID for tibia acceleration
$UNIT_LENGTH
String Model’s length unit. Can be m, cm, mm, inch or ft.
$UNIT_MASS
String Model’s mass unit. Can be tonne, kg, lb, slug or gm.
$UNIT_TIME
String Model’s time unit. Can be s, ms or us.
LST File Details
The Upper Legform LST file gives the template the extra data it needs to generate the report (model keyword file
locations, entity IDs, etc).
The format is a list of comma separated ’$var_name’,’var_value’ pairs, and then a list of the keyword files and impact
zones e.g. The variable names must start with a ’$’. The lines with the model keyword files need to have three columns
of data separated by commas: FILENAME,BLANK,ZONE. If you have used the pedestrian markup tool in PRIMER
to create the models they will automatically be labelled correctly. Where:
• FILENAME is the keyword filename
• BLANK is a blank column
• ZONE is the impact zone, e.g. U1A, U1B, U2A, U2B, etc.
e.g.
•
•
•
•
•
•
•
•
•
•
$BEAM_FEMUR1_ID,100000
$BEAM_FEMUR2_ID,200000
$XSECTION_FEMUR_UPPER_ID,100000
$XSECTION_FEMUR_CENTRE_ID,200000
$XSECTION_FEMUR_LOWER_ID,300000
$UNIT_LENGTH,mm
$UNIT_MASS,tonne
$UNIT_TIME,s
C:\Model\U1A\u1a.key,,U1A
C:\Model\U1B\u1b.key,,U1B
For entity IDs, the value can either be the label (a number) or the name if it is defined on the
*DATABASE_HISTORY_XXXX_ID card.
Required variables are:
Name
Type
Description
$BEAM_FEMUR1_ID
Beam
ID for upper femur force
$BEAM_FEMUR2_ID
Beam
ID for lower femur force
$UNIT_LENGTH
String
Model’s length unit. Can be m, cm, mm, inch or ft.
$UNIT_MASS
String
Model’s mass unit. Can be tonne, kg, lb, slug or gm.
$UNIT_TIME
String
Model’s time unit. Can be s, ms or us.
$XSECTION_FEMUR_CENTRE_ID Database CrossSection ID for centre femur moment
$XSECTION_FEMUR_LOWER_ID Database CrossSection ID for lower femur moment
$XSECTION_FEMUR_UPPER_ID
Page B.44
Database CrossSection ID for upper femur moment
User manual Version 12.0, October 2014
REPORTER
Batch Arguments
The template can be run in batch with the following command:
• reporter.exe -batch -file=template_name -varTEMPLATE_ARGS=args_filename
Where args_filename is a file containing arguments to pass to the template in comma separated ’arg_name’,’arg_value’
pairs, e.g.
• LOWER_LEG_LST_FILE,C:\lower_leg.lst
• UPPER_LEG_LST_FILE,C:\upper_leg.lst
• etc...
The arguments can be:
Name
Description
IMAGES_DIR (optional)
Directory to write images to. If this is not specified the template will write images in the
same directory as the keyword file.
LOWER_LEG_LST_FILE Lower leg .lst filename.
UPPER_LEG_LST_FILE
Upper leg .lst filename.
EuroNCAP Pedestrian Legform 2014 Template
Template Description
This template will generate a report for pedestrian leg impacts based on the 2014 EuroNCAP protocol.
LST File Details
The Lower Legform LST file gives the template the extra data it needs to generate the report (model keyword file
locations, entity IDs, etc).
The format is a list of comma separated ’$var_name’,’var_value’ pairs, and then a list of the keyword files and impact
zones e.g. The variable names must start with a ’$’. The lines with the model keyword files need to have three columns
of data separated by commas: FILENAME,BLANK,ZONE. If you have used the pedestrian markup tool in PRIMER
to create the models they will automatically be labelled correctly. Where:
• FILENAME is the keyword filename
• BLANK is a blank column
• ZONE is the impact zone, e.g. L_0, L_1, L_-1, etc.
e.g.
•
•
•
•
•
•
•
•
•
•
•
$XSECTION_TIBIA_UPPER_ID,100000
$XSECTION_TIBIA_MID_UPPER_ID,200000
$XSECTION_TIBIA_MID_LOWER_ID,300000
$SPRING_PCL_ID,300000
$SPRING_ACL_ID,300000
$SPRING_MCL_ID,300000
$UNIT_LENGTH,mm
$UNIT_MASS,tonne
$UNIT_TIME,s
C:\Model\L_0\l_0.key,,L_0
C:\Model\L_1\l_1.key,,L_1
For entity IDs, the value can either be the label (a number) or the name if it is defined on the
*DATABASE_HISTORY_XXXX_ID card.
Required variables are:
Name
Type
Description
$SPRING_ACL_ID
Spring
ID for ACL displacement
$SPRING_MCL_ID
Spring
ID for MCL displacement
$SPRING_PCL_ID
Spring
ID for PCL displacement
Page B.45
REPORTER
User manual Version 12.0, October 2014
$UNIT_LENGTH
String
Model’s length unit. Can be m, cm, mm, inch or ft.
$UNIT_MASS
String
Model’s mass unit. Can be tonne, kg, lb, slug or
gm.
$UNIT_TIME
String
Model’s time unit. Can be s, ms or us.
$XSECTION_TIBIA_LOWER_ID
Database
CrossSection
ID for lower tibia moment
$XSECTION_TIBIA_MID_LOWER_ID Database
CrossSection
ID for mid-lower tibia moment
$XSECTION_TIBIA_MID_UPPER_ID
Database
CrossSection
ID for mid-upper tibia moment
$XSECTION_TIBIA_UPPER_ID
Database
CrossSection
ID for upper tibia moment
LST File Details
The Upper Legform LST file gives the template the extra data it needs to generate the report (model keyword file
locations, entity IDs, etc).
The format is a list of comma separated ’$var_name’,’var_value’ pairs, and then a list of the keyword files and impact
zones e.g. The variable names must start with a ’$’. The lines with the model keyword files need to have three columns
of data separated by commas: FILENAME,BLANK,ZONE. If you have used the pedestrian markup tool in PRIMER
to create the models they will automatically be labelled correctly. Where:
• FILENAME is the keyword filename
• BLANK is a blank column
• ZONE is the impact zone, e.g. U_0, U_1, U_2, U_-1, etc.
e.g.
•
•
•
•
•
•
•
•
•
•
$BEAM_FEMUR1_ID,100000
$BEAM_FEMUR2_ID,200000
$XSECTION_FEMUR_UPPER_ID,100000
$XSECTION_FEMUR_CENTRE_ID,200000
$XSECTION_FEMUR_LOWER_ID,300000
$UNIT_LENGTH,mm
$UNIT_MASS,tonne
$UNIT_TIME,s
C:\Model\U_0\u_0.key,,U_0
C:\Model\U_1\u_1.key,,U_1
For entity IDs, the value can either be the label (a number) or the name if it is defined on the
*DATABASE_HISTORY_XXXX_ID card.
Required variables are:
Name
Type
Description
$BEAM_FEMUR1_ID
Beam
ID for upper femur force
$BEAM_FEMUR2_ID
Beam
ID for lower femur force
$UNIT_LENGTH
String
Model’s length unit. Can be m, cm, mm, inch or ft.
$UNIT_MASS
String
Model’s mass unit. Can be tonne, kg, lb, slug or gm.
$UNIT_TIME
String
Model’s time unit. Can be s, ms or us.
$XSECTION_FEMUR_CENTRE_ID Database CrossSection ID for centre femur moment
$XSECTION_FEMUR_LOWER_ID Database CrossSection ID for lower femur moment
$XSECTION_FEMUR_UPPER_ID
Page B.46
Database CrossSection ID for upper femur moment
User manual Version 12.0, October 2014
REPORTER
Batch Arguments
The template can be run in batch with the following command:
• reporter.exe -batch -file=template_name -varTEMPLATE_ARGS=args_filename
Where args_filename is a file containing arguments to pass to the template in comma separated ’arg_name’,’arg_value’
pairs, e.g.
• LOWER_LEG_LST_FILE,C:\lower_leg.lst
• UPPER_LEG_LST_FILE,C:\upper_leg.lst
• etc...
The arguments can be:
Name
Description
IMAGES_DIR (optional)
Directory to write images to. If this is not specified the template will write images in the
same directory as the keyword file.
LOWER_LEG_LST_FILE Lower leg .lst filename.
UPPER_LEG_LST_FILE
Upper leg .lst filename.
EuroNCAP Pedestrian Legform 2015 Template
Template Description
This template will generate a report for pedestrian leg impacts based on the 2015 EuroNCAP protocol.
LST File Details
The Lower Legform LST file gives the template the extra data it needs to generate the report (model keyword file
locations, entity IDs, etc).
The format is a list of comma separated ’$var_name’,’var_value’ pairs, and then a list of the keyword files and impact
zones e.g. The variable names must start with a ’$’. The lines with the model keyword files need to have three columns
of data separated by commas: FILENAME,BLANK,ZONE. If you have used the pedestrian markup tool in PRIMER
to create the models they will automatically be labelled correctly. Where:
• FILENAME is the keyword filename
• BLANK is a blank column
• ZONE is the impact zone, e.g. L_0, L_1, L_-1, etc.
e.g.
•
•
•
•
•
•
•
•
•
•
•
$XSECTION_TIBIA_UPPER_ID,100000
$XSECTION_TIBIA_MID_UPPER_ID,200000
$XSECTION_TIBIA_MID_LOWER_ID,300000
$SPRING_PCL_ID,300000
$SPRING_ACL_ID,300000
$SPRING_MCL_ID,300000
$UNIT_LENGTH,mm
$UNIT_MASS,tonne
$UNIT_TIME,s
C:\Model\L_0\l_0.key,,L_0
C:\Model\L_1\l_1.key,,L_1
For entity IDs, the value can either be the label (a number) or the name if it is defined on the
*DATABASE_HISTORY_XXXX_ID card.
Required variables are:
Name
Type
Description
$SPRING_ACL_ID
Spring
ID for ACL displacement
$SPRING_MCL_ID
Spring
ID for MCL displacement
$SPRING_PCL_ID
Spring
ID for PCL displacement
Page B.47
REPORTER
User manual Version 12.0, October 2014
$UNIT_LENGTH
String
Model’s length unit. Can be m, cm, mm, inch or ft.
$UNIT_MASS
String
Model’s mass unit. Can be tonne, kg, lb, slug or
gm.
$UNIT_TIME
String
Model’s time unit. Can be s, ms or us.
$XSECTION_TIBIA_LOWER_ID
Database
CrossSection
ID for lower tibia moment
$XSECTION_TIBIA_MID_LOWER_ID Database
CrossSection
ID for mid-lower tibia moment
$XSECTION_TIBIA_MID_UPPER_ID
Database
CrossSection
ID for mid-upper tibia moment
$XSECTION_TIBIA_UPPER_ID
Database
CrossSection
ID for upper tibia moment
LST File Details
The Upper Legform LST file gives the template the extra data it needs to generate the report (model keyword file
locations, entity IDs, etc).
The format is a list of comma separated ’$var_name’,’var_value’ pairs, and then a list of the keyword files and impact
zones e.g. The variable names must start with a ’$’. The lines with the model keyword files need to have three columns
of data separated by commas: FILENAME,BLANK,ZONE. If you have used the pedestrian markup tool in PRIMER
to create the models they will automatically be labelled correctly. Where:
• FILENAME is the keyword filename
• BLANK is a blank column
• ZONE is the impact zone, e.g. U_0, U_1, U_2, U_-1, etc.
e.g.
•
•
•
•
•
•
•
•
•
•
$BEAM_FEMUR1_ID,100000
$BEAM_FEMUR2_ID,200000
$XSECTION_FEMUR_UPPER_ID,100000
$XSECTION_FEMUR_CENTRE_ID,200000
$XSECTION_FEMUR_LOWER_ID,300000
$UNIT_LENGTH,mm
$UNIT_MASS,tonne
$UNIT_TIME,s
C:\Model\U_0\u_0.key,,U_0
C:\Model\U_1\u_1.key,,U_1
For entity IDs, the value can either be the label (a number) or the name if it is defined on the
*DATABASE_HISTORY_XXXX_ID card.
Required variables are:
Name
Type
Description
$BEAM_FEMUR1_ID
Beam
ID for upper femur force
$BEAM_FEMUR2_ID
Beam
ID for lower femur force
$UNIT_LENGTH
String
Model’s length unit. Can be m, cm, mm, inch or ft.
$UNIT_MASS
String
Model’s mass unit. Can be tonne, kg, lb, slug or gm.
$UNIT_TIME
String
Model’s time unit. Can be s, ms or us.
$XSECTION_FEMUR_CENTRE_ID Database CrossSection ID for centre femur moment
$XSECTION_FEMUR_LOWER_ID Database CrossSection ID for lower femur moment
$XSECTION_FEMUR_UPPER_ID
Page B.48
Database CrossSection ID for upper femur moment
User manual Version 12.0, October 2014
REPORTER
Batch Arguments
The template can be run in batch with the following command:
• reporter.exe -batch -file=template_name -varTEMPLATE_ARGS=args_filename
Where args_filename is a file containing arguments to pass to the template in comma separated ’arg_name’,’arg_value’
pairs, e.g.
• LOWER_LEG_LST_FILE,C:\lower_leg.lst
• UPPER_LEG_LST_FILE,C:\upper_leg.lst
• etc...
The arguments can be:
Name
Description
IMAGES_DIR (optional)
Directory to write images to. If this is not specified the template will write images in the
same directory as the keyword file.
LOWER_LEG_LST_FILE Lower leg .lst filename.
UPPER_LEG_LST_FILE
Upper leg .lst filename.
EuroNCAP Side MDB 2014 Template
Template Description
This template will generate a report for a side MDB impact based on the 2014 EuroNCAP protocol.
CSV File Details
The CSV file gives the template the extra data it needs to generate the report (entity IDs, etc).
The format is a list of comma separated ’var_name’,’var_value’ pairs, e.g.
• DRIVER_HEAD_NODE,100000
• CHEST_UPPER_RIB_SPRING,200000
For entity IDs, the value can either be the label (a number) or the name if it is defined on the
*DATABASE_HISTORY_XXXX_ID card.
Required variables are:
Name
Type
Description
ABDOMEN_FORCE_FRONT_BEAM Beam ID for abdomen front force
ABDOMEN_FORCE_MID_BEAM
Beam ID for abdomen mid force
ABDOMEN_FORCE_REAR_BEAM
Beam ID for abdomen rear force
BACK_PLATE_BEAM
Beam ID for back plate force
CHEST_BOTTOM_RIB_SPRING
Spring ID for chest bottom rib compression
CHEST_MIDDLE_RIB_SPRING
Spring ID for chest middle rib compression
CHEST_UPPER_RIB_SPRING
Spring ID for chest upper rib compression
FEMUR_BEAM
Beam ID for femur force
HEAD_NODE
Node
PELVIS_BEAM
Beam ID for pelvis force
SHOULDER_BEAM
Beam ID for shoulder force
T12_BEAM
Beam ID for T12 force
UNIT_LENGTH
String Model’s length unit. Can be m, cm, mm, inch or ft.
ID for head acceleration
Page B.49
REPORTER
User manual Version 12.0, October 2014
UNIT_MASS
String Model’s mass unit. Can be tonne, kg, lb, slug or gm.
UNIT_TIME
String Model’s time unit. Can be s, ms or us.
Batch Arguments
The template can be run in batch with the following command:
• reporter.exe -batch -file=template_name -varTEMPLATE_ARGS=args_filename
Where args_filename is a file containing arguments to pass to the template in comma separated ’arg_name’,’arg_value’
pairs, e.g.
• KEYWORD_FILE,C:\my_model.key
• CSV_FILE,C:\data.csv
• etc...
The arguments can be:
Name
Description
CSV_FILE (optional)
Filename of the CSV file containing the extra data (entity IDs, etc). If this is not specified the
data needs to be specified in the keyword file as post *END data.
IMAGES_DIR
(optional)
Directory to write images to. If this is not specified the template will write images in the
same directory as the keyword file.
KEYWORD_FILE
Model keyword filename.
RESULTS_DIR
(optional)
Directory to look for results. If this is not specified the template will look for results in the
same directory as the keyword file.
EuroNCAP Side MDB 2015 Template
Template Description
This template will generate a report for a side MDB impact based on the 2015 EuroNCAP protocol.
CSV File Details
The CSV file gives the template the extra data it needs to generate the report (entity IDs, etc).
The format is a list of comma separated ’var_name’,’var_value’ pairs, e.g.
• DRIVER_HEAD_NODE,100000
• CHEST_UPPER_RIB_SPRING,200000
For entity IDs, the value can either be the label (a number) or the name if it is defined on the
*DATABASE_HISTORY_XXXX_ID card.
Required variables are:
Name
Type
Description
ABDOMEN_BOTTOM_SPRING Spring ID for abdomen bottom compression
ABDOMEN_UPPER_SPRING
Spring ID for abdomen upper compression
CHEST_BOTTOM_RIB_SPRING Spring ID for chest bottom rib compression
CHEST_MIDDLE_RIB_SPRING Spring ID for chest middle rib compression
CHEST_UPPER_RIB_SPRING
Spring ID for chest upper rib compression
HEAD_NODE
Node
PELVIS_BEAM
Beam ID for pelvis force
SHOULDER_LEFT_BEAM
Beam ID for left shoulder force
Page B.50
ID for head acceleration
User manual Version 12.0, October 2014
REPORTER
SHOULDER_RIGHT_BEAM
Beam ID for right shoulder force
UNIT_LENGTH
String Model’s length unit. Can be m, cm, mm, inch or ft.
UNIT_MASS
String Model’s mass unit. Can be tonne, kg, lb, slug or gm.
UNIT_TIME
String Model’s time unit. Can be s, ms or us.
Batch Arguments
The template can be run in batch with the following command:
• reporter.exe -batch -file=template_name -varTEMPLATE_ARGS=args_filename
Where args_filename is a file containing arguments to pass to the template in comma separated ’arg_name’,’arg_value’
pairs, e.g.
• KEYWORD_FILE,C:\my_model.key
• CSV_FILE,C:\data.csv
• etc...
The arguments can be:
Name
Description
CSV_FILE (optional)
Filename of the CSV file containing the extra data (entity IDs, etc). If this is not specified the
data needs to be specified in the keyword file as post *END data.
IMAGES_DIR
(optional)
Directory to write images to. If this is not specified the template will write images in the
same directory as the keyword file.
KEYWORD_FILE
Model keyword filename.
RESULTS_DIR
(optional)
Directory to look for results. If this is not specified the template will look for results in the
same directory as the keyword file.
EuroNCAP Side Pole 2014 Template
Template Description
This template will generate a report for a side pole impact based on the 2014 EuroNCAP protocol.
CSV File Details
The CSV file gives the template the extra data it needs to generate the report (entity IDs, etc).
The format is a list of comma separated ’var_name’,’var_value’ pairs, e.g.
• DRIVER_HEAD_NODE,100000
• CHEST_UPPER_RIB_SPRING,200000
For entity IDs, the value can either be the label (a number) or the name if it is defined on the
*DATABASE_HISTORY_XXXX_ID card.
Required variables are:
Name
Type
Description
ABDOMEN_FORCE_FRONT_BEAM Beam ID for abdomen front force
ABDOMEN_FORCE_MID_BEAM
Beam ID for abdomen mid force
ABDOMEN_FORCE_REAR_BEAM
Beam ID for abdomen rear force
BACK_PLATE_BEAM
Beam ID for back plate force
CHEST_BOTTOM_RIB_SPRING
Spring ID for chest bottom rib compression
CHEST_MIDDLE_RIB_SPRING
Spring ID for chest middle rib compression
Page B.51
REPORTER
User manual Version 12.0, October 2014
CHEST_UPPER_RIB_SPRING
Spring ID for chest upper rib compression
FEMUR_BEAM
Beam ID for femur force
HEAD_NODE
Node
PELVIS_BEAM
Beam ID for pelvis force
SHOULDER_BEAM
Beam ID for shoulder force
T12_BEAM
Beam ID for T12 force
UNIT_LENGTH
String Model’s length unit. Can be m, cm, mm, inch or ft.
UNIT_MASS
String Model’s mass unit. Can be tonne, kg, lb, slug or gm.
UNIT_TIME
String Model’s time unit. Can be s, ms or us.
ID for head acceleration
Batch Arguments
The template can be run in batch with the following command:
• reporter.exe -batch -file=template_name -varTEMPLATE_ARGS=args_filename
Where args_filename is a file containing arguments to pass to the template in comma separated ’arg_name’,’arg_value’
pairs, e.g.
• KEYWORD_FILE,C:\my_model.key
• CSV_FILE,C:\data.csv
• etc...
The arguments can be:
Name
Description
CSV_FILE (optional)
Filename of the CSV file containing the extra data (entity IDs, etc). If this is not specified the
data needs to be specified in the keyword file as post *END data.
IMAGES_DIR
(optional)
Directory to write images to. If this is not specified the template will write images in the
same directory as the keyword file.
KEYWORD_FILE
Model keyword filename.
RESULTS_DIR
(optional)
Directory to look for results. If this is not specified the template will look for results in the
same directory as the keyword file.
EuroNCAP Side Pole 2015 Template
Template Description
This template will generate a report for a side pole impact based on the 2015 EuroNCAP protocol.
CSV File Details
The CSV file gives the template the extra data it needs to generate the report (entity IDs, etc).
The format is a list of comma separated ’var_name’,’var_value’ pairs, e.g.
• DRIVER_HEAD_NODE,100000
• CHEST_UPPER_RIB_SPRING,200000
For entity IDs, the value can either be the label (a number) or the name if it is defined on the
*DATABASE_HISTORY_XXXX_ID card.
Required variables are:
Name
Type
Description
ABDOMEN_BOTTOM_SPRING Spring ID for abdomen bottom compression
Page B.52
User manual Version 12.0, October 2014
ABDOMEN_UPPER_SPRING
REPORTER
Spring ID for abdomen upper compression
CHEST_BOTTOM_RIB_SPRING Spring ID for chest bottom rib compression
CHEST_MIDDLE_RIB_SPRING Spring ID for chest middle rib compression
CHEST_UPPER_RIB_SPRING
Spring ID for chest upper rib compression
HEAD_NODE
Node
PELVIS_BEAM
Beam ID for pelvis force
SHOULDER_LEFT_BEAM
Beam ID for left shoulder force
SHOULDER_RIGHT_BEAM
Beam ID for right shoulder force
UNIT_LENGTH
String Model’s length unit. Can be m, cm, mm, inch or ft.
UNIT_MASS
String Model’s mass unit. Can be tonne, kg, lb, slug or gm.
UNIT_TIME
String Model’s time unit. Can be s, ms or us.
ID for head acceleration
Batch Arguments
The template can be run in batch with the following command:
• reporter.exe -batch -file=template_name -varTEMPLATE_ARGS=args_filename
Where args_filename is a file containing arguments to pass to the template in comma separated ’arg_name’,’arg_value’
pairs, e.g.
• KEYWORD_FILE,C:\my_model.key
• CSV_FILE,C:\data.csv
• etc...
The arguments can be:
Name
Description
CSV_FILE (optional)
Filename of the CSV file containing the extra data (entity IDs, etc). If this is not specified the
data needs to be specified in the keyword file as post *END data.
IMAGES_DIR
(optional)
Directory to write images to. If this is not specified the template will write images in the
same directory as the keyword file.
KEYWORD_FILE
Model keyword filename.
RESULTS_DIR
(optional)
Directory to look for results. If this is not specified the template will look for results in the
same directory as the keyword file.
GTR Pedestrian Head Template
Template Description
This template will generate a report for pedestrian head impacts based on the GTR protocol.
LST File Details
The Adult LST file gives the template the data it needs to generate the report (model keyword file locations, entity IDs,
etc).
The format is a list of comma separated ’$var_name’,’var_value’ pairs, and then a list of the keyword files and the X and
Y coordinates of the impact points. The variable names must start with a ’$’.
e.g.
•
•
•
•
•
$ADULT_HEAD_NODE_ID,100000
$UNIT_LENGTH,mm
$UNIT_MASS,tonne
$UNIT_TIME,s
C:\Model\A_2_1\a_2_1.key,,,600,100
Page B.53
REPORTER
•
User manual Version 12.0, October 2014
C:\Model\A_2_-1\a_2_-1.key,,,600,-100
For entity IDs, the value can either be the label (a number) or the name if it is defined on the
*DATABASE_HISTORY_XXXX_ID card.
Required variables are:
Name
Type Description
$ADULT_HEAD_NODE_ID Node ID for adult head acceleration
$UNIT_LENGTH
String Model’s length unit. Can be m, cm, mm, inch or ft.
$UNIT_MASS
String Model’s mass unit. Can be tonne, kg, lb, slug or gm.
$UNIT_TIME
String Model’s time unit. Can be s, ms or us.
LST File Details
The Child LST file gives the template the data it needs to generate the report (model keyword file locations, entity IDs,
etc).
The format is a list of comma separated ’$var_name’,’var_value’ pairs, and then a list of the keyword files and the X and
Y coordinates of the impact points. The variable names must start with a ’$’.
e.g.
•
•
•
•
•
•
$CHILD_HEAD_NODE_ID,100000
$UNIT_LENGTH,mm
$UNIT_MASS,tonne
$UNIT_TIME,s
C:\Model\C_2_1\c_2_1.key,,,500,100
C:\Model\C_2_-1\c_2_-1.key,,,500,-100
For entity IDs, the value can either be the label (a number) or the name if it is defined on the
*DATABASE_HISTORY_XXXX_ID card.
Required variables are:
Name
Type Description
$CHILD_HEAD_NODE_ID Node ID for child head acceleration
$UNIT_LENGTH
String Model’s length unit. Can be m, cm, mm, inch or ft.
$UNIT_MASS
String Model’s mass unit. Can be tonne, kg, lb, slug or gm.
$UNIT_TIME
String Model’s time unit. Can be s, ms or us.
Batch Arguments
The template can be run in batch with the following command:
• reporter.exe -batch -file=template_name -varTEMPLATE_ARGS=args_filename
Where args_filename is a file containing arguments to pass to the template in comma separated ’arg_name’,’arg_value’
pairs, e.g.
• ADULT_LST_FILE,C:\adult.lst
• CHILD_LST_FILE,C:\child.lst
• etc...
The arguments can be:
Name
Description
ADULT_BOUNDARY_FILE Adult boundary filename. This is a CSV file of the X and Y coords of the boundary for
the adult impact zone. It can be created automatically from the pedestrian markup
script in PRIMER.
ADULT_LST_FILE
Page B.54
Adult .lst filename.
User manual Version 12.0, October 2014
REPORTER
CHILD_BOUNDARY_FILE Child boundary filename. This is a CSV file of the X and Y coords of the boundary for
the child impact zone. It can be created automatically from the pedestrian markup
script in PRIMER.
CHILD_LST_FILE
Child .lst filename.
IMAGES_DIR (optional)
Directory to write images to. If this is not specified the template will write images in
the same directory as the keyword file.
IIHS ODB XIV Template
Template Description
This template will generate a report for a front ODB impact based on the IIHS version XIV protocol.
CSV File Details
The CSV file gives the template the extra data it needs to generate the report (entity IDs, etc).
The format is a list of comma separated ’var_name’,’var_value’ pairs, e.g.
• DRIVER_HEAD_NODE,100000
• PASSENGER_HEAD_NODE,200000
For entity IDs, the value can either be the label (a number) or the name if it is defined on the
*DATABASE_HISTORY_XXXX_ID card.
Required variables are:
Name
Type
Description
BRAKE_PEDAL_INTRUSION_SPRING_X
Spring ID for brake pedal intrusion in the X direction
BRAKE_PEDAL_INTRUSION_SPRING_Y
Spring ID for brake pedal intrusion in the Y direction
BRAKE_PEDAL_INTRUSION_SPRING_Z
Spring ID for brake pedal intrusion in the Z direction
CENTRE_TOEPAN_INTRUSION_SPRING_X
Spring ID for centre toepan intrusion in the X direction
CENTRE_TOEPAN_INTRUSION_SPRING_Y
Spring ID for centre toepan intrusion in the Y direction
CENTRE_TOEPAN_INTRUSION_SPRING_Z
Spring ID for centre toepan intrusion in the Z direction
DOOR_INTRUSION_SPRING_X
Spring ID for door intrusion in the X direction
DRIVER_CHEST_NODE_X
Node
ID for driver chest acceleration in X
DRIVER_CHEST_NODE_Y
Node
ID for driver chest acceleration in Y
DRIVER_CHEST_NODE_Z
Node
ID for driver chest acceleration in Z
DRIVER_CHEST_TRANSDUCER
Spring ID for driver chest compression
DRIVER_DUMMY_VERSION
String Driver dummy version. Can be
V7_HUMANETICS_HIII_50TH_MALE or
V8_HUMANETICS_HIII_50TH_MALE. Use
V7_HUMANETICS_HIII_50TH_MALE for V7 and
earlier Humanetics dummies. Use
V8_HUMANETICS_HIII_50TH_MALE for V8 and
later Humanetics dummies. This is needed because the
method for calculating chest deflections changed in V8.
Up to V7 the chest transducer rotation is converted to
compression using a linear function. In V8 a third order
polynomial function is used.
DRIVER_HEAD_NODE
Node
DRIVER_LEFT_FEMUR_LOADCELL
Beam ID for driver left femur force
DRIVER_LEFT_FOOT_NODE
Node
DRIVER_LEFT_KNEE_TRANSDUCER
Spring ID for driver left knee displacement
ID for driver head acceleration
ID for driver left foot acceleration
Page B.55
REPORTER
User manual Version 12.0, October 2014
DRIVER_LEFT_LOWER_TIBIA_LOADCELL
Beam ID for driver left lower tibia force
DRIVER_LEFT_UPPER_TIBIA_LOADCELL
Beam ID for driver left upper tibia force
DRIVER_RIGHT_FEMUR_LOADCELL
Beam ID for driver right femur force
DRIVER_RIGHT_FOOT_NODE
Node
DRIVER_RIGHT_KNEE_TRANSDUCER
Spring ID for driver right knee displacement
DRIVER_RIGHT_LOWER_TIBIA_LOADCELL
Beam ID for driver right lower tibia force
DRIVER_RIGHT_UPPER_TIBIA_LOADCELL
Beam ID for driver right upper tibia force
FOOTREST_INTRUSION_SPRING_X
Spring ID for footrest intrusion in the X direction
FOOTREST_INTRUSION_SPRING_Y
Spring ID for footrest intrusion in the Y direction
FOOTREST_INTRUSION_SPRING_Z
Spring ID for footrest intrusion in the Z direction
LEFT_INST_PANEL_INTRUSION_SPRING_X
Spring ID for left instrument panel intrusion in the X direction
LEFT_TOEPAN_INTRUSION_SPRING_X
Spring ID for left toepan intrusion in the X direction
LEFT_TOEPAN_INTRUSION_SPRING_Y
Spring ID for left toepan intrusion in the Y direction
LEFT_TOEPAN_INTRUSION_SPRING_Z
Spring ID for left toepan intrusion in the Z direction
ID for driver right foot acceleration
RIGHT_INST_PANEL_INTRUSION_SPRING_X Spring ID for right instrument panel intrusion in the X direction
RIGHT_TOEPAN_INTRUSION_SPRING_X
Spring ID for right toepan intrusion in the X direction
RIGHT_TOEPAN_INTRUSION_SPRING_Y
Spring ID for right toepan intrusion in the Y direction
RIGHT_TOEPAN_INTRUSION_SPRING_Z
Spring ID for right toepan intrusion in the Z direction
UNIT_LENGTH
String Model’s length unit. Can be m, cm, mm, inch or ft.
UNIT_MASS
String Model’s mass unit. Can be tonne, kg, lb, slug or gm.
UNIT_TIME
String Model’s time unit. Can be s, ms or us.
Batch Arguments
The template can be run in batch with the following command:
• reporter.exe -batch -file=template_name -varTEMPLATE_ARGS=args_filename
Where args_filename is a file containing arguments to pass to the template in comma separated ’arg_name’,’arg_value’
pairs, e.g.
• KEYWORD_FILE,C:\my_model.key
• CSV_FILE,C:\data.csv
• etc...
The arguments can be:
Name
Description
CSV_FILE (optional)
Filename of the CSV file containing the extra data (entity IDs, etc). If this is not specified the
data needs to be specified in the keyword file as post *END data.
IMAGES_DIR
(optional)
Directory to write images to. If this is not specified the template will write images in the
same directory as the keyword file.
KEYWORD_FILE
Model keyword filename.
RESULTS_DIR
(optional)
Directory to look for results. If this is not specified the template will look for results in the
same directory as the keyword file.
IIHS SOB II Template
Page B.56
User manual Version 12.0, October 2014
REPORTER
Template Description
This template will generate a report for a front SOB impact based on the IIHS version II protocol.
CSV File Details
The CSV file gives the template the extra data it needs to generate the report (entity IDs, etc).
The format is a list of comma separated ’var_name’,’var_value’ pairs, e.g.
• DRIVER_HEAD_NODE,100000
• DRIVER_CHEST_NODE_X,200000
For entity IDs, the value can either be the label (a number) or the name if it is defined on the
*DATABASE_HISTORY_XXXX_ID card.
Required variables are:
Name
Type
Description
BRAKE_PEDAL_INTRUSION_SPRING_X
Spring ID for brake pedal intrusion in the X direction
BRAKE_PEDAL_INTRUSION_SPRING_Y
Spring ID for brake pedal intrusion in the Y direction
BRAKE_PEDAL_INTRUSION_SPRING_Z
Spring ID for brake pedal intrusion in the Z direction
DRIVER_CHEST_NODE_X
Node
ID for driver chest acceleration in X
DRIVER_CHEST_NODE_Y
Node
ID for driver chest acceleration in Y
DRIVER_CHEST_NODE_Z
Node
ID for driver chest acceleration in Z
DRIVER_CHEST_TRANSDUCER
Spring ID for driver chest compression
DRIVER_DUMMY_VERSION
String Driver dummy version. Can be
V7_HUMANETICS_HIII_50TH_MALE or
V8_HUMANETICS_HIII_50TH_MALE. Use
V7_HUMANETICS_HIII_50TH_MALE for V7
and earlier Humanetics dummies. Use
V8_HUMANETICS_HIII_50TH_MALE for V8
and later Humanetics dummies. This is needed
because the method for calculating chest
deflections changed in V8. Up to V7 the chest
transducer rotation is converted to compression
using a linear function. In V8 a third order
polynomial function is used.
DRIVER_HEAD_NODE
Node
DRIVER_LEFT_FEMUR_LOADCELL
Beam ID for driver left femur force
DRIVER_LEFT_FOOT_NODE
Node
DRIVER_LEFT_KNEE_TRANSDUCER
Spring ID for driver left knee displacement
DRIVER_LEFT_LOWER_TIBIA_LOADCELL
Beam ID for driver left lower tibia force
DRIVER_LEFT_UPPER_TIBIA_LOADCELL
Beam ID for driver left upper tibia force
DRIVER_NECK_LOADCELL
Beam ID for driver neck force
DRIVER_RIGHT_FEMUR_LOADCELL
Beam ID for driver right femur force
DRIVER_RIGHT_FOOT_NODE
Node
DRIVER_RIGHT_KNEE_TRANSDUCER
Spring ID for driver right knee displacement
DRIVER_RIGHT_LOWER_TIBIA_LOADCELL
Beam ID for driver right lower tibia force
DRIVER_RIGHT_UPPER_TIBIA_LOADCELL
Beam ID for driver right upper tibia force
FOOTREST_INTRUSION_SPRING_X
Spring ID for footrest intrusion in the X direction
FOOTREST_INTRUSION_SPRING_Y
Spring ID for footrest intrusion in the Y direction
ID for driver head acceleration
ID for driver left foot acceleration
ID for driver right foot acceleration
Page B.57
REPORTER
User manual Version 12.0, October 2014
FOOTREST_INTRUSION_SPRING_Z
Spring ID for footrest intrusion in the Z direction
INSTRUMENT_PANEL_INTRUSION_SPRING_X
Spring ID for instrument panel intrusion in the X direction
INSTRUMENT_PANEL_INTRUSION_SPRING_Y
Spring ID for instrument panel intrusion in the Y direction
INSTRUMENT_PANEL_INTRUSION_SPRING_Z
Spring ID for instrument panel intrusion in the Z direction
LOWER_HINGE_1_INTRUSION_SPRING_X
Spring ID for first lower hinge intrusion in the X direction
LOWER_HINGE_1_INTRUSION_SPRING_Y
Spring ID for first lower hinge intrusion in the Y direction
LOWER_HINGE_1_INTRUSION_SPRING_Z
Spring ID for first lower hinge intrusion in the Z direction
LOWER_HINGE_2_INTRUSION_SPRING_X
Spring ID for second lower hinge intrusion in the X
direction
LOWER_HINGE_2_INTRUSION_SPRING_Y
Spring ID for second lower hinge intrusion in the Y
direction
LOWER_HINGE_2_INTRUSION_SPRING_Z
Spring ID for second lower hinge intrusion in the Z
direction
LOWER_HINGE_3_INTRUSION_SPRING_X
Spring ID for third lower hinge intrusion in the X
direction
LOWER_HINGE_3_INTRUSION_SPRING_Y
Spring ID for third lower hinge intrusion in the Y
direction
LOWER_HINGE_3_INTRUSION_SPRING_Z
Spring ID for third lower hinge intrusion in the Z
direction
PARKING_BRAKE_PEDAL_INTRUSION_SPRING_X Spring ID for parking brake pedal intrusion in the X
direction
PARKING_BRAKE_PEDAL_INTRUSION_SPRING_Y Spring ID for parking brake pedal intrusion in the Y
direction
PARKING_BRAKE_PEDAL_INTRUSION_SPRING_Z Spring ID for parking brake pedal intrusion in the Z
direction
ROCKER_PANEL_1_INTRUSION_SPRING_Y
Spring ID for first rocker panel intrusion in the Y
direction
ROCKER_PANEL_2_INTRUSION_SPRING_Y
Spring ID for second rocker panel intrusion in the Y
direction
ROCKER_PANEL_3_INTRUSION_SPRING_Y
Spring ID for third rocker panel intrusion in the Y
direction
STEERING_COLUMN_INTRUSION_SPRING_X
Spring ID for steering column intrusion in the X direction
TOEPAN_INTRUSION_SPRING_X
Spring ID for toepan intrusion in the X direction
TOEPAN_INTRUSION_SPRING_Y
Spring ID for toepan intrusion in the Y direction
TOEPAN_INTRUSION_SPRING_Z
Spring ID for toepan intrusion in the Z direction
UNIT_LENGTH
String Model’s length unit. Can be m, cm, mm, inch or
ft.
UNIT_MASS
String Model’s mass unit. Can be tonne, kg, lb, slug or
gm.
UNIT_TIME
String Model’s time unit. Can be s, ms or us.
UPPER_HINGE_1_INTRUSION_SPRING_X
Spring ID for first upper hinge intrusion in the X direction
UPPER_HINGE_1_INTRUSION_SPRING_Y
Spring ID for first upper hinge intrusion in the Y direction
UPPER_HINGE_1_INTRUSION_SPRING_Z
Spring ID for first upper hinge intrusion in the Z direction
UPPER_HINGE_2_INTRUSION_SPRING_X
Spring ID for second upper hinge intrusion in the X
direction
Page B.58
User manual Version 12.0, October 2014
REPORTER
UPPER_HINGE_2_INTRUSION_SPRING_Y
Spring ID for second upper hinge intrusion in the Y
direction
UPPER_HINGE_2_INTRUSION_SPRING_Z
Spring ID for second upper hinge intrusion in the Z
direction
UPPER_HINGE_3_INTRUSION_SPRING_X
Spring ID for third upper hinge intrusion in the X
direction
UPPER_HINGE_3_INTRUSION_SPRING_Y
Spring ID for third upper hinge intrusion in the Y
direction
UPPER_HINGE_3_INTRUSION_SPRING_Z
Spring ID for third upper hinge intrusion in the Z
direction
Batch Arguments
The template can be run in batch with the following command:
• reporter.exe -batch -file=template_name -varTEMPLATE_ARGS=args_filename
Where args_filename is a file containing arguments to pass to the template in comma separated ’arg_name’,’arg_value’
pairs, e.g.
• KEYWORD_FILE,C:\my_model.key
• CSV_FILE,C:\data.csv
• etc...
The arguments can be:
Name
Description
CSV_FILE (optional)
Filename of the CSV file containing the extra data (entity IDs, etc). If this is not specified the
data needs to be specified in the keyword file as post *END data.
IMAGES_DIR
(optional)
Directory to write images to. If this is not specified the template will write images in the
same directory as the keyword file.
KEYWORD_FILE
Model keyword filename.
RESULTS_DIR
(optional)
Directory to look for results. If this is not specified the template will look for results in the
same directory as the keyword file.
Page B.59
REPORTER
Page B.60
User manual Version 12.0, October 2014
User manual Version 12.0, October 2014
REPORTER
C. FAQ
This section gives answers to some common questions which have been asked about REPORTER. Over time this FAQ
will be extended. If the answer to your question is not here then contact Oasys Ltd for support.
C.1 Running REPORTER
1.1
1.2
1.3
1.4
Can I run REPORTER from the command line?
Do I need a license to run REPORTER?
How do I get REPORTER to run automatically after my LS-DYNA job finishes?
How do I run REPORTER in batch mode?
C.2 Generating output
2.1
None of my scripts/programs work on windows
C.3 Extending REPORTER
3.1
3.2
Can I write my own scripts?
Can I add new scripts/images/pages to the library?
C.4 Other questions
4.1
4.2
Text appears to be bigger/smaller on the screen than in a postscript/pdf file
REPORTER doesn’t have xxxx capability. Can you add it?
Answers
1.1
Can I run REPORTER from the command line?
Yes you can. See appendix A for a list of command line options.
1.2
Do I need a license to run REPORTER?
To run REPORTER you need a valid license for REPORTER or alternatively a valid license for D3PLOT,
T/HIS or PRIMER. To get maximum benefit from REPORTER, D3PLOT and T/HIS are required.
1.3
How do I get REPORTER to run automatically after my LS-DYNA job finishes?
Use the Oasys Ltd shell to submit your job which has options to allow you to run REPORTER automatically.
1.4
How do I run REPORTER in batch mode?
REPORTER does not have a batch mode which means that it requires a display to be able to draw things on. In
reality this is not too much of a problem as D3PLOT will also need a display. You can give a DISPLAY that
REPORTER can display back to. This can be a computer which is left logged in or a virtual display using xvfb.
Additionally to stop REPORTER from pausing to ask for confirmations you should use the -batch command
line argument.
2.1
None of my scripts/programs work on windows
1.
Do you have perl, python, Tcl (or whatever your script is written in) installed on your machine?
2.
Do you have the correct file extensions and associations for this type of file. e.g. for perl the script
should be ’script.pl’ and this should be associated with the perl executable on your machine.
3.
Do any of the program arguments have spaces in them? If so you may need to quote them. For example:
%MYPATH%\scripts\title.pl "C:\my directory\my file with spaces.key"
3.1
Can I write my own scripts?
Yes. See chapter 11 and appendix D for more details.
3.2
Can I add new scripts/images/pages to the library?
Yes. See appendix B for more details.
Page C.1
REPORTER
User manual Version 12.0, October 2014
4.1
Text appears to be bigger/smaller on the screen than in a postscript/pdf file.
This can be a problem on Unix machines. Unlike windows machines which use true type fonts, fonts on unix
are stored as bitmaps. Only certain sizes are actually available. If you request a size that is not available the one
that is displayed could be the wrong size.
To get a list of the fonts (and sizes) on your unix machine use the command xlsfonts.
If you are trying to see how much space some text will take up in the presentation view try zooming into the
page. This may help.
4.2
REPORTER doesn’t have xxxx capability. Can you add it?
We will try. Please contact Oasys Ltd support to discuss it.
Page C.2
User manual Version 12.0, October 2014
REPORTER
D. JavaScript class reference
This appendix documents the javascript classes that REPORTER uses for scripting. It is not an introduction to scripting.
See chapter 11 for that.
REPORTER extends the javascript interpreter with the following new classes.
Class
Description
Colour
The Colour class defines colours in REPORTER.
File
The File class allows you to read and write from text files in REPORTER.
Image
The Image class allows you to create bitmaps in REPORTER.
Item
The Item class gives access to items in REPORTER.
Page
The Page class gives access to pages in REPORTER.
Reporter
The Reporter class is the root class for objects, properties etc in REPORTER.
Template
The Template class gives access to templates in REPORTER.
Variable
The Variable class gives access to variables in REPORTER.
In addition REPORTER also adds some new methods to the global Javascript object.
Page D.1
REPORTER
User manual Version 12.0, October 2014
global class
The global class is the root object in Javascript. More...
Class functions
•
•
•
•
•
•
•
•
•
•
•
Batch()
Debug(string[Any valid javascript type])
Exit()
LogError(arg1[Any valid javascript type], ...[Any valid javascript type])
LogPrint(arg1[Any valid javascript type], ...[Any valid javascript type])
LogWarning(arg1[Any valid javascript type], ...[Any valid javascript type])
Output(string[Any valid javascript type])
System(string[Any valid javascript type])
debug()
exit()
output()
global properties
Name
Type
Description
reporter Reporter This property is deprecated in version 12.0. It is only provided to keep old scripts working. We
strongly advise against using it in new scripts. Support may be removed in future versions.
[deprecated]
Detailed Description
When Reporter is started a single global class object is created. All of the standard JavaScript functions and properties
are available from it.
In addition an instance of a Reporter class is available, from the global reporter property. The reporter object allows you
to access the properties and templates used in Reporter.
Details of functions
Batch() [static]
Description
This method can be used to test whether REPORTER is running in batch mode or not.
Arguments
No arguments
Return type
true/false
Example
To check if REPORTER is running in batch mode
if (Batch()) { do something }
Page D.2
User manual Version 12.0, October 2014
REPORTER
Debug(string[Any valid javascript type]) [static]
Description
Print a string to log file for debugging. Anything that you call the debug method on will be ’printed’ to the log file
window. Note that a carriage return will automatically be added.
Arguments
Name Type
Description
string Any valid javascript type The string/item that you want to debug
Return type
No return value
Example
To print string "Hello, world!" to the debug log file
Debug("Hello, world!");
Exit() [static]
Description
Stop execution and exit from script
Arguments
No arguments
Return type
No return value
Example
Exit from script with
Exit();
Page D.3
REPORTER
User manual Version 12.0, October 2014
LogError(arg1[Any valid javascript type], ...[Any valid javascript type]) [static]
Description
Print an error to log file. Anything that you print will be output to the log file window in bold red text. Note that a
carriage return will automatically be added.
Arguments
Name Type
Description
arg1
Any valid javascript type The string/item that you want to print
...
Any valid javascript type The string/item that you want to print
Return type
No return value
Example
To give error "Error: something has gone wrong" to the log file
LogError("Error: something has gone wrong");
Any number of arguments can be given. They will be concatenated. e.g.
LogError("The value of i is ", i, " elephants");
LogPrint(arg1[Any valid javascript type], ...[Any valid javascript type]) [static]
Description
Print a string to log file. Anything that you print will be output to the log file window. Note that a carriage return will
automatically be added.
Arguments
Name Type
Description
arg1
Any valid javascript type The string/item that you want to print
...
Any valid javascript type The string/item that you want to print
Return type
No return value
Example
To print string "Hello, world!" to the log file
LogPrint("Hello, world!");
Any number of arguments can be given. They will be concatenated. e.g.
LogPrint("The value of i is ", i, " elephants");
Page D.4
User manual Version 12.0, October 2014
REPORTER
LogWarning(arg1[Any valid javascript type], ...[Any valid javascript type])
[static]
Description
Print a warning to log file. Anything that you print will be output to the log file window in red text. Note that a
carriage return will automatically be added.
Arguments
Name Type
Description
arg1
Any valid javascript type The string/item that you want to print
...
Any valid javascript type The string/item that you want to print
Return type
No return value
Example
To give warning "Warning: something has gone wrong" to the log file
LogWarning("Warning: something has gone wrong");
Any number of arguments can be given. They will be concatenated. e.g.
LogWarning("The value of i is ", i, " elephants");
Output(string[Any valid javascript type]) [static]
Description
Output a string from a script. Note that a carriage return is not automatically added.
Arguments
Name Type
Description
string Any valid javascript type The string/item that you want to print
Return type
No return value
Example
To output string "Hello, world!" with a carriage return:
Output("Hello, world!\n");
Page D.5
REPORTER
User manual Version 12.0, October 2014
System(string[Any valid javascript type]) [static]
Description
Do a system command outside PRIMER.
Arguments
Name Type
Description
string Any valid javascript type The system command that you want to do
Return type
integer (probably zero if command successful but is implementation-dependant)
Example
To make the directory "example"
System("mkdir example");
debug() [static]
This function is deprecated in version 12.0. It is only provided to keep old scripts working. We strongly advise against
using it in new scripts. Support may be removed in future versions.
Please use Debug() instead
exit() [static]
This function is deprecated in version 12.0. It is only provided to keep old scripts working. We strongly advise against
using it in new scripts. Support may be removed in future versions.
Please use Exit() instead
output() [static]
This function is deprecated in version 12.0. It is only provided to keep old scripts working. We strongly advise against
using it in new scripts. Support may be removed in future versions.
Please use Output() instead
Page D.6
User manual Version 12.0, October 2014
REPORTER
Colour class
The Colour class gives access to colours in Reporter. More...
Class functions
•
•
•
•
•
•
•
•
•
•
•
•
•
•
•
•
•
•
•
Black()
Blue()
Cyan()
Green()
Grey10()
Grey20()
Grey30()
Grey40()
Grey50()
Grey60()
Grey70()
Grey80()
Grey90()
Magenta()
None()
RGB(red[integer], green[integer], blue[integer])
Red()
White()
Yellow()
Colour properties
Name
Type
Description
blue (read only)
integer Colour blue component (0-255)
green (read only) integer Colour green component (0-255)
name (read only) string
red (read only)
Colour name
integer Colour red component (0-255)
Detailed Description
The Colour class is used to define colours, either by predefined colours or by RGB values. The easiest way to set the
colour of something is to use the predefined colour methods. e.g. to set the text colour of item i to red:
i.textColour = Colour.Red();
For other colours use Colour.RGB().
Page D.7
REPORTER
Details of functions
Black() [static]
Description
Creates a black colour
Arguments
No arguments
Return type
Colour object
Example
To set the text colour of item i to black:
i.textColour = Colour.Black();
Blue() [static]
Description
Creates a blue colour
Arguments
No arguments
Return type
Colour object
Example
To set the text colour of item i to blue:
i.textColour = Colour.Blue();
Page D.8
User manual Version 12.0, October 2014
User manual Version 12.0, October 2014
REPORTER
Cyan() [static]
Description
Creates a cyan colour
Arguments
No arguments
Return type
Colour object
Example
To set the text colour of item i to cyan:
i.textColour = Colour.Cyan();
Green() [static]
Description
Creates a green colour
Arguments
No arguments
Return type
Colour object
Example
To set the text colour of item i to green:
i.textColour = Colour.Green();
Page D.9
REPORTER
Grey10() [static]
Description
Creates a 10% grey colour
Arguments
No arguments
Return type
Colour object
Example
To set the text colour of item i to 10% grey:
i.textColour = Colour.Grey10();
Grey20() [static]
Description
Creates a 20% grey colour
Arguments
No arguments
Return type
Colour object
Example
To set the text colour of item i to 10% grey:
i.textColour = Colour.Grey20();
Page D.10
User manual Version 12.0, October 2014
User manual Version 12.0, October 2014
REPORTER
Grey30() [static]
Description
Creates a 30% grey colour
Arguments
No arguments
Return type
Colour object
Example
To set the text colour of item i to 30% grey:
i.textColour = Colour.Grey30();
Grey40() [static]
Description
Creates a 40% grey colour
Arguments
No arguments
Return type
Colour object
Example
To set the text colour of item i to 40% grey:
i.textColour = Colour.Grey40();
Page D.11
REPORTER
Grey50() [static]
Description
Creates a 50% grey colour
Arguments
No arguments
Return type
Colour object
Example
To set the text colour of item i to 50% grey:
i.textColour = Colour.Grey50();
Grey60() [static]
Description
Creates a 60% grey colour
Arguments
No arguments
Return type
Colour object
Example
To set the text colour of item i to 60% grey:
i.textColour = Colour.Grey60();
Page D.12
User manual Version 12.0, October 2014
User manual Version 12.0, October 2014
REPORTER
Grey70() [static]
Description
Creates a 70% grey colour
Arguments
No arguments
Return type
Colour object
Example
To set the text colour of item i to 70% grey:
i.textColour = Colour.Grey70();
Grey80() [static]
Description
Creates a 80% grey colour
Arguments
No arguments
Return type
Colour object
Example
To set the text colour of item i to 80% grey:
i.textColour = Colour.Grey80();
Page D.13
REPORTER
Grey90() [static]
Description
Creates a 90% grey colour
Arguments
No arguments
Return type
Colour object
Example
To set the text colour of item i to 90% grey:
i.textColour = Colour.Grey90();
Magenta() [static]
Description
Creates a magenta colour
Arguments
No arguments
Return type
Colour object
Example
To set the text colour of item i to magenta:
i.textColour = Colour.Magenta();
Page D.14
User manual Version 12.0, October 2014
User manual Version 12.0, October 2014
REPORTER
None() [static]
Description
No colour
Arguments
No arguments
Return type
Colour object
Example
To set the fill colour of item i to none:
i.fillColour = Colour.None();
RGB(red[integer], green[integer], blue[integer]) [static]
Description
Creates a colour from red, green and blue components
Arguments
Name Type
red
Description
integer red component of colour (0-255).
green integer green component of colour (0-255).
blue
integer blue component of colour (0-255).
Return type
colour value
Example
To set the text colour of item i to red:
i.textColour = Colour.RGB(255, 0, 0);
Page D.15
REPORTER
Red() [static]
Description
Creates a red colour
Arguments
No arguments
Return type
Colour object
Example
To set the text colour of item i to red:
i.textColour = Colour.Red();
White() [static]
Description
Creates a white colour
Arguments
No arguments
Return type
Colour object
Example
To set the text colour of item i to white:
i.textColour = Colour.White();
Page D.16
User manual Version 12.0, October 2014
User manual Version 12.0, October 2014
REPORTER
Yellow() [static]
Description
Creates a yellow colour
Arguments
No arguments
Return type
Colour object
Example
To set the text colour of item i to yellow:
i.textColour = Colour.Yellow();
Page D.17
REPORTER
User manual Version 12.0, October 2014
File class
The File class allows you to read and write from text files. More...
Class functions
•
•
•
•
•
•
•
•
•
•
•
ConvertSeparators(filename[string])
Delete(filename[string])
Directory(filename[string])
Exists(filename[string])
FindFiles(directory[string], pattern[string], recursive[boolean])
IsAbsolute(filename[string])
IsDirectory(filename[string])
IsFile(filename[string])
Mkdir(name[string])
SimplifyName(filename[string])
Size(filename[string])
Member functions
•
•
•
•
•
•
•
•
•
•
Close()
FindLineContaining(contain1[string], contain2 (optional)[string], contain3 (optional)[string], ... containn
(optional)[string])
FindLineMatching(regex[RegExp])
FindLineStarting(start1[string], start2 (optional)[string], start3 (optional)[string], ... startn (optional)[string])
Flush()
ReadChar()
ReadLine()
ReadLongLine()
Seek(position[integer])
Write(string[Any valid javascript type])
File constants
Name
Description
File.APPEND Flag to open file for appending
File.EOF
Flag to indicate end of file
File.READ
Flag to open file for reading
File.WRITE
Flag to open file for writing
Detailed Description
The File class allows you to read text and write text to files. There are various functions available that allow to to find
lines matching specific strings or regular expressions when reading.
Additionally, there are a number of utility functions to check if a file exists or is a directory etc.
Page D.18
User manual Version 12.0, October 2014
REPORTER
Constructor
File(filename[string], mode[constant])
Description
Create a new File object for reading and writing text files.
Arguments
Name
Type
filename string
mode
Description
Filename of the file you want to read/write. If reading, the file must exist. If writing, the file will
be overwritten if it already exists
constant The mode to open the file with. Can be File.READ, File.WRITE or File.APPEND
Return type
File object
Example
To create a new file object to read file "/data/test/file.txt"
var f = new File("/data/test/file.txt", File.READ);
Details of functions
Close()
Description
Close a file opened by a File object.
Arguments
No arguments
Return type
No return value
Example
To close File object f.
f.Close();
Page D.19
REPORTER
User manual Version 12.0, October 2014
ConvertSeparators(filename[string]) [static]
Description
Convert directory separators to the correct type for this operating system
Arguments
Name
Type Description
filename string Filename you want to convert separators on.
Return type
string filename
Example
e.g. on windows the filename "c:/test/file.key" would be converted to "c:\test\file.key" by
var converted = File.ConvertSeparators("c:/test/file.key");
Delete(filename[string]) [static]
Description
Delete a file
Arguments
Name
Type Description
filename string Filename you want to delete.
Return type
true if successful, false if not
Example
To delete the file "/data/test/file.txt"
var deleted = File.Delete("/data/test/file.txt");
Page D.20
User manual Version 12.0, October 2014
REPORTER
Directory(filename[string]) [static]
Description
Extract directory name from an absolute filename
Arguments
Name
Type Description
filename string Absolute filename you want to extract directory from.
Return type
string directory
Example
To extract the directory "/data/test/" from file "/data/test/file.key"
var directory = File.Directory("/data/test/file.key");
Exists(filename[string]) [static]
Description
Check if a file exists
Arguments
Name
Type Description
filename string Filename you want to check for existance.
Return type
true/false
Example
To see if the file "/data/test/file.key" exists
if (File.Exists("/data/test/file.key")) { do something }
Page D.21
REPORTER
User manual Version 12.0, October 2014
FindFiles(directory[string], pattern[string], recursive[boolean]) [static]
Description
Find any files in a directory (and subdirectories if required) matching a pattern
Arguments
Name
Type
Description
directory string
Directory to look for files in
pattern
Pattern to use to find matching files
string
recursive boolean If Reporter should look for files recursively or not
Return type
array filenames
Example
To find all of the files matching the pattern "*.key" recursively from directory /data/test
var filelist = File.FindFiles("/data/test/", "*.key", true);
Page D.22
User manual Version 12.0, October 2014
REPORTER
FindLineContaining(contain1[string], contain2 (optional)[string], contain3
(optional)[string], ... containn (optional)[string])
Description
Reads a line from a file which contains contain, opened for reading by a File object. To enable this function to be as fast
as possible a maximum line length of 256 characters is used. If you expect a file to have lines longer than 256 characters
then use ReadLongLine which allows lines of any length. If one argument is used then the line must contain that string.
If more than one argument is used then lines which contain argument1 OR argument2 OR argument3 will be returned
Arguments
Name
Type Description
contain1
string String which matching lines must contain (maximum length of 256 characters).
contain2 (optional)
string alternative string which matching lines must contain (maximum length of 256
characters).
contain3 (optional)
string alternative string which matching lines must contain (maximum length of 256
characters).
... containn
(optional)
string alternative string which matching lines must contain (maximum length of 256
characters).
Return type
string read from file or File.EOF if end of file
Example
Loop, reading lines from File object f which contain ’example’.
var line;
while ( (line = file.FindLineContaining("example") ) != File.EOF)
{
}
Page D.23
REPORTER
User manual Version 12.0, October 2014
FindLineMatching(regex[RegExp])
Description
Reads a line from a file opened for reading by a File object. To enable this function to be as fast as possible a maximum
line length of 256 characters is used. If you expect a file to have lines longer than 256 characters then use
ReadLongLine which allows lines of any length. Note that this may be much slower than FindLineStarting or
FindLineContaining, especially if the regular expression is very complicated.
Arguments
Name Type
Description
regex RegExp Regular expression which matching lines must match with.
Return type
string read from file or File.EOF if end of file
Example
Loop, reading lines from File object f which contain digits.
var line;
var regex = new RegExp("\\d+");
while ( (line = file.FindLineMatching(regex) ) != File.EOF)
{
}
Page D.24
User manual Version 12.0, October 2014
REPORTER
FindLineStarting(start1[string], start2 (optional)[string], start3 (optional)[string],
... startn (optional)[string])
Description
Reads a line from a file which starts with start, opened for reading by a File object. To enable this function to be as fast
as possible a maximum line length of 256 characters is used. If you expect a file to have lines longer than 256 characters
then use ReadLongLine which allows lines of any length. If one argument is used then the line must start with that
string. If more than one argument is used then lines which start argument1 OR argument2 OR argument3 will be
returned
Arguments
Name
Type Description
start1
string String which matching lines must start with (maximum length of 256 characters).
start2 (optional)
string alternative string which matching lines must start with (maximum length of 256
characters).
start3 (optional)
string alternative string which matching lines must start with (maximum length of 256
characters).
... startn
(optional)
string alternative string which matching lines must start with (maximum length of 256
characters).
Return type
string read from file or File.EOF if end of file
Example
Loop, reading lines from File object f which start ’example’.
var line;
while ( (line = file.FindLineStarting("example") ) != File.EOF)
{
}
Flush()
Description
Flushes a file opened for writing by a File object.
Arguments
No arguments
Return type
No return value
Example
To flush File object f.
f.Flush();
Page D.25
REPORTER
User manual Version 12.0, October 2014
IsAbsolute(filename[string]) [static]
Description
Check if a filename is absolute
Arguments
Name
Type Description
filename string Filename you want to test if absolute.
Return type
true/false
Example
To see if the file "/data/test/file.key" is absolute
if (File.IsAbsolute("/data/test/file.key")) { do something }
IsDirectory(filename[string]) [static]
Description
Check if a filename is a directory
Arguments
Name
Type Description
filename string Filename you want to test to see if it is a directory.
Return type
true/false
Example
To see if "/data/test" is a directory
if (File.IsDirectory("/data/test")) { do something }
Page D.26
User manual Version 12.0, October 2014
REPORTER
IsFile(filename[string]) [static]
Description
Check if a filename is a file
Arguments
Name
Type Description
filename string Filename you want to test to see if it is a file (i.e. not a directory).
Return type
true/false
Example
To see if "/data/test" is a file
if (File.IsFile("/data/test")) { do something }
Mkdir(name[string]) [static]
Description
makes a directory
Arguments
Name Type Description
name string Directory you want to create.
Return type
true if successful
Example
To make directory "/data/test" if it does not exist:
if (!File.IsDirectory("/data/test")) File.Mkdir("/data/test");
Page D.27
REPORTER
User manual Version 12.0, October 2014
ReadChar()
Description
Reads a single character from a file opened for reading by a File object.
Arguments
No arguments
Return type
character read from file or File.EOF if end of file
Example
Loop, reading characters from File object f.
var c;
while ( (c = f.ReadChar()) != undefined) { ... }
ReadLine()
Description
Reads a line from a file opened for reading by a File object. To enable this function to be as fast as possible a maximum
line length of 256 characters is used. If you expect a file to have lines longer than 256 characters then use
ReadLongLine which allows lines of any length.
Arguments
No arguments
Return type
string read from file or File.EOF if end of file
Example
Loop, reading lines from File object f.
var line;
while ( (line = file.ReadLine() ) != File.EOF)
{
}
Page D.28
User manual Version 12.0, October 2014
REPORTER
ReadLongLine()
Description
Reads a line from a file opened for reading by a File object. The line can be any length. If your file has lines shorter
than 256 characters then you may want to use ReadLine instead which is faster.
Arguments
No arguments
Return type
string read from file or File.EOF if end of file
Example
Loop, reading lines from File object f.
var line;
while ( (line = file.ReadLongLine() ) != File.EOF)
{
}
Seek(position[integer])
Description
Sets the file position for reading a file
Arguments
Name
Type
Description
position integer Position you want to seek to.
Return type
No return value
Example
To seek to position 1000 in file object f:
f.Seek(1000);
Page D.29
REPORTER
User manual Version 12.0, October 2014
SimplifyName(filename[string]) [static]
Description
Simplify the name of a file by removing //, /./ and /../
Arguments
Name
Type Description
filename string Filename you want to simplify.
Return type
string filename
Example
To simplify the filename "/data/test//../file.key"
var simple = File.SimplifyName("/data/test//../file.key");
This simplifies to "/data/file.key"
Size(filename[string]) [static]
Description
Check if a filename is a file
Arguments
Name
Type Description
filename string File you want to find the size of.
Return type
integer
Example
To find the size of file "/data/test"
var size = File.Size("/data/test");
Page D.30
User manual Version 12.0, October 2014
REPORTER
Write(string[Any valid javascript type])
Description
Write a string to a file opened for writing by a File object
Arguments
Name Type
Description
string Any valid javascript type The string/item that you want to write
Return type
No return value
Example
To write string "Hello, world!" to File object f
f.Write("Hello, world!\n");
To write the title of model 2 to File object f
f.Write("The title of model 2 is " + models[2].title + "\n");
Page D.31
REPORTER
User manual Version 12.0, October 2014
Image class
The Image class allows you to create bitmaps in Reporter. More...
Member functions
•
•
•
•
•
•
•
•
•
•
•
Ellipse(x1[integer], y1[integer], x2[integer], y2[integer])
Fill(x[integer], y[integer], tol (optional)[integer])
Line(x1[integer], y1[integer], x2[integer], y2[integer])
Load(filename[string])
PixelCount(colour[string], tol (optional)[integer])
Polygon(x1[integer], y1[integer], x2[integer], y2[integer], ... xn[integer], ... yn[integer])
Polyline(x1[integer], y1[integer], x2[integer], y2[integer], ... xn[integer], ... yn[integer])
Rectangle(x1[integer], y1[integer], x2[integer], y2[integer])
Save(filename[string], filetype[constant])
Star(x[integer], y[integer], r[integer])
Text(x[integer], y[integer], text[string])
Image constants
Name
Description
Image.BMP Save image as BMP
Image.JPG
Save image as JPG
Image.PNG Save image as PNG
Image properties
Name
Type
Description
fillColour
string
Colour to use when filling shapes on the Image. Can be "none", a valid colour from the X
colour database (see /etc/X11/rgb.txt) e.g. "Blue", or #RRGGBB (each of R, G and B is a
single hex digit) e.g. "#0000FF" for blue.
font
string
Font to use when drawing text on the Image. Can be "Courier", "Helvetica" or "Times"
fontAngle
integer
Angle (degrees) text is drawn at on the Image. Can be between -360 and 360 degrees.
fontColour
string
Colour to use when drawing text on the Image. Can be "none", a valid colour from the X
colour database (see /etc/X11/rgb.txt) e.g. "Blue", or #RRGGBB (each of R, G and B is a
single hex digit) e.g. "#0000FF" for blue.
fontJustify
constant Justification to use when drawing text on the Image. Can be Reporter.JUSTIFY_CENTRE,
Reporter.JUSTIFY_LEFT or Reporter.JUSTIFY_RIGHT
fontSize
integer
fontStyle
constant Style of font to use when drawing text on the Image. Can be any combination of
Reporter.TEXT_NORMAL, Reporter.TEXT_BOLD, Reporter.TEXT_ITALIC and
Reporter.TEXT_UNDERLINE
height
integer
Size of font (in points) to use when drawing text on the Image
Height of the Image
lineCapStyle constant Style to use for the end of lines on an Image. Can be Reporter.CAP_FLAT,
Reporter.CAP_SQUARE or Reporter.CAP_ROUND
lineColour
string
Colour to use when drawing lines on the Image. Can be "none", a valid colour from the X
colour database (see /etc/X11/rgb.txt) e.g. "Blue", or #RRGGBB (each of R, G and B is a
single hex digit) e.g. "#0000FF" for blue.
lineJoinStyle constant Style to use for the line join at vertices of polygons and polylines on an Image. Can be
Reporter.JOIN_MITRE, Reporter.JOIN_BEVEL or Reporter.JOIN_ROUND
lineStyle
Page D.32
constant Style to use when drawing lines on an Image. Can be Reporter.LINE_NONE,
Reporter.LINE_SOLID, Reporter.LINE_DASH, Reporter.LINE_DOT,
Reporter.LINE_DASH_DOT or Reporter.LINE_DASH_DOT_DOT
User manual Version 12.0, October 2014
lineWidth
integer
Width to use when drawing lines on an Image value
width
integer
Width of the Image
REPORTER
Detailed Description
The Image class allows you to create, load and save bitmaps. There are various functions available that allow to to draw
lines, rectangles, ellipses, text etc on a bitmap.
Constructor
Image(width (optional)[integer], height (optional)[integer])
Description
Create a new Image object for creating an image. If no arguments are given a null (0 pixels wide by 0 pixels high) is
made. If 2 arguments are given they are used as the width and height of the image.
Arguments
Name
Type
Description
width (optional) integer Width of image
height (optional) integer Height of image
Return type
Image object
Example
To create a new image object 100 pixels wide by 50 pixels high
var img = new Image(100, 50);
Page D.33
REPORTER
User manual Version 12.0, October 2014
Details of functions
Ellipse(x1[integer], y1[integer], x2[integer], y2[integer])
Description
Draw an ellipse on an image
Arguments
Name Type
Description
x1
integer X coordinate of start position for ellipse
y1
integer Y coordinate of start position for ellipse
x2
integer X coordinate of end position for ellipse
y2
integer Y coordinate of end position for ellipse
Return type
no return value
Example
To draw an ellipse with no fill and solid red border line width 2 pixels, on image ’idata’, starting at point 30, 20 and
finishing at point 100, 50
idata.lineColour = "red";
idata.fillColour = "none";
idata.lineWidth = 2;
idata.lineStyle = Reporter.LINE_SOLID;
idata.Ellipse(30, 20, 100, 50);
Page D.34
User manual Version 12.0, October 2014
REPORTER
Fill(x[integer], y[integer], tol (optional)[integer])
Description
Fill an area in an image with a colour.
Arguments
Name
Type
Description
x
integer X coordinate of start position for fill
y
integer Y coordinate of start position for fill
tol
(optional)
integer Tolerance for colour matching (0-255). Default is 0. When filling a shape if the red, green and
blue components are within tol of the colour of pixel (x, y) the pixel will be filled with the
current fill colour.
Return type
no return value
Example
To fill an area of image ’idata’, starting at point 30, 20 with red:
idata.fillColour = "red";
idata.Fill(30, 20);
Line(x1[integer], y1[integer], x2[integer], y2[integer])
Description
Draw a line on an image
Arguments
Name Type
Description
x1
integer X coordinate of start position for line
y1
integer Y coordinate of start position for line
x2
integer X coordinate of end position for line
y2
integer Y coordinate of end position for line
Return type
no return value
Example
To draw a blue, dashed line width 2 pixels, on image ’idata’, starting at point 30, 20 and finishing at point 100, 50
idata.lineColour = "blue";
idata.lineWidth = 2;
idata.lineStyle = Reporter.LINE_DASH;
idata.Line(30, 20, 100, 50);
Page D.35
REPORTER
User manual Version 12.0, October 2014
Load(filename[string])
Description
Load an image file (gif, png, bmp or jpeg)
Arguments
Name
Type Description
filename string Imagename you want to load.
Return type
no return value
Example
To load the image file "/data/test/image.jpg" into the image object ’idata’
idata.Load("/data/test/image.jpg");
PixelCount(colour[string], tol (optional)[integer])
Description
Count the number of pixels in an image that have a specific colour.
Arguments
Name
Type
Description
colour
string
A valid colour from the X colour database (see /etc/X11/rgb.txt) e.g. "Blue", or #RRGGBB (each
of R, G and B is a single hex digit) e.g. "#0000FF" for blue
tol
(optional)
integer Tolerance for colour matching (0-255). Default is 0. When looking at pixels if the red, green and
blue components are within tol of the colour of pixel (x, y) the pixel will be counted.
Return type
Number of pixels (integer) with the colour.
Example
To fill an area of image ’idata’, starting at point 30, 20 with red:
idata.fillColour = "red";
idata.Fill(30, 20);
Page D.36
User manual Version 12.0, October 2014
REPORTER
Polygon(x1[integer], y1[integer], x2[integer], y2[integer], ... xn[integer], ...
yn[integer])
Description
Draw a polygon on an image. The last point is always connected back to the first point.
Arguments
Name Type
Description
x1
integer X coordinate of point 1
y1
integer Y coordinate of point 1
x2
integer X coordinate of point 2
y2
integer Y coordinate of point 2
... xn
integer X coordinate of point n
... yn
integer Y coordinate of point n
Alternatively you can specify a single argument which is an array of coordinates to use.
Return type
no return value
Example
To draw a blue polygon with a solid red border line width 2 pixels, on image ’idata’, connecting points (10,10) (20,10)
(20,20) (10,20)
idata.fillColour = "blue";
idata.lineColour = "red";
idata.lineWidth = 2;
idata.lineStyle = Reporter.LINE_DASH;
idata.Polygon(10,10, 20,10, 20,20, 10,20);
or
idata.fillColour = "blue";
idata.lineColour = "red";
idata.lineWidth = 2;
idata.lineStyle = Reporter.LINE_DASH;
var a = new Array(10,10, 20,10, 20,20, 10,20);
idata.Polygon(a);
Page D.37
REPORTER
User manual Version 12.0, October 2014
Polyline(x1[integer], y1[integer], x2[integer], y2[integer], ... xn[integer], ...
yn[integer])
Description
Draw a line with multiple straight segments on an image
Arguments
Name Type
Description
x1
integer X coordinate of point 1
y1
integer Y coordinate of point 1
x2
integer X coordinate of point 2
y2
integer Y coordinate of point 2
... xn
integer X coordinate of point n
... yn
integer Y coordinate of point n
Alternatively you can specify a single argument which is an array of coordinates to use.
Return type
no return value
Example
To draw a blue, dashed polyline width 2 pixels, on image ’idata’, connecting points (10,10) (20,10) (20,20) (10,20)
idata.lineColour = "blue";
idata.lineWidth = 2;
idata.lineStyle = Reporter.LINE_DASH;
idata.Polyline(10,10, 20,10, 20,20, 10,20);
or
idata.lineColour = "blue";
idata.lineWidth = 2;
idata.lineStyle = Reporter.LINE_DASH;
var a = new Array(10,10, 20,10, 20,20, 10,20);
idata.Polyline(a);
Page D.38
User manual Version 12.0, October 2014
REPORTER
Rectangle(x1[integer], y1[integer], x2[integer], y2[integer])
Description
Draw a rectangle on an image
Arguments
Name Type
Description
x1
integer X coordinate of start position for rectangle
y1
integer Y coordinate of start position for rectangle
x2
integer X coordinate of end position for rectangle
y2
integer Y coordinate of end position for rectangle
Return type
no return value
Example
To draw a rectangle with no fill and solid red border line width 2 pixels, on image ’idata’, starting at point 30, 20 and
finishing at point 100, 50
idata.lineColour = "red";
idata.fillColour = "none";
idata.lineWidth = 2;
idata.lineStyle = Reporter.LINE_SOLID;
idata.Rectangle(30, 20, 100, 50);
Save(filename[string], filetype[constant])
Description
Save an image to file (gif, png, bmp or jpeg)
Arguments
Name
Type
filename string
filetype
Description
Imagename you want to save.
constant Type you want to save as. Can be: Image.BMP, Image.JPG or Image.PNG
Return type
no return value
Example
To save the image object ’idata’ to file "/data/test/image.jpg" as a jpeg
idata.Save("/data/test/image.jpg", Image.JPG);
Page D.39
REPORTER
User manual Version 12.0, October 2014
Star(x[integer], y[integer], r[integer])
Description
Draw a star on an image
Arguments
Name Type
Description
x
integer X coordinate of centre of star
y
integer Y coordinate of centre of star
r
integer Radius of star
Return type
no return value
Example
To draw a blue star with yellow fill, on image ’idata’, centred at point 30, 20 with radius 10
idata.lineColour = "blue";
idata.fillColour = "yellow";
idata.Star(30, 20, 10);
Text(x[integer], y[integer], text[string])
Description
Draw text on an image
Arguments
Name Type
Description
x
integer X position for text
y
integer Y position for text
text
string
Text to write on image
Return type
no return value
Example
To write the text ’Test’ in Helvetica 12pt bold underlined, coloured red on image ’idata’, at point 30, 20
idata.fontColour = "red";
idata.fontSize = 12;
idata.fontStyle = Reporter.TEXT_BOLD | Reporter.TEXT_UNDERLINE;
idata.Text(30, 20, "Test");
Page D.40
User manual Version 12.0, October 2014
REPORTER
Item class
The Item class gives access to items in Reporter. More...
Class functions
•
•
GetAll(page[Page])
GetFromName(page[Page], name[string])
Member functions
•
Generate()
Item constants
Name
Description
Item.ARROW
Arrow item
Item.AUTO_TABLE
Automatic table item
Item.D3PLOT
D3Plot item
Item.ELLIPSE
Ellipse item
Item.IMAGE
Image item
Item.IMAGE_FILE
Image file item
Item.LIBRARY_IMAGE
Library image item
Item.LIBRARY_PROGRAM Library program item
Item.LINE
Line item
Item.NOTE
Note item
Item.PRIMER
Primer item
Item.PROGRAM
Program item
Item.RECTANGLE
Rectangle item
Item.SCRIPT
Script item
Item.TABLE
Table item
Item.TEXT
Text item
Item.TEXTBOX
Textbox item
Item.TEXT_FILE
Text file item
Item.THIS
T/HIS item
Item properties
Name
Type
Description
active
logical
If item is active or not. Inactive items will be skipped during report/page/item generation.
file
string
File for item. Valid for item types:
Item.IMAGE
Item.D3PLOT
Item.PRIMER
Item.THIS
Item.PROGRAM
Item.TEXT_FILE
Item.IMAGE_FILE
Page D.41
REPORTER
User manual Version 12.0, October 2014
fillColour
Colour
object
Colour of fill for the item.
Valid for item types Item.RECTANGLE, Item.ELLIPSE, Item.TEXTBOX, Item.PROGRAM
and Item.TEXT_FILE
fontName
string
Font for the item. Can be "Courier", "Helvetica", "Times" or "Symbol".
Valid for item types Item.TEXT, Item.TEXTBOX, Item.PROGRAM and Item.TEXT_FILE
fontSize
integer
Font size for the item (6 <= fontSize <= 72).
Valid for item types Item.TEXT, Item.TEXTBOX, Item.PROGRAM and Item.TEXT_FILE
fontStyle
constant
Font style for the item. Can be a combination of Reporter.TEXT_NORMAL,
Reporter.TEXT_BOLD, Reporter.TEXT_ITALIC or Reporter.TEXT_UNDERLINE
Valid for item types Item.TEXT, Item.TEXTBOX, Item.PROGRAM and Item.TEXT_FILE
justify
constant
Text justification for the item. Can be Reporter.JUSTIFY_CENTRE,
Reporter.JUSTIFY_LEFT or Reporter.JUSTIFY_RIGHT combined with
Reporter.JUSTIFY_TOP, Reporter.JUSTIFY_MIDDLE or Reporter.JUSTIFY_BOTTOM
Valid for item types Item.TEXT, Item.TEXTBOX, Item.PROGRAM and Item.TEXT_FILE
lineColour
Colour
object
Colour of outline for the item.
Valid for item types Item.LINE, Item.ARROW, Item.RECTANGLE, Item.ELLIPSE,
Item.TEXTBOX, Item.D3PLOT, Item.PRIMER, Item.THIS, Item.PROGRAM,
Item.TEXT_FILE and Item.IMAGE_FILE.
lineStyle
constant
Style of outline for the item. Can be Reporter.LINE_NONE, Reporter.LINE_SOLID,
Reporter.LINE_DASH, Reporter.LINE_DOT, Reporter.LINE_DASH_DOT or
Reporter.LINE_DASH_DOT_DOT
Valid for item types Item.LINE, Item.ARROW, Item.RECTANGLE, Item.ELLIPSE,
Item.TEXTBOX, Item.D3PLOT, Item.PRIMER, Item.THIS, Item.PROGRAM,
Item.TEXT_FILE and Item.IMAGE_FILE.
lineWidth
float
Width of outline for the item in mm.
Valid for item types Item.LINE, Item.ARROW, Item.RECTANGLE, Item.ELLIPSE,
Item.TEXTBOX, Item.D3PLOT, Item.PRIMER, Item.THIS, Item.PROGRAM,
Item.TEXT_FILE, Item.IMAGE_FILE, Item.TABLE and Item.AUTO_TABLE
name
string
Name of the Item
text
string
The text for the item.
Valid for item types Item.TEXT, Item.TEXTBOX, Item.PROGRAM, Item.TEXT_FILE and
Item.SCRIPT
textColour
Colour
object
Colour of text for the item.
Valid for item types Item.TEXT, Item.TEXTBOX, Item.PROGRAM and Item.TEXT_FILE
type (read
only)
constant
type of the Item. Can be Item.LINE, Item.TEXT etc.
x
float
X coordinate
x2
float
Second X coordinate for "rectangular" items
y
float
Y coordinate
y2
float
Second Y coordinate for "rectangular" items
Detailed Description
The Item class allows you to access the items in templates that Reporter currently has open.
Page D.42
User manual Version 12.0, October 2014
REPORTER
Constructor
Item(page[Page], type[constant], name (optional)[string])
Description
Create a new Item. The filename argument is optional. If present it is a file to open
Arguments
Name
Type
Description
page
Page
Page to create item in
type
constant Item type. Can be Item.LINE, Item.ARROW, Item.RECTANGLE, Item.ELLIPSE, Item.TEXT,
Item.TEXTBOX, Item.IMAGE, Item.PROGRAM, Item.D3PLOT, Item.PRIMER, Item.THIS,
Item.TEXT_FILE, Item.IMAGE_FILE, Item.LIBRARY_IMAGE,
Item.LIBRARY_PROGRAM, Item.TABLE, Item.AUTO_TABLE, Item.SCRIPT or
Item.NOTE.
name
(optional)
string
Name of item
Return type
Item object
Example
To create a new blank Item object
var template = new Item();
Details of functions
Generate()
Description
Generate an item
Arguments
No arguments
Return type
no return value
Example
To generate item i:
i.Generate();
Page D.43
REPORTER
GetAll(page[Page]) [static]
Description
Get all of the items in a page
Arguments
Name Type Description
page
Page Page to get items from
Return type
array of Item objects
Example
To get all of the items on page p:
var items = Item.GetAll(p);
GetFromName(page[Page], name[string]) [static]
Description
Get an Item from a name
Arguments
Name Type Description
page
Page Page to get item from
name string Item name
Return type
Item object (or null if item cannot be found)
Example
To get the item with name test on page p:
var item = Item.GetFromName(p, "test");
Page D.44
User manual Version 12.0, October 2014
User manual Version 12.0, October 2014
REPORTER
Page class
The Page class gives access to pages in Reporter. More...
Member functions
•
•
•
•
Duplicate()
Generate()
GetAllItems()
GetItem(index[integer])
Page properties
Name
Type
Description
items (read only)
integer The total number of items on the page
master (read only) logical true if this is a master page object.
name
string
Name of the Page
Detailed Description
The Page class allows you to access the pages in templates that Reporter currently has open.
Constructor
Page(template[Template], name (optional)[string])
Description
Create a new Page.
Arguments
Name
Type
template
Template Template to create page in
name (optional) string
Description
Name for page (empty if omitted)
Return type
Page object
Example
To create a new blank Page object in template t:
var page = new Page(t);
Page D.45
REPORTER
Details of functions
Duplicate()
Description
Duplicate a page
Arguments
No arguments
Return type
Page object
Example
To duplicate page p:
var dp = p.Duplicate();
Generate()
Description
Generate a page
Arguments
No arguments
Return type
no return value
Example
To generate page p:
p.Generate();
Page D.46
User manual Version 12.0, October 2014
User manual Version 12.0, October 2014
REPORTER
GetAllItems()
Description
Gets all of the items from a page.
Arguments
No arguments
Return type
Array of Item objects
Example
To get all of the items on page p:
var items = p.GetAllItems();
GetItem(index[integer])
Description
Get an item from a page.
Arguments
Name Type
Description
index integer The index of the item on the page that you want to get. Note that indices start at 0.
Return type
Item
Example
To get the 1st item on page p:
p.GetItem(0);
Page D.47
REPORTER
User manual Version 12.0, October 2014
Reporter class
The Reporter class contains constants for use in REPORTER. More...
Reporter constants
Name
Description
Reporter.CapFlat
This constant is deprecated in version 12.0. It is only provided to keep old scripts
working. We strongly advise against using it in new scripts. Support may be removed in
future versions.
Please use Reporter.CAP_FLAT instead [deprecated]
Reporter.CapRound
This constant is deprecated in version 12.0. It is only provided to keep old scripts
working. We strongly advise against using it in new scripts. Support may be removed in
future versions.
Please use Reporter.CAP_ROUND instead [deprecated]
Reporter.CapSquare
This constant is deprecated in version 12.0. It is only provided to keep old scripts
working. We strongly advise against using it in new scripts. Support may be removed in
future versions.
Please use Reporter.CAP_SQUARE instead [deprecated]
Reporter.JoinBevel
This constant is deprecated in version 12.0. It is only provided to keep old scripts
working. We strongly advise against using it in new scripts. Support may be removed in
future versions.
Please use Reporter.JOIN_BEVEL instead [deprecated]
Reporter.JoinMitre
This constant is deprecated in version 12.0. It is only provided to keep old scripts
working. We strongly advise against using it in new scripts. Support may be removed in
future versions.
Please use Reporter.JOIN_MITRE instead [deprecated]
Reporter.JoinRound
This constant is deprecated in version 12.0. It is only provided to keep old scripts
working. We strongly advise against using it in new scripts. Support may be removed in
future versions.
Please use Reporter.JOIN_ROUND instead [deprecated]
Reporter.JustifyBottom
This constant is deprecated in version 12.0. It is only provided to keep old scripts
working. We strongly advise against using it in new scripts. Support may be removed in
future versions.
Please use Reporter.JUSTIFY_BOTTOM instead [deprecated]
Reporter.JustifyCentre
This constant is deprecated in version 12.0. It is only provided to keep old scripts
working. We strongly advise against using it in new scripts. Support may be removed in
future versions.
Please use Reporter.JUSTIFY_CENTRE instead [deprecated]
Reporter.JustifyLeft
This constant is deprecated in version 12.0. It is only provided to keep old scripts
working. We strongly advise against using it in new scripts. Support may be removed in
future versions.
Please use Reporter.JUSTIFY_LEFT instead [deprecated]
Reporter.JustifyMiddle
This constant is deprecated in version 12.0. It is only provided to keep old scripts
working. We strongly advise against using it in new scripts. Support may be removed in
future versions.
Please use Reporter.JUSTIFY_MIDDLE instead [deprecated]
Reporter.JustifyRight
This constant is deprecated in version 12.0. It is only provided to keep old scripts
working. We strongly advise against using it in new scripts. Support may be removed in
future versions.
Please use Reporter.JUSTIFY_RIGHT instead [deprecated]
Reporter.JustifyTop
This constant is deprecated in version 12.0. It is only provided to keep old scripts
working. We strongly advise against using it in new scripts. Support may be removed in
future versions.
Please use Reporter.JUSTIFY_TOP instead [deprecated]
Page D.48
User manual Version 12.0, October 2014
REPORTER
Reporter.LineDash
This constant is deprecated in version 12.0. It is only provided to keep old scripts
working. We strongly advise against using it in new scripts. Support may be removed in
future versions.
Please use Reporter.LINE_DASH instead [deprecated]
Reporter.LineDashDot
This constant is deprecated in version 12.0. It is only provided to keep old scripts
working. We strongly advise against using it in new scripts. Support may be removed in
future versions.
Please use Reporter.LINE_DASH_DOT instead [deprecated]
Reporter.LineDashDotDot This constant is deprecated in version 12.0. It is only provided to keep old scripts
working. We strongly advise against using it in new scripts. Support may be removed in
future versions.
Please use Reporter.LINE_DASH_DOT_DOT instead [deprecated]
Reporter.LineDot
This constant is deprecated in version 12.0. It is only provided to keep old scripts
working. We strongly advise against using it in new scripts. Support may be removed in
future versions.
Please use Reporter.LINE_DOT instead [deprecated]
Reporter.LineNone
This constant is deprecated in version 12.0. It is only provided to keep old scripts
working. We strongly advise against using it in new scripts. Support may be removed in
future versions.
Please use Reporter.LINE_NONE instead [deprecated]
Reporter.LineSolid
This constant is deprecated in version 12.0. It is only provided to keep old scripts
working. We strongly advise against using it in new scripts. Support may be removed in
future versions.
Please use Reporter.LINE_SOLID instead [deprecated]
Reporter.TextBold
This constant is deprecated in version 12.0. It is only provided to keep old scripts
working. We strongly advise against using it in new scripts. Support may be removed in
future versions.
Please use Reporter.TEXT_BOLD instead [deprecated]
Reporter.TextItalic
This constant is deprecated in version 12.0. It is only provided to keep old scripts
working. We strongly advise against using it in new scripts. Support may be removed in
future versions.
Please use Reporter.TEXT_ITALIC instead [deprecated]
Reporter.TextNormal
This constant is deprecated in version 12.0. It is only provided to keep old scripts
working. We strongly advise against using it in new scripts. Support may be removed in
future versions.
Please use Reporter.TEXT_NORMAL instead [deprecated]
Reporter.TextUnderline
This constant is deprecated in version 12.0. It is only provided to keep old scripts
working. We strongly advise against using it in new scripts. Support may be removed in
future versions.
Please use Reporter.TEXT_UNDERLINE instead [deprecated]
Reporter.ViewDesign
This constant is deprecated in version 12.0. It is only provided to keep old scripts
working. We strongly advise against using it in new scripts. Support may be removed in
future versions.
Please use Reporter.VIEW_DESIGN instead [deprecated]
Reporter.ViewPresentation This constant is deprecated in version 12.0. It is only provided to keep old scripts
working. We strongly advise against using it in new scripts. Support may be removed in
future versions.
Please use Reporter.VIEW_PRESENTATION instead [deprecated]
Constants for Text style
Name
Description
Reporter.TEXT_BOLD
Text drawn in a bold font
Reporter.TEXT_ITALIC
Text drawn in an italic font
Reporter.TEXT_NORMAL
Text drawn in a normal font
Reporter.TEXT_UNDERLINE Text drawn underlined
Constants for Justification
Page D.49
REPORTER
User manual Version 12.0, October 2014
Name
Description
Reporter.JUSTIFY_BOTTOM
Bottom justification of text
Reporter.JUSTIFY_CENTREJustifyCentre Centre justification of text
Reporter.JUSTIFY_LEFT
Left justification of text
Reporter.JUSTIFY_MIDDLE
Middle justification of text
Reporter.JUSTIFY_RIGHT
Right justification of text
Reporter.JUSTIFY_TOP
Top justification of text
Constants for Line join style
Name
Description
Reporter.JOIN_BEVEL The triangular notch where the line segments meet is filled
Reporter.JOIN_MITRE
The outer edges of the line segments are extended to meet at an angle and this is filled
Reporter.JOIN_ROUND A circular arc between the two line segments is filled
Constants for Line cap style
Name
Description
Reporter.CAP_FLAT
A square line ending at the end point of the line
Reporter.CAP_ROUND
A rounded line ending
Reporter.CAP_SQUARE A square line that extends beyond the end point of the line by half the line width
Constants for View
Name
Description
Reporter.VIEW_DESIGN
Show template in design view
Reporter.VIEW_PRESENTATION Show template in presentation view
Constants for Line style
Name
Description
Reporter.LINE_DASH
A dashed line (dashes separated by a few pixels)
Reporter.LINE_DASH_DOT
A line drawn with alternate dashes and dots
Reporter.LINE_DASH_DOT_DOT A line drawn with one dash and two dots
Reporter.LINE_DOT
A dotted line (dots separated by a few pixels)
Reporter.LINE_NONE
Invisible line
Reporter.LINE_SOLID
A simple continuous line
Reporter properties
Name
Type
Description
currentTemplate Template This property is deprecated in version 12.0. It is only provided to keep old scripts
working. We strongly advise against using it in new scripts. Support may be removed in
future versions.
Please use Template.GetCurrent() instead [deprecated]
Page D.50
User manual Version 12.0, October 2014
templates
array
REPORTER
This property is deprecated in version 12.0. It is only provided to keep old scripts
working. We strongly advise against using it in new scripts. Support may be removed in
future versions.
Please use Template.GetAll() instead [deprecated]
Detailed Description
The Reporter class allows you to access constants used in REPORTER.
Page D.51
REPORTER
User manual Version 12.0, October 2014
Template class
The Template class gives access to templates in Reporter. More...
Class functions
•
•
GetAll()
GetCurrent()
Member functions
•
•
•
•
•
•
•
•
•
•
•
•
•
•
•
•
•
Close()
DeletePage(index[integer])
EditVariables(title (optional)[string], message (optional)[string], update (optional)[boolean], variables
(optional)[array], columns (optional)[constant])
ExpandVariablesInString(string[string])
Generate()
GetAllPages()
GetMaster()
GetPage(index[integer])
GetVariableDescription(name[string])
GetVariableValue(name[string])
Html(filename[string])
Pdf(filename[string])
Ppt(filename[string])
Print(printer[string])
Save()
SaveAs(filename[string])
Update()
Template properties
Name
Type
Description
name
string
Name of the Template
pages
integer
Number of Pages in template
variables array
view
This property is deprecated in version 12.0. It is only provided to keep old scripts working. We
strongly advise against using it in new scripts. Support may be removed in future versions.
Array of Variable objects for this template. Please use Variable.GetAll() and
Variable.GetFromName() instead. [deprecated]
constant Current view type (presentation or design view) for this Template. Can be:
Reporter.VIEW_DESIGN or Reporter.VIEW_PRESENTATION.
Detailed Description
The Template class allows you to access the templates that Reporter currently has open.
Note that if you want to get a list of the current templates in Reporter you should see the templates array in the reporter
object.
The currently active template is stored in the currentTemplate property of the reporter object.
Page D.52
User manual Version 12.0, October 2014
REPORTER
Constructor
Template(filename (optional)[string])
Description
Create a new Template. The filename argument is optional. If present it is a file to open
Arguments
Name
Type Description
filename (optional) string Name of template file to open
Return type
Template object
Example
To create a new blank Template object
var template = new Template();
Details of functions
Close()
Description
Close a template.
Note that if you call this function for a Template object, the Template data will be deleted, so you should not try
to use it afterwards!.
Arguments
No arguments
Return type
no return value
Example
To close template data:
data.Close();
Page D.53
REPORTER
User manual Version 12.0, October 2014
DeletePage(index[integer])
Description
Deletes a page from a template.
Arguments
Name Type
Description
index integer The index of the page that you want to delete. Note that indices start at 0.
Return type
No return value
Example
To delete the first page of template t:
t.DeletePage(0);
Page D.54
User manual Version 12.0, October 2014
REPORTER
EditVariables(title (optional)[string], message (optional)[string], update
(optional)[boolean], variables (optional)[array], columns (optional)[constant])
Description
Start a dialog to edit the template variables
Arguments
Name
Type
Description
title
(optional)
string
Title for dialog. If omitted, null or an empty string is given then the default title will be used.
message
(optional)
string
Message to show in dialog. If omitted, null or an empty string is given then the default
message will be used.
update
(optional)
boolean Whether the variables in the template will be updated with the new values if OK is pressed.
Setting this to be false allows you to check variable values before updating them from a script.
If omitted the default is true
variables
(optional)
array
columns
(optional)
constant Columns to show in the dialog (as well as the variable value column). Can be a bitwise OR of
Variable.NAME, Variable.TYPE, Variable.DESCRIPTION, Variable.FORMAT and
Variable.PRECISION. If omitted columns will be shown for name and description
A list of variables to show in the dialog. If omitted, null or an empty array, all variables will be
shown
Return type
Object containing the variable names and values or null if cancel was pressed.
Example
To edit all of the variables in template:
var variables = template.EditVariables();
To edit variables TEST and EXAMPLE in template giving a title and a message, returning the edited values but not
updating them in the template:
var variables = template.EditVariables("Edit variables", "Type in the values",
false, ["TEST", "EXAMPLE");
Page D.55
REPORTER
User manual Version 12.0, October 2014
ExpandVariablesInString(string[string])
Description
Replaces any variables in a string with their current values
Arguments
Name Type Description
string string The string you want to expand variables in.
Return type
String (string) with variables expanded. If a variable in a string does not exist it is replaced by a blank.
Example
If the variable FRED in template contains the value "test", then the following
var value = template.ExpandVariablesInString("This is a %FRED%");
will return "This is a test" in variable value.
Generate()
Description
Generate a template
Arguments
No arguments
Return type
no return value
Example
To generate template data:
data.Generate();
Page D.56
User manual Version 12.0, October 2014
REPORTER
GetAll() [static]
Description
Get all of the open templates
Arguments
No arguments
Return type
array of Template objects or null if no open templates
Example
To get all of the templates open in REPORTER:
var templates = Template.GetAll();
GetAllPages()
Description
Gets all of the pages from a template.
Arguments
No arguments
Return type
Array of Page objects
Example
To get all of the pages from template t:
var pages = t.GetAllPages();
Page D.57
REPORTER
GetCurrent() [static]
Description
Get the currently active template
Arguments
No arguments
Return type
Template object or null if no active template
Example
To get the current template open in REPORTER:
var current_template = Template.GetCurrent();
GetMaster()
Description
Get the master page from a template.
Arguments
No arguments
Return type
Page object
Example
To get the master page of template t:
var m = t.GetMaster();
Page D.58
User manual Version 12.0, October 2014
User manual Version 12.0, October 2014
REPORTER
GetPage(index[integer])
Description
Get a page from a template.
Arguments
Name Type
Description
index integer The index of the page that you want to get. Note that indices start at 0.
Return type
Page object
Example
To get the first page of template t:
var p = t.GetPage(0);
GetVariableDescription(name[string])
Description
Get the description for a variable
Arguments
Name Type Description
name string Variable name you want to get description for.
Return type
Variable description (string) or null if variable does not exist
Example
To get description for variable FRED in template:
var description = template.GetVariableDescription("FRED");
Page D.59
REPORTER
GetVariableValue(name[string])
Description
Get the value for a variable
Arguments
Name Type Description
name string Variable name you want to get value for.
Return type
Variable value (string) or null if variable does not exist
Example
To get value for variable FRED in template:
var value = template.GetVariableValue("FRED");
Html(filename[string])
Description
Save a template as HTML
Arguments
Name
Type Description
filename string Filename you want to save.
Return type
no return value
Example
To save template data as file /data/test/template.html:
data.Html("/data/test/template.html");
Page D.60
User manual Version 12.0, October 2014
User manual Version 12.0, October 2014
REPORTER
Pdf(filename[string])
Description
Save a template as Adobe Acrobat PDF
Arguments
Name
Type Description
filename string Filename you want to save.
Return type
no return value
Example
To save template data as file /data/test/template.pdf:
data.Pdf("/data/test/template.pdf");
Ppt(filename[string])
Description
Save a template as PowerPoint
Arguments
Name
Type Description
filename string Filename you want to save.
Return type
no return value
Example
To save template data as file /data/test/template.pptx:
data.Ppt("/data/test/template.pptx");
Page D.61
REPORTER
Print(printer[string])
Description
Print template on a printer
Arguments
Name Type Description
printer string Printer you want to print to.
Return type
no return value
Example
To print template data on printer myprinter:
data.Print("myprinter");
Save()
Description
Save a template
Arguments
No arguments
Return type
no return value
Example
To save template data:
data.Save();
Page D.62
User manual Version 12.0, October 2014
User manual Version 12.0, October 2014
REPORTER
SaveAs(filename[string])
Description
Save a template with a new name
Arguments
Name
Type Description
filename string Filename you want to save.
Return type
no return value
Example
To save template data as file /data/test/template.opt:
data.SaveAs("/data/test/template.opt");
Update()
Description
Update/redraw a template
Arguments
No arguments
Return type
no return value
Example
To update template data:
data.Update();
Page D.63
REPORTER
User manual Version 12.0, October 2014
Window class
The Window class gives access to windows for a graphical user interface. More...
Class functions
•
•
•
•
•
•
•
•
•
•
•
•
Error(title[string], error[string], buttons (optional)[constant])
GetDirectory(initial (optional)[string])
GetFile(extension (optional)[string], allow new (optional)[boolean], initial (optional)[string])
GetFiles(extension (optional)[string])
GetInteger(title[string], message[string])
GetNumber(title[string], message[string])
GetOptions(title[string], message[string], options[array of objects])
GetString(title[string], message[string])
Information(title[string], info[string], buttons (optional)[constant])
Message(title[string], message[string], buttons (optional)[constant])
Question(title[string], question[string], buttons (optional)[constant])
Warning(title[string], warning[string], buttons (optional)[constant])
Window constants
Name
Description
Window.CANCEL Show CANCEL button
Window.NO
Show NO button
Window.OK
Show OK button
Window.YES
Show YES button
Detailed Description
The Window class is used to define several standard windows that can be used to read data, give messages and provide
feedback
Page D.64
User manual Version 12.0, October 2014
REPORTER
Details of functions
Error(title[string], error[string], buttons (optional)[constant]) [static]
Description
Show an error message in a window.
Arguments
Name
Type
Description
title
string
Title for window.
error
string
Error message to show in window.
buttons
(optional)
constant The buttons to use. Can be bitwise OR of Window.OK, Window.CANCEL, Window.YES or
Window.NO. If this is omitted an OK button will be used.
Return type
Button pressed
Example
To show error Critical error!\nAbort? in window with title Error with Yes and No buttons:
var answer = Window.Error("Error", "Critical error!\nAbort?", Window.YES |
Window.NO);
if (answer == Window.YES) Exit();
GetDirectory(initial (optional)[string]) [static]
Description
Map the directory selector box native to your machine, allowing you to choose a directory.
Arguments
Name
Type Description
initial (optional) string Initial directory to start from.
Return type
directory (string), (or null if cancel pressed).
Example
To select a directory:
var dir = Window.GetDirectory();
Page D.65
REPORTER
User manual Version 12.0, October 2014
GetFile(extension (optional)[string], allow new (optional)[boolean], initial
(optional)[string]) [static]
Description
Map a file selector box allowing you to choose a file. See also Window.GetFiles()
Arguments
Name
Type
extension (optional) string
Description
Extension to filter by.
allow new (optional) boolean Allow creation of new file.
initial (optional)
string
Initial directory to start from.
Return type
filename (string), (or null if cancel pressed).
Example
To select a file using extension ’.key’:
var file = Window.GetFile(".key");
GetFiles(extension (optional)[string]) [static]
Description
Map a file selector box allowing you to choose multiple files. See also Window.GetFile()
Arguments
Name
Type Description
extension (optional) string Extension to filter by.
Return type
Array of filenames (strings), or null if cancel pressed.
Example
To select multiple files using extension ’.key’:
var files = Window.GetFiles(".key");
Page D.66
User manual Version 12.0, October 2014
REPORTER
GetInteger(title[string], message[string]) [static]
Description
Map a window allowing you to input an integer. OK and Cancel buttons are shown.
Arguments
Name
Type Description
title
string Title for window.
message string Message to show in window.
Return type
value input, (or null if cancel pressed).
Example
To create an input window with title Input and message Input integer and return the value input:
var value = Window.GetInteger("Input", "Input integer");
GetNumber(title[string], message[string]) [static]
Description
Map a window allowing you to input a number. OK and Cancel buttons are shown.
Arguments
Name
Type Description
title
string Title for window.
message string Message to show in window.
Return type
value input, (or null if cancel pressed).
Example
To create an input window with title Input and message Input number and return the value input:
var value = Window.GetNumber("Input", "Input number");
Page D.67
REPORTER
User manual Version 12.0, October 2014
GetOptions(title[string], message[string], options[array of objects]) [static]
Description
Map a window allowing you to input various options. OK and Cancel buttons are shown.
Arguments
Name
Type
Description
title
string
Title for window.
message string
Message to show in window.
options
Each object in the array should have properties:
text: Text to show next to option.
type: Type of option. Can be "label" (plain text), "text" (a one line text widget), "textbox" (a
multi line text widget) or "checkbox" (a checkable option)
value: Text to show for option
selected: Checkbox only. If checkbox is selected or not.
If OK is pressed the objects in the options argument will be updated with the values from the
widgets. If cancel is pressed they will not.
array of
objects
Return type
false if cancel pressed, true if OK pressed.
Example
To create a window with title Options , message Please give the options with label, text, textbox and checkbox widgets:
var options = [
{ text:"Label example", type:"label", value:"banana" },
{ text:"Text example", type:"text", value:"single line of text"
},
{ text:"Textbox example", type:"textbox",
value:"Multiple\\nlines\\nof\\ntext" },
{ text:"Checkbox example", type:"checkbox", value:"Do this?",
selected:true }
];
ok = Window.GetOptions("Options", "Please give the options", options);
Page D.68
User manual Version 12.0, October 2014
REPORTER
GetString(title[string], message[string]) [static]
Description
Map a window allowing you to input a string. OK and Cancel buttons are shown.
Arguments
Name
Type Description
title
string Title for window.
message string Message to show in window.
Return type
value input, (or null if cancel pressed).
Example
To create an input window with title Input and message Input string and return the value input:
var value = Window.GetString("Input", "Input string");
Information(title[string], info[string], buttons (optional)[constant]) [static]
Description
Show information in a window.
Arguments
Name
Type
Description
title
string
Title for window.
info
string
Information to show in window.
buttons
(optional)
constant The buttons to use. Can be bitwise OR of Window.OK, Window.CANCEL, Window.YES or
Window.NO. If this is omitted an OK button will be used.
Return type
Button pressed
Example
To show information Information in window with title Example with OK and Cancel buttons:
var answer = Window.Information("Example", "Information", Window.OK |
Window.CANCEL);
if (answer == Window.CANCEL) Message("You pressed the Cancel button");
Page D.69
REPORTER
User manual Version 12.0, October 2014
Message(title[string], message[string], buttons (optional)[constant]) [static]
Description
Show a message in a window.
Arguments
Name
Type
Description
title
string
Title for window.
message
string
Message to show in window.
buttons
(optional)
constant The buttons to use. Can be bitwise OR of Window.OK, Window.CANCEL, Window.YES or
Window.NO. If this is omitted an OK button will be used
Return type
Button pressed
Example
To show message Press YES or NO in window with title Example with YES and NO buttons:
var answer = Window.Message("Example", "Press YES or NO", Window.YES |
Window.NO);
if (answer == Window.NO) Message("You pressed No");
Question(title[string], question[string], buttons (optional)[constant]) [static]
Description
Show a question in a window.
Arguments
Name
Type
Description
title
string
Title for window.
question
string
Question to show in window.
buttons
(optional)
constant The buttons to use. Can be bitwise OR of Window.OK, Window.CANCEL, Window.YES or
Window.NO. If this is omitted Yes and No button will be used.
Return type
Button pressed
Example
To show question Do you want to continue? in window with title Question:
var answer = Window.Question("Question", "Do you want to continue?");
if (answer == Window.NO) Message("You pressed No");
Page D.70
User manual Version 12.0, October 2014
REPORTER
Warning(title[string], warning[string], buttons (optional)[constant]) [static]
Description
Show a warning message in a window.
Arguments
Name
Type
Description
title
string
Title for window.
warning
string
Warning message to show in window.
buttons
(optional)
constant The buttons to use. Can be bitwise OR of Window.OK, Window.CANCEL, Window.YES or
Window.NO. If this is omitted an OK button will be used.
Return type
Button pressed
Example
To show warning Title is blank\nSet to ID? in window with title Warning with Yes and No buttons:
var answer = Window.Warning("Warning", "Title is blank\nSet to ID?", Window.YES
| Window.NO);
if (answer == Window.NO) Message("You pressed No");
Page D.71
REPORTER
User manual Version 12.0, October 2014
Variable class
The Variable class gives access to variables in Reporter. More...
Class functions
•
•
GetAll(template[Template])
GetFromName(template[Template], name[string])
Member functions
•
Remove()
Variable constants
Name
Description
Variable.DESCRIPTION Variable description
Variable.FORMAT
Variable format
Variable.NAME
Variable name
Variable.PRECISION
Variable precision
Variable.READONLY
Variable readonly
Variable.TYPE
Variable type
Variable.VALUE
Variable value
Variable properties
Name
Type
Description
description string
Variable description
name
string
Variable name
readonly
logical If Variable is read only or not.
type
string
Variable type. Predefined types are "Directory", "File(absolute)", "File(basename)",
"File(extension)", "File(tail)", "General", "Number" and "String". Alternatively give your own
type. e.g. "NODE ID"
value
string
Variable value
Detailed Description
The Variable class allows you to access the name, description and value of a variable inside Reporter.
Note that if you want to get a list of the variables used in a Template you should see the variables array in the Template
object.
The name, description and value properties give access to the variable name, description and value respectively.
Page D.72
User manual Version 12.0, October 2014
REPORTER
Constructor
Variable(template[Template], name[string], description (optional)[string], value
(optional)[string], type (optional)[string], readonly (optional)[boolean])
Description
Create a new Variable. The template and name arguments MUST be given, all others are optional
Arguments
Name
Type
Description
template
Template Template object to create variable in
name
string
Name of variable
description
(optional)
string
Description of variable
value
(optional)
string
Variable value
type
(optional)
string
Type of variable. Predefined types are "Directory", "File(absolute)", "File(basename)",
"File(extension)", "File(tail)", "General", "Number" and "String". Alternatively give your
own type. e.g. "NODE ID". If omitted default is "General"
readonly
(optional)
boolean
If variable is readonly or not. If omitted default is false.
Return type
Variable object
Example
To create a new Variable object called TEST with description ’test variable’, type of "Number" and value ’10’ which is
not readonly for template, templ
var variable = new Variable(templ, "TEST", "test variable", "10", , "Number",
false);
Page D.73
REPORTER
User manual Version 12.0, October 2014
Details of functions
GetAll(template[Template]) [static]
Description
Returns an array of Variable objects for all of the variables in a Template.
Arguments
Name
Type
Description
template Template Template to get the variables from
Return type
Array of Variable objects
Example
To get all the variables in template t:
var v = Variable.GetAll(t);
GetFromName(template[Template], name[string]) [static]
Description
Returns the Variable object for a variable name.
Arguments
Name
Type
Description
template Template Template to find the variable in
name
string
name of the variable you want the Variable object for
Return type
Variable object (or null if variable does not exist)
Example
To get the Variable object for variable EXAMPLE in template t:
var v = Variable.GetFromName(t, "EXAMPLE");
Page D.74
User manual Version 12.0, October 2014
REPORTER
Remove()
Description
Remove a variable
Note that if you call this function for a Variable object, the Variable data will be deleted, so you should not try to
use it afterwards!.
Arguments
No arguments
Return type
no return value
Example
To remove variable data:
data.Remove();
Page D.75
REPORTER
Page D.76
User manual Version 12.0, October 2014
User manual Version 12.0, October 2014
REPORTER
E. Writing external programs/scripts
Programs or scripts for REPORTER that do some external function can be written in any language. It is up to you if you
prefer to use a scripting language such as Perl, Python, Tcl etc or a compiled language such as C or Fortran.
Anything which a program prints to stdout (standard output) will be returned to REPORTER (the one exception to this
is returning variables which is described below)
Returning variables from programs
To return a variable back to REPORTER output a line that take the form
VAR <NAME> VALUE="<value>" DESCRIPTION="<description>"
or
VAR <NAME> VALUE="<value>"
It will not inserted into the report as text but will be used to create a variable. See section 4.4 for more details.
Accessing existing variables in REPORTER
If you only want to use one or two variables from REPORTER then they can be passed as arguments to your program.
However, if you want to access a lot of variables (or print all the variables to a file) this would not be possible.
To overcome this, REPORTER adds an extra argument to every program that it runs. This extra argument is a filename
which contains lines of the form:
VAR <NAME> VALUE="<value>" DESCRIPTION="<description>"
You can read this file and pick up all the variables from REPORTER.
Example perl program to read variables file from REPORTER
The following example shows how you could read this file.
# Skeleton REPORTER Perl script showing extraction of variables fed to program
# The variable file REPORTER generates will be the LAST argument
#
# Variables are stored in a hash ’%vars’, each entry in the hash contains
# {value} and {description}.
#
# e.g. If REPORTER has a variable ’FRED’ with value ’1’ and description
# ’Example variable’ you can get at the variable value and description using:
#
# $vars{FRED}->{value}
# $vars{FRED}->{description}
#
# Arguments
# =========
# 1: Variables file
#
# Miles Thornton 23/5/2002
#
%vars = ();
if ($#ARGV >= 0)
{
open (VAR, "< $ARGV[$#ARGV]") or die "Error: Cannot open variable file";
while ( <VAR> )
{
chomp;
&get_var_from_string($_);
}
}
else
{
die "Error: No variable file on the command line\n";
Page E.1
REPORTER
User manual Version 12.0, October 2014
}
#########################################################
# START OF YOUR PROGRAM
#
# e.g. loop over variables and save them to a file
open (SAVE, "> varfile") or die "Error: Cannot open variables file";
foreach $var (sort keys %vars)
{
print SAVE "Variable $var value=$vars{$var}->{value} ",
"desc=$vars{$var}->{description}\n";
}
close (SAVE);
# END OF YOUR PROGRAM
#########################################################
exit;
#
===================
sub get_var_from_string
#
===================
#
# Tries to read a variable from the variable file
#
{
my $string = shift;
my ($var, $val, $desc);
if ($string =~ /VAR\s+(\w+)\s+
VALUE\s*=\s*[’"](.*?)[’"]\s*
DESCRIPTION\s*=\s*[’"](.*?)[’"]
/x)
{
$var = $1;
$val = $2;
$desc = $3;
}
elsif ($string =~ /VAR\s+(\w+)\s+
DESCRIPTION\s*=\s*[’"](.*?)[’"]\s*
VALUE\s*=\s*[’"](.*?)[’"]
/x)
{
$var = $1;
$val = $3;
$desc = $2;
}
elsif ($string =~ /VAR\s+(\w+)\s+
VALUE\s*=\s*[’"](.*?)[’"]
/x)
{
$var = $1;
$val = $2;
$desc = undef;
}
if ($var)
{
$var = uc($var);
$var =~ s/\s+/_/g;
if (exists $vars{$var})
{
$vars{$var}->{value}
= $val;
$vars{$var}->{description} = $desc;
}
else
{
my $variable = {};
$variable->{value}
= $val;
$variable->{description} = $desc;
$vars{$var} = $variable;
}
}
}
Page E.2
User manual Version 12.0, October 2014
REPORTER
Example program: Extracting the smallest timesteps (Text
output)
These programs/scripts are designed to extract from the OTF file the 5 elements with the smallest timesteps, and write
out the data as text to the standard output. They also output the smallest timestep as a REPORTER variable called
TIMESTEP. Note that these programs/scripts are only simple examples and as such don’t have all the necessary error
checking that should be included.
They work by searching the OTF file for the text string "100 smallest timesteps" which appears towards the end of the
model initialization section, and then reading in relevant element data from this list. An example of this section of an
OTF file is shown below. The one argument for this program/script is the OTF filename (for example tube2.otf).
The LS-DYNA time step size should not exceed 0.133E-05
to avoid contact instabilities. If the step size is
bigger then scale the penalty of the offending surface.
0 t 0.0000E+00 dt 0.00E+00 flush i/o buffers
100 smallest timesteps
---------------------element
timestep
shell
16620
0.66873E-06
shell
16619
0.66873E-06
shell
16612
0.66873E-06
shell
16611
0.66873E-06
shell
16572
0.66873E-06
shell
16571
0.66873E-06
shell
16564
0.66873E-06
shell
16563
0.66873E-06
shell
16520
0.66873E-06
shell
16519
0.66873E-06
shell
16512
0.66873E-06
shell
16511
0.66873E-06
shell
16504
0.66873E-06
shell
16503
0.66873E-06
shell
16472
0.66873E-06
Example programs to extract the data are shown in 4 languages:
• C
• C shell script
• Fortran
• Perl
C program/script
#include <stdio.h>
#include <stdlib.h>
#include <string.h>
#define MAX_LEN 257
int main(int argc, char *argv[])
{
char line[MAX_LEN], *ptr;
int c, i, l, n = 5;
float t, tmin;
FILE *fp;
if (argc < 2)
{
printf("No otf filename\n");
exit(0);
}
if ( (fp = fopen(argv[1], "r")) == NULL)
{
printf("Cannot open otf file %s\n", argv[1]);
exit(0);
}
while (fgets(line, MAX_LEN, fp))
{
if (strstr(line, "smallest timesteps"))
{
sscanf(line, "%d", &n);
if (n > 5) n = 5;
tmin = 1.0e+20;
Page E.3
REPORTER
User manual Version 12.0, October 2014
fgets(line, MAX_LEN, fp);
fgets(line, MAX_LEN, fp);
for (i=0; i<n; i++)
{
fgets(line, MAX_LEN, fp);
printf ("%s", line);
/* Remove any trailing characters */
l = strlen(line) - 1;
while ( (c = line[l]) == ’ ’ || c==’\n’ || c==’\r’ || c==’\t’)
l--;
line[l+1] = ’\0’;
/* Find start of number */
l = strlen(line) - 1;
while ( (c = line[l]) != ’ ’)
l--;
ptr = &line[l];
sscanf(ptr, "%e", &t);
if (t < tmin)
tmin = t;
}
printf ("VAR TIMESTEP VALUE=\"%e\"\n", tmin);
exit(0);
}
}
fclose(fp);
}
C Shell program/script
#!/bin/csh -f
#
# Script to extract the 5 smallest timesteps from otf file
#
# Arguments: 1: otf filename
# Test to see if there is an argument
if ($#argv < 1) then
echo "No otf filename";
exit;
endif
# test to see if the otf file exists
if ( !(-e $argv[1]) ) then
echo "otf file $argv[1] does not exist";
exit;
endif
# Use awk to extract the timesteps
awk ’/smallest timesteps/ {
#
n = $1;
#
getline;
#
getline;
#
if (n > 5) n = 5;
#
t = 1.0e+20;
#
for (i=0; i<n; i++)
#
{
#
getline;
#
print $0;
#
if ($NF < t) t = $NF; #
}
#
}
#
END {
printf ("VAR TIMESTEP VALUE=\"%e\"\n",
}
’ $argv[1]
Fortran program/script
c
character*80 fname,line
integer elemno(5)
real timestep(5)
Page E.4
search for smallest timestep \
save how many found \
skip a line \
skip a line \
limit to 5 timesteps \
initialise smallest timestep \
loop over lines \
\
read the line \
print it \
save timestep if smaller \
than current smallest \
\
# \
t); # Print smallest timestep \
# \
User manual Version 12.0, October 2014
REPORTER
n=iargc(1)
c
c Read in model name argument
c
call getarg(1,fname)
c
c Open model OTF file
c
open (unit=25, file=fname, status=’old’)
c
c Scan file for line with the text string
c " 100 smallest timesteps"
c
10
continue
read (25,’(a)’,end=900) line
if (line(1:23).eq.’ 100 smallest timesteps’) then
goto 20
else
goto 10
endif
c
c Read in but ignore next 2 lines of data
c
20
continue
read(25,*)
read(25,*)
c
c Read in the element no. and timestep data
c from the next five lines
c
101 format(i10)
102 format(e23.0)
c
do 30 i=1,5
read (25,’(a)’) line
read (line(7:16),101) elemno(i)
read (line(20:42),102) timestep(i)
30
continue
c
c Write out the data as a text output
c
201 format (2x,i9,5x,e11.5)
c
write (*,*) ’ Element No.
Timestep ’
do 40 i=1,5
write (*,201) elemno(i),timestep(i)
40
continue
c
c Also write out the smallest timestep as
c REPORTER variable
c
301 format (’VAR TIMESTEP VALUE="’,e11.5,’"’)
write(*,301) timestep(1)
goto 999
c
900 write(*,*) ’End of file reached’
c
999 continue
stop
end
c
Perl program/script
# Perl Script to extract the 5 smallest timesteps from otf file
#
# Arguments: 1: otf filename
use strict;
# Test to see if there is an argument
if ($#ARGV < 0)
{
Page E.5
REPORTER
print "No otf filename\n";
exit;
}
# test to see if the otf file exists
if ( !(-e $ARGV[0]) )
{
print "otf file $ARGV[0] does not exist\n";
exit;
}
open (OTF, "< $ARGV[0]");
my $n;
my $t = 1.0e+20;
while ( <OTF>)
{
if (/ (\d+) smallest timesteps/)
{
$n = $1;
if ($n > 5) { $n = 5; }
<OTF>;
<OTF>;
for (my $i=0; $i<$n; $i++)
{
$_ = <OTF>;
print $_;
my @f = split;
if ($f[$#f] < $t) { $t = $f[$#f]; }
}
print "VAR TIMESTEP VALUE=\"$t\"\n";
exit;
}
}
close (OTF);
Page E.6
User manual Version 12.0, October 2014
User manual Version 12.0, October 2014
REPORTER
F. Unicode support
REPORTER has basic unicode (i.e. non-latin characters) support. This means that if you have the appropriate language
kit and fonts installed on your computer you can input and use European accented, Japanese, Korean and Chinese
characters. On Windows you can input unicode characters using the normal IME (global Input Method Editor).
The XML format that REPORTER uses to save files supports unicode.
As Japanese, Korean and Chinese have many common ideographs, but these may have different appearances depending
on the font there is a preference in REPORTER which allows you to set the default language you want to use,
reporter*cjk_default which can be either Chinese, Japanese or Korean.
Note that although REPORTER has unicode support, currently D3PLOT, T/HIS and LS-DYNA do not so you should
not use unicode characters in filenames.
F.1 Output formats that support unicode
Currently only text objects and table headers can be output with unicode characters.
HTML
Unicode is fully supported in the HTML written by REPORTER. To view the HTML a user needs the appropriate fonts
installed.
PowerPoint and vba
Unicode is fully supported in the powerPoint and visual basic files written by REPORTER (as long as the appropriate
language pack(s) are installed).
PDF
The PDF files created by REPORTER do not embed the fonts used in the document. However, newer versions of the
acrobat reader will automatically detect that the document uses a Chinese, Japanese or Korean font and prompt the user
to download the necessary fonts.
There are two preferences which affect what fonts are used in pdf files:
Firstly for Japanese the preference reporter*japanese_font indicates what font should be used for Japanese
characters. It can be ’Kozuka Mincho Pro’ (a serif font) or ’Kozuka Gothic Pro’ (a sans serif font). The
default is ’Kozuka Gothic Pro’.
For Chinese the preference reporter*chinese_characters indicates if traditional or simplified characters
should be used. It can be Traditional or Simplified. the default is Traditional.
Page F.1
REPORTER
Page F.2
User manual Version 12.0, October 2014
User manual Version 12.0, October 2014
REPORTER
Installation organisation
The version 12 installation can be customised to try and avoid a number of issues that often occur in large organisations
with many users.
• Large organisations generally imply large networks, and it is often the case that the performance of these
networks can be intermittent or poor, therefore it is common practice to perform an installation of the software
on the local disk of each machine, rather then having a single installation on a remote disk.
This avoids the pauses and glitches that can occur when running executable files over a network, but it also
means that all the configuration files in, or depending upon, the top level "Admin" directory have to be copied to
all machines and, more to the point, any changes or additions to such files also have to be copied to all machines.
•
In larger organisations the "one person per computer" philosophy may not apply, with the consequence that users
will tend to have a floating home area on a network drive and may not use the same machine every day.
This is not usually a problem on Linux where the "home" directory is tied to the login name not the machine.
However on Windows platforms it means that %USERPROFILE%, which is typically on the local C drive of a
machine, is not a good place to consider as "home" since it will be tied to a given computer, therefore a user who
saves a file in his home directory on machine A may not be able to access it from machine B.
•
In a similar vein placing large temporary files on the /tmp partition (Linux) or the C: drive (Windows) may result
in local disks becoming too full, or quotas exceeded.
This section gives only a brief summary of the installation organisation, and you should refer to the separate Installation
Guide if you want to find out more about the details of installation, licensing, and other related issues.
Version 12.0 Installation structure
In version 12.0 the option is provided to separate a top-level ’administration’ directory from the ’installation’ one where
the executables are located.
For large installations on many machines this allows central configuration and administration files to exist in one place
only, but executables to be installed locally on users’ machines to give better performance. Version 12.0 also allows the
following items to be configured
• The location for user manuals and other documentation.
• The definition of a user’s home directory.
• The definition of the temporary directory for scratch files.
In addition parsing of the ’oa_pref’ (preferences) file will now handle environment variables, so that a generic
preference can be configured to give a user-specific result, and preferences may be ’locked’ so that those set at the
administration level cannot be changed by users.
These changes are entirely optional, and users performing a simple installation on a single machine do not need to make
any changes to their existing installation practice.
Directory
Status
Directory Content and purpose
OA_ADMIN_xx
Optional
Top level configuration files.
(xx =12 for release 12.0, thus OA_ADMIN_12)
oa_pref file option
Admin level oa_pref file
Other configuration files
Timeout configuration file
Page G.1
REPORTER
OA_ADMIN
User manual Version 12.0, October 2014
Optional
Same as OA_ADMIN_12, provided for backwards
compatibility with earlier releases.
It is recommended that plain OA_ADMIN, without
the _xx version suffix, is not used since otherwise
there is no easy way of distinguishing between
parallel installations of different releases of the
Oasys Ltd software in an installation.
If OA_ADMIN_12 is not defined then this
non-release specific version is checked.
OA_INSTALL_xx
Optional
(xx =12 for release 12.0, thus OA_ADMIN_12
oasys*install_dir:
<pathname>
All executables
Installation level oa_pref file
OA_INSTALL
Optional
Same as OA_INSTALL_12.
oasys*install_dir:
<pathname>
If no "OA_ADMIN_xx" directory is used and all
software is simply placed in this "install" directory,
which would be typical of a single-user installation,
then it is recommended that the _xx version suffix is
used in order to keep parallel installations of
different releases of the Oasts Ltd software separate
on the machine.
If OA_INSTALL_12 is not defined then this
non-release specific version is checked
OA_MANUALS
Optional
Specific directory for user manuals. If not defined
oasys*manuals_dir:
then will search in:
<pathname>
OA_ADMIN_xx/manuals
(xx = major version
number)
OA_INSTALL/manuals
OA_HOME
Optional
Specific "home" directory for user when using Oasys oasys*home_dir:
Ltd software. If not defined will use:
<pathname>
$HOME
(Linux)
%USERPROFILE%
(Windows)
OA_TEMP
Optional
Specific "temporary" directory for user when using
oasys*temp_dir:
Oasys Ltd software. If not defined will use:
<pathname>
P_tmpdir
(Linux, typically /tmp)
%TEMP%
(Windows, typically C:\temp)
It will be clear from the table above that no Environment variables have to be set, and that all defaults will revert to
pre-9.4 behaviour. In other words users wishing to keep the status quo will find behaviour and layout unchanged if they
do nothing.
OA_INSTALL_XX
Previously the software used the OA_INSTALL (renamed from OASYS) environment variable to locate the directory
the software was installed in.
• On Windows this is no longer required as the software can work out its own installation directory. As this
environment variable is no longer required it is recommended that it is removed from machines it is currently set
on as in some cases where more than one version has been installed in different directories it can cause
problems.
•
On LINUX systems the "oasys_12" script that starts the SHELL automatically sets this Environment Variable
and passes it to any application started from the SHELL. If you run applications directly from the command line
and bypass the SHELL then you should set OA_INSTALL_XX so that the software can locate manuals and other
required files.
OA_ADMIN_XX
Users wishing to separate configuration and installation directories will be able to do so by making use of the new top
level OA_ADMIN_xx directory.
Page G.2
User manual Version 12.0, October 2014
REPORTER
Installation Examples
The following diagrams illustrate how the installation might be organised in various different scenarios..
a) Single user installation on one machine
There is no need to worry about separating administration and installation directories, and
the default installation of all files in and below the single installation directory will
suffice.
It is suggested that the _xx version suffix of OA_INSTALL_xx is used in order to keep
parallel installations of different releases of the Oassys Ltd software separate on the
machine.
b) A few machines on a small network, each user has his own machine
The top level administration directory can be
installed on a network server, possibly also locating
the manuals centrally.
Each user’s machine has its own ’installation’
directory to give good performance, but there is no
need to manage home or temporary directories
centrally since each user ’owns’ his machine.
If network performance is good an alternative
would be to install executables on the central
server, meaning that local OA_INSTALL
directories are not required.
c) Large corporate network
There is no need to worry about separating
administration and installation directories, and
the default installation of all files in and below
the single installation directory will suffice.
Page G.3
REPORTER
User manual Version 12.0, October 2014
Dynamic configuration using the top level oa_pref file.
A further improvement is that all environment variables below OA_ADMIN_xx may either be set explicitly, or
dynamically using the options in the oa_pref file at the top OA_ADMIN_xx level. This permits parallel installations of
different versions of the software to co-exist, with only the top level administration directory names being distinct. For
example:
Release 12.0
Release 12.1
Top level directory OA_ADMIN_12
Top level directory OA_ADMIN_121
oa_pref file in OA_ADMIN_12 contains:
oa_pref file in OA_ADMIN_121 contains:
<pathname for 12.0
oasys*install_dir:
installation>
oasys*manuals_dir:
manuals>
<pathname for 12.0
oasys*home_dir: <pathname for home directory>
oasys*temp_dir: <pathname for temporary files>
oasys*install_dir:
installation>
oasys*manuals_dir:
manuals>
<pathname for 12.1
<pathname for12.1
} would almost certainly be unchanged between major
} versions, although they could be different if desired
Pathnames in the oa_pref file may contain environment variables which will be resolved before being applied.
The hierarchy of oa_pref file reading
It will be clear from the above that in a large installation the "oa_pref" files have a significant role. Each piece of
software reads them in the following order:
OA_ADMIN_xx
Top level configuration
OA_INSTALL_xx
Installation level
OA_HOME
User’s personal "home" file
Current working directory
File specific to the current directory (rarely used)
The rules for reading these files are:
• If a given directory does not exist, or no file is found in that directory, then no action is taken. This is not an
error.
• A more recently read definition supersedes one read earlier, therefore "local" definitions can supersede "global"
ones (unless it was locked ).
• If two of more of the directories in the table above are the same then that file is only read once from the first
instance.
Locking Preference Options
From version 9.4 onwards preference options can be locked. If a preference option is locked in a file then that
preference option will be ignored in any of the subsequent preference files that are read.
Therefore by locking a preference in a top-level file in the hierarchy above, eg in OA_ADMIN_xx, and then protecting
that file to be read-only, an administrator can set preferences that cannot be altered by users since any definitions of
that preference in their private oa_pref files will be ignored.
Preferences are locked by using a hash (#) rather than an asterisk (*) between the code name and the preference string.
For example:
primer*maximise: true
Page G.4
Normal case using "*", means an unlocked preference
User manual Version 12.0, October 2014
primer#maximise: true
REPORTER
Locked case using "#"
These changes may be made either by editing the file manually, or by using the preferences editor.
Page G.5