1
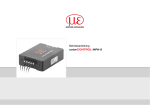
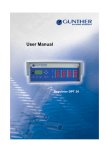
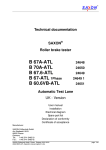
User Manual for Digital Colour Analyzer GPS Prueftechnik GmbH www.gps-prueftechnik.de E-Mail: [email protected] 22.04.2015 1 Table of contents: 1. LED Digital Colour Analyzer 1.1 Mounting the Digital Colour Analyzer 1.2 Mounting the fiber-optic 1.3 Cutting the fiber 2. Interface and Power Wiring 2.1 Mounting a stand-alone unit 2.2 Mounting connected units 2.3 Mounting interconnected units for USB 2.4 Mounting interconnected units for RS 232 3. Setting the Digital Colour Analyzer 3.1 The Digital Colour Sensor 3.2 Setting an offset to calculate the components of the standard colour values x and y 3.3 Manual for the GPS LED Analyzer Software 3.3.1 The main screen of the LED Analyzer Software with PopUp-menus 3.3.2 Configuration of the LED Analyzer 3.3.3 To perform a measurement by using the functional elements of the main screen 3.3.4 To perform a measurement and compare several LEDs by using “Measurement Window” and “Settings Window”. 3.3.5 How to use “Terminal Modes” 4. List of Commands for the LED Analyzer 22.04.2015 2 1.LED Digital Colour Analyzer The construction of the fixture is one of the most critical aspects of a successful implementation of the Digital Colour Analyzer. If this step is implemented properly the resulting tests will be more stable and repeatable with low risk of false failures. Figure 1: GPS Digital Colour Analyzer 1.1 Mounting the Digital Colour Analyzer The LED Analyzer can be mounted on the top as well as on the bottom side of the fixture. When mounting the LED Analyzer be careful that the fibers can move freely and are not exposed to sharp bends. The minimum bend radius is 15 mm. Sharper bends can cause a loss of light which can affect the measurements. In order to get a clean measurement it must be guaranteed that all light from the LEDs can travel through the fiber to the sensor on the board. Figure 2: Mounting measurements The mounting holes will accept M3 screws. Take care that the mounting holes are connected to the unit ground 22.04.2015 3 1.2 Mounting the fiber optic Construction of the fixture is one of the most critical aspects of a successful implementation of a LED Colour Analyzer. If this step is implemented properly the resulting tests will be more stable and repeatable with a low risk of false measurements. Some important characteristics of the fiber are: Minimum bend radius 10mm Operating temperature range –40 to +70 C° Numerical aperture 0.5 Angle of incidence ca. 60 degrees Attenuation at 650 nm 0,18 dB/m (ca. 2%/m) Figure 3: Plastic Fiber Figure 4: Positioning the Fiber The fiber must be located over optical centre of the LED. For further information please look up the producers datasheet. The gap between the LED and the fiber should be 1 - 3 mm. This must be find out empirical in individual cases. Figure 5: Offset and Gap The intensity of a measurement depends strongly on the gap and the offset from the LED to the fiber. 22.04.2015 4 There are different possibilities to position a fiber above the LED which has to be tested. 1.Mounting with a 75 mil socket: The recommended method of mounting the fiber is using the supplied 1mm ID, with a 75 mil socket. Another advantage of the socket is the internal indentation, which fixes the fiber effectively in position during the debugging. Figure 6: 75 mil Socket After the debugging the fiber can be held in position using a small dot of silicon adhesive. 2. Attachment for thin fibers: Additional to the 75mil sockets you can also use the attachment E39-F9 In that case the fixing with silicon is not necessary. Figure 7: Attachment E39-F9 The advantage: the fiber is fixed permanently and can be changed easily if required. 1.3 Cutting the Fiber Figure 8: Cutting tool for the fibers The fibers of the LED Analyser are delivered standardly with a length of about 600 mm. To avoid damages it is recomended to shorten the fibers to the correct length. While cutting take care that the fiber is in a 90° to the razor otherwise a loss of light has to be expected. It is recommended to use each hole only once in order to guarantee a clean cut of the fiber. 22.04.2015 5 2. Interface and Power Wiring 2.1. Mounting a stand-alone unit for USB Interface The Digital Colour Analyzer can be operated by RS 232 as well as by an USB Interface. During RS 232 operating a voltage of 7-15V, 80mA has to be applied additionally. Figure 9: Physical Layout RS 232 Connect: Female 2, Pin 23 Pin 24 Pin 25,26 Rx 2 Tx 2 GND Female 2, Jumper (if using several boards the jumper has to be set only at the last board) Pin 23,24 RS 232 Kabel: Pin 2 Pin 3 Pin 5 Tx 2 yellow mark Rx 2 GND Supply Voltage: Setting Jumper Female 2, Pin 1,2 Pin 5,6 BR1 Pin 2+3 U In 7-15V GND Jumper RS 232 cable can be ordered from GPS. 22.04.2015 6 2. Interface and Power Wiring 2.2. Mounting a stand-alone unit for RS 232 Interface The Digital Colour Analyzer can be operated by RS 232 as well as by an USB Interface. During USB operating the power supply for the board takes place through the USB Interface. Figure 9: Physical Layout USB Connect: USB Cable: Connector BU2, Pin 29 Pin 30 Pin 31 Pin 32 Pin 33 Pin 34 +5V — DataData+ GND — BR1 Jumper Pin 1+2 USB Female: Pin1 (yellow mark) USB Connector: Pin2 — Pin3 DataPin4 Data+ Pin5 GND Pin6 — Pin 1 +5V —Pin 2 Data Pin 3 Data + Pin 4 GND —- USB cable can be ordered from GPS. 22.04.2015 7 2.2. Mounting interconnected units for USB Jumper on the last board Pin 19,20 Pin 1+2 Female 2, BR1 Jumper for USB operating +5V DataData+ GND USB Connect: Female2, Pin 29,30 Pin 31 Pin 32 Pin 33,34 USB Cable: Pin 1 +5V yellow mark Pin 2 Data Pin 3 Data + Pin 4 GND If the power input is 80 mA per board up to 5 boards can be operated through the USB Interface. (Complete supply voltage about 400mA). In this case the LED Colour Analyzer can be tested 25 LEDs. See the physical layout below: Figure 10a: Connection Dia- 22.04.2015 8 22.04.2015 BR1 USB and RS 232 cable can be ordered from GPS . U In 7-15V GND Jumper Female 2, Pin 1,2 Pin 5,6 Pin 2+3 Each board has an own power supply unit and can be operated + 7V to 15V (power input about 80mA). Tx 2 yellow mark Rx 2 GND Supply Voltage: Rx 4 Pin 21,22 GND Tx 4 Rx 2 Pin 25,26 GND Tx 2 RS 232 Cable: Pin 2 Pin 3 Pin 5 Jumper Pin 19 Pin 20 Pin 23 Pin 24 Rx 2 Tx 2 GND Last board setting Jumper Female 2, Pin 19,20 Data Bus: Female2, RS 232 Connect: Female2, Pin 23 Pin 24 Pin 25,26 2.4. Mounting interconnected units for RS 232 The Digital Colour Analyzer can be connected to 99 boards so that 495 LEDs can be tested. See the physical layout below: Figure 10b: Connecting Diagram 9 3. Setting the Digital Colour Analyzer After the software has been installed and the Digital Colour Analyzer has been attached the following settings have to be respected. Configuration: Interface The USB Port is configured as a virtual Com Port and will be designated a name such as Com5, Com6, etc. The Baud Rate can be changed to any between 9600 and 115200 . Set the serial port to Auto and the baud rate to 115200. Figure 11: Settings The Digital Colour Analyzer Test Program is a graphical tool that can be used to send commands and receive results from the Analyzer. One LED can be tested at a time. The results are stored in a data e.g. TestReport.txt. This program allows to determine the correct setting for the LED which has to be tested. For further details, please refer to chapter 3.3.3 . Alternately, a customised program may be generated that sends commands and receives data through the virtual USB Com Port or RS 232 interface. 22.04.2015 10 3.1 The Digital Colour Sensor To enable a measurement over a wide range of illuminance, the photodiode sensitivity can be selected by modes ( high sensitivity mode and low sensitivity mode). The photodiode active area which is used to measure the light depends on which sensitivity mode has been selected (high sensitivity mode: 9x9 elements, low sensitivity mode: 3x3 elements in center). Figure12: Digital Colour Sensor Beneath the modes High Sensitivity Mode and Low Sensitivity Mode the light intensity also can be affected by a measure time of 1ms to 10000 ms . Under Test Modes „Fast Capture“ the most important settings which allow to measure very dim and very bright LEDs without operating with additional mechanical filter are listed. The Digital Sensor measures the colours and the intensity of the LED that has to be tested in RGB size. The results can be shown as RGBI, HUE and Saturation or CIE Chromaticity Diagram. 22.04.2015 11 3.2 Setting an offset to calculate the tristimulus values x and y There are three possibilities to store an offset for the calculation of the tristimulus values x and y. These are explained in the following: 1. GPS Prüftechnik offers a service for the calibration of the LED Analyzer Board. In this process customers LEDs to be tested are measured with a proven calibrated spectrometer under a standardized process in our company. In the next step tristimulus values which have been measured with the LED Analyzer are adjusted to the values of the spectrometer. This takes place during uploading the firmware using a non-volatile stored offset. 2. In addition to that there is a possibility to integrate the LED Analyzer in an existing test system through an initialisation of the com-port and a command listed in chapter 4. At this application an offset for each LED that has to be measured can be stored using the commands “setxoffset#+-0.xxxxb” or “setyoffset#+-0.xxxxb” . However this is a volatile stored offset which get lost after switching off the board from the current source or after using the command “setdefaultb”. 3. Furthermore an offset can be stored using the included software GPS LED Analyzer. This is, as described in point 2, a volatile storage space and get lost after switched off from the current source or the command “Reset board”. The following steps explain how an offset can be stored at the board using the software. Regarding to the LED Analyzer Software it has to be mentioned that stored offsets and modifications were taken over and are shown in the menu displays “Measurement settings” or “Setting for sensor” only during the measurement. See details for setting and adjusting an offset in chapter 3.3.4 . Below you will find a brief explanation of an offset setting. To set an offset through the LED Analyzer Software the ticker in the control box at “Don’t allow any changes to the xy offset values” has to be removed. You find this control box under “Configuration” in The PopUp-menu “Communication” In the next step you open “Measurement settings” under the PopUpMenu “Test” After opening all sensors, which are on the board , and their setting parameters are shown. Now chose through double click on the line the wanted sensor to change the settings. Then the menu display “Settings for sensor” appears (see figure below). To set an offset for the chromaticity coordinates x and y it has to be guaranteed that the ticker in the control box “Don’t change x y offset” is removed. After setting the wanted offsets close the “Settings for sensor” display through the OK-button. Figure 13: Settings 22.04.2015 12 3.3 Manual for the GPS LED Analyzer Software 3.3.1 The main screen of the LED Analyzer Software with PopUp-menus After starting the LED Analyzer Software the main screen appears (see figure below). Through this main screen you reach all required functions and control elements. The upper line shows several PopUp-menus which are explained shortly below and are described in details in the following chapters: File Through this menu you close the software. View Through this you can change between the colour spaces, which are shown in the right half. For that the HSI colour wheel, the RGB colour palette and the CIE colour space is available. Using the CIE colour space you can chose between three representations through the menu “Communication“ → „Configuration“. You find the particular measurement values of the several colour spaces in the right half of the „Test result“ display. Communication Through this the LED Analyzer Board is connected or disconnected. Furthermore the configuration settings of the LED Analyzer can be opened through the „Communication“ menu (see chap ter 3.3.2). Test Through the „Test“ PopUp menu the manual for measuring and comparing several LEDs is opened (see chapter 3.3.4). In addition test reports can be stored an opened. The function „Reset board“ is used if offsets were set during the operating and the initial state has to be re-established. Basically the software has to be restarted after a „Reset board” (see also chapter 3.3.4). Terminal Mode After opening one terminal you can communicate directly with the LED Analyzer Board with the aid of the command list from chapter 4 . Help The help function informs you about the used GPS LED Analyzer version. Figure 14.1: Main screen 22.04.2015 13 The graphic beside shows a detail of the main screen of the LED Analyzer. The following steps explain the functions of the individual controls: Figure 14.2: Detail main screen Connect Button After pressing the “Connect Button” the LED Analyzer is connected with the software. In doing so the button label turns into “Disconnect”. After pressing once again the LED Analyzer Board is logged off. Not Connected Label Shows the particular connection status of the LED Analyzer Board. Start-Test-Button Software performs a measurement with the actual configuration. Select Board Allows the selection of the connected boards. Select LED Allows the selection of a determined sensor on the LED Analyzer Board . Test Modes Depending on the application different test modes are available: - The Manual Capture mode allows to select predefined exposure times and sensor surfaces through the sensor range menu. The right choice of the exposure time depends on the light intensity of the test object. - The User Capture mode enables the user to specify exposure time and sensor surface through the sensor configuration individual. The software allows exposure times from 1 ms—1000 ms . - The PVM Capture mode is predestinated to define the colour values of pulsed LEDs. In this procedure this mode transfers the settings of the sensor regarding exposure time and sensor surface of the last performed measurement. By selecting the average factor which appears after choosing the PVM mode the user defines the number of measurements which have to be done. As soon as the LED Analyzer captures the LED in the ON-state, during the automatically performed measurements, the colour parameters are stored and are shown to the user after the complete measurement process is done. Information Screen The yellow marked information window informs about the used LED Analyzer Board firmware and the number of the connected boards. It also informs about eventually appearing errors. In the window “Test results” (see figure below)all light parameters which have been captured and calculated by the LED Analyzer are shown to the user. The captured colour values are shown to user in three different colour spaces. In the window on the left, you see the RGB values, followed by the HIS ( Hue—Saturation—Intensity) up to the chromaticity coordinates x and y from the CIE 1931 Colour space. In the lower right part the Corelated Colour Temperature (CCT) is shown additionally. Bild 14.3: Test Results ( main screen ) 22.04.2015 14 3.3.2 Configuration of the LED Analyzer Before a measurement can be carried out with the LED Analyzer the following configuration settings have to be selected. Figure 14.3: Configuration window Serial port Through this PopUp menu you select the Com-port which Windows assigns the LED Analyzer. Through The selection of “Auto” the programme searches the assigned Com-port automatically. If you want to determine the assigned Com-port manually than go to the connections (COM&LPT) via the control panel and the device manager. Baud rate Here you can adjust the baud rate. Recent devices have a baud rate of 115200 . Logfile window In this window the Logfile is defined. This box do not really matter for the usual application. It is only needed for an error analysis for the GPS Analyzer programme. Storage window Defines the locations for the Test Report File and the Sensor Settings File. CIE C. diagrams If the CIE colour space was selected through the View PopUp menu, different CIE colour spaces can be selected through this window. These are shown on the main screen. Deviation for intensity This options define a tolerance window which is respected at comparative measurements of LEDs. If the measurement value is within the tolerance window regarding the reference value, the LED is considered to be good. The tolerances for the individual LEDs can be changed in the “Measurement settings” window additionally (see chapter 3.3.4) Deviation for XY values Conducts analogously with “Deviation for Intensity “. Don’t allow any changes … This control box is like a safety query, if a XY-offset should be changed by the user through the “List of settings” window . As long as the ticker is set, there is no possibility to change the offsets of a sensor. The status of the control box is stored when closing the software and is recaptured when opened again. 22.04.2015 15 3.3.3 To perform a measurement by using the functional elements of the main screen After having done all required settings through the configuration window it is now to find out the right test mode and the settings for your application. Basically it is recommended to capture with a greatest possible light intensity. The intensity refers to the by the sensor initially measured RGB values (see figure 14.4). The value for the light intensity should be between 30% and 80% . This avoids that the sensor is operated outside the linear sensor sensitivity function referring to the colour parameters. So an optimal test result can be reached. In the first step select the wanted sensor. After that, start measuring with a sensor range of 9x9 and a large exposure time. In the next steps reduce the exposure time so long until you are in a light intensity range of 30% - 80%. In case that the reduction of the exposure time is not enough, set the sensor range from 9x9 to 3x3 and repeat the determination of the optimal exposure time, as just described. If you have to capture several LEDs per measurement it is recommended to find the optimal setting for each sensor over the main screen and then switch through the PopUp menu “Test” to the windows “Measurement settings” and “Measurements” (see chapter 3.3.4) At this the sensor settings referring the exposure time and the sensor range were taken over. For an application with several LEDs which have the same light intensity it is sufficient to determine the sensor setting for one LED in this way. In the following this setting can be transferred through the “Measurements” window to the other sensors (see chapter 3.3.4) Figure 14.4: Sensor values (left) und Intensity in % (below) 22.04.2015 16 3.3.4 To perform a measurement and compare several LEDs by using “Measurement Window” and “Settings Window”. 3.3.4.1 Measuring and comparing LEDs with differnet light intensities In order to compare LEDs use the “Measurement“ window in connection with the “Measurement settings“ window (see figure). As described in chapter 3.3.3 it is recommended to find out the optimal sensor settings through the main screen first. These were taken over by opening the “Measurement settings“ window. During the take over of the exposure time and sensor range it is shown, if a sensor is occupied by an offset. In the below-mentioned example five sensors were set via the main screen. Thereby sensor three with a non-volatile stored offset is occupied by fixed calibration. Figure 14.5: List of settings By opening the “Measurement“ window the colour values for the five set sensors, which have been find out over the main screen, appear (see figure). Figure 14.6: List of measurement 22.04.2015 17 Let us assume that the five read in LEDs are considered as reference LEDs by which the following LEDs of the same type are compared. To this the determined values have to be stored with the “Save reference“ button and uploaded with the “Load reference“ button. Now perform a re-measurement with the “Perform measurement“ button without changing the test environment. The colour values appear green. That means that the software has recognized the values as reference. It is recommended to store the setting over “Save settings“ otherwise the settings have to be entered again, when the software is rebooted. When you exchange the reference LEDs with the LEDs which have to be proofed and perform a re-measurement through the “Perform measurement“ button , the programme compares the capture with the reference values (see figure). If there is a deviation this is shown red. The test result can be archived with the “Save test report” button. Figure 14.7: Comparing measurement 3.3.4.2 Changing of tolerances, sensor settings and an offset To define an offset or a tolerance field refering the capture values during a comparing measurement the following possibility is available: For that double click with the mouse in the “Measurement settings“ window on the wanted sensor line. The window “Settings for sensor“ appears (see figure) . Through this window tolerances referring to the intensity and the chromaticity coordinates XY can be entered. These tolerances are provided by comparing the capture values with the reference values. Furthermore any sensor settings referring to the test mode, the exposure time and the range can be modified during Operation. To enter an offset for the chromaticity coordinates XY you first have to deactivate the control box “Don‘t allow any changes to XY values“ in the “Configuration“ window and confirm it by clicking the OK button. Here too, modifications are taken over only at the nest measurement through the “Measurements“ window. Figure 14.8: Settings for sensor 22.04.2015 18 3.3.4.3 Measuring and comparing several LEDs of the same light intensity To compare LEDs of the same light intensity it is sufficient to determine the optimal sensor settings through the main screen. Enter the “Measurement settings“ window. By clicking the sensor line then select the sensor of which You want to take over the parameters. Now press the “Change all settings“ button to take over the sensor settings. Following that carry out a measure through the “Measurement“ window in order to determine the reference values. During the take-over of the sensor settings particular care should be paid whether you want to take the offset over or not. For this there are control boxes in the “Configuration“ window and in the “Settings for Sensor“ window whose Functions are described in the following: If you want to transfer sensor parameters without an offset from one sensor to all the other sensors, then you have to activate the control box “Don‘t allow any…“ in the “Configuration” window and confirm it with OK . Select the sensor of which the parameters should be taken over. By clicking t he” Change all settings“ button the parameters are transferred to the other sensor lines. After a measure through the “Measurement“ window the modifications will become effective. If you want to take over the offsets of one sensor for the other sensors only partially or totally you have to deactivate the control box in the “Configuration“ window . At the same time the control box in the “Settings for sensor“ window has to be deactivated fo reach sensor for which you want to take the offset over. At sensors where the old offset setting should remain the control box in the „Settings for sensor“ window has to stay activated. Following that select the sensor whose parameters should be transferred by clicking and check Whether the control box in the “Settings for sensor“ window is also deactivated. Then press the “Change all settings“ button after selecting the sensor. At least carry out a measurement through the “Measurement“ window in order to take over the parameters in the measurement. Modifications referring to the offset and sensor settings are taken over basically only after another measurement through the “List of measurement“ window! 3.3.4.3 Reset the offset settings to the delivery status To restore the delivery status of the LED Analyzer boards use the command “Reset Board“ in the PopUp menu “Test“. After carrying out this command the LED Analyzer has to be logged out through the “Disconnect “ button and the software has to be rebooted to take over the delivery status. 3.3.5 Using the Terminal mode The GPS LED Analyzer Software offers the user a terminal mode in addition. With the help of this terminal mode the user can familiarize with the commands in chapter 4 to integrate the LED Analyzer in an existing system (see figure) . Figure 14.9:: Terminal Mode 22.04.2015 19 4. Capture Commands for the LED Analyzer 4.1. Connection Test Transmit Description Receive Example Comment testcon Connection test OK oder xOK testcon 2 OK x = number of boards Description: This command tests the connection between the test system/PC and the Analyzer. If only one board is connected to the tester and the connection works the Analyzer will transmit the character OK. If several boards are connected the number of the boards is transmitted like 2 OK. Important: This command has to be sent as first command so that all connected boards will be recogniced. 4.2. Standard Capture Captures and stores the colour and Intensity of the LEDs. Transmit Description Receive Example Comment capture Start Capture Colour, Saturation Intensity OK capture OK Capture all boards and sensors with the current set up Description: This command instructs the LED Analyzer to capture and store the colour and intensity of all LEDs simultaneously. With the command „setcaptimexyz b“ the capture time and sensor area can be set before the real capture. 22.04.2015 20 4.3. Manual Capture Captures and stores the colour and intensity of each LED with specified exposure range. Transmit Description Receive Example Comment capturexyz b x=Exposure range capture time 1=600 ms 2=200 ms 3=120ms 4=60 ms 5=20 ms 6=10 ms 7=2 ms 8= user programmierbar 9= aktuelle Einstellung wird übernommen 0= Sensor aus y=0 Vorwahl Sensor Low (3x3) y=1 Vorwahl Sensor High(9x9) OK capture 215 3 x=Messzeit 200ms y=Sensor High (9x9) z=Kanal 5 b=Board 3 capture 31 x=Messzeit 120ms y=Sensor High (9x9) für alle Kanäle und Boards z=Vorwahl Kanal 1...5 oder 1….n b=Vorwahl Board 1...n capture 3117 capture 312 4 x=Messzeit 120ms y=Sensor High (9x9) Kanal 17 oder Kanal 2 auf Board 4 Description: This command allows an optimal setting for each LED which is to be tested. Dim LEDs are captured with a longer capture time (e.g. 600 or 200ms) and the setting Sensor High is used (thereby all 9x9 segments of the sensor are used). For very bright LEDs the setting Sensor Low has to be chosen (only 3x3 segments of the sensor are used) And the capture time has to be reduced (e.g. 10 or 2 ms). Figure 13: Digital Sensor The Digital Sensor consists of 9x9 = 81 segments for the colours red, green and blue. For dim LEDs all segments are used and a longer exposure time is chosen. For very bright LEDs only the 3x3 = 9 segments in the medium range are used and the exposure time is reduced, depending on the brightness, till an overload of the segments can be avoided. 22.04.2015 21 4.4 General Capture of Pulse-Width-Modulated LEDs Captures and stores the colour and intensity of Pulse-Width-Modulated (PWM) LEDs. Transmit Description Receive Example capturepwm Start PWM-Capture Colour Intensity OK capturepwm OK Comment Description: Puls-Width-Modulated (PWM) LEDs This command instructs the LED Analyzer to read and store the colour and intensity of all LEDs. In this case a default value which is sufficient for most of the LEDs is used. In order to get better results of different LEDs it is recommended to specify the exposure range manual (see the next command). 4.5 Manuel Capture of Pulse-Width-Modulated LEDs Captures and stores the colour and intensity of Pulse-Width-Modulated (PWM) LEDs with specified exposure range Transmit Description Receive Example Comment capturepwm##z b ## Averaging Factor 0=5 Capture operations 1=10 Capture operations 2=15 Capture operations 3=20 Capture operations ……. 15=80 Capture operations OK capturepwm103 2 10=55 Capture operations z=Channel 3 b=Board 2 z=Channal b= Board Description: Puls-Width-Modulated (PWM) LEDs This command allows an optimal setting for each Puls-Width-Modulated (PWM) LED. The first two factors, refer to the averaging factor, z applies to the channel and b marks the board which is used. The averaging factor is divided into 15 ranges , factor 2 are 15 capture operations. The settings of the capture time and the sensor area depend on the previous settings for this sensor, such as by “setcaptime” (see below). 22.04.2015 22 4.6 Get stored RGB Value and Intensity The get data commands are used to read out the Colour, Saturation and Intensity data stored by the capture commands. Transmit Description Receive Example Comment getrgbi# b Get stored RGB Value and Intensity rrr ggg bbb iiiii getrgbi3 5 # = 1..5 if b = board getrgbi23 # = 1..495 at max. 99 boards b not specified # = channel no. 1..5 b or # = 1….495 006 230 018 06383 Output format Description: In the described example the data of LED 3 of the board 5 are numbered all the way through or read out LED 23. The values are for Red 006, for Green 230, for Blue 018 and for intensity 06383. 4.7 Get stored RGB colour components by persent Transmit Description Receive Example Comment getcolor# b Get stored RGB colour components in percent rrr ggg bbb getcolor3 # = 1..5 if b = board getcolor13 # = 1..495 at max. 99 boards # = fibernr. 1..5 or # = 1..495 getcolor3 2 b not specified 010 068 022 4.8 Get stored HUE Value, Saturation and Intensity Transmit Description Receive Example Comment gethsi# b get stored HUE Value, Saturation and Intensity hhh.hh sss iiiii gethsi3 5 # = 1..5 if b = board gethsi23 # = 1..495 at max. 99 boards b not specified # = channel no. 1..5 b or # = 1….495 123.47 089 04383 Output format 4.9 Get stored XY Chromaticity Value Transmit Description Receive Example Comment getxy# b get XY Chromaticity Value 0.xxxx 0.yyyy getxy1 4 # = 1..5 if b = board getxy16 # = 1..495 at max. 99 boards b not specified # = Channel no. 1..5 b or # = 1….495 0.6461 0.3436 Output format 22.04.2015 23 4.10 Get stored Colour Temperature Value in Kelvin Transmit Description Receive Example Comment getctemp# b get Colour Temperature Value in °Kelvin Xxxxx.x Getctemp 1 00000.0 = no calculation possible 05678.9 # = channel no. 1..5 b or # = 1….495 # b – value see getrgbi 4.11 Get the Value for Intensity Transmit Description Receive Example Comment getintensity# b Get value for intensity iiiii getintensity1 00000 = under range 99999 = over range # = channel no. 1..5 b or # = 1….495 # b—Values see getrgb 06734 Output format 4.12 Get the Intensity Gain Factor Transmit Description Receive Example Comment getintgain# b Get intensity gain factor xxx getintgain1 Norm = 100% # = channel no. 1..5 b or # = 1….495 # b - Values see getrgb 100 Output format 4.13 Get ranges of the intensity for all fibers Transmit Description Receive Example Comment getranges b Get ranges of the intensity for all fibers of one board m-f m-f m-f m-f m-f getranges 2 from board 2 See capturexyz b m= capture time(0-8) f = sensor range (0-1) 0 = 3x3 or 1 = 9x9 2-0 2-0 3-1 1-0 6-1 b = board 4.14 Get the User Time Transmit Description Receive Example Comment getusertime b Get usertime xxxxx getusertime from board 1 time = ms, b = board, if specified otherwise board1 01000 22.04.2015 24 4.15 Set the X Chromaticity Offset Transmit Description Receive Example Comment setxoffset#+-0.xxx # = fiberno. 1..5 b or # = 1..495 set x chromaticity offset OK setxoffset1+0.050 OK set fiber 1 x offset to +0.050 #=sensor, xxx=value, b=board 4.16 Set the Y Chromaticity Offset Transmit Description Receive Example Comment setyoffset#+-0.xxx # = fiberno. 1..5 b or # = 1..495 set Y chromaticity Off OK setyoffset1-0.050 OK set fiber 1 Y offset to -0.050 #=sensor, xxx=value, b=board 4.17 Get distance between LED and Board Transmit Description Receive Example Comment getdistance# b # = fibernr. 1..5 oder # = 1..495, b = board Get stored distance value in mm xxx.x getdistance4 # = 1..5 wenn b = board # = 1..495 bei max. 99 boards b not specified 003.5 4.18 Set the Capture time without Capture Transmit Description Receive Example Comment setcaptimexyz b x = set capture time 1=600 ms, 2=200ms, 3=120ms, 4=60ms, 5=20ms, 6=10ms, 7=2ms, 8= user programmable, 0=off (without capture - only set) OK setcaptime2115 OK x=2 200ms y=1 sensor low 9x9 z=1 sensor 1-5 or 1...495 b=board, if z=1-5 4.19 Set the Average Factor without Capture Transmit Description Receive Example Comment setaverage## b average factor 0=5 … 15=80 average (without capture - only set) OK setaverage10 ##=0 … 15 b=board 22.04.2015 25 4.20 Set amplification for Intensity Transmit Description Receive Example Comment setintgain#xxx set amplification for intensity OK setintgain 1095 setintgain 23095 fiber 1 set to 95% fiber 23 set to 95% #=sensor xxx=value b=board 4.21 Set user capture time Transmit Description Receive Example Comment setusertime#### b set user capture time OK setusertime01000 1 … 10000ms b=board 4.22 Set the X Chromaticity Offset Transmit Description Receive Example Comment setxoffset#+-0.xxx # = Fiberno. 1..5 b or # = 1..495 set x chromaticity offset OK setxoffset1+0.050 OK set fiber 1 x offset to +0.050 #=sensor, xxx=value, b=board 4.23 Set the Y Chromaticity Offset Transmit Description Receive Example Comment setyoffset#+-0.xxx # = Fiberno. 1..5 b or # = 1..495 set Y chromaticity Off OK setyoffset1-0.050 OK set fiber 1 Y offset to -0.050 #=sensor, xxx=value, b=board 4.24 Set distance between LED and Board Transmit Description Receive Example Comment setdistance#xxx.x b # = fibernr. 1..5 or # = 1..495 Set distance to light source in mm Default = 2mm Range: 000.0 - 999.9 mm OK Setdistance4003.5 Fiber 4 set distance to 3.5mm #=sensor, xxx.x=value b=board OK 4.25 Set LED Analyzer Board to default values Transmit Description Receive Example Comment setdefault b Set default values OK Setdefault Set default values b = board, if specified otherwise board1 OK 22.04.2015 26 4.26 Get the Serial Number of the Analyzer Transmit Description Receive Example Comment getserial Get serial number of the Analyser xxxx getserial 75A6 4-digit 4.27 Get the Version of the Firmware Transmit Description Receive Example Comment getversion Get the version of the firmware xxxx getversion 1034 4-digit 4.28 Get the Version of the Hardware Transmit Description Receive Example Comment gethw Get the version of the hardware xxxxxxxxx gethw GPS 5-1 7-digit 4.29 Set the Baud rate Transmit Description Receive Example Comment setbaudratexxxxxx set baud rate Default: 57600 OK setbaudrate019200 OK 9600, 19200, 38400, 57600, 115200, 230400 Attention: Between the command and the board number a space character has to be sent. For example: capture215 3 capture = Start Capture 2 = Capture time -> 200ms, MED 1 = Sensibility -> High, 9x9 Sensor matrix 5 = Sensor -> 5. Sensor Space character 3 = Board number -> 3. board in series After each command a Carriage Return CR (0x0d) has to be sent. Each received character string is closed with CR. The baud rate between the boards amounts to 115200 and is not changeable. 22.04.2015 27 GPS Group Office South: GPS Prüftechnik GmbH Waldstr. 4 D-82239 Alling Telefon +49-8141-52 747-0 Telefax +49-8141-52 747-47 Hungary: GPS Prüftechnik Kft. Zrinyi M. u. 105 HU-8900 Zalaegerszeg Telefon +36-92 510 740 Telefax +36-92 510 741 Office Rhein/Main: GPS Prüftechnik Rhein/Main GmbH Ferdinand-Porsche-Str.17 D-63500 Seligenstadt Telefon +49-6182-89 37-0 Telefax +49-6182-89 37-37 Switzerland: GPS Prüftechnik AG Täfernstr. 2a CH-5405 Baden-Dättwil Telefon +41-56-483 25 80 Telefax +41-56-483 25 89 Office Nord: GPS Prüftechnik GmbH Steigerring 25 D-59075 Hamm Telefon +49-2381-99 110-0 Telefax +49-2381-99 110-99 Office East Dieter Boldt Olwenstraße 26 D-13465 Berlin Telefon +49-30 - 401 19 03 Telefax +49-30 - 401 00 816 Internet: gps-prueftechnik.de E-Mail: [email protected] © Copyright 2005-2009 by GPS Prüftechnik GmbH. All rights reserved. No parts of this manual may be reproduced or retransmitted in any form or means, electronic or mechanical, including photocopying, recording, or any other storage and retrieval system without prior permission in writing from GPS Prüftechnik GmbH. 22.04.2015 28