1
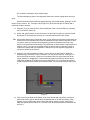
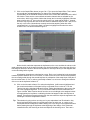
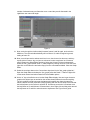
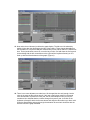
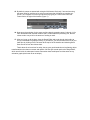
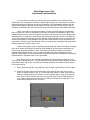
Week Eight Lesson Two
Keyframing Transformations
In our last lesson we made our first foray into actual animation in three dimensions by
exploring the use of keyframes to animate a simple airplane flyby scene. We blocked in our basic
start and stop points, refined that motion with the addition of an intermediate keyframe, and also
learned how to align an object to its motion path. In today’s lesson we will take a closer look at
keyframes, concentrating on some of the other types of changes that are controlled by keyframes.
This is a good time to talk about Envelopes. The term envelope refers to any parameter
that is controlled in a scene by keyframes on a timeline. Envelopes are available on many of the
editable attributes of your scenes and objects. Any place in Layout where you see a square button
marked with an “E” indicates an attribute that may be changed across the timeline. This ability to
vary so many attributes across time gives the animator almost unlimited power of expression, and
because the timeline for each parameter uses the exact same interface, we can gain this level of
power with a minimum of pain and suffering. Once you have the gist of working in the graph editor,
the whole gamut of controls is open to you.
Today we are going to focus on keyframing things other than motion and rotation. Although
this is to be a basic introduction to keyframing transformations, the methods we will discuss are
useful on any envelope available in Layout, because all envelopes are edited on essentially
identical Graph Editor windows. Only the channels available will change depending on what
attribute is being edited. So, pay close attention as we proceed with our investigation of keyframing
transformations in LightWave Layout. Let’s get started.
What we are going to do is animate a bar graph similar to any other bar graph you may
have seen in a financial report etc…The individual bars of the graph will need to animate up to their
hypothetical values one by one, to illustrate the dramatic change of the amount of money earned
over a period of time.
1. Open Layout and load the “bar_graph.lwo” from the week_eight directory on the CD-Rom.
2. Select the Camera View from the drop-down menu at the top left corner of the Layout
Open-GL display window (or the “6” on the number pad). While the other views are quite
useful for arranging items in your scene, it is very important that you refer to the Camera
view often, since the Camera view is the only one that gives you a accurate depiction of
your rendered scene from the same point of view as the render will be made from. Your
scene should resemble the one in Figure 1.
Figure 1
Ok, we want our animation to proceed this way:
The first bar begins to grow to its height after about half a second, taking half a second to
grow.
Half a second after the first bar has stopped growing, the second follows, growing to its full
height in half a second…etc. To keep it easy to figure out, all the intervals are 15 frames (half a
second at 30 fps) in duration
3. Press the “f” key to open the Go to Frame dialog box. Enter 15 and hit Enter (or just drag
the Time Slider to frame 15).
4. Select “bar_graph:red bar” as the current item. Hit the Enter key twice (or click the Create
Key button) to set a keyframe at frame 15 to end the static period for the red bar.
TIP: One problem that seems to continually come up from beginners is that they forget that even
a still interval for an animated item must be bracketed on either end by a keyframe. If there
is a motion, there is a keyframe at the beginning position and another at the end of the
motion. It works the same with stillness. The keyframes are what holds the object down to a
position in time. If you get into a situation where an object begins to change too early or
continues to change after it is supposed to, chances are you’ve forgotten a keyframe on
one end or another of the interval.
5. Using the one of the methods from Step 3, go to frame 30 on the Timeline. Select the
Stretch tool (h). Stretch the Y-Axis 6.5 meters. You may do this either by: entering 6.5 in
the Numeric field next to the Y-Axis line in the Numeric info box at the bottom left of the
Layout interface, or dragging the Y-Axis handle (the green one) while the Stretch tool is
enabled till the display in the Numeric Info box reads about 6.5. Hit the Enter key twice to
create a keyframe for the red bar in its stretched state. Your screen should look like Figure
2.
Figure 2
6. Click on the Frame Slider at the bottom of the view window and drag it from 0 to 30 and
back a few times to get an idea what the animated growth of the bar will look like. Drag
between 0 and 15 particularly slowly. Notice that the bar seems to shrink a bit before it
begins its growth spurt on frame 15. Let’s take a look at what causes this and what we can
do to fix it.
7. Click on the Graph Editor button (or type Ctrl + F2) to open the Graph Editor. This is where
we can edit any animated parameter (or channel) by manipulating a graphical
representation of the individual channel’s motion curve. Notice the Channel Bin at the left of
the window. These are the current default animation channels that are editable for the
current item, which is the red bar. Notice that the top item is currently highlighted. What we
want to look at is the 8th item on the list, which is the “bar_graph:red bar.Scale Y” channel.
Since the only keys we have set so far have been to stretch the object on the Y-axis, this is
the only curve in the 9 channels we currently see that has anything other than a flat
unchanged line in it. Click on the Scale Y channel to highlight it and make it the active
channel. Your view should resemble Figure 3.
Figure 3
Notice the tick marks that represent the keyframes on the curve and that the values on the
graph represent value for the channel (vertically) over time (horizontally). Also notice the dip in the
line that goes below the values of the first two keyframes. That dip is the key to what happens with
our box shrinking before it grows.
All animation channels are calculated as curves. Each curve is plotted to be the smoothest
transition possible between two or more values. In order for the curve to be as smooth as possible,
the curve swings wide through the second keyframe in anticipation of the steep slope of the part of
the curve after frame 15. So, in order to get that dip to flatten out, we have to change the behavior
of the curve at the keyframe at frame 15.
8. Click on the tick mark at frame 15 to select that keyframe. It will become highlighted and
the controls at the bottom of the panel will be un-ghosted. Enter a value of 1.0 on the
Tension line on the right hand side and hit Enter. Notice what happens to the curve to the
left of the highlighted keyframe. The curve should be flattened out and resemble that in
Figure 4, below. What Tension does is force the curve to hold tight to the assigned values
as it approaches the keyframe, not allowing the bend to happen till after the keyframe is
passed. This effectively removes the dip from the area where the object is supposed to be
unchanged. Close the Graph Editor window.
Tip: This situation is going to be a recurring one in your explorations into 3D animation. Any
time a keyframed object goes from a static period into an active one, or a value on an
enveloped channel undergoes a sudden change, the curve will go in the opposite direction
before passing through the keyframe at the beginning of the change. If this causes an
unwanted motion, the first thing to check and adjust is the incoming curve. There are a
number of alternative ways to flatten the curve out and they are all discussed in the
LightWave user manual at length.
Figure 4
9. Now, scrub through the timeline slowly between frames 0 and 30 again, and notice the
difference. The red bar holds absolutely still until frame 15, and then begins its growth,
ending at frame 30.
10. Now, we could proceed to animate each bar in turn, but since we’ve done one, and they
are all similar in nature, why not just use a shortcut to save ourselves a lot of time and
effort? Reopen the Graph Editor window by hitting the Ctrl and F2 keys simultaneously.
Select the “bar_graph:red bar Scale Y” channel again by clicking on its line in the bin. Now
right-click on the same line and select Copy from the commands available. Close the Graph
Editor.
11. Select the next item down on the Current Item drop-down list, the”bar_graph:yellow bar”.
Open the Graph Editor and select the ”bar_graph:yellow bar.Scale Y” channel. Right-click
on the same channel and select Paste from the available options.
12. Hit the “a” key to Autofit the curve into the Graph Editor display. Now we’ve got the same
graph on this object layer as we had on the red bar already flattened out and everything.
The only problem is both bars grow simultaneously because they share the same key
frames, and we want the yellow bar to begin growing after the red one stops. We know that
the last keyframe on the red bar is at frame 30. So what we need to do is somehow move
the keyframes at 15 and 30 down 15 frames later in time. Right-click and drag a box around
the keyframes at 15 and 30 to select those two keyframes. Use Figure 5 as a guide.
Figure 5
13. Now notice the tool buttons just below the graph display. The Move tool is selected by
default. Notice also the directions to the right of the buttons. These change depending on
the selected tool. It says that LMB (left mouse button) moves values and Ctrl + LMB moves
time. That’s just what we want to do, move the keys in time. So hold down the Ctrl key and
click and drag with the left mouse button to the right until the keyframe formerly at 15 is
lined up with the 30 at the bottom of the graph. (Figure 6).
Figure 6
14. There is one more adjustment to make here. We changed the time well enough, but the
value is the same as the red bar as well. If this was a real job we could fill in the actual
value we wanted to represent for each year, but for this example we can just vary the
numbers a bit to indicate that the numbers change from year to year. Just click on the
keyframe at frame 45 with the left mouse button and drag the value either up or down a bit.
Close the Graph Editor and scrub through the animation to see what it looks like with the
first two bars of the graph animated.
15. By default, scenes are started with a length of 60 frames. Obviously, if we continue using
the same offset for each bar we’re going to need more than 60 frames to complete our
scene. Let’ s lengthen our scene by one second by typing in a value of 90 in the Last
Frame field to the right of the timeline (Figure 7).
Figure 7
16. Now set up the animation for the green and blue bars by repeating steps 12 through 14 for
each. Remember that each bar needs to start 15 frames after the preceding one, and the
values need to vary a bit for the amount of scaling on each.
17. After you’ve set up all the bars, close the Graph Editor and scrub through the timeline to
see your animated bar graph do its thing. If you want to, you can save the scene file to your
hard drive by clicking on the File button at the top left of the interface and selecting Save/
Save Scene As from the choices there.
That’s about all we have time for today, but we got a good introduction to keyframing object
transformations other than movement and rotation. We also got a sneak peek at the Graph Editor,
which we will revisit in subsequent lessons. Remember these techniques work the same for any
animation graph (also known as an envelope).