1
SFC
A Structured Flow Chart Editor
Version 2.3
User’s Guide
Tia Watts, Ph.D.
Sonoma State University
1 of 35
SFC – A Structured Flow Chart Editor
Version 2.3
User’s Guide
Table of Contents
1.
2.
3.
4.
5.
6.
7.
Introduction ..................................................................................................................... 3
Getting Started with SFC ................................................................................................ 4
The SFC Environment..................................................................................................... 5
Creating a New Structured Flow Chart ........................................................................... 7
Opening an Existing Structured Flow Chart ................................................................... 8
Inserting a New Procedure .............................................................................................. 8
Inserting Control Structures ............................................................................................ 11
a. Sequential Process or Activity .................................................................................. 12
b. Input or Output .......................................................................................................... 13
c. Subroutine Call.......................................................................................................... 14
d. Single Decision ......................................................................................................... 15
e. Double Decision........................................................................................................ 16
f. Case Statement .......................................................................................................... 17
g. Case Option ............................................................................................................... 18
h. Test at the Top Loop ................................................................................................. 19
i. Test at the Bottom Loop............................................................................................ 20
j. Counting Loop........................................................................................................... 21
k. User Controlled Exit Loop ........................................................................................ 22
8. Inserting Documentation ................................................................................................. 23
9. Modifying Control Structures ......................................................................................... 24
10. Transforming Control Structures .................................................................................... 24
11. Using Cut, Copy, and Paste............................................................................................. 26
12. Printing a Structured Flow Chart .................................................................................... 28
13. Viewing and Printing Pseudo Code ................................................................................ 28
14. Saving a Structured Flow Chart ...................................................................................... 29
15. Closing a Structured Flow Chart View ........................................................................... 30
16. Exporting SVG and TXT files ........................................................................................ 30
17. Editing Multiple Structured Flow Charts ........................................................................ 31
18. Exiting from SFC ............................................................................................................ 31
Appendix A : Flow Chart Symbols ....................................................................................... 32
Appendix B : Examples ........................................................................................................ 33
Software and Documentation Copyright Tia Watts 2001
2 of 35
1. Introduction
Program development can be described as a seven step process:
1.
2.
3.
4.
5.
6.
7.
Understand the problem.
Plan the logic of the program.
Code the program using a structured high level computer language.
Using a compiler, translate the program into a machine language.
Test and debug the program.
Put the program into production.
Maintain and enhance the program.
Planning the logic of the program requires the development of algorithms. An algorithm is a
finite, ordered set of unambiguous steps that terminates with a solution to the problem. Human
readable representations such as flow charts and pseudo code are typically used to describe the
steps of an algorithm and the relationships among the steps.
A flow chart is a graphical representation of the steps and control structures used in an algorithm.
A flow chart does not involve a particular programming language, but rather uses a set of
geometric symbols and flow control lines to describe the algorithm. From a flowchart, a
programmer can produce the high level code required to compile an executable program.
Initially, the standard for describing flow charts only specified the types of shapes and lines used
to produce a flow chart. The introduction of structured programming in the 1960’s and 70’s
brought with it the concept of Structured Flow Charts. In addition to a standard set of symbols,
structured flow charts specify conventions for linking the symbols together into a complete flow
chart.
The structured programming paradigm evolved from the mathematically proven concept that all
problems can be solved using only three types of control structures:
Sequence
Decision (or Selection)
Iterative (or looping).
The definition of structured flow charts used in this document and software further defines:
3 types of sequential structures:
Process, Input/Output, and Subroutine Call
3 types of decision structures
Single Branch, Double Branch, and Case
4 types of iterative structures
Test at the Top, Test at the Bottom, Counting, and User Controlled Exit.
The SFC program is designed to aid the programmer in designing and presenting structured flow
charts. In addition, SFC will automatically generate pseudo code for a flow chart as the flow
chart is being created.
3 of 35
2. Getting Started with SFC
To start the SFC program:
Place the disk containing the SCF program in the A: drive.
From the Start menu, select the Run option.
Enter a:\sfc in the Run dialog box and click on OK or press the enter key.
OR if you have copied the SFC program onto the hard drive (C:) of your computer
From the Start menu, select the Run option.
Enter c:\sfc in the Run dialog box and click on OK or press the enter key.
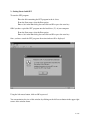
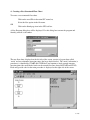
Once you have started the SFC program, the main window will be displayed:
Using the left mouse button, click on OK to proceed.
You can maximize the size of this window by clicking on the full screen button in the upper right
corner of the window frame.
4 of 35
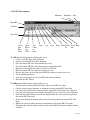
3. The SFC Environment
Minimize
Maximize Exit
Menu Bar
Tool Bar
Status Bar
Create
New
Flow
Chart
Open
Existing
Chart
Save
Chart
to
Disk
Print
Cut
Copy
Paste Undo Zoom Zoom Help
In
Out
The File menu includes options allowing the user to:
• Create a new SFC flow chart document
• Open an existing SFC flow chart document
• Save the current SFC flow chart document to a file
• Save the current SFC flow chart document to a newly named file
• Export the current SFC flow chart to an SVG or TXT file
• Print the current SFC flow chart or pseudo code view
• Preview the print version of the current SFC flow chart or pseudo code view
• Set the printing parameters
• View and select from a list of recent SFC flow chart documents
• Exit from the SFC Editor.
The Edit menu includes options allowing the user to:
• Undo the most recent modification made to the current SFC flow chart
• Cut the selected control structure or subroutine from the current SFC flow chart
• Copy the selected flow chart element from the current SFC flow chart to the clipboard
• Copy the selected pseudo code from the current SFC pseudo code view to the clipboard
• Paste the flow chart element stored on the clipboard into the selected insertion point in
the current SFC flow chart
• Insert a new flow chart element at the selected insertion point in the current SFC flow
chart
• Modify the selected control structure or subroutine in the current SFC flow chart.
• Transform the selected control structure in the current SFC flow chart to another control
structure.
5 of 35
The View menu includes options allowing the user to:
• View or hide the Tool Bar
• View or hide the Status Bar
• Select the Generic style of pseudo code for the current SFC flow chart
• Select the C++ style of pseudo code for the current SFC flow chart
• Include line numbers in the pseudo code window
The Window menu includes options allowing the user to:
• Create a copy of the current SFC flow chart in a new window
• Display a cascade of the open SFC flow chart documents
• Display a horizontal tiling of the open SFC flow chart documents
• View and select from a list of the open SFC flow chart documents.
The Help menu includes options allowing the user to:
• View SFC version information.
The left mouse button is used to select or modify an element in the current SFC flow chart:
• Pointing to the symbol associated with a control structure, subroutine, or insertion point
and single clicking the left mouse button will select the element. If the selected element is
a control structure or subroutine, selection will be indicated by a dashed-line rectangle
enclosing the complete structure or subroutine. If the selected element is an insertion
point, selection will be indicated by a dashed-line square enclosing the insertion point.
• Pointing to the symbol associated with a control structure, subroutine, or insertion point
and double clicking the left mouse button will allow the user to modify the element. If the
element is a control structure or subroutine, the appropriate text entry dialog box will be
displayed. If the element is an insertion point, the appropriate insertion dialog box will be
displayed.
The left mouse button is also used to select a segment of the current pseudo code.
The right mouse button is used to display pop-up menus:
• Pointing to the symbol associated with a control structure or subroutine and clicking the
right mouse button will display a pop-up menu with options to:
o Copy the control structure or subroutine to the clipboard
o Cut the control structure or subroutine and place a copy on the clipboard
o Delete the control structure or subroutine
o Modify the control structure or subroutine
o Transform the control structure
• Pointing to an insertion point and clicking the right mouse button will display a pop-up
menu with options to:
o Insert a new control structure or subroutine at the insertion point
o Paste a copy of the appropriate control structure or subroutine on the clipboard at
the insertion point.
6 of 35
4. Creating a New Structured Flow Chart
To create a new structured flow chart:
OR
Click on the word File in the main SFC menu bar.
Select the New option in the file menu.
Click on the blank page icon in the SFC tool bar.
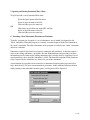
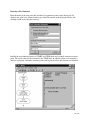
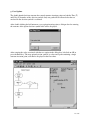
A New Program dialog box will be displayed. Use this dialog box to name the program and
identify yourself as the author.
The new flow chart, displayed on the left side of the screen, consists of a procedure called
“main” and two subroutine insertion points (the large shaded circles). The “main” subroutine (a
procedure) is identified by START and STOP labels and contains a single control structure
insertion point (the small shaded circle on the control flow lines between START and STOP).
Read-only pseudo code for the main procedure is displayed on the right side of the screen.
7 of 35
5. Opening an Existing Structured Flow Chart
To open and edit a saved structured flow chart:
OR
Select the Open option in the file menu.
Select or enter the name of the file.
Click on OK or press the enter key.
Click on the open folder icon in the SFC tool bar.
Select or enter the name of the file.
Click on OK or press the enter key.
6. Inserting a New Subroutine (Procedure or Function)
Typically, programs are designed as a set of subroutines, one of which is designated as the
“main” subroutine. When the program is executed, execution begins with the first statement in
the “main” subroutine. The other subroutines in the program are called by the “main” subroutine
and/or by each other.
Subroutines can be divided into two categories: functions and procedures. A function returns a
value to the calling subroutine, a procedure does not. Both functions and procedures can have
information passed to them by the calling subroutine; this is usually done by supplying a list of
actual parameter values when the subroutine is called. The formal descriptions of the parameter
values expected by the subroutine are declared as part of the subroutine.
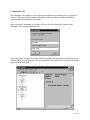
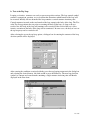
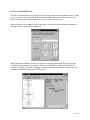
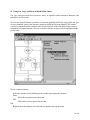
A new function or procedure can be inserted at a subroutine insertion point (represented by a
large shaded circle). To insert a new function or procedure, double click the left mouse button
while pointing to the subroutine insertion point. A dialog box will be displayed:
8 of 35
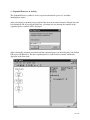
Inserting a New Procedure
Enter the name of the new procedure and the list of parameter names in the dialog box and then
left click on OK or press the enter key.
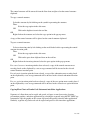
Initially the new procedure consists of START and STOP labels and a control structure insertion
point. In addition, when a new procedure is added to a program, subroutine insertion points will
be placed before and after the new procedure.
9 of 35
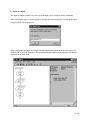
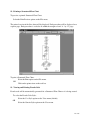
Inserting a New Function
Enter the name of the new procedure and the list of parameter names in the dialog box. In
addition, the value to be returned and its type should be entered in the dialog box before left
clicking on OK or pressing the enter key.
Initially the new function consists of START and STOP labels and a control structure insertion
point. The return value will be indicated in the STOP label. In addition, when a new function is
added to a program, subroutine insertion points will be placed before and after the new function.
10 of 35
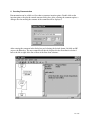
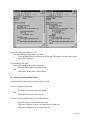
7. Inserting Control Structures
Control structures are inserted by double clicking the left mouse button while pointing to a
control structure insertion point. The control structure insertion points are represented as small
shaded circles on the control flow lines of a procedure. On some screens, control structure
insertion point circles may actually appear as small shaded diamonds.
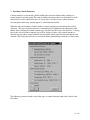
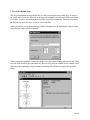
When the left mouse button is double clicked, a control structure insertion dialog box will be
displayed. The type of control structure is determined by left clicking on the appropriate radio
button. After selecting the control structure type, left click on OK or press the enter key. A dialog
box for the selected control structure type will be displayed. After a new control structure is
inserted in a procedure, control structure insertion points will be placed before and after the new
structure. This dialog box will also be used when adding documenting comments to a flow chart.
The following sections describe each of the types of control structures that can be added to the
flow chart.
11 of 35
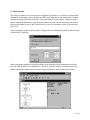
a. Sequential Processes or Activity
The Sequential Process symbol is used to represent calculations, processes, and other
unambiguous actions.
After selecting the sequential process option of the insert new control structure dialogue box and
left clicking on OK or pressing the Enter key, a dialogue box for entering the contents of the
sequential process symbol will be displayed:
After entering the statement associated with the sequential process in the dialog box, left click on
OK or press the Enter key. The new sequential process symbol and its contents will then be
displayed in the flow chart:
12 of 35
b. Input or Output
The Input or Output symbol is used to represent input (read) or output (write) statements.
After selecting the input or output option, a dialogue box for entering the contents of the input
/output symbol will be displayed:
After entering the statement associated with the input/output statement in the dialog box, left
click on OK or press the Enter key. The new input/output symbol and its contents will then be
displayed in the flow chart:
13 of 35
c. Subroutine Call
The Subroutine Call symbol is used to represent execution of a predefined process or group of
processes. The name of the subroutine and values to be passed to the subroutine should be
enclosed within the subroutine call symbol.
After selecting the subroutine call option, a dialogue box for entering the contents of the
subroutine call symbol will be displayed:
After entering the statement associated with the subroutine call statement in the dialog box, left
click on OK or press the Enter key. The new subroutine call symbol and its contents will then be
displayed in the flow chart:
14 of 35
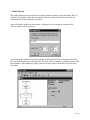
d. Single Decision
The decision symbol is used to represent a comparison, question, test, selection, or decision that
determines an alternative path to be followed. The single branch decision structure has a control
structure insertion point only on the True (T) branch of the decision symbol. Control structures
placed on the True branch of a single decision structure are only executed if the test enclosed in
the decision symbol is true. If the result of the test is false, the structures on the True branch are
by-passed.
After selecting the single decision option, a dialogue box for entering the contents of the decision
symbol will be displayed:
After entering the condition associated with the single branch decision statement in the dialog
box, left click on OK or press the Enter key. The new decision symbol, its condition and a true
branch containing a single structure insertion point will then be displayed in the flow chart:
15 of 35
e. Double Decision
The double branch decision structure has control structure insertion points on both the True (T)
and False (F) branches of the decision symbol. Only one path will be followed after the test
enclosed in the decision symbol is evaluated.
After selecting the double decision option, a dialogue box for entering the contents of the
decision symbol will be displayed:
After entering the condition associated with the double branch decision statement in the dialog
box, left click on OK or press the Enter key. The new decision symbol, its condition and true and
false branches, each containing a single structure insertion point, will then be displayed in the
flow chart:
16 of 35
f. Case Statements
The case, or multi-branch decision, structure has insertion points for case option statements and a
default branch. Only one path will be followed after the statement enclosed in the decision
symbol is evaluated.
After selecting the case statement option, a dialogue box for entering the contents of the case
selection statement will be displayed:
After entering the statement associated with the case statement in the dialog box, left click on
OK or press the Enter key. The new case symbol, its selection statement and case option and
default branches will then be displayed in the flow chart:
17 of 35
g. Case Options
The double branch decision structure has control structure insertion points on both the True (T)
and False (F) branches of the decision symbol. Only one path will be followed after the test
enclosed in the decision symbol is evaluated.
After double clicking the left button on a case option insertion point, a dialogue box for entering
the contents of the option decision symbol label will be displayed:
After entering the value associated with the case option in the dialog box, left click on OK or
press the Enter key. The new option decision symbol, its value and a path containing a single
structure insertion point, will then be displayed in the flow chart:
18 of 35
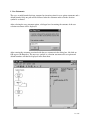
h. Test at the Top Loop
Looping, or iterative, structures are used to represent repetitive actions. The loop control symbol
contains a comparison, question, test, or decision that determines which branch of the loop will
be executed. Initially, the true branch of the loop contains a control structure insertion point.
Control structures inserted on the true branch of the loop comprise the body of the loop. The Test
at the Top Loop performs the test prior to executing the body of the loop. As long as the test
result is true, the body of the loop will continue to be executed. If the result of the test is false,
iterative execution of the body of the loop will be terminated. In some cases, the body of a test at
the top loop may not be executed at all.
After selecting the test at the top loop option, a dialogue box for entering the contents of the loop
decision symbol will be displayed:
After entering the condition associated with the test at the top looping statement in the dialog box
and selecting the desired format, left click on OK or press the Enter key. The new loop decision
symbol, its contents and a true branch containing a single structure insertion point will then be
displayed in the flow chart:
19 of 35
i. Test at the Bottom Loop
The Test at the Bottom Loop performs the test after executing the body of the loop. As long as
the result of the test is true, the body of the loop will continue to be executed. If the result of the
test is false, iterative execution of the body of the loop will be terminated. The body of a test at
the bottom loop will always be executed at least one time.
After selecting the test at the bottom loop option, a dialogue box for entering the contents of the
loop decision symbol will be displayed:
After entering the condition associated with the test at the bottom looping statement in the dialog
box, left click on OK or press the Enter key The new loop decision symbol and its contents and a
entry flow line containing a single structure insertion point will then be displayed in the flow
chart:
20 of 35
j. Counting Loop
The counting loop performs body of the loop once for each desired value of the loop control
variable. When the value of the loop control variable is outside of the indicated bounds, iterative
execution of the body of the loop will be terminated. In some cases, the body of a counting loop
may not be executed at all.
After selecting the counting loop option, a dialogue box for entering the contents of the loop
header symbol will be displayed:
OR
After entering the loop control variable and the desired starting, ending, and step values in the
dialog, left click on OK or press the Enter key. The new loop header symbol, its contents and a
true branch containing a single structure insertion point will then be displayed in the flow chart:
OR
21 of 35
k. User Controlled Exit Loop
The User Controlled Exit Loop performs body of the loop until the exit condition is true. As long
as the test result is false, the body of the loop will continue to be executed. In some cases, the
portion of the loop body following the exit test may not be executed at all.
After selecting the user controlled exit loop option, a dialogue box for entering the contents of
the loop decision symbol will be displayed:
After entering the condition associated with the user looping statement in the dialog box and
selecting the desired format, left click on OK or press the Enter key. The new loop decision
symbol, its contents and a path containing a structures insertion points before and after the exit
condition will then be displayed in the flow chart:
22 of 35
8. Inserting Documentation
Documentation can be added to a flow chart at structure insertion points. Double click on the
insertion point to display the control structure dialog box. After selecting the comment option, a
dialogue box for entering the contents of the comment will be displayed:
After entering the comment in the dialog box and selecting the desired format, left click on OK
or press the Enter key. The new comment will then be displayed in the flow chart in a dashed
box to the left or right of the line of flow of the flow chart structure:
23 of 35
9. Modifying Control Structures
The contents of a control structure can be modified by double clicking the left mouse button
while pointing to the symbol representing the control structure. The current contents will be
displayed in the appropriate dialog box. After the contents have been modified, click on OK or
press the enter key to save the modification. The modified structure will be displayed in the flow
chart.
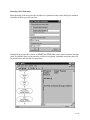
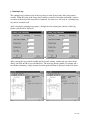
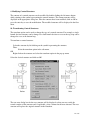
10. Transforming Control Structures
The transform option can be used to change the type of a control structure. For example, a single
branch decision structure can be changed to a dual branch decision or a test at the top loop can be
changed to a test at the bottom loop.
To transform a control structure:
OR
Select the structure by left clicking on the symbol representing the structure.
Then:
Select the transform option in the edit menu.
Right click on the structure and select the transform option in the pop-up menu.
Select the desired structure and click on OK.
Before
After
The text entry dialog box for the new structure will be displayed so that you may verify the
textual contents of the structure and, if applicable, select a format for the new structure. The new
structure will replace the original structure in the flowchart.
24 of 35
In some cases, flow chart structures will be lost when a transformation is performed. For
example, in the following example, where a double decision structure is transformed into a single
decision structure, the false branch is lost:
Before
After
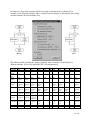
The following table describes the actions performed when a structure is transformed to a
different structure. (N/A = Not applicable; N/I = Not implemented)
From/To
Sequential
Input or
Output
Subroutine
Call
Single
Branch
Double
Branch
Selection
Test at Top
Test at
Bottom
User
Controlled
Counting
Comment
Seq.
N/A
OK
I/O
OK
N/A
Call
OK
OK
Single
OK
OK
Double Sel.
OK
OK
OK
OK
Top
OK
OK
Bottom
OK
OK
User
OK
OK
Count Com.
N/I
OK
N/I
OK
OK
OK
N/A
OK
OK
OK
OK
OK
OK
N/I
OK
True
branch
lost
T/F
branches
lost
All
branches
lost
Loop
body lost
Loop
body lost
True
branch
lost
T/F
branches
lost
All
branches
lost
Loop
body lost
Loop
body lost
True
N/A
branch lost
OK
OK
OK
OK
OK
N/I
False
branch
lost
First
branch
kept
OK
N/A
OK
False
branch
lost
First
branch
kept
OK
OK
N/I
First /
default
kept
OK
False
branch
lost
N/A First
branch
kept
OK N/A
First / N/I
default
kept
OK
N/I
OK
OK
OK
OK
N/A
OK
N/I
Pre/post
exit body
lost
N/I
OK
Pre/post
exit body
lost
N/I
OK
T/F
branches
lost
All
branches
lost
Loop body
lost
Loop body
lost Loop
body lost
Pre/post
exit body
lost
N/I
OK
True
branch
lost
T/F
branches
lost
All
branches
lost
Loop
body lost
Loop
body lost
Post exit
body
lost
N/I
OK
OK
OK
N/I
N/I
OK
Post exit
body
lost
N/I
OK
N/A
N/I
OK
Post exit
body
lost
N/I
OK
N/I
OK
N/A
N/I
Pre/post
exit body
lost
N/I
N/A
25 of 35
11. Using Cut, Copy, and Paste to Modify Flow Charts
Cut, copy, and paste can be used to remove, move, or duplicate control structures, functions, and
procedures in a flow chart.
To select the control structure, procedure, or insertion point that will be the target of the cut, past
or copy command, point to the structure symbol and click the left mouse button. The current
(selected) component will be outlined with a dashed line box in the flow chart. If the selected
component is a control structure, the text associated with the structure will be highlighted in the
pseudo code.
To cut a control structure:
OR
Select the structure by left clicking on the symbol representing the structure.
Then:
Select the cut option in the edit menu.
OR
Click on the scissors icon in the tool bar.
Right click on the structure and select the cut option in the pop-up menu.
26 of 35
The control structure will be removed from the flow chart and placed on the control structure
clipboard.
To copy a control structure:
OR
Select the structure by left clicking on the symbol representing the structure.
Then:
Select the copy option in the edit menu.
OR
Click on the duplicate icon in the tool bar.
Right click on the structure and select the copy option in the pop-up menu.
A copy of the control structure will be placed on the control structure clipboard.
To paste a control structure:
Select an insertion point by left clicking on the small shaded circle representing the control
structure insertion point.
Then:
Select the copy option in the edit menu.
OR
Click on the paste from clipboard icon on the tool bar.
OR
Right click on the insertion point and select the paste option in the pop-up menu.
If a control structure insertion point has been selected, a copy of the control structure most
recently placed on the clipboard by a cut or copy command will be inserted at the selected
control structure insertion point.
If a subroutine insertion point has been selected, a copy of the subroutine most recently placed
on the clipboard by a cut or copy command will be inserted at the selected subroutine insertion
point.
If a case option insertion point has been selected, a copy of the case option most recently placed
on the clipboard by a cut or copy command will be inserted at the selected case option insertion
point.
Copying Flow Chart or Pseudo Code Statements into Other Applications
Segments of a flow chart can be copied and pasted as figures to word processing, drawing,
presentation graphics, and other applications by selecting the segment, using the SFC Edit/Copy
command to copy the graphic to the system clip board and pasting it into the other application.
Similarly, segments of pseudo code can be copied and pasted as text into other applications.
27 of 35
12. Printing a Structured Flow Chart
To preview a printed Structured Flow Chart:
Select the Print Preview option on the File menu.
The printed version of the flow chart will be displayed. Each procedure will be displayed on a
separate page. Each procedure is scaled to fit within the margins of an 8 ½ “ by 11” page.
To print a Structured Flow Chart:
Select the Print option on the File menu.
OR
Click on the printer icon on the tool bar.
13. Viewing and Printing Pseudo Code
Pseudo code will be automatically generated for a Structured Flow Chart as it is being created.
To select the Pseudo Code Style:
Select the C++ Style option on the View menu (default).
OR
Select the Generic Style option on the View menu.
28 of 35
To preview the printed Pseudo Code:
After left clicking in the pseudo code frame,
Select the Print Preview option on the File menu. The printed version of the pseudo
code will be displayed.
To print the pseudo code:
After left clicking in the pseudo code frame,
Select the Print option on the File menu.
OR
Click on the printer icon on the tool bar.
14. Saving a Structured Flow Chart
A structured flow chart can be saved as a file on a disk.
To save a structured flow chart:
OR
Select the Save option on the File menu.
Click on the disk icon on the tool bar.
To save a structured flow chart using a different name:
Select the SaveAs option on the File menu.
Click on a file name or enter a new name in the dialog box.
Click on the OK button or press the enter key.
29 of 35
15. Closing a Structured Flow Chart View
To close a structure flow chart view window:
OR
Select the Close option on the File menu.
Click on the X button in the upper right corner of the structured flow chart view frame.
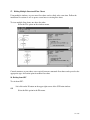
16. Exporting SVG and TXT files
The ExportAs option of the File menu can be used to create Scalable Vector Graphics (.svg) or
text (.txt) files.
Scalable Vector Graphics (SVG) is a graphics format designed by Adobe and based on XML.
SVG files can be viewed using the Adobe SVG Viewer. SVG files can be incorporated into web
pages. Since SVG files are text files, they can be modified using a text editor.
To save a structured flow chart as an SVG file:
Select the ExportAs option on the File menu.
Select Scalable Vector Graphic Files (.svg) as the Save as type
Click on a file name or enter a new name in the dialog box.
Click on the OK button or press the enter key.
The pseudo code associated with a flow chart can be exported to a text file for further editing or
compiling. The pseudo code file will be written using the format (Generic or C++) selected from
the View menu.
To save a structured flow chart as a text file:
Select the ExportAs option on the File menu.
Select Text Files (.txt) as the Save as type
Click on a file name or enter a new name in the dialog box.
Click on the OK button or press the enter key.
30 of 35
17. Editing Multiple Structured Flow Charts
Using multiple windows, two ore more flow charts can be edited at the same time. Follow the
instructions in sections 4 or 5 to open a second new or existing flow chart.
To view multiple flow charts one above the other:
Select the Tile option on the windows menu.
Control structures or procedures cut or copied from one structured flow chart can be pasted to the
appropriate type of insertion point in another flow chart.
18. Exiting from SFC
To exit from SFC:
OR
Left click on the X button on the upper right corner of the SCF main window.
Select the Exit option in the File menu.
31 of 35
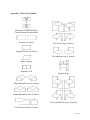
Appendix A : Flow Chart Symbols
Subroutine START/STOP with
Control Structure Insertion Point
Comment (2 formats)
Test at Top Loop (4 formats)
Sequential Process or Activity
Test at Bottom Loop (2 formats)
Input or Output
Subroutine Call
Counting Loop
Single Branch Decision (2 formats)
Double Branch Decision (2 formats)
User Controlled Exit Loop (4 formats)
Case Statement with Case Option
32 of 35
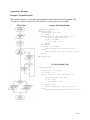
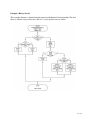
Appendix B : Examples
Example 1 Sequential Search
This example illustrates a procedure implementation of the Sequential Search algorithm. The
flow chart, its Generic style pseudo code, and its C++ style pseudo code are shown.
Flow Chart
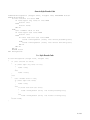
Generic Style Pseudo Code
PROCEDURE Seq_Search ()
BEGIN Seq_Search
read target value (TV)
let FOUND = no
WHILE values in list and FOUND = no DO
read value from list (LV)
IF TV = LV THEN
let FOUND = yes
END-IF
END-WHILE
IF FOUND = yes THEN
write "Target value found in list."
ELSE
write "Target value NOT found in list."
END-IF
END Seq_Search
C++ Style Pseudo Code
void Seq_Search ()
{
read target value (TV);
let FOUND = no;
while (values in list and FOUND = no)
{
read value from list (LV);
if (TV = LV)
let FOUND = yes;
}
if (FOUND = yes)
write "Target value found in list.";
else
write "Target value NOT found in list.";
}
1 of 35
Example 2 Binary Search
This example illustrates a function implementation of the Binary Search algorithm. The flow
chart, its Generic style pseudo code, and its C++ style pseudo code are shown.
2 of 35
Generic Style Pseudo Code
FUNCTION BinarySearch (integer value, integers list) RETURNING boolean
BEGIN BinarySearch
IF list contains one value THEN
IF value equal only value in list THEN
found = true
ELSE
found = false
END-IF
ELSE
test = middle value in list
IF value equal test value THEN
found = true
ELSE
IF value less than test value THEN
found = BinarySearch (value, list values preceding test)
ELSE
found = BinarySearch (value, list values following test)
END-IF
END-IF
END-IF
RETURN found
END BinarySearch
C++ Style Pseudo Code
boolean BinarySearch (integer value, integers list)
{
if (list contains one value)
{
if (value equal only value in list)
{
found = true;
}
else
found = false;
}
else
{
test = middle value in list;
if (value equal test value)
{
found = true;
}
else
if (value less than test value)
{
found = BinarySearch (value, list values preceding test);
}
else
found = BinarySearch (value, list values following test);
}
return found;
}
2 of 35