1
Preface
Thank you for choosing our product, our products are manufactured in compliance with ISO 9000. You are
assured of a quick, expert help with any product of Tianjin Wenhao. A team of highly qualified engineers
provides telephone support and will work with you to find a solution to your query on any aspect of the
operation, programming or application with our equipment.
The manual will give you a detailed introduction of how to operate and maintain this instrument, so, please
acquainted yourself with it at first.
Contents
Chapter 1
Overview ..................................................................................................................................... 1
1
Application................................................................................................................................................ 1
2
Attention ................................................................................................................................................... 1
Chapter 2 Usage & Operation......................................................................................................................... 4
Section 1
First Launch ................................................................................................................................. 4
Section 2
Front Panel ................................................................................................................................... 4
Section 3 Appearance & Rear Panel ............................................................................................................... 5
Section 4 Spectrum Analysis .......................................................................................................................... 7
1
Connection ................................................................................................................................................ 7
2
Screen Layout ........................................................................................................................................... 7
3
Spectrum Measurement ............................................................................................................................ 7
4
To view zero span continuous measurement results ............................................................................... 10
5
Reference Lines ...................................................................................................................................... 10
6
Setup Save/Load ..................................................................................................................................... 10
7
Results Save/Load................................................................................................................................... 10
Section 5 Cable-DVB ................................................................................................................................... 11
1
Connection .............................................................................................................................................. 11
2
Screen Layout ......................................................................................................................................... 11
3
Channels Edit(ChEdit) ............................................................................................................................ 12
4
Channels Load ........................................................................................................................................ 14
5
Channels Scan......................................................................................................................................... 14
6
Channels Search...................................................................................................................................... 15
7
Automatically Measurement(AutoMeas)................................................................................................ 15
8
Tilt Measurement(TiltMeas) ................................................................................................................... 16
9
Channel Measurement(ChMeas)............................................................................................................. 17
10
Channel Spectrum Sweep(ChSpect) ..................................................................................................... 19
11
Input Gain Select................................................................................................................................... 20
12
Reference Level Select ......................................................................................................................... 20
13
Setup Save/Load ................................................................................................................................... 20
14
Results Save/Load................................................................................................................................. 20
Section 6 Satellite-DVB................................................................................................................................ 20
1
Connection .............................................................................................................................................. 20
2
Screen Layout ......................................................................................................................................... 21
3
Channels Edit and Scan .......................................................................................................................... 21
4
Channel Measurement ............................................................................................................................ 23
5
Channel Spectrum Sweep(ChSpect) ..................................................................................................... 23
6
Input Gain Select .................................................................................................................................. 24
7
Reference Level Select ......................................................................................................................... 24
8
Setup Save/Load ................................................................................................................................... 24
9
Results Save/Load................................................................................................................................. 24
Section 7 Terrestrial DMB-TH ..................................................................................................................... 25
1
Connection .............................................................................................................................................. 25
2
Screen Layout ......................................................................................................................................... 25
3
Channels Edit(ChEdit) ............................................................................................................................ 26
4
Channels Import(ChImport).................................................................................................................... 26
5
Channels Scan......................................................................................................................................... 26
6
Auto Measurement.................................................................................................................................. 27
7
Channel Measurement ............................................................................................................................ 27
8
Channel Spectrum Sweep ....................................................................................................................... 28
9
Input Gain Select .................................................................................................................................. 29
10
Reference Level Select ......................................................................................................................... 29
11
Setup Save/Load ................................................................................................................................... 29
12
Results Save/Load................................................................................................................................. 29
Section 8 TS Analysis ................................................................................................................................... 29
1
Connection .............................................................................................................................................. 29
2
Screen Layout ......................................................................................................................................... 30
3
Analysis of Live TS ................................................................................................................................ 30
4 Analysis of Offline TS ............................................................................................................................ 30
5
Analysis Modules ................................................................................................................................... 31
Section 9 Calibration .................................................................................................................................... 56
1
Connection .............................................................................................................................................. 56
2
Window Layout....................................................................................................................................... 56
3
Calibration Steps..................................................................................................................................... 57
Section 10 Others.......................................................................................................................................... 57
1
Menu ....................................................................................................................................................... 57
2
To load the setup automatically .............................................................................................................. 59
3
Log Lock................................................................................................................................................. 59
4
TrapView............................................................................................................................................... 59
5
Mpeg2Recorder ...................................................................................................................................... 60
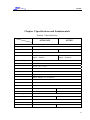
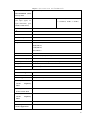
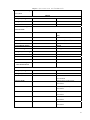
Chapter 3 Specifications & Principia............................................................................................................ 48
Section 1 Specifications................................................................................................................................ 48
Section 2 Fundamentals ................................................................................................................................ 55
Chapter 4
Maintenance and Repair............................................................................................................ 55
Section 1 Maintenance.................................................................................................................................. 55
1
Operating Maintenance........................................................................................................................... 55
2 Power Supply and ESD Requirements.................................................................................................... 55
Section 2 Repair............................................................................................................................................ 55
1
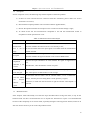
Problems Maybe ..................................................................................................................................... 55
Whether the reference level is set correctly or not;....................................................................................... 56
2
Return to factory ..................................................................................................................................... 57
AV5462
Chapter 1
1
Overview
Applications
Digital Television Integrated Analyzer is wildly applied in many different fields, including DTV
transmission device R&D, manufacture and maintenance, construction and acceptance of DTV network. To
meet the demand of the rapid growth of DTV industry, Tianjin Wenhao designed a new generation analyzer
AV5462 based on several instruments into a cabinet of only four height units in compliance with DVB-C,
DVB-S, DMB-TH. It covers three layers test functions as follows: RF measurement, protocol analysis and
video/audio monitoring.
2
Attention
Please check it as follows before the first startup, if you have any problem, contact us at your convenience
and we will provide you with help in time.
2.1 Checking Packaging and Order List
a) Inspect the shipping container to examine whether it’s damaged.
b)
Unpack it and make sure the standard accessories and the ordered options contained.
50Ω N—BNC Calibration Cable
1
75Ω/50Ω Convertor
1
AC Power Cord
1
User’s Manual
1
Checklist
1
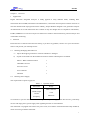
2.2 Checking Power Supply
The requirements of power supply are:
Table 1-1
Parameters
Voltage
Rated Output
Current
Frequency
Operation Power
Range
220V±10% AC
>1.8A
50Hz±5%
To minimize or prevent interference from sharing the same power supply with other devices, particularly
devices with large power, power supply with regulating function is recommended.
The instrument is equipped with a three-wire power cord, in accordance with international safety standards,
which is used to ground the instrument.
1
AV5462
a
2.3
Caution:Incorrect grounding will be harmful to instrument and danger to operator.
Electrostatic Discharge Precautions
This analyzer was constructed in an electrostatic protected environment, because most of the
semiconductor devices used in the instrument are susceptible to be damaged by static discharge.
a)
ESD desk & wristlet
b)
ESD floor & anklet
a
Caution:The precautions above is not applied when voltage exceeds 500V.
2
AV5462
Chapter 2 Instrument Functions
Section 1 First Startup
a
Caution:Please check the voltage of power supply and make sure the appropriate fuse
installed before connect the plug to the power supply unit.
a
Caution:Make sure a good aeration when the instrument is operated in a cabinet.
a) After the instrument is correctly connected to power supply, press the power switch on the rear
panel and the yellow led above “Power” button on the front panel, which indicates the instrument
is in standby status, is turned on, then press the “Power” button on the front panel to startup the
instrument, if the green led above it is lit, the instrument succeed in operating status, press this
button again will shutdown the instrument, but it’s highly recommended to shutdown it through
its OS.
b) The initialization of initialization will cost about 2 minutes.
c) The normal warn-up will take 5 minutes, while a more precise measurement will cost at least
30 minutes.
d)
Calibration will be done before verifying characteristics.
Section 2
Front Panel
Caution:The maximum RF input level is +30dBm with a programmable 50dB input
a
attenuation in 10dB step.
The maximum DC voltage to RF input is 30V, to input a signal of voltage
exceeding this value will damage the input attenuator and mixer after that.
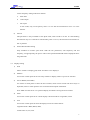
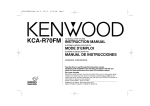
The front panel contains power button, reset button, TFT LCD, interfaces, mini-keyboard, touch panel, etc.
as shown below:
4
AV5462
④
AV5462
⑤
AV5462 数字电视综合测试仪
①
⑥
②
⑦
⑧
·
·
③
⑨
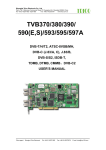
Figure 2-1 Front Panel
①
Reset button:To reset the instrument.
②
LCD:8.4-inch TFT with resolution 1024×768pixels.
③
Power button and LEDs:Yellow LED indicates standby status and the green one for operating
status.
④
Mini-keyboard:Number keys, Arrow keys and etc.
⑤
TS output:Transport Stream Output Interface.
⑥
TS input:Transport Stream Input Interface.
⑦ RF input:RF Input Interface.
⑧
Touch Panel:Instead the act of mouse.
⑨
USB Interface:To plug external USB device.
Section 3 Outlook and Rear Panel
The instrument has a dimension of 520×390×202mm, weight about 12 kg,aluminium alloy shell
and fans for cooling.
Figure 2-2 Outlook
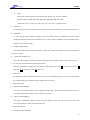
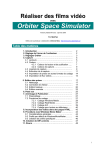
The rear panel is shown as below:
5
AV5462
e
f
b
g
a
h
电
校
k
l
j
i
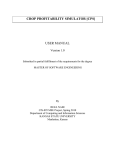
Figure 2-3 Rear Panel
a) Calibration Output BNC Interface
b) 10MHz Reference Clock Input/Output BNC Interface
c) Ethernet Interface 1
d) RS232 Interface
e) VGA Output Interface
f) SPI
g) Power Inlet
h) Power Switch
i) Ethernet Interface 1
j) PS/2
k) USB Interfaces
l) Fan
6
AV5462
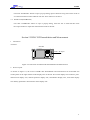
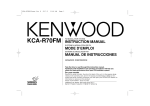
Section 4 Spectrum Analysis
1
Connection
As below:
AV5462
AV5462 数字电视综合测试仪
RF Signal
电
Figure 2-4 Connection for Spectrum Analysis
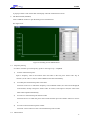
2
Screen Layout
As shown in Figure 2-5,spectrum analysis screen can be divided into three parts, control panel on the
right, display area in the center and parameters information display area in the south.
Figure 2-5 Spectrum Analysis Screen
3
3.1
Spectrum Sweep
Settings
7
AV5462
1)
Input Attenuation(InputAtt)
Use mouse or touch panel to set RF input attenuation from follows: Auto, 0dB, 10dB, 20dB,
30dB, 40dB, 50dB.
Input attenuation is determined by current reference level in auto mode.
2)
Detect
Use mouse or touch panel to select detection mode from follows: Maximum, Minimum, Sample,
Average.
3)
Resolution Bandwidth(RBW)
Use mouse or touch panel to set RBW from follows: Auto, 1KHz, 3KHz, 10KHz, 30KHz,
100KHz, 300KHz, 1MHz, 3MHz.
In auto mode, RBW is determined by current span as shown in the following table:
Table 2-1 Relations between Span, RBW and VBW
4)
Span
RBW
VBW
Span>50MHz
3MHz
1MHz
15MHz<Span<=50MHz
1MHz
300KHz
5MHz<Span<=15MHz
300KHz
100KHz
1.5MHz<Span<=5MHz
100KHz
30KHz
500KHz<Span<=1.5MHz
30KHz
30KHz
150KHz<Span<=500KHz
10KHz
10KHz
50KHz<Span<=150KHz
3KHz
3KHz
Span<=50KHz
1KHz
1KHz
Video Bandwidth(VBW)
Use mouse or touch panel to set VBW from follows: Auto, Off, 10Hz, 30Hz, 100Hz, 300Hz,
1KHz, 3KHz, 10KHz, 30KHz, 100KHz, 300KHz, 1MHz, 3MHz.
In auto mode, VBW is determined by span as shown in table 2-1.
5)
Average
Select a average number from the drop list to determine the display curve’s average times.
6)
Reference Level(RefLevel)
Use mouse and keyboard to set the reference level of the sweep, the invalid value input will cause
a warning.
7)
Frequency Setting(FreqSet)
The unit of frequency is MHz, with up to 3 decimal digits. Use mouse or touch panel to select
8
AV5462
current frequency setting mode from follows:
a.
Start+End
b.
Center+Span
c.
Zero Span
In this mode, only one frequency value is to set and the measurement curve is in time
domain.
8)
Interval
This parameter is only available to Zero Span mode, with second as its unit. It is the blanking
time between any two consecutive measurement points. If it is 0, the instrument will measure as
fast as possible.
9)
Power Measurement Setting
Only available to nonzero span mode. With the two parameters, start frequency and end
frequency, set appropriately, the power value of the specified bandwidth will be displayed above
the grid border.
3.2
Display Setting
1)
Grid
Select “Visible” to display grid, while “Invisible” not to display it.
2)
Markers
Use mouse or touch panel to set how many markers to display. There is up to 8 for selection.
3)
Active Marker(ActiveMkr)
Use mouse or touch panel to select the active marker, which can be moved with arrow keys on
keyboard, mouse or touch panel to view each measurement point information.
Note: Make sure the cursor is in spectrum display area before moving the active marker.
4)
Scale
Use mouse or touch panel to set current display scale from follows: Logarithm, Linear.
5)
Unit
Use mouse or touch panel to select the display unit of level from follows:
Logarithm Scale: dBuV, dBmV, dBm;
Linear Scale: uV, mV, mW.
9
AV5462
6)
Y-Div.
Use mouse or touch panel to select the level per divider of Y-Axis from follows:
Logarithm Scale: 10dB, 9dB, 8dB, 7dB, 6dB, 5dB, 4dB, 3dB, 2dB, 1dB;
Linear Scale: max.x1, max.x1/2, max.x1/4, max.x1/8. (max = reference level)
3.3 MaxTrace
Press this button down to enable the active marker trace the maximum level in current spectrum curve.
3.4 MaxHold
In Cont. Sweep mode without averaging, press this button down to maintain the active marker
displayed at the point where the maximum level is. A trace point is updated if a new maximum level is
detected in successive sweeps.
3.5
Single Sweep(Single)
Press this button down to make the analyzer sweep once. The measurement will only be repeated if
you press it again.
3.6 Continuous Sweep(Cont.)
Press this button down to make the analyzer performs sweep repeatedly, press it again will to stop it.
4
To view zero span continuous measurement results
After this measurement stopped, use four buttons on the right to the view, |< to view the first screen, >|
to the last, Å to the previous and Æ to the next.
5
Limit Lines
The limit lines, used to examine whether the level is in the specified range or not, are set by moving the
tiny solid triangle arrow outside the grid’s right border in vertical.
6
6.1
Setup Save/Load
Setup Save(SaveSetup)
Left click “SaveSetup” button to open a pop-up dialog, input a character string as the name of file to
save the setup and then click the ”Save” button to confirm it.
6.2
Setup Load(LoadSetup)
Left click “LoadSetup” button to open a pop-up dialog, select the file to load and then click
the ”Open” button to import the setup in this file.
7
Results Save/Load
7.1 Results Save(SaveResults)
10
AV5462
Left click “SaveResults” button to open a pop-up dialog, input a character string as the name of file to
save the measurement results and then click the ”Save” button to confirm it.
7.2 Results Load(LoadResults)
Left click “LoadResults” button to open a pop-up dialog, select the file to load and then click
the ”Open” button to import the measurement results in this file.
Section 5 DVB-C RF Demodulation and Measurement
1
Connection
As below:
AV5462
AV5462 数字电视综合测试仪
DVB-C RF Signal
电
Figure 2-6 Connection for DVB-C RF Demodulation and Measurement
2
Screen Layout
As shown in Figure 2-7, the screen of DVB-C RF demodulation and measurement can be divided into
control panel on the right and the results display area on the left. The results display area contains 5 parts:
channel-scan display area, channel spectrum display area, constellation display area, lock status display
area and key parameters measurement values display area.
11
AV5462
Figure 2-7 Screen of DVB-C RF Demodulation and Measurement
3
Channels Edit(ChEdit)
Click this button to open the dialog for channel edit.
See Figure 2-8:
12
AV5462
Figure 2-8 Dialog for Channels Edit of DVB-C
3.1 Channel Number(ChNum)
Double click a cell in this column into editing state, insert a character string, then press “Enter” /”OK”
key to commit it.
3.2 Center Frequency
Double click a cell in this column into editing state, input a number, then press “Enter”/”OK” key to
commit it, the video carrier frequency and audio carrier frequency (useful in analog mode) will be
updated automatically. If the frequency set already exists in the default channel-table, its default
channel number will be displayed in the right adjacent cell.
3.3
Digital/Analog Select
Left click a cell in this column, a pop-up list will open, use mouse or touch panel to select the channel
mode from follows: Digital, Analog.
3.4
Demodulation
Left click a cell in this column, a pop-up list will open, use mouse or touch panel to set the
13
AV5462
demodulation type from follows: 4QAM, 16QAM, 32QAM, 64QAM, 128QAM, 256QAM。
3.5
Symbol Rate(SR)
Only available to digital channel.
Double click one cell in the column into edit state, input a number, then press “Enter”/”OK” key to
commit it.
3.6
Enable
Left click any cell in the column to select or unselect the channel represented by the row for saving or
download operation.
3.7
Select All
To select all the valid channels in current table.
3.8
Unselect All
To unselect all the channels selected.
3.9 Ascending
To sort channels in the table in ascending order according to center frequency.
3.10
Open File
Left click “OpenFile” button to open a pop-up dialog, select the file to load and then click the ”Open”
button to import the channel table in this file.
3.11
Save File
Left click “SaveFile” button to open a pop-up dialog, input a character string as the name of file to
save the channel table and then click the ”Save” button to confirm it.
3.12
Channels Import(ImportChTbl)
Download the channel table into current control panel’s setup.
4
Channels Import(ImportChTbl)
Left click “ImportChTbl” button to open a pop-up dialog, select the file to load and then click
the ”Open” button to import the channel table in this file.
5
5.1
Channel Scan(ChScan)
Span
Use mouse or touch panel to select the span from follows: Full Span, 10MHz, 30MHz, 100MHz,
300MHz. The center frequency of scan is the current channel’s center frequency, which is ignored in
full span.
14
AV5462
5.2
Scan
Click “ChScan” button to start channel scan, the level at each channel’s center frequency will be
measured and displayed in the graph to assist in distinguishing valid channels from invalid ones,
digital channel or analog. Click this button again will stop the scan. After moving the cursor into its
display area, the marker can be moved by arrow keys to view the level at each channel’s center
frequency. To zoom it in or out, just double click in its display area.
6
6.1
Channel Search
Thresholds
Left click “Set” menu and select “Channel Scan Configuration” item to open the setting dialog:
Figure 2-9 Channel Scan Configuration Dialog
Drag the sliders to set video, audio carrier level thresholds for analog channel, center frequency level
threshold for digital channel.
6.2
Operation
Press “ChSearch” button down to start channel search, a pop-up window with the searching result will
open when it’s done.
Note: The channel search is according to current channel-table.
7
Auto Measurement(AutoMeas)
Measure every channel in current channel-table with their parameters set in the table.
15
AV5462
A pop-up window of the results table will display when the measurement is done.
8
Tilt Measurement(TiltMeas)
Click “TiltMeas” button to open the dialog for tilt measurement.
See Figure 2-10:
Figure 2-10 Dialog for Tilt Measurement
8.1
Frequency Setting
It’s able to measure up to 20 frequency points in the range of [5,862]MHz.
1)
To add a measurement point
Input a frequency value in the textbox above the table on the left, press ”Enter”/”Ok” key to
commit it, if the value is valid, it will be added into the table immediately.
2)
To modify the measurement points in the table
Left click on the row in which the frequency to be modified resides, the value will be displayed
in the textbox, modify it and press “Enter”/”OK” to commit, if the input is valid, the value in the
table will be updated immediately.
3)
To remove a measurement point from the table
Left click the row in which the point value resides and then press the “Delete” button to remove
it.
4)
To remove all measurement points in table
Left click “Clear” button to remove all measurement points in table.
8.2
Measurement
16
AV5462
Click “Meas” button to start tilt measurement, the results will be displayed in the left graph area and
the levels of each frequency points will be shown in the setting table.
8.3
Save
Left click “Save” button to open a pop-up dialog, input a character string as the name of file to save
the setup and measurement results and then click the ”Save” button to confirm.
8.4
Open
Left click “Open” button to open a pop-up dialog, select the file to load and click the “Open” button to
import measurement points set and its measurement results.
8.5
Exit
Left click “Exit” to close the dialog of tilt measurement, if the measurement is not completed yet, it
will be stopped at first.
Note: The tilt measurement’s setup will be saved into a default file automatically while the dialog is
about to close. Next time, when the dialog is open, the setup saved in the default file will be
imported automatically.
9
Channel Measurement(ChMeas)
The results of channel measurement including:
1)
Digital channel:
Channel Power, CNR, Lock Status, SR Offset, Frequency Offset, Interleaver Mode, MSE, BER,
Uncorrected TS Packets Count;
2)
Analog channel:
Video Carrier Level, Audio Carrier Level, AV Carrier Level Ratio, Video Carrier Offset, AV
Carrier Offset, Adjacent Channel Suppression, HUM, CSO CTB.
For digital channel, after it’s locked, the “TS Analysis” module can be brought up to do protocol
analysis on the demodulated transport stream.
9.1
Settings
1) Channel Setting
a.
User-defined
Select “UserDefCh” in the “ChSel” drop list, input a value in “UserDefCh” textbox below
as the channel’s center frequency.
Unit: MHz
17
AV5462
Range: [44, 906]
Decimal digits: Up to 3
b.
To select from channel-table
The “ChSel” drop list contains all the channels from channel-table, click any channel item
to set it as current channel.
c.
Quick Input
Use the number key to select the channel in the drop list. For example, “1” represents
standard channel “DS1:52.5” and “101” for the supplemental channel “Z1:115.0”.
Note: A three digits number with “1” at its left end is for supplemental channel selection.
Available only when the default channel-table is used.
2) Roll-off
Use mouse or touch panel to select a roll-off factor for current channel demodulation from
follows:
a.
12%( For J.83B & 256QAM)
b.
13%(For J.83C)
c.
15%(For J.83A)
d.
18%(For J.83B & 64QAM)
3) Modulation
Use mouse or touch panel to select the modulation type of current channel from follows:
4QAM, 16QAM, 32QAM, 64QAM, 128QAM, 256QAM.
4) Composite Triple Beat(CTB) Measurement
The instrument provides two methods of reference channel setting for CTB measurement:
a.
Self Mode
Use
current channel as the reference. During tip “<! To turn off ch carrier.!>” show, the
current channel carrier should be turn off.
b.
Another Channel
To select another channel from the “CTBMeas” drop list as the reference, which should
be blank.
Only available to analog channel.
5) Noise Reference Point Setting
18
AV5462
Use mouse or touch panel to select the setting mode from follows:
a. Auto
Fnoise = Fch + BWch
Fnoise: The frequency of noise reference point
Fch: The center frequency of current channel
BWch: The bandwidth of current channel
b. Manual
To set the noise reference point in the “NoiseFreq” textbox and press the “Enter”/”OK”
key to commit it.
Unit: MHz
Range: [1, 2200]
Decimal digits: Up to 3
6) Symbol Rate(SR)
Used to set the SR for current channel demodulation.
Unit: MBaud
Range: (0,6.875)
Decimal digits: Up to 3
7) Constellation Display Points(ConstPts)
To set the maximum points displayed in constellation display area.
Range: [1000,5000]
9.2
Measurement
Press “ChMeas’ button down to start channel measurement. To stop current measurement, press this button
again.
Double click in constellation display area to zoom in or out the display.
10
10.1
Channel Spectrum Sweep(ChSpect)
Settings
1)
Center frequency
i.e. the center Frequency of current channel.
2)
Span
a)
Set in “Span” textbox (MHz);
19
AV5462
Or
b)
To change the span with up/down arrow keys at a 8MHz step when the cursor is in channel
spectrum display area.
10.2
To Sweep
Press “ChSpect” button to start channel spectrum sweep, to stop it, just press the button again.
Move the cursor into channel spectrum display area and double click it to zoom in the display or zoom
out it, left click the mouse in this area or press left/right arrow keys to view the information of each
measured point.
11
Input Gain Select(InputGain)
Amplify or attenuate the DVB-C RF signal to a proper level range before it is fed into demodulation
module.
12
Reference Level Select(RefLevel)
The reference level is shared by channel scan, channel spectrum sweep and tilt measurement.
To achieve a better performance, the reference level should be set above the maximum level
detected
with 5-10dB margin.
13
Setup Save/Load
Left click “SaveSetup” button to open a pop-up dialog, input a character string as the name of file to
save the setup and then click the ”Save” button to confirm it.
Left click “LoadSetup” button to open a pop-up dialog, select the file to load and then click
the ”Open” button to import the setup in this file.
14
Results Save/Load
Left click “SaveResults” button to open a pop-up dialog, input a character string as the name of file to
save the measurement results and then click the ”Save” button to confirm it.
Left click “LoadResults” button to open a pop-up dialog, select the file to load and then click
the ”Open” button to import the measurement results in this file.
Section 6 DVB-S RF Demodulation and Measurement
1
Connection
AV5462
As below:
AV5462 数字电视综合测试仪
DVB-S RF Signal
20
电
AV5462
Figure 2-11 Connection for DVB-S RF Demodulation and Measurement
2
Screen Layout
As shown in figure 2-12, the screen of DVB-S RF demodulation and measurement can be divided into
control panel, channel edit and scan panel, channel spectrum display area, constellation display area, lock
status display area and key parameters measurement results display area.
Figure 2-12 Screen of DVB-S RF Test and Measurement
3
Channel Edit and Scan
To build a channel-table, save it into a specified file, download any valid channel in the table into control
panel or do channel scan.
3.1 Center Frequency
Two ways provided to set center frequency:
1) Down Link Frequency(DL)+Local Oscillator Frequency(LO)
In this mode, the LO should be set at first and then is the DL.
a. LO Select
Left click a LO cell, select the LO frequency from the pop-up drop list.
21
AV5462
Unit: MHz
b. DL Set
Double click a DL cell to enter editing state, input a number and press “Enter”/”OK” key to
commit. If the value is valid, the center frequency will be updated according to LO.
Unit: MHz
Range: [3000,4200] @ LO 5150
[3020,4220] @ LO 5170
[1170,12900] @ LO 10750
2) Direct Mode
Double click a Center Frequency cell to enter editing state, input a number and press
“Enter”/”OK” to commit. If the value is valid, the input will be accepted and the DL is updated
automatically.
Unit: MHz
Range: [950, 2150]MHz
3.2
Symbol Rate(SR)
Double click a SR cell to enter editing state, input a number and press “Enter”/”OK” key to commit.
Unit: MBaud
Range: [1, 45]
Decimal digits: Up to 3
3.3
Save Channel-table
Left click “SaveChTbl” button to open a pop-up dialog, input a character string as the name of file to
save the channel-table and then click the ”Save” button to confirm.
3.4
Open Channel-table
Left click “OpenChTbl” button to open a pop-up dialog, select a file to load and click the “Open”
button to import the channel table from this file.
3.5 Channel Scan
Left click “ChScan” button to start channel scan, the level at each channel’s center frequency will be
measured and displayed in the table.
Level Unit: dBuV
3.6
Parameters Download
22
AV5462
Left click “Download” button at the right of a row, in which a channel’s parameters reside, to
download this channel into the control panel.
4
Channel Measurement
The measurement results contains Channel Power, CNR, SR Offset, Frequency Offset, Code Rate,
BER and Uncorrected TS Packets Count.
After the channel is locked, TS module can be brought up to do the TS analysis on current stream
demodulated.
4.1
Settings
1)
Center Frequency and Symbol Rate
Two methods provided to set center frequency and symbol rate respectively.
a.
Auto
Download from channel table;
b.
Manual
Refer to channel edit.
2)
Noise Reference Point Setting
To set the noise reference frequency in the “NoiseFreq” textbox and press the “Enter”/”OK”
key to commit.
Unit: MHz
Range: [1, 2200]
Decimal digits: Up to 3
3)
Constellation Display Points(ConstPts)
To set the maximum points displayed in constellation display area.
Range: [100,1000]
4.2
Measurement
Press “ChMeas" button down to start channel measurement. To stop it, just press this button again.
Double click in constellation display area to zoom in/out the display.
5
Channel Spectrum Sweep(ChSpect)
5.1
Settings
1)
Center Frequency
i.e. the center Frequency of current channel.
23
AV5462
3)
Span
The span is determined by the center frequency of current channel and its symbol rate.
BWch = SR×1.35
Fstart = Fc - BWch /2
Fend = Fc + BWch /2
BWch: the bandwidth of current channel
Fstart: the start frequency of sweep
Fend: the end frequency of sweep
Fc: the center frequency of current channel
a)
Set in “Span” textbox (MHz);
Or
b)
To change the span with up/down arrow keys at a BWch step when the cursor is in channel
spectrum display area.
5.2 To Sweep
Press “ChSpect” button to start channel spectrum sweep, to stop it, just press the button again.
Move the cursor into channel spectrum display area and double click it to zoom in the display or zoom
out it, left click the mouse in this area or press left/right arrow keys to view the information of each
measured point.
6
Input Gain Select(InputGain)
Amplify or attenuate the DVB-S RF signal to a proper level range before it is fed into demodulation
module.
7
Reference Level Select(RefLevel)
The reference level is shared by channel scan, channel spectrum sweep and tilt measurement.
To achieve a better performance, the reference level should be set above the maximum level
detected
with 5-10dB margin.
8
Setup Save/Load
Left click “SaveSetup” button to open a pop-up dialog, input a character string as the name of file to
save the setup and then click the ”Save” button to confirm it.
Left click “LoadSetup” button to open a pop-up dialog, select the file to load and then click
the ”Open” button to import the setup in this file.
24
AV5462
9
Results Save/Load
Left click “SaveResults” button to open a pop-up dialog, input a character string as the name of file to
save the measurement results and then click the ”Save” button to confirm it.
Left click “LoadResults” button to open a pop-up dialog, select the file to load and then click
the ”Open” button to import the measurement results in this file.
Section 7 DMB-TH RF Demodulation and Measurement
1
Connection
As below:
AV5462
AV5462 数字电视综合测试仪
DMB-TH RF Signal
电
Figure 2-13 Connection for DMB-TH RF Demodulation and Measurement
2
Screen Layout
As shown in figure 2-14, the screen of DMB-TH RF demodulation and measurement can be divided into
control panel, channel scan display area, channel spectrum display area, lock status display area and key
parameters measurement results display area.
25
AV5462
Figure 2-14 Screen of DMB-TH RF Demodulation and Measurement
3
Channels Edit(ChEdit)
Left click “ChEdit” button to open the pop-up dialog for channel edit, to add a new channel, the
channel’s center frequency, demodulation and decoding parameters should be set.
4
Channels Import(ChImport)
Left click “ImportChTbl” button to open a pop-up dialog, select the file to load and then click
the ”Open” button to import the channel table in this file.
5
5.1
Channel Scan
Span
Use mouse or touch panel to select the span from follows: Full Span, 10MHz, 30MHz, 100MHz,
300MHz. The center frequency of scan is the current channel’s center frequency, which is ignored in
full span.
5.2
Scan
Left clicks the “ChScan” button to start channel scan, the level at each channel’s center frequency will
be measured and displayed in the graph to assist in distinguishing between valid channels and invalid
ones, digital channel or analog one. Click this button again will stop the scan. After moving the cursor
26
AV5462
into its display area, the marker can be moved by arrow keys to view the level at each channel’s center
frequency. To zoom it in or out, just double click in its display area.
6
Auto Measurement(AutoMeas)
Measure every channel in current channel table with their parameters set in the table.
A pop-up window of the results table will display when the measurement is done.
7
Channel Measurement(ChMeas)
The measurement results contains Channel Power, CNR, SNR, Error Block Ratio. If it is in auto operation
mode, Carrier Mode, Demodulation, PN, Interleaver Mode and Code Rate will be detected automatically.
As soon as the channel is full locked, the TS module can be brought up to do the TS analysis on
stream
decoded.
7.1
Settings
1)
Operation Mode(OperMode)
a. Auto
In this mode, step 2)to 6)will be ignored, the parameters related is to be detected
automatically in channel measurement process.
b. Manual
In this mode, step 2)to 6)will be set appropriately,refer all valid sets to 《GB20600-2006
Framing structure, channel coding and modulation for digital television terrestrial
broadcasting system》.
2)
Carrier Mode
Use mouse or touch panel to select the carrier mode from follows: Single Carrier, Multi-Carrier.
3)
Modulation
User mouse or touch panel to select the modulation type from follows: 4QAM-NR, 4QAM,
16QAM, 32QAM, 64QAM.
4)
Frame Header Mode(FrameHeader)
User mouse or touch panel to select the frame header mode from follows: PN420, PN595,
PN945.
5)
Interleaver Mode
Use mouse or touch panel to select the interleaver mode from follows: M=240, M=720.
6)
Code Rate
27
AV5462
Use mouse or touch panel to select the code rate from follows: 0.4, 0.6, 0.8.
7)
Channel Setting
a. User-defined
Select “UserDefCh” in the “ChSel” drop list, input a value in “UserDefCh” textbox below
as the channel’s center frequency.
Unit: MHz
Range: [44, 906]
Decimal digits: Up to 3
b. To select from channel-table
The “ChSel” drop list contains all the channels from channel-table, click any channel item
to set it as current channel.
8)
Noise Reference Point Setting
Two methods provided to set noise reference point as below:
a. Auto
Fnoise = Fch + BWch
Fnoise: The frequency of noise reference point
Fch: The center frequency of current channel
BWch: The bandwidth of current channel
b. Manual
To set the noise reference frequency in the “NoiseFreq” textbox and press the
“Enter”/”OK” key to commit it.
Unit: MHz
Range: [1, 2200]
Decimal digits: Up to 3
7.2
Measurement
Press “ChMeas’ button down to start channel measurement. To stop it, press this button again.
8
8.1
Channel Spectrum Sweep(ChSpect)
Settings
1)
Center frequency
i.e. the center Frequency of current channel.
28
AV5462
2)
Span
a)
Set in “Span” textbox (MHz);
Or
b)
To change the span with up/down arrow keys at a 8MHz step when the cursor is in channel
spectrum display area.
8.2 To Sweep
Press “ChSpect” button to start channel spectrum sweep, to stop it, just press the button again.
Move the cursor into channel spectrum display area and double click it to zoom in the display or zoom
out it, left click the mouse in this area or press left/right arrow keys to view the information of each
measured point.
9
Input Gain Select(InputGain)
Amplify or attenuate the DVB-C RF signal to a proper level range before it is fed into demodulation
module.
10
Reference Level Select(RefLevel)
The reference level is shared by channel scan, channel spectrum sweep and tilt measurement.
To achieve a better performance, the reference level should be set above the maximum level detected
with 5-10dB margin.
11
Setup Save/Load
Left click “SaveSetup” button to open a pop-up dialog, input a character string as the name of file to save
the setup and then click the ”Save” button to confirm it.
Left click “LoadSetup” button to open a pop-up dialog, select the file to load and then click the ”Open”
button to import the setup in this file.
12
Results Save/Load
Left click “SaveResults” button to open a pop-up dialog, input a character string as the name of file to save
the measurement results and then click the ”Save” button to confirm it.
Left click “LoadResults” button to open a pop-up dialog, select the file to load and then click the ”Open”
button to import the measurement results in this file.
Section 8 TS Analysis
1
Connection
The connection for transport stream(TS) real-time analysis is shown in Figure 2-15. To monitoring the TS
29
AV5462
demodulated, decoded from DTV RF input, the “Internal TS” item in “Set“ menu should be selected, while
select the “External TS” item to analyze TS input directly from outside.
AV5462
TS Output
AV5462 数字电视综合测试仪
TS Input
DTV RF Input
电
Figure 2-15 Connection for TS Real-Time Analysis
2
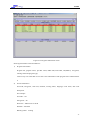
Screen Layout
The main window of TS analysis is shown as below:
Figure 2-16 Main Window of TS Analysis
3
Analysis of Live TS
To analyze the live TS input from outside or demodulated from the DTV RF input.
4
Analysis of Offline TS
To analyze the TS data saved in disk, it’s helpful to review the TS content and locate errors.
30
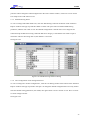
AV5462
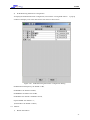
1)
As shown below, use mouse or touch panel to right click the row whose “Device Type” is “File”,
select the “Select Offline File” item in the popup menu to open the dialog for “Select Offline
File”.
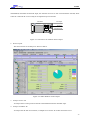
Figure 2-17 Streams Status Window
2)
Select the file to analyze and then click the “Start” button.
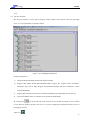
Figure 2-18 Dialog for “Select Offline File”
Note:
5
5.1
a)
If TS recorded with timestamp, “Timestamp” item must be selected.
b)
Make sure the packet length select is in compliance with the TS recorded.
c)
Usually, the file recorded is of a short time, so the “Auto Repeat” item should be selected.
Analysis Modules
Streams Status
As shown in figure 2-17, each row in the table represents a stream’s status, which is indicated by icons
with different colors, green for normal, red for abnormal and yellow for unknown.
The “On/Off” switch on the right is used to enable TS analysis or disable it.
When the initialization of TS analysis is done, the background of the row in which the TS reside will
turn to a brighter color, double click the row to open the window of monitoring as shown in Figure
31
AV5462
2-16.
5.2
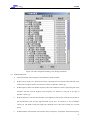
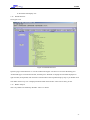
TS Tree Structure
The TS tree structure is on the left of transport stream analysis main window, click the solid right
arrow on its right border to expand as below:
Figure 2-19 TS Multiplexed Structure
Showing information:
1)
Transport Stream Identifier(TS ID) and program number;
2)
Program Map Table Packet Identifier(PMT PID), program ID, program name, elementary
stream(ES) type and its PID, Program Clock Reference(PCR) PID and (entitlement control
message)ECM PID;
3)
Program Specific Information/Service Information(PSI/SI) type, PSI/SI PID and its table_id;
4)
Unreferenced PID, which is contained in current TS but unidentified.
icon at the left side of the TS tree one of its branch will open or close. If there
By clicking the
is more than one program stream in the TS, it is very easy to display the information about any one of
the program streams.
Video icon
,
32
AV5462
Audio icon
Data icon
,
,
PCR PID icon
,
ECM PID icon
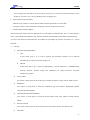
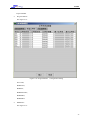
5.3 Basic Information
See Figure 2-20.
Showing information:
1)
Bitrate
Bitrate of Transport Stream
Package Length: Identifying 188/204 bytes TS package;
Current Value: Current transport stream bitrate (Mbps);
Average Value: Average transport stream bitrate (Mbps);
Max. Value: Maximum transport stream bitrate (Mbps);
Min. Value: Minimum transport stream bitrate (Mbps).
2)
TS Bitrate pie chart displaying whole bitrate components with one hundred percent occupation.
Video with cyan show
Audio with blue show
PSI/SI tables with powder show
Null package with white show
Others with yellow show
3)
TS Basic Information
TS ID: A unique number to identify the TS.
PID number: The number of PIDs contained in current TS.
Program number: The number of programs carried in current TS.
Network ID: The unique number to identify the delivery system.
Network name: The name of the delivery system.
Original Network ID: The unique number to identify the originating delivery system.
33
AV5462
Figure 2-20 Basic Information of TS
5.4
Program Information
The program information window contains all of the program information that is contained in a
transport stream. Click the "Program" tab to display detailed information in the "Program
Information" window below:
34
AV5462
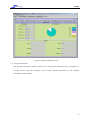
Figure 2-21 Programs Information of TS
Showing information can be divided into:
1)
Program information
Program ID, program name, provider name, PMT PID, PCR PID, rate(Mbit/s), encryption,
running status and program type;
Click on any row in the table to view the events information of the program in the window below
it.
2)
Events information
Event ID, encryption, start time, duration, running status, language, event name, and event
description.
For example:
Event ID:101
Encryption:No
Start time:2008/12/23 19:30:00
Duration:00:30:00
Running status:running
35
AV5462
Language:eng
Event name:Dialogue
Event description:The brief recommendation of program
5.5
Packeted Elementary Stream(PES) Information
See Figure 2-22.
Figure 2-22 PES Information of TS
Showing information:
1)
PES Basic Information
PES PID: To identify the packets assigned to the PES;
Type: PES type;
Service ID: The ID of service this PES belongs to;
Packets: Current number of PES packets received;
Bandwidth(%): The occupation of PES packets in current TS;
Rate(Mbit/s): The bit rate of data used to carry the PES;
Left click any row in the table to view the PES header information in the south window below.
2)
PES Header Information
36
AV5462
PID: To identify the packets to carry the PES;
Program Number: The ID of program this PES belongs to;
PacketStartCodePrefix: 0x000001, used to identify the start of PES packet;
Stream ID: The ID used to identify the stream type;
Packet Length: To specify the number of bytes in the PES packet following the last byte of the field.
“variable length” is only used to video elementary stream because its length is not
fixed;
Scramble Ctrl: To indicate the scrambling mode of the PES packet payload;
Priority Flag: To indicate the priority of the payload in this PES packet;
Align Ind.: To indicate that the PES packet header is immediately followed by the video start code or
audio syncword indicated in the data_stream_alignment_descriptor if this descriptor is
present;
Copyright: To indicate whether the payload contained in the PES is protected by copyright or not;
Original: To indicate PES packet payload is an original or a copy.
5.6
PSI/SI Information
See Figure 2-23.
37
AV5462
Figure 2-23 PSI/SI of TS
Showing Information:
Type:
PSI(such as PAT, PMT, CAT, TSDT); SI(such as BAT, DIT, EIT, NIT, RST, SDT, SIT, ST,
TDT and TOT);
PID: The PID assigned to PSI/SI;
Table ID : Identification number of PSI or SI table;
Packets: The current total number of packets received with a PID and Table ID;
Bitrate (Mbit/s): The transport bit rate of the a PID and TableID.
5.7
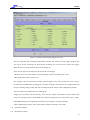
TR 101 290 Error Monitoring
According to ETSI TR 101 290 standard of error monitoring for DVB for detection of cable, satellite, and
terrestrial delivery systems of an MPEG-2 transport stream, and evaluation of its quality in transportation.
Three error priorities, including 27 errors, are defined by the standard for monitoring MPEG-2/PSI,
DVB/SI and PCR.
1)
First priority: basic error monitoring which must ensure the proper decode of a transport stream.
2)
Second priority: Continuous or periodic monitoring of transport stream, mostly of PCR (Program
Clock Reference).
3)
Third priority: application dependant monitoring used in some applications such as DVB/SI to
ensure service information which is passed to end user.
See Figure 2-24.
38
AV5462
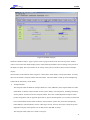
Figure 2-24 TR101 290 Error Monitoring Window
5.7.1
Error Statistics
The Error Statistics report is displayed in a first priority, second priority and third priority window. Every
error includes three parts: error name, choice box, and counter. The error counter has three colors, which
are:
•
The green means no error;
•
The red means error;
•
The yellow means an error in that "error name category" but the system is unable to define an exact
counter number.
The error counter begins counting with the first error found and continues until the transport stream is shut
off. To clear the error report count within a particular transport stream, right-click on the transport stream
ID (in the Transport stream tree window) and a pop-up window will open displaying all three priorities.
You may clear each error count individually.
5.7.2
Monitoring Errors Selection
The user can enable any one of 27 errors in three priorities. The default is all 27 errors selected. When the
user wants to change the default setting, press the “ChangeTesting” button in the window (the three
39
AV5462
priorities will be changed to white backgrounds in the errors statistic window). Click one or more choice
box and press the “OK” button to exit.
5.7.3
PID Monitoring Select
To view or change individual "PID" tests, click the “PID Testing” button at the bottom of the "Statistics
Report" window and a pop-up "PID Test Table" window will open. Select each desired PID testing
parameter, and then click “OK” to exit. The default configuration is that all of the error categories are
selected except the PID error testing. When the PID error category is selected the user needs to input a
maximum value for the testing interval, the default is 5.0 second.
See Figure 2-25.
Figure 2-25 PID Monitoring Selection Dialog
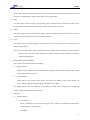
5.7.4
The Configuration of TS Testing Parameters
To view or change the "TS Test configuration", click the "TS Testing" button at the bottom of the "Statistics
Report" window and a pop-up window will open. To change the default configuration the user only need to
enter the desired testing parameters (Attr Value) into right column. Click “Commit” to exit. Press "Cancel"
to cancel changes and exit.
See Figure 2-26.
40
AV5462
Figure 2-26 The Configuration Dialog of TS Testing Parameters
5.8
PCR Measurement
1)
The measurement of the Program Clock Reference (PCR) includes :
•
PCR Accuracy (PCR_AC): The PCR Accuracy is the difference of real PCR value and PCR value
carried in the transport stream. Its tolerance is 500 ns in ISO/IEC 13818-1[1].
•
PCR Frequency Offset: The PCR Frequency Offset is the difference of the original program clock
frequency and the received program clock frequency. Its tolerance is 810 Hz or 30 ppm in
ISO/IEC 13818-1[1].
•
PCR Overall Jitter: The PCR Overall Jitter is the difference between the real PCR arrival time (at
the measurement point and the supposed PCR arrival time. Its tolerance is 25s in ISO/IEC
13818-1[1]. The PCR overall jitter (PCR_OJ) should be zero if the value of PCR_AC is inside
500 ns.
•
PCR Drift Rate: The PCR drift rate measures the low frequency component of the PCR frequency
41
AV5462
offset (the high frequency component is measured by PCR overall jitter). Its tolerance is 75
mHz/s@27MHz or 10 ppm/hour.
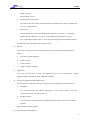
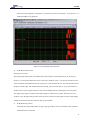
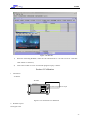
Figure 2-27 PCR Measurement Window
2)
PCR Measurement Chart:
See Figure 2-27 above.
The PCR measurement chart is divided to three sub-windows, which display PCR_AC, PCR_FO,
PCR_OJ . In each sub-window the X-axis is the time coordinate (unit = one second), and the Y-axis is
value coordinate. The measurement unit of PCR_AC is the nanosecond (ns). The measurement unit of
PCR_FO is Hertz (Hz). The measurement unit of PCR_OJ is microsecond (s). Every sub-window is
divided into two parts, upper and lower. The vertical middle point on each display is the zero point.
The upper half is positive and the lower half is negative. There are two yellow limit lines in every
window, one in the upper half (positive limit) and one in the lower half (negative limit). Each display
should be centered on the zero reference line in each window.
3)
PCR Monitoring Choice
Left click the "Select PID" button to open a pop-up window with a list of PID's, select a PID of
which the PCR is to monitor.
42
AV5462
4)
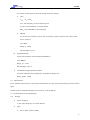
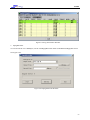
PCR Monitoring Parameters Configuration
To display the PCR Measurement Configuration, left click the "Config PCR" button.
A pop-up
window will display a list of the PCR names and values to choose from.
Figure 2-28 PCR Monitoring Parameters Configuration Dialog
PCRDemarcationFrequency: the default is 1Hz;
PCRFOMax: the default is 810Hz;
PCRDRMax: the default is 0.075Hz;
PCROJMax: the default is 0.000025 second;
ExpectedTSID: the default is –1;
{PCRACMax: the default is 500ns}
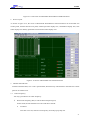
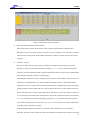
5.9 Biterate
1)
Bitrate Information
43
AV5462
The "Bitrate" information window displays all program PID's, bit rates, and bandwidth
percentages, including a graph of bandwidth percentage in the right hand column of the display.
The "Value" column displays the bit rate for the selected PID. The "Percentage" column displays
the percentage total of the selected PID of the total, and the "%Bar" displays a graphic
representation of the preceding "Percentage" column.
See Figure 2-29:
Figure 2-29 Bitrate
2)
Bitrate
Window
Configuration
Left clicking the "Config Bitrate " button on the bottom of the "Bitrate Information" window will open
the Bitrate Configuration window. TS bit rate, Service bit rate, and PID bit rate can be accessed via
this window. Below are five parameters you need to know well before attempting configuration.
Tau, Width of time slice, the default is 0.100000001second;
N, Number of time slice, the default is 10;
Element, Measurement unit, the default is packet;
Min, minimum bit rate, the default is 0 MHz;
Max, maximum bit rate, the default is 65535 MHz。
44
AV5462
•
TS Bitrate:
See Figure 2-30:
Figure 2-30 TS Bitrate Configuration Dialog
TSBitRateTau;
TSBitRateN;
TSBitRateElement;
TSBitRateMin;
TSBitRateMax;
AllServiceBitRateTau;
AllServiceBitRateN;
AllServiceBitRateElement;
AllPIDBitRateTau;
AllPIDBitRateN;
AllPIDBitRateElement;
45
AV5462
ExpectedTSID.
•
Program Bitrate :
See Figure 2-31:
Figure 2-31 Program Bitrate
Configuration Dialog
ServiceID;
BitRateTau;
BitRateN;
BitRateElement;
BitRateMin;
BitRateMax.
•
PIDBitrate:
See Figure 2-31:
46
AV5462
Figure 2-32 PID Bitrate
Configuration Dialog
PID;
BitRateTau;
BitRateN;
BitRateElement;
BitRateMin;
BitRateMax.
5.10
TS Recording
Two different methods provided to record the TS:
1.Recording trigger by time
2.Recording trigger by events
47
AV5462
Figure 2-33 TS Recording Selection
5.10.1
Recording trigger by time
This function allows the user to delay recording time (Recording starts After). The time entered here is the
current time which is compared to the time of the actual beginning of the recording. The user can select the
timestamp during the recording which aids the offline analysis.
The time trigger is the user’s first choice in most situations. To operate, drag the recording size slider to
change file size, set delay time, check the timestamp option, then click “OK” button below to start
recording.
See Figure 2-34:
48
AV5462
Figure 2-34 Dialog of Recording Trigger by Time
5.10.2
Recording trigger by events
Some errors will appear more frequently than others prompting the need for further analysis. By
selecting an event trigger the user will be able to record these specific error events.
See
Figure:2-35:
49
AV5462
Figure 2-35 Dialog of Recording Trigger by Events
The user clicks the “TS recording configuration” window and selects the event trigger. Drag the file
size icon to set the recording size. Drag the Pre-recording icon to set the time of the event trigger.
When an error occurs the analyzer will start recording TS.
There are two types of recording start points for the event trigger.
1.When an error occurs the analyzer starts recording the TS. Pre-recording time is zero.
2.Recording starts before errors occurs.
For example: with the advanced recording slider dragged to the 50% position the errors will be
recorded in the middle of the recording file. In another example, if the file size has 10,000 packets and
the pre-recording setting is 50%, then the recording start point will be at the 5,000 packets position.
The time stamp can be added into the recording file.
Trigger by event allows all three priority errors and any logical combination of these (AND, OR)
errors, for example: the user checks PMT errors and PCR repetition errors, then selects Logic “AND”.
When PMT and PCR error happen at the same time, the analyzer will start recording.
After completing the settings, click “OK” button, then the recording is now ready.
5.11
Grammar Analysis
5.11.1 TS Packets Capture
50
AV5462
See Figure 2-36:
Figure 2-36 Grammar Analyze Configuration Dialog
First, select the "PID Type" and then select the "Number of Packets to Capture and Analyze” in the current
transport stream.
Most PID choices are PSI/SI tables which have only one PID number. If the selected packet type is a
PES_PKT basic stream, then there are many kinds of PID numbers: video PID, audio PID and other data
PID of different types. To determine which one is a video PID, audio PID, or data PID, the TS multiplex
structure tree on left side of the main window needs to be checked (Example: If the PES_PKT type and
PID=600 are selected, then the selected program is a video of program ID=4161 [CCTV 1]).
After selecting your choices, click the “Capture” button. There is a visual display graph that allows you to
see the progress of capturing packets. When the green bar graph completes a small popup window with the
caption "Finished" is displayed. Click the “Analyze” button to enter the "Packet Structure Window" for
grammar analysis.
5.11.2
Expanded Packet of Transport Stream
Clicking the “Analyze” button enters the "Grammar Analysis" window.
51
AV5462
Figure 2-37 Grammar Analysis Window
1)
Bit Value Table of Transport Stream Packet
The top half of the window shows the bit value of packets captured. Each single packet is
displayed as one row of Bytes (188 bytes) expressed as hex (Example: 0x47 and 0xA9). Drag the
slide bar at the bottom of the "Packet Byte Value Table" window to see the whole content of the
188 bytes.
2)
Grammar Analysis
When one of the "Selected" check boxes is checked in the upper window the lower window
displays an analysis in the TS bit value table. Clicking ‘+’ or ‘+/-’ above each of the Grammar
Analysis" cells will expand the head of packet and payload. There are three colors to differentiate
head of packet, payload and null (or stuffing bytes).
Expanding the "Grammar Analysis" display reveals four rows of information. The first row is the
field name. In DVB standard, every field is defined including field name, field length and the
signification of the bit value which are at the head of the packet, PSI/SI table carrying in payload,
packet elementary stream (PES) and so on. The second row shows the content field (such as 0x0
which is PID=0x0 (hex) or PID=0 (decimalization)). The third row shows the length of field such
as 13, which expresses thirteen bits. The fourth row shows the combination location of field such
as 1.11-13 which means the start bit beginning in first byte (1.), the field located from eleventh
bit to twenty-third bit which occupy 13 bits (.11-13). It is very easy to locate a PID in data packet
according to the combination location.
Drag the slide bar under the window to see all fields. If the field name is not completely
displayed, drag the column divider bars above the field name and between the columns to enlarge
52
AV5462
or shrink the field display size.
5.12
PSI/SI Structure
See Figure 2-38:
Figure 2-38 PSI/SI Structure
Open the page “PsiSi Structure” to see the window like Figure 2-38 above. First select the PID type in
“Select PID Type” list located in the left, and then press “Refresh” to display the info table displayed in
right window (unexpanded). The structure of whole table will be expanded step by step as you double click
each table name. Every row is displayed with the field name and hex value such as table_id: 0x0.
5.13
Buffer Analysis
The every buffers are defined by ISO/IEC 13818-1 in detail.
53
AV5462
Figure 2-39 Buffer Analysis
When the “Buffer Analysis” page is opened, select a program ID from the list at the top of the window.
After a few seconds each buffer display (blue) will be filled by dark blue color according to the percent of
the buffer occupied. The exact amount can be clearly seen by the size number shown under each buffer
display.
These buffers are divided into three categories: video buffers, audio buffers, and system buffers. In reality
there are two buffers: transport buffers and main buffers. The main buffer is made up of the multiplexing
buffer and the elementary stream buffer.
1)
Transport Buffer:
The transport buffer includes the transport buffer for video (TBVideo), the transport buffers for audio
(TBAudio0~n) and the transport buffer for the system (TBsys). The TS packets, including elementary
stream packets, are delivered to the transport buffers. These also include duplicate transport stream
packets and packets with no payload. Bytes that are part of the PES packet or its contents are delivered
to the main buffer B for the audio elementary stream and the system data, and to the multiplexing
buffer MB for video elementary streams. Other bytes are not, and may be used to control the system.
Duplicate transport stream packets are not delivered to TB, MB, or TBsys.
The transport buffer (TB) size is fixed at 512 bytes.
54
AV5462
2)
The main Buffer:
The main buffer is used for the audio buffer and system buffer. For ISO/IEC 13818-7 ADTS audio, the
audio buffer size is defined as follows.
Number of Channels
Buffer Size(bytes)
1-2
3584
3-8
8976
9-12
12804
13-48
51216
For other audio, the buffer size is 3584 bytes. The system buffer (Bsys) is used to put system data. Its
size is 1536 bytes.
3)
Multiplexing Buffer:
The multiplexing buffer (MB) is only used in the video elementary stream. If there is a PES payload
packet in MB buffer and when the elementary stream buffer (EB) is not full, the PES packet is
delivered to multiplexing buffer (MB). But if the elementary stream buffer (EB) is full the PES packet
in transport buffer (TB) is not moved. When the last byte in some PES payload is moved from the
multiplexing buffer (MB) and delivered to the elementary stream buffer (EB), all the bytes of the PES
header in the multiplexing buffer are moved and discarded.
4)
Elementary Stream Buffer:
The elementary stream buffer is only used for video (EBVideo).
5.14
Decode
The decode module is provided for playing the program without encryption.
See Figure 2-40.
55
AV5462
Figure 2-40 Decode
1)
Select the “Decoding Enabled”, make sure the “Stream Sent to:” set with “127.0.0.1” and click
“OK” button to confirm it;
2)
Click “Start” button in a row in which the program to play is shown.
Section 9 Calibration
1
Connection
As below:
AV5462
AV5462 数字电视综合测试仪
Calibration Signal Source Input
电
Figure 2-41 Connection for Calibration
2
Window Layout
See Figure 2-42:
56
AV5462
Figure 2-42 Calibration Window
3
Calibration Operation
3.1 Auto Calibrating
Select the “Auto Calibrating” item in the “To Cablibrate” drop list and click the “Start” button to start
it, the messages of calibration progress will be displayed in the left window.
3.2 Individual Calibrating
Select one calibrating item in the “To Cablibrate” drop list other than “Auto Calibrating” or “Reset”,
then click the “Start” button to start it.
3.3 Reset
Select this item in the “To Cablibrate” drop list and click the “Start” button to reset calibration data to
original.
Section 10 Others Operation
1
1.1
Menu
File
1)
Open
57
AV5462
To select the file for offline TS analysis.
2)
File Download
To download the measurement setup and results from AV5462 Analyzer through Ethernet.
3)
Print
To print current screen.
4)
Exit
To stop measurement process and close the main window.
1.2
Set
1)
Internal 10MHz Reference Clock
Select this item to take the internal 10MHz clock as the reference clock of mixer module.
2)
External 10MHz Reference Clock
Select this item to take the 10MHz clock input from outside as the reference clock of mixer
module.
3)
50Ω RF Input
If characteristic impedance of the RF input cable is 50Ω, this item should be selected.
4)
75Ω RF Input
If characteristic impedance of the RF input cable is 70Ω and the 75Ω/50Ω converter is used, this
item should be selected.
5)
Internal TS
If the user is to make TS analysis on the TS demodulated and decoded from the RF input, select
this item.
6)
External TS
If the user is to make TS analysis on the TS from outside input directly, select this item.
7)
Channel Scan Configuration
To configure the thresholds used in channel scan as described in Section 5 Clause 6.1 for DVB-C
demodulation and measurement module.
8)
TS Background Color Configuration
Click this item to open a pop-up window to configure the background color of TS table.
1.3
Language
Selected by the analyzer automatically.
58
AV5462
1.4 Calibration
As described in Section 9.
1.5
Help
1)
Content
Click it to open the User’s Manual.
2)
About
Click it to check the instrument brief information.
2
To load the setup automatically
When the application is about to exit, a small pop-up dialog will open to prompt the user to set current
setup loaded automatically at next startup or not.
3
Log Lock
Click the “Log Lock” button at the bottom of the main window of TS Analysis to stop refreshing Error Log,
Click it again to restart the refreshing.
This function is helpful to view the error log without stop analyzing process.
4
TrapView
TrapView is a tool provided to review the Error Log recorded.
4.1 Click the “TrapViewer” icon on the desktop to bring up the operation dialog as below:
Figure 2-43 Configuration Dialog of TrapView
4.2
Select the date of the log to view, click “Display” button to open the Log Information Window as
below:
59
AV5462
Figure 2-44 Log Information Window
5
Mpeg2Recorder
To record a TS file over 100Mbytes, use the tool Mpeg2Recorder under %InstallRoot%\Mpeg2Server\bin.
See Figure 2-45:
Figure 2-45 Mpeg2Recorder Window
60
Part 2 Technologies
Part 2 Technologies
48
AV5462
Chapter 3 Specifications and Fundamentals
Section 1 Specifications
AV5462A/B
AV5462
Spectrum Analysis
Frequency
Range
1MHz~1000MHz
Resolution of setting
1kHz
Span
0Hz(zero span)
0Hz(zero span)
10KHz~999MHz
10KHz~2199MHz
1MHz~2200MHz
Reference frequency
Accuracy
±0.5×10⁻⁶
Temperature effect
±2×10⁻⁶(0℃~50℃)
Sweep Time & Mode
Sweep Time
auto
Mode
single, cont.
RBW
1KHz~3MHz in 1-3-10 sequence
VBW
10Hz~1MHz in 1-3-10 sequence
Phase noise
typ.﹤-90dBc/Hz @10KHz
Input attenuation
Range
0dB~50dB
0dB~50dB
Step
10dB
10dB
Frequency range
1MHz~1000MHz
1MHz~2200MHz
Gain
14dB
Noise factor
typ.4dB
Maximum level input
137dBµV
Internal amplifier
137dBµV
48
Chapter 3 Specifications and Fundamentals
order typ.>+125dBµV
Three
intermodulation (TOI)
Intercept Point
<-116dBm (5MHz ~1.6GHz)
<-116dBm
Average noise level
(No input signal, no
<-110dBm (1.6GHz~2.2GHz)
input attenuation, span
20KHz, RBW 1KHz)
Harmonics
2nd harmonics
﹤-70dBc
TOI
﹤-70dBc
Residual Response
﹤-80dBm
Level
Logarithm scale
80dB(10dB/div)
40dB(5dB/div)
16dB(2dB/div)
8dB(1dB/div)
Linear scale
8 divs
Unit
dBm, dBmv, dBµV, µV, mV, µW
Resolution of display
0.1dB
Detecting model
sample, positive max, negative max, average
Range
-100dBm~+20dBm
Accuracy
typ.±1.5dB@25±5℃
CATV Measurement
Channel setting mode
select from channel-table or user-defined
Standard
PAL
Level range
20dBµV~127dBµV
Accuracy
carrier
of
V/A ±1kHz
frequency
offset
Accuracy of the ratio
±1dB(SNR>30dB)
of V/A carrier level
Accuracy
carrier
of
video
±1KHz
frequency
offset
CNR
>60dB, resolution 0.1dB
Prev. adjacent channel
>60dB, resolution 0.1dB
carrier suppression
50
Chapter 3 Specifications and Fundamentals
Next adjacent channel >60dB, resolution 0.1dB
carrier suppression
Composite
Second
>60dB, resolution 0.1dB
order
Interference(CSO)
Composite
Triple
>60dB, resolution 0.1dB
Beat(CTB)
HUM
resolution 0.01%
Tilt measurement
up to 20 measurement points
DVB-C
Modulation
Mode
4/16/32/64/128/256QAM
ITU-T J.83 Annex A,B&C DOCSIS, EuroDOCSIS
Constellation display
4/16/32/64/128/256QAM, zoom in/out
Equalizer
auto
Digital channel power
measurement
Range
30dBµV~140dBµV
Resolution
0.1dB
Accuracy
typ.±1.0dB@(25±5℃,C/N>20dB)
Modulation error
MER range
22dB~40dB
MER resolution
typ.±0.5dB
22dB~30dB
typ.±1.0dB
30dB~35dB
typ.±1.5dB
35dB~40dB
EVM
0.65﹪~4.1﹪
BER
0~1.0×10⁻⁸
BER statistics
accumulative
SR
1~7MS/s
QAM analysis
(Amplitude
0~10.0%
Imbalance)AI
(Quadrature Error)QE
0~15 o
(Phase Jitter)PJ
0~1.85o
(System
Target
0~0.01
Error)STE
51
Chapter 3 Specifications and Fundamentals
Target 0~0.01
(Residual
Error)RTE
DVB-S
Frequency range
1MHz~2200MHz
Frequency resolution
1KHz
Channel set
user-defined
Channel
power
measurement
Range
30dBµV ~ 120dBµV(at
8MHz
BW)
Resolution
±0.1dB
Accuracy
typ.±1.0dB@(25±5℃)
Modulation
QPSK
Constellation display
QPSK
SR offset range
±960ppm
Frequency offset range
±12﹪×SR
Code rate
1/2, 2/3, 3/4, 5/6, 7/8, auto detect
CNR measurement
√
BER measurement
√
Uncorrected
√
packet
ratio measurement
DMB-TH
Frequency range
1MHz~1000MHz
Frequency resolution
1KHz
Channel set
select
from
channel-table
or
user-defined
Carrier mode
single-carrier, multi-carrier
auto detect
Modulation
4, 4-NR, 16, 32, 64QAM
auto detect
Frame header mode
PN420, PN595, PN945
auto detect
Code rate
0.4, 0.6, 0.8
auto detect
Interleaver mode
240, 720
auto detect
52
Chapter 3 Specifications and Fundamentals
Channel
power
measurement
Range
30dBµV~120dBµV
Resolution
±0.1dB
Accuracy
typ.±1.0dB@(25±5℃)
CNR measurement
√
SNR measurement
√
Uncorrected
√
block
ratio measurement
Transport Stream Analysis
Only available to AV5462A
√
TS monitoring
TS tree structure
To display multiplexed TS structure in a tree
Basic information
Contains the brief statistics information of current transport stream
Program information
Contains all of the program information that is carried in a transport
stream and events information for each program
PES information
Contains the brief information of each PES carried in a transport stream.
PSI/SI information
Contains the brief information of all PSI/SI carried in a transport stream.
TR101 290
Error monitoring according to ETSI TR101 290
PCR measurement
PCR-AC, PCR-FO and PCR-OJ measurement in compliance with TR101
290
Bitrate
Bite rate statistics
PSI/SI structure
To display PSI/SI information in a tree structure
TS output
ASI, BNC, 75Ω
TS(External) Analysis
Interface
ASI, BNC, 75Ω
Bitrate
1~56Mbps
Packet length
188B/204B, auto detect
Video/Audio
monitoring
Video
Displayed on the screen
Audio
Fed to speaker
Front Panel
RF input
Interface
BNC
Impedance
50Ω
VSWR
typ.<1.5
N
TS input/output
53
Chapter 3 Specifications and Fundamentals
Only available to AV5462A
√
Identify
packet length auto detect
Interface
BNC
Impedance
75Ω
Input devices
Keyboard
and
touch panel, mini keyboard
mouse(KM)
USB interfaces
1xUSB2.0
Side Panel
Speaker
1 stereo speaker each side
Rear Panel
Calibration output
Frequency
480MHz
Level
-20dBm±0.5dB@25℃
Internal
reference
clock
Frequency
10MHz
Accuracy
±0.5ppm
VGA
RS 232
9pin D-SUB
Ethernet
2x100Mbps
USB
2x, ver.2.0
PS/2
shared by mouse and keyboard
SPI
25pin D-SUB
Power inlet
220V±10﹪,50Hz
Others
Operating
0℃~+40℃
0℃~+40℃
temperature
Storage temperature
-20℃~+60℃
Dimension(L×W×H)
520×390×202(mm)
Weight
10Kg
LCD
8.4 inches, 1024ⅹ768 pixels, TFT
12Kg
54
Chapter 3 Specifications and Fundamentals
Section 2 Fundamentals
The block diagram below shows how the instrument works.
RF Signal
Amp
Attenu
ator
IF Process
Log. Amp.
Mixer
LO
Demod.
TS Analysis
Program
Play
Detector
Disp.
Keyboard&
TouchPanel
CPU
Module
Remote Control
Power Supply
Figure 3-1 Block Diagram of AV5462
The attenuator at the input of the instrument adjusts the level of the measurement signal to the
level range that the mixer can handle without overdriving it. With the input from LO(local
oscillator), the mixer converts the RF input to IF signal. After the amplification, IF process and
55
Chapter 3 Specifications and Fundamentals
logarithmic amplification, the IF signal is fed into the detector, then the detecting value is read
and display on the screen.
Another path of input RF signal comes to the demodulation module. After demodulation and
decoding, the signal is converted a ASI standard format, which is put into the next module to do
TS analysis. With the information from TS analysis, the program without encryption is ready for
playing.
The CPU module takes charge of controlling all the modules connected with it through buses.
Any desktop computer can remote control the analyzer with the help of VNC through ethernet.
56
Part 3 Maintenance
Part 3 Maintenance
54
Chapter 4 Maintenance and Troubleshooting
Chapter 4 Maintenance and Troubleshooting
Section 1 Maintenance
1
Maintenance
As a precision instrument, please follow the operating process strictly in operating. The shell should be
keep clean from tiny substances to get inside. Keep a good draught is also necessary in operating and a
cover of certain cloth to protect it from dust is needed.
The connectors on the front panel and the rear panel should be masked to keep them clean because the
measurement accuracy will suffer from dirty interfaces.
2
Power Supply and ESD Requirements
Refer the details to Chapter 1.
Caution:Make sure the instrument is grounded before it is powered.
Use the power socket with ground terminal and well grounded.
a
If autotransformer is used, please make sure its common end is connected
to the ground terminal of power plug.
Section 2 Troubleshooting
1
1.1
Troubleshooting
Black Screen
Checking flow:
a) To check if the power cord is correctly connected or not and whether the power supply is in
compliance with requirement in Table 1-1;
b) Make sure the power switch on the rear panel is turnned on;
c) To check if there is a beep sound in one minute after the power button is pressed on the front
panel;
d) To check the fan is working or not
If all the checks above passed, it’s may be the main board’ s fault;
If the fan is not work, maybe the power module has some problem;
If there is beep sound heard as c) described, the LCD may be damaged
56
Chapter 3 Specifications and Fundamentals
1.2
Exceptions
If some exception occurs, the following steps will be helpful to isolate the problem:
a) If there are some external devices connected with this instrument, please make sure all the
connections are correct;
b) Deal with the frequent problems with successful solutions applied before;
c) Review the operations before the exception occur to make sure all the settings is right;
d) To check all the test and measurements completed or not and the measurement results in
compliance with the specification or not.
Table 4-1 Phenomena and Causes Maybe
Phenomenon
To check
Level
To check whether the 10MHz reference clock is shared or not;
measurement
To check whether the reference level is set correctly or not;
error is out of
To check whether the DTV input signal is accordant with the measurement
range.
module selected.
To check whether the LO signal at 0Hz is right or not;
No signal
The
To check whether the signal is blurred or not in narrow RBW mode.
signal’s
amplitude
detected is not
correct.
Increase the input attenuation to check whether the signal is suppressed or
not;
Recalibrate it, refer the details to section 9 in part 1.
The setting value
The value input is committed only after the “Enter”/”OK” key is pressed.;
is not changed.
The value input is invalid because it’s out of range.
The
indicating
icon for offline
TS
analysis
doesn’t
green.
1.3
turn
To check the “Device Name” item in ”Streams Table”, if it is “ts.unknown”
always, then the previous setting doesn’t work, please try it again;
Otherwise, to make sure the file format is right set and the “Auto Repeat” is
selected.
Hardware Faults
If the analyzer works abnormally even after the steps described above having been done, it may be the
hardware fault. We don’t recommend the user to unpack the instrument to repair it on himself/herself
because of the complexity of its circuits inside, especially during the warranty period. Instead, contact us at
first time and we’ll assist you to resolve the problem in time.
56
Chapter 3 Specifications and Fundamentals
2
Return to Factory
When some severe problem happens and cannot be solved with telephone assistance, we recommend you
sending the instrument back to factory with the cautions below:
a) Deliver it with a detailed description of the fault phenomenon;
b) Pack the instrument with ESD plastic bag to prevent damage from electrostatic discharge;
c) To put the instrument into a outer package padded with foam cushion;
d) Seal the outer package with adhesive tape and make sure it is bundled firmly;
e) Put some caution mark such as “Frangible” on the package;
f)
To deliver it on precision instrument standard;
g) Reserve the delivering bill.
!
Caution:Don’t use other cushion material such as polystyrene globule in shipment
because it will get into the instrument easily and causes some damage.
57