1
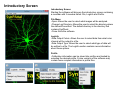
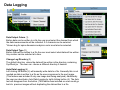
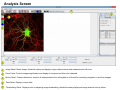
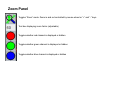
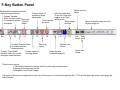
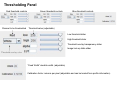
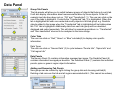
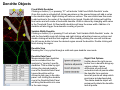
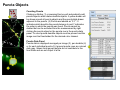
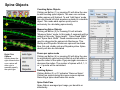
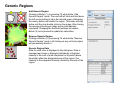
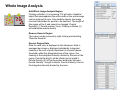
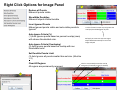
SynPAnal User Manual
Eric Danielson and Sang H. Lee
Medical College of Wisconsin
Installation Instructions
Make sure the most recent version of JAVA is installed and is functioning. Unzip the SynPAnal_Installation.zip file
into a new directory. A SynPAnal.jar file and directories “ext” and “profiles” should be created. Double click the
SynPAnal.jar file to run the software.
Software Overview
SynPAnal is designed to aid the quantification of puncta from within the dendrites of neurons.
The steps of image analysis are as follows:
1) The user starts the software and opens all images to be analyzed. All images should be stored in the
same directory and should be 8-bit RBG color TIFF files. SynPAnal can open 16-bit images but will
convert them to 8-bit images.
2) The user should choose what data should be written, where the data should be written and from
what color the data should be collected.
3) The user should then set the desired threshold. Once the threshold is set it will be saved and
reloaded. The current threshold setting will be applied to all subsequent opened images unless the
images have been thresholded previously, in which case the saved threshold will be loaded.
4) The user will then choose what regions will be analyzed by drawing either dendrite objects or
general region objects onto the image. Puncta will automatically be quantified within the dendrite
objects. Undesired puncta can be “removed” by right-clicking the puncta to clean up any errors.
5) The user then proceeds to the next image, All region information is saved automatically, all data is
written automatically and the current setting are applied to the next image (unless already analyzed).
6)The user continues in this fashion until all images are analyzed. Following analysis, data is copied
and pasted from the data text files and into excel for further analysis.
Introductory Screen
Introductory Screen
Starting the software will bring up the introductory screen containing
a menubar with 3 menubar items: File, LogInfo and Profile.
File Menu
-Open: Allows the user to select what images will be analyzed.
-Change Log Directory: Allows the user to select the directory where
the data will be written. The default directory is the directory that
contains SynPAnal.
-Close: Exits the software.
LogInfo
-Data Output Colors: Allows the user to select data from what color
channel will be output to a file.
-Data Output Type: Allows the user to select what type of data will
be written to a file. The LogInfo section contains more information
about these options.
Profile
-Calibration information can be stored into profiles and loaded by
selecting the desired profile. Future versions of the software may
contain more complex information in profile files.
Data Logging
1
2
Data Output Colors (1)
Before data can be written to a file the user must select the channel from which
the data measurements will be collected. 0-3 channels can be selected.
*Known bug for spine dimension analysis a color must also be selected.
3
Data Output Type (2)
Before Data will be written to a file the user must select what data will be written.
Any number can be selected at a time.
Change Log Directory (3)
The default directory where the data will be written is the directory containing
SynPAnal.jar . The user can choose a different directory if desired.
Auto Data Logging (4)
Left clicking the Button (4) will manually write data to a file. Generally this is not
needed as data is written to a file as the user progresses to the next image.
(This feature was included if only one image was being analyzed). Additionally
the user can deactivate Auto Data Logging by right clicking button (4). The Auto
text will disappear from the button. (This feature was included so users could go
back to previous images without duplicating the data written to a file.
4
Analysis Screen
3
4
1
2
5
1
2
Image Panel: Draws image, threshold overlay and displays region objects where data measurements will occur
3
Button Panel: Contains buttons for creation of measurement tools, writing data to a file and for controling navigation to and from images
4
Data Panel: Displays current data
5
Thresholding Panel: Displays tools for adjusting image thresholding, threshold overlay display and image channel look up tables
Zoom Panel: Controls image magnification and display of red green and blue color channels
Zoom Panel
Toggles “Zoom” mode. Zoom in and out controlled by mouse wheel or “+” and “-” keys
Text box displaying zoom factor (adjustable)
Toggles whether red channel is displayed or hidden
Toggles whether green channel is displayed or hidden
Toggles whether blue channel is displayed or hidden
F-Key Button Panel
Recalculates fluorescent intensity
& puncta measurements
Creates “Variable
Width” dendrite object Removes
for measuring puncta “Generic”
and spines
Object
Esc
F1
F2
F3
F4
Creates “Generic”object
for simple intensity
measurements
Creates “Fixed Width”
Dendrite object for puncta
and spine measurements
Opens previous
image
Creates object for
measuring spine
dimensions
Left click writes data
To text file. Right click
toggles “auto” data
writing mode
Counts puncta
Whole Image
per spine
Analysis
F5
F6
F7
F8
Removes
spines
Creates object for
counting spines
F9
F10
F11 F12
Opens a specific image from the
original image list.
Left Right
arrow arrow
Manual save
button
Hides filename
for blinded analysis
Opens next
Image
These buttons control:
1) The addition/removal of regions used for performing measurements.
2) Saving and writing data to a file
3) Navigation to and from images.
The layout of the buttons is supposed to mimic the F-Key layout on a standard keyboard. Esc, F1-12 and left and right arrows also trigger the
button function
Thresholding Panel
Red threshold controls
Channel to be thresholded
Green threshold controls
Blue threshold controls
Threshold value (adjustable)
Low threshold slider
High threshold slider
Threshold overlay transparency slider
Image look up table slider
Threshold overlay color
“Fixed Width” dendrite width. (adjustable)
Calibration factor: microns per pixel (adjustable and can be loaded from profile information)
Data Panel
1
2
3
5
Group Tab Panels
The tab panels will allow you to switch between groups of objects that belong to each tab.
It will also display information about measurements taken by those objects. In the left
example two tabs have been set up. “Ctrl” and “Transfected” (1). The user can click on the
one of the tabs to highlight it. Currently the “Transfected” tab (1) is highlighted. When this
tab is highlighted the user can create and modify objects in this tab group. e.g. Dendrite
objects added to the image when the “Transfected” tab is highlighted will be hidden when
the “Ctrl” tab is highlighted. Additionally data from each tab group will be calculated,
displayed and output separately. This will allow for separate populations i.e. “Transfected”
and “Non-transfected” neurons to be analyzed in the same image.
Color Tabs
The user can click on “Red”,”Green” or “Blue” sub-tabs(2) to display color specific
information.
6
Data Types
The user can click on “Neuron Data” (3) to cycle between “Puncta Info”, “Spine Info” and
“Cell region Info”
Data Panels
The Neuron Panel (5) contains information averaged per image. The Dendrite Panel (6)
contains information averaged per dendrite. The Individual Panel (7) contains the individual
puncta, spine or generic region object information.
7
Adding and Removing Tab Panels
New groups can be created by right clicking the group tab and choosing add tab(8).
Deleting a tab removes the tab and all regions associated with it. (This cannot be undone)
8
Dendrite Objects
1
Fixed Width Dendrites
Clicking on button (1) or pressing “F1” will activate “Add Fixed Width Dendrite” mode.
Once this mode is activated left clicking anywhere on the opened image will add a vertex
to the dendrite object. Right clicking will remove vertices. The user should use this mode
to add vertices to the center of the dendrite to be traced. Double left clicking will add the
final vertex and will create a fixed width dendrite. Width is altered by changing width value
in the Threshold Panel. All fixed width dendrites will have the same width. Addition of a
dendrite will also trigger the automatic counting of puncta.
2
1
2
Variable Width Dendrite
Clicking on button (2) or pressing F2 will activate “Add Variable Width Dendrite” mode. As
with the fixed width mode left clicking and right clicking will add and remove vertices and
double clicking will add the final segment. After doubling clicking the user will hold down
the left mouse button to trace the desired region around the dendrite. Double clicking will
finish tracing the region.
Dendrite View
Pressing the V key cycles through a solid and open dendrite view mode.
Dendrite Data Panel
Measurements from dendrites
can be excluded from the
analysis by “ignoring” specific
dendrites. This is done by right
clicking the desired dendrite
row in the Dendrite Data Panel.
Ignored dendrites will be
colored a dark grey in the data
panel. Left clicking the dendrite
row in the Dendrite Data Panel
will bring that dendrite into view
in the main image.
Right Click Options
Holding down the right mouse
button over a dendrite brings up
various options. Ignore
all/Restore all puncta will
exclude/include all puncta within
the dendrite from analysis.
Invert all puncta will swap which
puncta are included/excluded.
The delete dendrite object will
permanently delete the dendrite
and all puncta.
Puncta Objects
1
Counting Puncta
Clicking on Button (1) or pressing Esc key will automatically add
puncta objects within drawn dendrite objects. A yellow border will
be drawn around all puncta objects and the puncta lable drawn
adjacent to the puncta. (2) Puncta are labeled as “X.Y”: X
indicates which dendrite the puncta belongs to and Y indiciates
the order in which the puncta was found. Puncta cannot be
deleted but can be excluded from the measurement by right
clicking the puncta object or the puncta row in the puncta data
panel. To count puncta dendrite objects must be present and the
image must be thresholded for the desired color channel.
Puncta Data Panel
Puncta data is displayed averaged per image (3), per dendrite (4)
or for each individual puncta (5). Ignored puncta rows are colored
dark gray. Values from ignored puncta do not contribute to the
final totals and are not output to a file.
2
3
4
5
Spine Objects
1
2
1
2
4
Right Click
Options
Holding down the
right mouse button
over a spine will
allow you to
manually specify
the spine type.
3
4
Counting Spine Objects
Clicking on Button (1) or pressing F5 will allow the user
to add counting spine objects. The user can continue
adding spines until finished. To end “Add Spine” mode
the user should left click anywhere outside of a dendrite
object. This mode adds spines quickly and is
exclusively for calculating spine density
Measuring Spine Objects
Clicking on Button (2) or Pressing F6 will activate
“Measure Spine” mode. In this mode 3 segments will be
added in this order “Spine length”, “Spine Head Width”
and “Spine Neck Width”.These measurements will be
used to categorize the spines into Mushroom, Thin,
Stubby and Filopodia. Mushroom spine will be drawn
blue, thin red, stubby pink and filopodia yellow. Spine
density will also be calculated
Punca per spine mode
Clicking on Button (4) or pressing F8 will allow the user
to automatically remove puncta that do not fall within a
specific radius of the spine. Pgup and pgdn increase or
decrease the radius. The number of spines with 0, 1, 2
or > 3 puncta will be calculated.
Deleting Spines
Clicking Button (3) or F7 activates “Remove Spine”.
Clicking on spines during this more removes spines.
Removing a spine deactivates this mode.
Spine Data Pane
Spine Data is averaged per Image, per dendrite or
individually.
Generic Regions
1
2
Add Generic Region
Clicking on Button (1) or pressing F3 will activate “Add
Generic Region” mode. The user will left click and hold down
the left mouse button to trace the desired region. Releasing
the mouse button will finalize the region. This mode will stay
active until the user double clicks on the image. After tracing,
the average intensity per image will be automatically
calculated. Changing the threshold settings will require
Button (3) to be pressed to update the calculation.
Remove Generic Region
Clicking on Button (2) or pressing F4 will activate “Remove
Generic Region” mode. Left clicking on any cell body object
will permanently delete it.
3
Generic Region Data
Data for each color is displayed in the data pane. Data is
averaged per image or displayed individually. Integrated
intensity is the sum of pixel intensities for all pixels (above
threshold) within the designated area of the region. Ave
intensity is the integrated intensity divided by the area of the
region.
Whole Image Analysis
1
2
Add Whole Image Analysis Region
Clicking on Button (1) or pressing F12 will add a “dendrite”
object that encompasses the entire width so the entire image
can be analyzed at once. Like dendrite objects, the image
must be thresholded for puncta to be detected. The length of
this region will be 0 and cannot be changed. Puncta
Density(A) = Puncta number / Area. Clicking on Button (2)
will recalculate puncta density.
Remove Generic Region
The region can be removed by right clicking and selecting
“Remove Dendrite”
Generic Region Data
Data for each color is displayed in the data pane. Data is
averaged per image or displayed individually. Integrated
intensity is the sum of pixel intensities for all pixels (above
threshold) within the designated area of the region. Ave
intensity is the integrated intensity divided by the area of the
region. Puncta Density(L) will be infinite due to length 0.
Puncta Density (A) is Puncta number divided by the area.
Puncta Intensity / Length is infinite. Puncta Intensity / Area is
the Integrated intensity divided by the area.
Right Click Options for Image Panel
1
Restore all Puncta
Makes all puncta visible.
Show/Hide Dendrites
Makes all objects Visible/Invisible
Invert Ignored Puncta
Makes Ignored puncta visible and sets visible puncta to
Ignored
Auto Ignore Criteria (%)
(1 )Auto Ignores puncta based on percent overlap (area)
with chosen thresholded color.
Auto Ignore Criteria (Overlaping)
(2) Auto Ignores puncta based on overlap with non
thresholded color.
A value of 50 will remove any red puncta that overlaps (thresholded) green by 50%.
Will apply set criteria to each new region object added automatically for each new image analyzed
Set Dendrite Puncta Limit
(3) Auto Ignores all puncta smaller than set size. (Must be
> 4)
Clear All Regions
All regions are permanently removed.
2
3
Check to remove Red puncta that overlap with green (if checked) or blue (if checked)