1
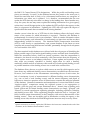
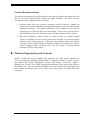
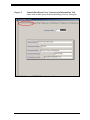
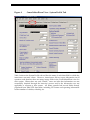
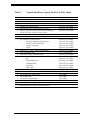
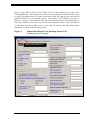
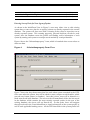
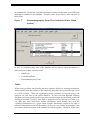
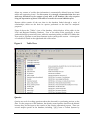
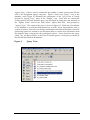
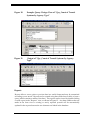
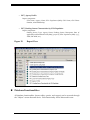
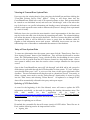
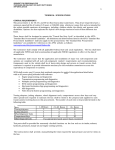
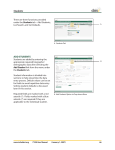
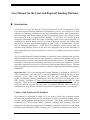
User Manual for the Local and Regional Funding Database
n Introduction
TCRP Report 129: Local and Regional Funding Mechanisms for Public Transportation and the
Local and Regional Funding Database are intended for use by local officials as a basic
reference in examining potential local and regional funding sources, their characteristics,
their advantages and disadvantages, and the considerations that go into efforts to enact
new sources of local or regional transit funding. TCRP Report 129 contains general
descriptive information about the variety of funding sources in five major categories: (1)
traditional tax- and fee-based sources; (2) common business, activity, and related taxes
and fees; (3) revenue streams from projects; (4) new “user” or “market-based” sources;
and (5) financing mechanisms. TCRP Report 129 identifies transit systems that are
currently using funding sources in the first two categories and provides references to
more detailed literature and research efforts on the use of funding sources in the last three
categories.
The Local and Regional Funding Database is a Microsoft Access database that provides
additional detail on traditional local and regional tax- and fee-based funding sources and
common business, activity, and related taxes and fee-based sources. The database is also
intended to encourage users to identify and reach out to other transit agencies to benefit
from their experience in the use of various local and regional funding sources. The data
were developed from interviews with senior officials at approximately 60 transit agencies
nationwide.
Important Note: The Local and Regional Funding Database is available as a ZIP file. To
access the database, users must have a software program for handling ZIP files on their
computer. Users must first download the ZIP file containing the database
(Local_and_Regional_Funding_Database.zip) from the TCRP Report 129 web page on the
TRB website (available at http://trb.org/news/blurb_detail.asp?id=9599) to their
computer. Then, users must extract the database from the ZIP file or “unzip” the file
using the software program that they have for handling ZIP files. Please consult user
information for the particular software being used for instructions on how to unzip files.
Limits of and Updates to the Database
This database is organized in terms of (1) an agency profile that comprises agency
financial and population data and (2) information on local and regional funding sources
for each system, gathered through phone interviews. The agency profile fields such as
Urbanized Area (UZA) name, modes operated, ridership, and operating data were
populated with operating and financial information contained in the most recent (2006)
National Transit Database (NTD) reporting year. Population information was based on
1
the 2000 U.S. Census Bureau UZA designations. While the profile and funding source
pieces are currently “in synch” in the database because they pertain to the same year, it
should be noted that there is likely to be a disconnect between these two categories of
information once either one is updated. It is, therefore, recommended that the user
update the NTD data only when there is a change to the funding data. Stated another way,
every few years, the user may want to update the funding information for a given agency;
at that time, it would be appropriate to also update the NTD profile for that agency so that
there is congruence in information. Updating the NTD data will require the import of
specific tables that match those contained in the existing database.1
Another caveat is that the use of NTD data in this database reflects the largely urban
nature of the systems for which information is reported. Therefore, this database is
predominantly an urbanized transit system database. While it contains information about
several rural systems, such information is based entirely on interviews and has not been
independently verified for accuracy. The American Public Transportation Association
(APTA) could develop a complementary rural system database in the future as more
complete and accurate rural data become available, presumably through the development
of a rural module of the NTD.
The data contained in this database were collected with the sole purpose of identifying the
fullest possible range of local and regional funding sources and their basic characteristics.
While the researchers believe—based on current experience—that the compendium is
exhaustive, the data do not allow statistically valid observations about the frequency of
use of various sources on an industry-wide basis. Future update and expansion of the
data, while not currently scheduled or funded, might allow for more a detailed,
statistically reliable analysis of industry-wide trends in local and regional funding, as well
as possible attention to new funding sources not covered in the current effort.
The database allows the user to explore which sources are used by which agencies and to
learn about any additional funding source characteristics recorded from the interviews.
However, local variations in the circumstances surrounding the use of each source, the
lack of consistency in unit of measurement for different funding source characteristics
(e.g., rate or base of each funding source), and the uneven frequency and depth of
responses to interview questions across all interviewees constrain the analytical potential
of this database. Numerical summation and manipulation of various data fields to create
“apples-to-apples” comparisons among the reported systems is not appropriate or
possible, given the gaps and caveats mentioned above. Instead, data regarding each
transit system and its related funding source characteristics are simply “grouped” and
“filtered” by several agreed-upon organizing principles, including population, ridership,
and funding source used. These organizing principles enable the user to “navigate” the
field of transit system characteristics as they interplay with various characteristics of the
funding sources. There are inevitable gaps in information on either the agency or the
funding source side, which can be filled through future interview and/or survey efforts.
1
Specific instructions on how to update the NTD data in the future are contained at the end of this
document, in the “Database Functionalities” section.
2
Potential Recommendations
The research team and project sponsors believe that periodic updates and expansion of the
data on local and regional transit funding are highly desirable. The effort could be
accomplished in two parallel streams of activity:
1. Systems whose data are currently presented could be asked to update the
information provided, including any significant changes to the local and regional
funding information. The profile information can be updated by the user by
importing new NTD data tables into the database. The process for doing this is
described at the end of this document, in the “Database Functionalities” section.
2. Data from additional systems could be solicited, based on available budget
resources, including the most recent profile data and data on local and regional
funding sources and experiences. Expansion of the database might allow annual
reporting of new funding initiatives enacted around the country that are done by
various interest groups, including APTA and the Center for Transportation
Excellence (CFTE), among others.
n Database Organization and Contents
Similar to Microsoft Access database files generally, the 2000 Access database file
“Local_and_Regional_Funding_Database.mdb” is organized in terms of several “objects”
that support the storage, management, retrieval, and display of the data. Figure 1
illustrates the “Forms” view, which is displayed immediately after a user double-clicks on
the database file. All forms within the database are used for data entry and editing, and
each contains 59 records (each record reflects one transit system for which data were
recorded).
3
Figure 1.
Database Objects: Forms View
Other database objects that are relevant for the Local and Regional Funding Database
include the following:
•
“Tables” for storing the underlying data, some of which are represented in a more
visually friendly format via “Forms”; and
•
“Queries” and “Reports” for analyzing, summarizing, and printing data using
various formats.
Each of these will be discussed in terms of their generic functions, as well as their
application and functionality in the database. It is anticipated that a less advanced user of
Access will find the report functionality to be of most use, as well as that of the forms.
Reports may be viewed by users at all levels, although more advanced abilities in Access
are needed to manipulate reports or to develop reports from scratch based on existing or
new queries and/or data tables. The direct viewing and manipulation of data tables
should be reserved strictly for advanced users, as any changes made to the data tables will
be automatically reflected in the forms and reports. Alteration of any of the tables is
strongly discouraged since the entire database and its outputs are governed by a series of
table linkages. Once these linkages are broken, the ability of the database to be used to
tabulate data across several tables will be impaired.
Forms
Forms allow the user to display and enter data in a familiar format that is similar to fill-inthe-blank. Forms also serve the function of a “switchboard” interface that allows users to
navigate through a series of steps to arrive at the most appropriate data entry screen or
view, given the choice of function(s) that they select to perform. In the case of the Local
4
and Regional Funding Database, users must first open the “InitialForm.” (See Figure 2.)
This form allows the user to view the raw interview/survey data or to input new data.
Figure 2.
InitialForm View
Once launched, the InitialForm asks the user to choose to either (1) view or edit the
existing survey data or (2) enter new survey data for an agency or system that is not
already reported in the database, by selecting one of the two buttons shown.
Viewing and Editing Existing Data
If users choose to view or edit the existing survey data, they are then directed to the
“ConsolidatedForm,” which is the main form in the database, used to enter all interview
responses into a series of data tabs. Each data tab is displayed horizontally at the top of
the form (e.g., “Interview Information” and “System Profile,” followed by several tabs that
contain information on each reported funding source, labeled “Funding Source 1” through
“Funding Source 8”). Figures 3 through 5 illustrate the contents of the ConsolidatedForm.
5
Figure 3.
ConsolidatedForm View: Interviewee Information Tab
(Other Tabs include System Profile and Funding Sources 1 Through 4)
6
Figure 4.
ConsolidatedForm View: System Profile Tab
Table 1 mirrors the System Profile tab and lists the name of each data field for which the
interviewer can enter values. However, interviewees did not report information on all
questions, and therefore there are many empty fields in the ConsolidatedForm view for
each system. Where there are such “blanks,” users can infer that information was not
successfully obtained through the interview process and/or the information was not
applicable or relevant to that system. All urban systems had several fields directly
populated from 2006 NTD data tables, including UZA name and operating information
such as number of vehicles, ridership, etc.
7
Table 1.
ConsolidatedForm: System Profile Tab Data Fields
Data Field Name
Data Source (Year)
•
•
•
•
•
•
City/UZA Name
2-Digit State Code
Service Area (Rural, Small Urban, Urban, Large Urban)
Number of Counties Served
Date Agency Came into Existence (year range)
Agency Type (Municipal/County, Regional Authority,
Private Non-Profit, Private For Profit, Other)
NTD (2006)
NTD (2006)
NTD (2006)
Interview (as of 2006)
Interview (as of 2006)
Interview (as of 2006)
•
•
•
Description of “Other” Agency Type (if applicable)
Single or Multiple Jurisdiction?
Special Market Characteristics?
o Hospital/Institution/Social Service
o Resort/ Tourist Destination
o College/University
o Other
•
•
•
•
Description of “Other” Market Characteristic
UZA Population (2000)
Population Change 1990-2000 (range)
Services Operated
o Bus
o Demand Response
o Commuter Rail
o Light Rail
o Heavy Rail
•
•
•
•
•
•
•
•
Number of Vehicles
Annual Revenue Vehicle Miles
Annual Revenue Vehicle Hours
Annual Ridership
Annual Operating Expenses
Annual Capital Expenses
Farebox Recovery (range)
Recent Major Service Improvement Initiatives
Interview (as of 2006)
Interview (as of 2006)
Interview (as of 2006)
Interview (as of 2006)
Interview (as of 2006)
Interview (as of 2006)
Interview (as of 2006)
Interview (as of 2006)
U.S. Census (2000)
Interview (as of 2006)
Interview (as of 2006)
Interview (as of 2006)
Interview (as of 2006)
Interview (as of 2006)
Interview (as of 2006)
Interview (as of 2006)
NTD (2006)
NTD (2006)
NTD (2006)
NTD (2006)
NTD (2006)
NTD (2006)
NTD (2006)
Interview (as of 2006)
8
Figure 5 and Table 2 show the data fields in each of the funding source tabs of the
ConsolidatedForm. The funding source tabs convey funding source characteristics for up
to eight (8) funding sources for each system; hence, there are eight (8) tabs, each used to
gather information on one funding source. The content of the funding source tabs is
identical. However, the number of tabs with recorded information varies depending on
how many funding sources were reported by each particular system. Most systems had
no more than four (4) funding sources, so the user can expect to see many blank fields,
depending on which system is being viewed.
Figure 5.
ConsolidatedForm View: Funding Source Tab
(Funding Sources 5 Through 8)
9
Table 2.
ConsolidatedForm: Funding Source Tab Data Fields
Data Field Name
Data Source (Year)
•
Interview (as of 2006)
•
•
•
•
Type of Funding Source (Advertising, Contract revenue,
Donations, Employee tax, Gas taxes, General funds, Parking
fees, Property taxes, Revenue anticipation notes, Sales taxes,
Sponsorships, Toll revenue, Urban taxes, Utility taxes, and
Other )
Description or Exact Name of Funding Source
Description of “donation” (if source is a donation)
Description of “other” (if source type is not on list)
If Source Type is a Tax (check box is marked automatically if
source initially selected is a type of tax)
Interview (as of 2006)
Interview (as of 2006)
Interview (as of 2006)
Interview (as of 2006)
•
•
Collection in All Jurisdictions? (yes/no)
Types of Jurisdictions Where Collected (Municipal,
County, Special District, and Other)
Interview (as of 2006)
Interview (as of 2006)
•
•
•
•
•
•
•
•
•
•
•
•
•
•
Description of “other” (if jurisdiction type is not on list)
Base
Rate
Yield
Solely Dedicated to Transit? (yes/no)
Other Uses of Revenue?
Used for Capital Needs? (yes/no)
Types of Capital Projects Covered
Project Limitations
Used for Operating Needs (yes/no)
Annual Operating Expenses
Types of Operating Services Covered
Service Limitations
Act/Policy Basis for Collection (State law, Local statute,
Administrative policy, Other )
Interview (as of 2006)
Interview (as of 2006)
Interview (as of 2006)
Interview (as of 2006)
Interview (as of 2006)
Interview (as of 2006)
Interview (as of 2006)
Interview (as of 2006)
Interview (as of 2006)
Interview (as of 2006)
Interview (as of 2006)
Interview (as of 2006)
Interview (as of 2006)
Interview (as of 2006)
•
•
Description of Act/Policy Basis (if “other”)
Length of Tax Authorization (1 year, 2 years, 3 to 5 years,
6 to 10 years, 11 to 20 years, > 20 years)
Interview (as of 2006)
Interview (as of 2006)
•
•
•
•
•
•
•
•
•
•
•
Date of First Enactment (if source is a tax)
Date of Latest Extension (if source is a tax)
Date of Most Recent Rate Increase (if source is a tax)
Amount of Tax Rate Increase (if source is a tax)
Amount of Yield Increase (if source is a tax)
Bonding Authority? (yes/no)
Debt Limit Amount
Funding Sources Used to Service the Debt
Agency Collecting the Tax
Rationale for Source Selection
Critical Enactment Issues
Interview (as of 2006)
Interview (as of 2006)
Interview (as of 2006)
Interview (as of 2006)
Interview (as of 2006)
Interview (as of 2006)
Interview (as of 2006)
Interview (as of 2006)
Interview (as of 2006)
Interview (as of 2006)
Interview (as of 2006)
10
•
•
•
Interview (as of 2006)
Interview (as of 2006)
Interview (as of 2006)
Advantages of Funding Source
Disadvantages of Funding Source
Additional Comments
Entering Survey Data for New Agency/System
As shown in the InitialForm View in Figure 2, users may either view or edit existing
system data or enter new data for an agency/system not already captured in the current
database. The system will alert users with a warning if they select to input data on an
already reported system. This warning purposely prevents duplicate records for each
system, since the database stores the profile and funding source information of each
system by treating each system as a unique record marked by a unique identifier.
Figure 6 shows the “Selecturbanproperty” form, which is launched when a user selects to
enter new data.
Figure 6.
Selecturbanproperty Form View
Figure 7 shows the drop-down menu that lists each urban system contained in the NTD.
Once users select the system, they will be asked to enter a unique record identifier, which
can take any format (letters or numbers). Once this is done, users will be directed to a
blank new record in the database. The new record will immediately follow the last record
in the database, which contains the most recently reported system (in the case of the
existing database, the viewer will see Record 60). At that point, users will navigate
through each tab in the ConsolidatedForm to input information on the system profile, as
well as each applicable funding source. All the NTD data fields in the system profile will
11
be automatically “preloaded” with the information contained in the most recent NTD data
table that is contained in the database. Therefore, users do not need to enter any data in
those fields.
Figure 7.
Selecturbanproperty Form View (selection of new Urban
System)
By way of a summary then, users of the database will be asked to input information or
make selections in three separate forms:
o
InitialForm
o
ConsolidatedForm
o
Selecturbanproperty Form
Tables
While forms provide a user-friendly and more intuitive display for entering information,
tables actually store the contents of the underlying data that are reported through a form
or a series of forms. Tables are organized by fields (columns) and records (rows), and
comprise the raw data in the entire database. In the Local and Regional Funding
Database, each record within a table represents a transit system and its related profile and
funding source data. Typically, each table is designed to store a discrete set of data (e.g.,
one table may store interviewee contact information, while another may store the
operating characteristics of a given transit system). Information stored in one table is
related to information stored in other table(s), so there is a set of table “relationships” that
govern how different aspects of the database are linked together. Therefore, when users
12
delete any content of a table, that information is automatically deleted from any linked
tables and supporting forms. For this reason, it is strongly recommended that users not
make any alterations to the contents of any table in the database (the only exception
being the importation of future NTD tables to override the current 2006 data year).
Because tables contain all the raw data in the database linked through a series of
relationships, tables are the basis for queries performed on the data for analytical
purposes.
Figure 8 shows the “Tables” view of the database, which displays all the tables in the
Local and Regional Funding Database. Four of the tables relate specifically to data
gathered through system interviews, while the remaining tables are 2006 NTD tables that
were used to populate several data elements in the system profile section. A description
of each table is found on the right-hand side of the screen.
Figure 8.
Table View
Queries
Queries are tools for asking questions about the data and for performing actions on the
data. For the purposes of this database, the already created queries should not be deleted
because they are the input to the creation of the existing customized reports. There are
several sample queries in the database, including “Qry_Count of Transit Systems by
13
Agency Type,” which is used to summarize the number of transit systems that fall into
each of the designated agency categories. Figure 9 shows the “Query” view of the
database, while Figure 10 illustrates the components of the “Qry_Count of Transit
Systems by Agency Type,” query in the “Design” view. Users who are comfortable
creating queries will note that this query was developed by using the count function on
the “Agency Name” field in the Table called “Agency Basic Info” and grouped by
“Agency Type.” The output of the query is shown in Figure 11. While this User Manual
is not intended to provide detailed instructions on basic Access functionalities such as
creation of queries, users who are already comfortable with relational databases and with
performing queries are invited to use this functionality to extract more information from
the database than is reported in the predesigned reports. Users should use the query
called “Qry_All Report Fields” as the basis for further queries, as this query contains all
the relevant data fields in the database.
Figure 9.
Query View
14
Figure 10.
Example Query: Design View of “Qry_Count of Transit
Systems by Agency Type”
Figure 11.
Output of “Qry_Count of Transit Systems by Agency
Type”
Reports
Reports allow a user to print or preview data in a useful format and may be customized
according to user needs. Reports can be created using data fields from a table or from a
query (which contains a subset of the data). The reports can be viewed by double-clicking
on each report in the “Reports” view, as shown in Figure 12. Any data additions that are
made in the form view to existing or newly reported systems will be automatically
updated in the reports because the two elements are linked in the database.
15
It is anticipated that most users of this database will retrieve information primarily, if not
exclusively, through the predesigned reports. As previously noted, the reports do not
reflect statistical or numeric tabulations of the data. Instead, they use agreed-upon
organizing principles to group and filter information on each transit system and its
related funding source characteristics.
This database contains a series of reports containing desired data summaries, including
the following:
o
RPT_Funding Source Type by Agency Transit Services Operated
Report components:
Agency Name, UZA Population (2000), Modes, Estimated Yield (2006) grouped
by Funding Source Type (e.g., Advertising, Contract revenue, etc.)
o
RPT_Funding Source Characteristics by Agency Type
Report components:
Agency Name, Funding Source Type, Source Description, Rate (if applicable)
and Estimated Yield (2006) grouped by Agency Type (e.g., Joint Powers,
Municipal/County, etc.)
o
RPT_Funding Source Characteristics by Agency Number of Vehicles
Report components:
Agency Name, Funding Source Type, Funding Source Description, Rate (if
applicable) and Estimated Yield (2006) grouped by Vehicle Range (e.g., 0–10
Vehicles, 11–20 Vehicles, etc.)
o
RPT_Funding Source Characteristics by Agency Annual Ridership
Report components:
Agency Name, Funding Source Type, Funding Source Description, Rate (if
applicable) and Estimated Yield (2006) grouped by Annual Ridership (e.g., 0–10
Million, 11–20 Million, etc.)
o
RPT_Details by Funding Source Type
Report components:
Agency Name, UZA Population (2000), Funding Source Description, Rate (if
applicable) and Estimated Yield (2006) grouped by Funding Source Type (e.g.,
Advertising, Contract revenue, etc.)
o
RPT_Count of Transit Systems by Agency Type
Report components:
Agency Type, Number of Reported Transit Systems
16
o
RPT_Agency Profile
Report components:
UZA Name, Agency Name, UZA Population (2000), CEO Name, CEO Phone
Number, Annual Ridership
o
RPT_Funding Source Characteristics by UZA Population
Report components:
Funding Source Type, Agency Name, Funding Source Description, Rate (if
applicable) and Estimated Yield (2006) grouped by UZA Population (2000) (e.g.,
<50K, 50K–200K, etc.)
Figure 12.
Report View
n Database Functionalities
All database functionalities (forms, tables, queries, and reports) can be accessed through
the “Objects” screen discussed above. Each functionality will be discussed in turn.
17
Viewing of Current Raw System Data
Users can view the existing data by first going into the InitialForm and then clicking the
“View/Edit Existing Survey Data” button. Doing so will direct them into the
ConsolidatedForm, which has a total of 59 reported systems, to date. Each system should
be viewed as one individual record, and users can “tab through” each of the tabs at the
top of the form to see profile information and funding source information collected and
stored for each reported source under a different tab (Sources 1 through 8 are represented
by a total of 8 tabs).
While the form view provides the most intuitive visual representation of the data, users
can also look at the table view of the data by examining each table. The column headings
will reflect the nature of data stored in that field. However, because the tables are linked
by numerical fields, it will be difficult for users to gauge how the different tables fit
together to link information across each system. Advanced Access users can view the
relationships view of the tables to understand the structure of the database.
Entry of New System Data
To enter new information into the system, users must click the “Enter Survey Data for a
New Agency/System” button of the InitialForm. They will then be directed to another
form—the “Selecturbanproperty” form—which will allow for the adding of a new system
based on a list of systems from the NTD that are located in a drop-down menu. Once a
new system is added, users then also need to select a unique identifier for that system
record.
Once in the ConsolidatedForm, users will “tab through” each field, tab by tab, except for
fields that are preloaded through the NTD data tables for that system. To “save” changes,
users should either press “save” or exit out of the form via the upper right-hand corner
checkbox. The new information will then be saved as a brand new record. Conversely, to
delete a system, users need to use the “Delete Record” functionality of Access by going
into the “Edit” menu, and selecting “Delete Record.” All updates to or changes in the
data will be automatically reflected in the query and report output.
Updating of NTD Data Tables
As noted in the beginning of this User Manual, users will want to update the NTD
information periodically, as the need for updating the funding information arises. The
NTD
data
needed
for
this
application
can
be
found
at
http://www.ntdprogram.gov/ntdprogram/data.htm. Use the link RY_[Year] Database
(Self-Extracting) where Year represents the most recent year available.
The steps for updating are as follows:
Download the executable file that will extract (unzip) all NTD tables. These files are in
Excel, and the following need to be imported into Access:
• Agency_info
18
•
•
•
•
•
Directly_generated_funds
Capital_Use
Operating_expense
Service
Agency_Master
To import into Access, please select File, get external data, import. Select the directory
where the downloaded tables are located and follow the steps in the Import Wizard. The
import process requires doing one table at a time.
Once all tables have been imported, they need to be renamed with exactly the same name
as in the application. This requires adding the suffix “06” to the new tables. This process
will replace the content of the existing tables with the new ones.
Filtering and Analysis of Data through Queries
Sample queries are provided in the database and can be viewed either in “Design” view,
which shows the query-by-example capability of Access, or in the Structured Query
Language (SQL) view (for advanced Access users who are familiar with SQL code and
concepts). All of the tables in the database can be queries but require a strong familiarity
with table field contents and relationships, which are not presumed by most casual users
of the database.
Viewing of Selected Data Summaries through Existing Reports
Reports may be viewed and printed simply by going into the Report View and doubleclicking on one of the sample reports. It is anticipated that this functionality will serve
most “general” users of this database, who have no skills in Access.
The format of the reports will remain static, although the underlying data will change
with any changes to the database records (through the form or table views). Adapting the
report formats requires moderate to advanced Access skills and can be done by going into
the “Design” view of each report and manually selecting different fields, reorganizing the
physical layout of the fields, altering the order of grouped elements, and so forth.
19