1
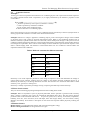
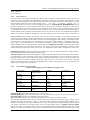
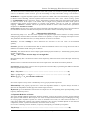
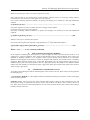
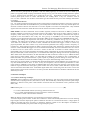
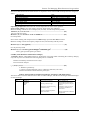
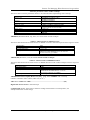
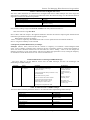
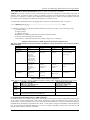
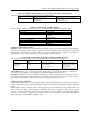
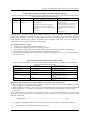
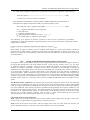
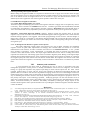
IOSR Journal of Electronics and Communication Engineering (IOSR-JECE) e-ISSN: 2278-2834,p- ISSN: 2278-8735.Volume 9, Issue 2, Ver. V (Mar - Apr. 2014), PP 145-163 www.iosrjournals.org Sensors For Managing Water Resources In Agriculture Venkata Sriharsha Kuncham1,a, Prof Rao N.V2 b 1 2 Departmentof InformationTechnology, Andhra Pradesh, India, Department of Computer science & Engg, Andhra Pradesh, India, Abstract: Most of the agricultural lands in the world depend on rain water. But unfortunately, evoking floods and droughts at irregular intervals of timings and improper occurrence of monsoon winds make the frequency and distribution of rainfall uneven and uncertain. A survey under COMMONSense Net Project (Panchard, 2007) implemented by central and state governments in India revealed that semi arid regions like main parts of Karnataka and some parts of Andhra Pradesh in India are slowly losing the potential of having rain fed agriculture. So the preservation of water and need based irrigation are essential for effective operations and management of water in agriculture. A precise estimate of water requirement can be made at each stage of growth of a crop only through electronic sensors. An irrigation control system uses moisture sensor as a feedback element that takes soil moisture as an input, enabling the system to manage the necessary water flow. In this paper a constructive attempt has been made to introduce the concept of sensors, methodology of their working and different types of sensors that are used for water management. A clear description of sensors, the inherent technology and the evaluation of parameters are presented. In doing so, the desirable characteristics of sensors and their significance have been clearly brought out. This critical review enables a judicious design and usage of sensors in agriculture. Keywords: Dielectric permittivity, Evapotranspiration, Field capacity, Irrigation controllers, Moisture content, soil moisture sensors. I. II. Introduction Sensor is an electronic instrument widely used for measuring any parameter or controlling the mechanism of any system that is under operation. In simple words it is a device which responds to the physical input applied and gives the electrical output that carries information. Automation is quiet essential in any control system, and it is incomplete without sensors. In any irrigation control system sensor plays a vital role in controlling its operations. A closer view of different types of sensors and their role in different fields of research are presented in the following pages. III. Different Types Of Sensors Sensor can be broadly classified into two categories, the one which responds to input signal being physically in touch with object and the other responds to input without being in touch object. The first part of the paper gives a detailed discussion on the sensors that respond to the input being physically in touch with object. 2.1 Displacement /Positional Sensors Strainguage sensor uses resistive element that change its length when force is applied on its mount. (Webster, 2010) Principle: A change in resistance is a function of the change in dimension (size, shape or position) of an object. ∆R/R= (1+2µ) ∆L/ L+ ∆ρ/ρ…………………………….(1) ∆L/L – change in length 2µ∆L/L- area µ is referred as Poisson’s ratio. ∆ρ/ρ -change in resistivity. 2.1.1 Bridge circuits Wheatstone bridge is one type of circuit used to measure the variation in resistance that is converted into electrical output. Assume that all the initial values of resistances of the bridge are equal to R o. ∆Vo= (∆R/Ro)*Vi………………………………………………. .(2) www.iosrjournals.org 145 | Page Sensors For Managing Water Resources In Agriculture Where Vi is the applied input voltage ∆R is the variation in resistance When a resistive type of sensor is connected to one of the arms of the bridge and if there is no variation in the circuit, then the bridge is said to be balanced. Hence If ∆R=0, then the output voltage (∆Vo) will be zero If there is a variation in sensor resistance then that variation will be shown at the output in terms of voltage reading. ∆R≠0 indicates the existence of a Voltage. 2.2 Temperature Sensors Measuring temperature is essential in modern electronic devices, especially in laptops and in other portable devices with densely packed circuits that dissipates power of considerable amount in the form of heat. Temperature sensor is used for battery charging. It prevents damage to microprocessor, particularly for high power equipments that often have fan cooling in order to maintain junction temperature at proper levels. To control the fan properly, we need the knowledge of critical temperatures from appropriate temperature sensor. The most popular sensors are Thermocouple, Thermistor, Semiconductor, RTD (Resistive temperature devices), and Digital output temperature sensors. Especially temperature sensor that produce digital outputs (Omega Engineering, 2011), are more advantageous over analog in remote applications as their readings are more accurate and possess less affinity towards noise effects. 2.2.1 Temperature monitoring in Microprocessors For microprocessors, supply voltage and temperature are essential parameters. In Pentium processors CPU temperature is a critical factor. All Pentium devices have an on chip substrate on which PNP transistor act as sensing element in monitoring actual chip temperature. The technique used to measure temperature is based on the relation between change in base emitter voltage and the temperature. ∆VBE=(kT/q)*ln(N)…………………………………………..(3) ∆VBE – change in base emitter voltage (difference between two base emitter voltages) K-Boltzmann’s constant T –absolute temperature q- Charge of an electron N-number of transistors 2.3 Inductive Sensors These sensors are quiet more attractive in radio telemetry applications. These sensors are not affected with dielectric properties of environment. The word inductance refers the measure of the magnetic field that is stored for a given amount of current flow. Factors affecting inductance are L=µN2A/L…………………………………………………..(4) N- No of turns in a coil µ-permeability of the core material (=µo/µr) µ0 permeability of free space µr relative permeability=1 for air L -Average length of the coil Principle: Energy stored in an inductor is a function of current flowing through it. Corresponding to increase or decrease in current flow through the coil, there will be change in magnetic field strength, and that change in magnetic field strength induces a voltage drop across the output terminal of the coil. This is well known as electromagnetic induction. In case of Self inductance the variations in any of the dimensions in the coil induces the voltage in the same coil. In case of Mutual inductance phenomenon, the variation in dimensions of primary coil induces a voltage in secondary coil. However the induced voltage is detected with the detector and amplifier circuits. Inductive sensors following the Mutual inductance phenomenon is used for measuring the change in dimensions of internal organs (kidney, major blood vessels and left ventricle.) 2.3.1 LVDT (Linear Variable Differential Transformer) is one such inductive type whose output is proportional to the position of movable magnetic core. The core moves (Kesavan, 2006) linearly inside a transformer consisting of primary and two secondary coils wound on cylindrical form. www.iosrjournals.org 146 | Page Sensors For Managing Water Resources In Agriculture 2.3 Capacitive Sensors Principle: In this type of sensors capacitance describes how two conducting objects with a space between them respond to the voltage applied between them. Capacitance (C) is highly influenced by the dielectric properties of the environment. C=εo εr A/d………………………………………………… (5) εo dielectric permittivity of free space (or dielectric constant) εr relative permittivity of dielectric medium A-Area of each of the conducting object d -distance between two conducting objects. In this sensor design we use two electrodes as two conducting objects separated by a distance (d).Capacitance is directly proportional to dielectric constant of the material between them. Principle: Whenever a voltage is applied to conducting objects, positive and negative charges will be induced on each the object. This creates an electrical field between them. When a non conducting medium (acts as dielectric material) is placed between these two electrodes, electric field passes through it .The presence of non conductive material changes the dielectric constant of the material that is placed between the electrodes which in turn changes the capacitance. There will be a little leakage of electric field onto space around the capacitor. This field is called fringing field. The dielectric constant determines how non conductive material affects the capacitance between the conductors. Table1: Dielectric constants for different materials Material Dielectric constant Vacuum 1.0 Air 1.0006 Epoxy 2.5-6.0 PVC 2.8-3.1 Glass 3.7-10.0 Water 80.0 Soil 2-14 Sensitivity is one of the important parameters in the design of capacitive sensor that determines the change in output voltage across capacitor resulting from any change in the distance between conducting objects. It is denoted by k. Sensitivity is set during calibration of sensor. The deviation of k value from ideal value is called sensitivity error, gain error or scaling error. Sensitivity is usually expressed as percentage of slope, comparing the ideal slope with actual slope. 2.5 Piezo electric sensors They are used in measuring physiological displacements and recording heart sounds. Principle: When an asymmetric crystal is physically deformed, electric potential is generated and conversely when a charge is applied to the crystal, the mechanical deformation takes place. The most known physical parameters that can be measured with sensors are pressure, speed, force, velocity, acceleration, temperature, humidity, flow rate, stress and strain, level and depth, mass and weight, density, size and volume, acidity, alkalinity and salinity. Now follows a description on the sensors that respond without physically touching the objects. 2.6 Remote Sensors Remote Sensor is an instrument that measure and record electromagnetic energy. Remote sensing instruments are categorized into two types www.iosrjournals.org 147 | Page Sensors For Managing Water Resources In Agriculture Passive Sensors Active Sensors 2.6.1 Passive Sensors: A passive sensor senses the electromagnetic radiation that is emitted or reflected from an object from source other than Sensor. According to Norman (Bakker, 2004) these sensors do not produce electromagnetic energy on their own; instead depend on the external sources like Sun and sometimes the earth. These sensors cover the electromagnetic spectrum in a wavelength ranging from less than 1 picometer (gamma rays) to greater than 1meter (microwaves). From the irrigation perspective MICROWAVE RADIOMETER is one of the most popular passive sensor instrument that is used in soil moisture estimation in the field. It is also used in mineral exploration, snow and ice detection. This instrument measures the intensity of radiation that is emitted or reflected from the object with in the microwave range (0.1cm to 100cms). The depth from which energy is emitted depends on the properties of the material such as water content in the soil. The recorded electromagnetic radiation is termed as brightness temperature. The other popular passive Sensor that comes in discussion is Aerial Camera which is termed as airborne sensor (a sensor used in aircrafts). Low orbiting satellites and NASA space shuttle Mission use the aerial cameras for accurate navigation. Even Global Navigation Satellite systems (GPS-USA) use the Aerial camera systems to take the photographs of the objects on the earth’s surface at precise points. The navigations are most essential in survey areas where especially topography maps won’t work. These sensors have film that records the electromagnetic radiation in this specified wavelength range (400nm-900nm). The other popular passive remote Sensor is Multispectral Scanner with which observations can be made point by point and line by line manner. The sensors can measure electromagnetic radiation in both visible and infrared spectrum. These sensors can give information about mineral compositions of the soil. Imaging Spectrometer can measure intensity of radiation in very narrow spectral bands (5nm- 10nm).These are used in determining chlorophyll content of surface water. Thermal Scanner measures the electromagnetic radiation that falls within the specified range (8 micro meters to 14micrometers). The wavelength in this range is related to temperature of the soil and hence effects of droughts on agricultural crops can be studied. The major disadvantage in passive remote sensing systems is that they are sensitive to climatic conditions especially when the sky is covered with cloud and the incoming radiation cannot be sensed. To overcome this problem active remote sensing system are in use which allow the signal to pass through cloud, fog and rain. 2.6.2 Active Remote Sensing Systems Table 2: characteristics of Active Remote Sensing Systems characteristics SAR(Synthetic Aperture radar) Altimeter Scatterometer Radiated Power(W) 1500 20 100 Range(km) 695 1344 1145 Viewing Geometry Side looking Nadir looking Six fan beam in azimuth Spectrum width 20-300MHz 320MHz 5-80KHz Service Area Land/coastal/ ocean Ocean/ice Ocean/ice/land Viewing geometry describes the field of view of active sensor Radiated peak power gives either peak power or a range of possible peal powers for each type of active sensor Spectrum width describes the bandwidth of the active sensors Service area characteristic gives the general geographical service area for each active sensor The most distinguishable feature of active sensor is that they provide electromagnetic energy on their own to illuminate the object on the earth’s surface. These sensors also measure the electromagnetic radiation that is emitted or reflected from the object. RADAR is one of the well noted Active Remote Sensing systems which can operate at microwave wavelength range. One of the most popular radar is Synthetic Aperture Radar (Huneycutt, 2000) , It transmits and receives the electromagnetic radiation that fall within the microwave range (1mm to 1m ).The electromagnetic energy that is emitted from sensor can be penetrated into deeper parts in the www.iosrjournals.org 148 | Page Sensors For Managing Water Resources In Agriculture soil mantel and can be reflected from that point. This radar system can be made to operate during daylight as well as in darkness. These sensors give the knowledge of deep and under canopy soil moisture. RADARSAT is a popular Synthetic aperture radar operate at 5 GHZ and is used worldwide in giving response to disasters such as flooding, volcanic eruptions and severe storms. The other active remote sensing system is ALTIMETER transmits microwave pulses and measures round trip delay with which distance from object to sensor is known. If the object is sea surface then its height can be predicted and hence wind speed is estimated. These sensors can be mounted on aircrafts and satellites and can be used for topological mapping. JASON-I is altimeter which can provide the altitude of earth’s ocean surface and is operated at frequencies of 13.6GHz to 5.3GHz. Scatterometers are the active sensors the measure the back scattered radiation in microwave region and derives the information about the wind direction and speed over the earth’s surface with the help of the maps. IV. Characteristics Of Sensors The following study is on how the sensor responds to the physical input when its behavior is steady (without undergoing any transient effects) and when its behavior is dynamic, i.e. keeps on changing with respect to time. The parameters that reflect the static (or steady) behavior of sensor are as follows Accuracy: quantity. Accurate readings in sensor determine the closeness to the true value of the measured Precision: gives the set of measurements that are taken from different sensors over a long interval of time in different environments under same given conditions. Linearity: The relation between sensor output signal and the physical variable (i.e. measurand) typically follow straight line behavior. Y(x)ideal = mx+c where m is the slope of a straight line. But unfortunately this is an ideal case where sensor output may follow the actual value of the input without any deviation. Whenever there is a deviation from actual value of the input sensor will exhibit non linearity behavior. Non linearity (Singh, 2003) in sensors can be expressed as a function M(x) representing the difference between ideal straight line and actual ones. M(x) = Y(x)-mx+c…………………………………………………………………….. (6) Y(x) = ao+a1x+a2x2+……+anxn………………………………… ……………………. (7) Where a0,a1,a2……an are constant coefficients Non linear response of any sensor is modeled by series type polynomial expressions. Monotonicity: This property says that for a sensor the dependent variable i.e. response always increases or decreases as independent variable (physical variable input) increases. Hysteresis: gives the difference between the two outputs for the corresponding same input depending on the trajectory followed by sensor. 3.1 Dynamic Behavior of Sensor The reason behind exhibiting the dynamic behavior (Webster, 1999) is the presence of energy storage elements like capacitors and inductors. Here response of a sensor is analyzed when behavior keeps on changing over time for varying inputs. Dynamic response of a sensor is modeled as zero order, 1st order and second order or nth order linear differential equation with constant coefficients. The way they modeled depends on the electrical components (resistor, capacitor and inductor) used in the sensor circuitry. For a sensor containing resistive elements, its input (x) and output(y) are related by an equation Y(t)=k*x(t)………………………………………………………………………………(8) www.iosrjournals.org 149 | Page Sensors For Managing Water Resources In Agriculture Where k represents gain .This is zero order response of a sensor Zero order response do not contain energy storage element. Because resistor is not energy storage element, potentiometer is one such sensor which gives zero order response . For a sensor containing capacitive elements, its input (x) and output (y) are related by a first order differential equation a1 dy/dt+aoy(t)=x(t)……………………………………………………………………………(9) First order response of a sensor contains capacitor as energy storage element. Capacitive sensor gives first order response. For sensor containing inductive elements, its input(x) and output(y) are related by second order differential equation. a2 d2y/dt2+a1dy/dt+aoy(t)=x(t)………………………………………………………………..(10) Inductive sensor gives second order response. For a sensor showing nth order response is represented by an n th order differential equation andny(t)/dxn+a2d2y(t)/dt2+a1dy(t)/dt+a0y(t)=x(t)……………………………………………..(11) Where a0,a1……….an are constant coefficients V. Role of Sensors in irrigation scheduling In the irrigation scheduling the main objective is when to apply the water to a plant and how much is to be applied (Troy, 2012).To fulfill the above purpose Soil Moisture Sensors were introduced. These sensors are modeled as feedback elements in an irrigation control system through which operations are controlled. Whenever system applies excess amount of water for irrigation than required, soil moisture sensor is called for inspection. When moisture content (θ) is greater than field capacity (θ f), the excess amount will be sent as a feedback signal to the system and controller takes an appropriate action. Here SMS act as a feedback element and the main aim of SMS is to minimize the water supply when plants do not need at that instant. This results in water savings in agriculture. VI. Classification of Soil moisture sensors According to the technologies used for determining the water content in the soil, these sensors are categorized in the following ways 5.1 Tensiometric Methods: it is the simplest and direct method of measuring soil moisture content. This gauge reads soil water potential. Principle: Smaller the pores lower the water potential (more negative value) of water contained in pore and hence greater energy is required for the plant to extract water from the soil. Hence water content in the soil is less. There exists an inverse relationship between the soil water potential and the water content (also called as moisture content) in the soil. www.iosrjournals.org 150 | Page Sensors For Managing Water Resources In Agriculture Table 3: Tensiometer Techniques-Advantages and disadvantages The above table list out the different sensors that use tensiometric methods, and also the advantages and disadvantages of Tensiometric methods. With this information we can know how far this is suitable for scheduling irrigation. Technique Tensiometric Methods Sensors used Tensiometers are available with various lengths with which simultaneous measurements at various depths of the root zone can be obtained. Some are Jet,Quick draw Tensiometer , Electronic, mini etc. advantage Ease of use immediate results can be obtained and Inexpensive. Does not involve electronic circuitry disadvantage Need to keep the tube filled with full of water specially during dry weather frequently. Much skill is not involved in maintenance. Response time is very slow, takes for about 1-3days.operate between 0 to approx 80KPa. Under wet conditions soil matrix potential can be measured with good accuracy Suited for scheduling the irrigation. Well suited to crops that are well watered Needs periodic maintenance and intensive labor can work well only if installed and maintained properly. 5.1.1 Working of Tensiometer Sensor: Tensiometers (Tam, 2006) are normally placed in the soil at a specific depth for measuring soil water potential in the field. When water potential of the soil is low compared with the water potential inside the tensiometer, water moves from tensiometer into the soil creating a vacuum inside the instrument. Now take the pressure reading. We must note that the drier the soil the higher the absolute value of pressure reading. These readings are typically positive and are considered as tension values. As soon as irrigation starts water is withdrawn from the soil by decreasing the vacuum that is created inside the tensiometer. Pressure reading is taken once again . Most of the tensiometers available in the market use a vacuum gauge which can record the readings from 0 to 100KPa (100c bar). Practically they are expected to work at 0 to 75KPa. 5.1.2 Interpreting Readings of Tensiometers The readings (Luke, 2006) reveal the fact that 0 to 10KPa indicate the presence of heavy rain or over irrigation. (near saturation). The reading 10 to 30kPa indicates the field capacity point which says that there is no need of irrigation. The reading 30-50KPa reading indicates that a mild stress is applied over plant. The reading 50-70KPa indicates that soil is getting dry cautions that irrigation to be started. The reading with 70KPa and above indicates the readily available water is below than required for growth. At this stage, air enters into tensiometer and stops its functioning which can be observed in coarse textured soils. 5.1.3 Manufacturers of Tensiometers Delta-T-Devices Ltd: measures soil water potential to an accuracy of ±0.2 over range of +100 to 85KPa Irrometer Company: produce Tensiometers with lengths 15, 30,45,60,90 and 120 cms. Soil Moisture Equipment Corporation came with the Tensiometers of 15, 30,45,60,90,120 and 150 with ceramic cups. Soil Measurement systems came up with producing the instrument with length from 15cm to 183cm, battery operated and with a potential of range -100KPa to -200KPa. 5.2 Resistive Methods: Principle: More water in the soil makes the soil to conduct which indicates low resistance and less water in the soil make the soil to conduct poorly which indicates more resistance. Here Resistance is a function of water content. Problem1: As we know that resistance of a material changes with temperature. Whenever sun rays hits the soil, it gets warm up and hence the resistance changes. This produces the false reading. Problem2: As the basic sensor uses direct current, due to constant flow of current in one direction between the two pieces of metallic probes, etching will takes place which is termed as electrolysis. Due to effect of electrolysis, probes will be eaten away which causes false reading. 5.2.1 Plaster (Gypsum Sensor): www.iosrjournals.org 151 | Page Sensors For Managing Water Resources In Agriculture Follows the above principle but the problem is with the underlying design. It consists of two wires made up of plaster (or Gypsum) sealed in a plug. The material itself gives very poor soil moisture reading. Whenever plaster is dry, it possesses more resistance as we expect but it has very high affinity towards the moisture. As moment plaster probe comes in contact with moisture, the reading shows a very low resistance value. In case of more saturated soil resistance value further gets decreased and this proves that readings obtained are not reliable. 5.2.2 Watermark Sensor: It is one of the Gypsum block sensor that works on the principle of electrical resistance. The sensor consists of a pair of electrodes which are embedded into a porous body and is buried into the soil at any desired depth. The electrical resistance between the electrodes of a sensor depends on moisture and temperature. Only obtained signal is electrical resistance which decreases with an increase in moisture content of soil. SMX module: The above Watermark sensor includes (Systems, 2002)a circuit known as SMX (a product of Irrometer Company) to measure its electrical resistance. The output of this circuit is either voltage or current or frequency whose values vary basing on the value of the résistance. The frequency obtained at the output is expected to start from 50Hz in case of dry soil and goes up to 10,000Hz in case of wet soil This output frequency can be measured by Data logger connected to SMX circuit using COUNT or PERIOD function. The output voltage readings are expected to start from 0.2v under dry conditions and go up to 1v under wet conditions. The output current readings are expected to start from 0.2mA under dry conditions and go up to 1mA under wet conditions. In the above sensor, AM400 Soil moisture Data logger is used to convert any physical parameter like water content to any of the electrical parameters like voltage, current or frequency or resistance etc. These electrical signals are further converted to binary data, analyzed by software and are stored in the PC. These AM400 data loggers can record the data automatically from six watermark sensors at a time in an interval of 8 hrs. (Each sensor can show 5 weeks of data and 10 months of stored readings can be downloaded to PC). From the experiments (Fernandes, 2002) conducted at the Avelar Experimental Campus, in Party do Alferes (RJ) on four erosion plots it is found that after taking the readings of soil water potential using Water mark sensor and Tensiometer, the data obtained from both of them are similar to up to -70KPa but when going slowly towards smaller values, it is found that the readings are not reliable in case of tensiometer. It means that under wet periods tensiometer is quiet capable of producing accurate readings as water mark sensor does. In dry conditions accurate and reliable readings can only be attained through water mark sensor. Observations by (Chard, 2002) revealed the fact that Watermark Sensors model 200SS is more suggestible over any other model like 200 or 253-L or 257-L as they are inexpensive, and can measure potential over a wider range (0 kPa to -200KPa). In the design of 200SS model water mark sensor the openings in the stainless steel mesh are large and numerous which gives greater surface area for soil water contact and hence response time will be faster than 200 model sensor. Watermark digital meter that is used along with this sensor converts the digital output of sensor from resistance to soil water potential. Watermark sensor should be calibrated in the soil which they are used. 5.3 Nuclear Techniques 5.3.1 Neutron Scattering Technique Principle: when a radioactive source emits neutrons with high energy, they travel with greater speed and collide with the nuclei of hydrogen atoms (Josie Chavez, 2012). The moment they collide they lose their speed and get deflected. A detector on the probe counts number of neutrons that are slowed down with a parameter Count Ratio (CR) CR=csoil/cbackground……………………………………………………………………… (12) Csoil count of thermalized neutrons (low energy) detected in the soil Cbackground-count of thermalised (low energy) neutrons in reference medium Soil water content is derived from count ratio. Note: the density of slowed neutrons is proportional to soil moisture content (θ). A Neutron Hydro probe contains 50 mill curie radioactive Americium-241/Beryllium and is used for emitting high energetic neutrons. Hydro probe sphere of influence increases as soil moisture decreases .A large sphere of influence provides high level of accuracy in measuring moisture content in soil. Here Sphere of influence is region of soil measured by the probes which is larger for hydro probes. www.iosrjournals.org 152 | Page Sensors For Managing Water Resources In Agriculture Table 5: Parametric values of Neutron Scattering Technique Technique Neutron scattering Sensors used Camphell advantages disadvantages Robust and Accurate Radiation hazard pacific Large soil sensing volume Large number of measurements can be made at different point with same instrument To be certified whenever this is used Automation is not possible due to safety hazard so only manual readings are possible nuclear Parameter to be measured Reading range value range 0-60% Accuracy Response time Sphere of influence(sphere) Soil type 0.5% 1 to 2minutes 6-16 inches in radius Applied to any soil Field maintenance Salinity effects Cost Not necessary No $10,000-$15,000 The above table list out the parameters that are to be examined while implementing neutron scattering technique. Reading range: Ranges are usually fixed and if it exceeds .it results in permanent damage to the sensor Accuracy in sensor is measured as deviation of a value represented by the sensor to the ideal value. It can be represented in terms of measured value. Response time(s) determines the time taken by the sensor to approach its true output when is subjected to its input. Sphere of Influence: gives the region of soil measured by the probe. Salinity in Soil: determines dissolved salt content in the soil (measured in dS/m) Field Maintenance: field requirements for the equipment to be installed for taking the moisture readings by sing the above technique. 5.3.2 Gamma Ray attenuation Technique Principle: Scattering (Zazueta, 1994) and absorption of gamma rays relates density of matter in their path. The change in density is measured with gamma ray transmission technique. Soil moisture content is determined from density change 5.4 TDR (Time Domain Reflectometry): Mostly widespread technique (Bihelli, 2007) uses dielectric constant of soil water mixture for measuring volumetric moisture content in the soil (θ v). Principle: An electromagnetic wave is sent along the probe which is buried into the soil at a desired depth so that electromagnetic wave is reflected back at the end of the transmission line. The round trip delay (t) is www.iosrjournals.org 153 | Page Sensors For Managing Water Resources In Agriculture measured From travel time analysis εr = (ct/d)2= (ct/2L)2 ………………………………………………………………………………………(13) εr- relative permittivity c- Velocity of electromagnetic wave in a dielectric material (soil-water) Distance travelled to and fro from the probe (d) =2L An Empirical relation established between soil VWC (volumetric water content) and dielectric constant (or dielectric permittivity) by Topps’s is as follows From the topp’s equation ε =-5.3*10-2+2.29*10-2 θ v-5.5*10-4 θ v2+4.3*10-6 θv3………………………….(14) Where ε -dielectric permittivity v - Volumetric water content It can be observed that speed of the reflected pulse is inversely proportional to volumetric moisture content of the soil. The above relationship applies to mineral soils (independent of composition and texture) and for water having volume less than 50%. It depends on the frequency of the electromagnetic wave that is emitted by the device. Especially at low frequencies (<100 MHz), it is more specific. Table 6: Time Domain Reflectometry Technique-Advantages and Disadvantages The above table list out the different sensors that use TDR technique, and also the advantages and disadvantages of TDR technique Technique TDR Sensor Acclima, ESI GroPoint,Aquaflex SE200 Advantage Calibration usually not soil specific Probe configuration depends on sensing depth disadvantage An expensive equipment due to complex electronic circuitry Applicable to only to small sensing volumes Can also measure electrical conductivity simultaneously. Not affected with temperature For soils that are organics or volcanic a specific calibration is required Acclima (Chavez, 2010) sensor besides providing readings of VWC also provides soil temperature and soil bulk electrical conductivity. This sensor communicates with a data logger using SDI-12 interface which is Serial Data interface at 12000 Baud. SDI-12 is an asynchronous serial communication protocol. It is only Acclima that captures and interprets the reflected pulse for determining the travel time of pulse accurately. Table 7: Parametric values of TDR technique The above table list out the parameters that are to be examined while implementing TDR technique Parameter to be measured Reading range Accuracy Response Time Measuring volume Soil type Salinity Effects Field maintenance Safety hazard Cost value 0.05-0.50ft3ft-3(or)5-50% .01ft3ft-3 28sec 1.2 inches in radius around the length of waveguides Not recommended to use in dense, slat or high clay At high levels Not necessary No $400-23,000 . Some TDR sensors (Josi Chavez, 2012) like CS616 and CS655 have limited accuracy due to effect of electrical conductivity and temperature. Aqua Flex Sensor (Instruments, Apr 16, 2003) is one of the most popular sensor based on TDR Technique, has multiple outputs for measuring soil moisture as well as temperature. Table 8: www.iosrjournals.org 154 | Page Sensors For Managing Water Resources In Agriculture The above table determines the characteristics of Aqua Flex sensor used in TDR technique also their ranges are stated Characteristics Operating Temperature measuring temperature Accuracy in soil moisture reading Range of measurement Power supply voltage Measuring time range -10 to 40oc -10oc to +50oc with accuracy of ±0.5oc ±2% 0 to 60% +6V to +26V D.C 0.8sec after power is supplied Operating Temperature determines the critical temperature at which sensor operates. Power supply voltage: gives max supply voltage at which sensor can withstand. Moisture reading in terms of current output (mA) for sand, silt and sandy and silty loams Moisture (θ ) %=3.75*C-15…………………………………………………………… (15) For Clay and Clay loams Moisture ( θ ) %=-14+2.87*C+0.21*C2-0.0086*C3........................................................ (16) For Temperature Note: Sensor reading with output current in 4-20mA range represents 0 to 60% moisture. Moisture reading in terms of Frequency output for sand, silt and sandy and silty loams: Moisture (θ) %= 0.5*(ppm-10)…………………………………………….. ……... …..(17) For clay and clay loams Moisture (θ ) %=-4.9+0.51*ppm+0.0028ppm2-0.0000205*ppm3 …………………….. (18) where ppm represents pulses per minute 5.5 TDT (Time Domain Transmission Technique) Principle: (Harlow, 2003)TDR principle is applied here except that while calculating the round trip delay(t), only one way travel of transmission line along the probe is considered. Distance travelled by transmission line is (d):L. From travel time analysis εr = (ct/d)2= (ct/L)2……………………………………………………………………….(19) εr- Dielectric permittivity C-velocity of electromagnetic wave in a dielectric material (soil-water) Distance travelled to and fro from the probe (d):L. Table 9: Time Domain Transmission Technique–Advantages and disadvantages The above table list out the different sensors that use TDT technique, and also the advantages and disadvantages of TDT technique Technique TDT Sensor TRIME-IT, TRIMEEZ, Digital TDT Advantage Accurate measurements Sensing Volume is large Inexpensive because of having standard circuitry Circuit is simple compared to TDR instruments www.iosrjournals.org disadvantage Due to distortion of electromagnetic pulse during transmission, precision may be reduced. Disturbance in the soil can be there during installation of access tubes Requires permanent installation of equipment 155 | Page Sensors For Managing Water Resources In Agriculture Table-10: parametric values of TDT technique The above table list out the parameters that are to be examined while implementing TDT technique Parameter to be measured Reading range Accuracy Response Time Measuring volume Soil type Salinity Effects Field maintenance Safety hazard Cost value 0.05-0.50ft3ft-3(or)5-50% 0r 7-70% depending on instrument depending on instrument Accuracy 0.05ft3ft-3 28sec Cylinder(.2-1.6gallons) of 2 inches in radius Not recommended to use in dense, organic, salt or high clay(depends on instrument used) At high levels Not necessary No $400-1,300 TRIME-IT (Mittelbach Heidi, Apr, 2012) is a sensor based on TDT technique. Table 11: Characteristics of TIME-IT sensor The above table determines the characteristics of TRIME -IT used in TDT technique also their ranges are stated Characteristics Operating frequency Operating temperature Accuracy Installed up to range 1GHz -15oc to +50oc ±0.01m3/m3 or 1% for 0-0.04m3/m3 and ±0.01m3/m3or1%for 0.40-0.70 m3/m3 in soils with bulk electrical conductivity up to 2dS/m 5-15cms TRIIME-EZ (Mittelbach, 2012) is a sensor based on TDT Technique Table 12: Characteristics of TRIME-EZ Sensor The above table determines the characteristics of TRIME-EZ sensor used in TDT technique also their ranges are Stated Characteristics Operating frequency Operating temperature Accuracy Installed up to range 1GHz -15oc to +50oc ±0.01m3/m3 or 1% for 0-0.04m3/m3 and ±0.01m3/m3or1%for 0.40-0.70 m3/m3 in soils with bulk electrical conductivity up to 2dS/m 110 cms depth TRIME-IT/EZ sensor outputs (RAW TRIME(mV) range from 0-1000mV and is linearly related to volumetric water content (VWCTRIME(m3/m3): VWCTRIME = RAWTRIME /1000………………………………………………………… (20) Digital TDT Sensor based on TDT technique In Digital TDT (Nuffer, 2010) Sensors moisture readings remain stable as soil temperature, soil salinity and fertilizer content change www.iosrjournals.org 156 | Page Sensors For Managing Water Resources In Agriculture Table13: Characteristics of Digital TDT sensor The above table determines the characteristics of Digital TDT used in TDT technique also their ranges are stated/ Power Consumption: An electrical parameter that refers the electrical energy over the time that must be supplied to an sensor to maintain its operation. Characteristics Operating temperature Accuracy Power consumption Range 0.5oc-50oc ±0.01m3/m3 or 1% 3.5mA ideal case 50mA when reading ±2dS/m Conductivity of soil Soil moisture readings range from 0%in air to 100%when fully immersed in water i.e ±1% full scale for range 0-3 dS/m. Note1: Where full scale output is the algebraic difference between the electrical output signals measured with maximum input stimulus and lowest input stimulus applied. Where dS/m represents soil salinity Note 2: It doesn’t require any field maintenance and so can be operated in all environment conditions Note 3: Long term reliability can be obtained 5.6 Frequency Domain Reflectometry Technique Principle: (Munoz, 2012) observed that the variation in frequency of oscillation of electromagnetic field in the soils is related to volumetric water content in the soil. Capacitance sensors are used in this technique in which soil forms a dielectric between the two electrodes of a sensor. Adding water to the soil changes the dielectric permittivity of soil water mixture, which in turn affects the capacitance of soil, causing the frequency of oscillations to shift. Hence these are well known as FDR sensors Table14: FDR Sensors-Advantages and Disadvantages The above table list out the different sensors that use FDR technique, and also the advantages and disadvantages of FDR technique Technique FDR Sensor 10HS,EC-10, EC-20,EC-5 Advantage Easy to set up, log and transmit data i.e. more flexible in probe design compared to TDR Under highly affected salinity conditions in soil, the moment TDR Fails, FDR comes into picture. TDR can measure the moisture content at a specific depth whereas FDR can measure the water content in soil at different depths at same location. disadvantage May not perform well due to variations of soil bulk electrical conductivity and spatial variability of VWC Sensing volume is relatively small Be careful with installation in order to avoid air gaps. Less expensive compared with TDR Table 15: Characteristics of FDR Technique The above table list out the parameters that are to be examined while implementing FDR technique Parameter to be measured Reading range Accuracy Measuring range Affected by salinity value 0 to saturation 0.01ft3ft-3 Sphere(about 1.6 inches effective radius) minimal Field maintenance Soil type not recommended Safety hazard Cost Not necessary none No $100-$3,500 www.iosrjournals.org 157 | Page Sensors For Managing Water Resources In Agriculture 5.6.1: 10HS, EC-5, EC-10, EC-20 Sensors (Devices, 2010) use capacitance Technique. Principle: This sensor consists of a pair of electrodes and soil acts as a dielectric, two electrodes with a soil as dielectric forms a capacitor. When a voltage is applied to capacitor, electric field will be created between the electrodes of a capacitor, capacitor starts charging and discharging, due to which, an electromagnetic field will be created , whose charging time influences the dielectric permittivity of soil. A relation that is defined the effect of charging time of capacitor on permittivity of soil is shown as εr = t / (RA/d log(V-Vf/Vi-Vf)………………………………………………………….(21) εr -dielectric permittivity of soil-water mixture (dielectric permittivity of water is more than that of soil) Vi starting voltage Vf supply voltage V voltage at any time t R-Resistance of conducting material (electrodes) measured in ohms A-Area of each conducting plate (electrodes) t- Time taken to charge the capacitor from starting voltage (V i) to voltage (V) Table16: Characteristics of 10HS, EC-10,EC-20 and EC-5 FDR Sensors The above table summarizes the characteristics of 10HS, EC-10, EC-20 and EC-5 sensors that are used in FDR Technique characteristics Measurement time Operating temperature Measurement range Accuracy Power consumption 10HS 10ms 0-50oc EC-10 10ms 0 to 50oc EC-20 10ms 0 to 50oc EC-5 0-57% VWC(independ ent of soil texture and salinity effects) Large sensing volume(more % of VWC can be measured) ±3% in mineral soils with electrical conductivity<1 0dS/m ±2.5 3V D.C@12mA15V D.C@15mA 0 to 40%VWC O to 40%VWC Up to saturation(depends on soil type) ±4% with electrical conductivity< 0.5dS/m ±4% with electrical conductivity< 0.5dS/m ±3% with electrical conductivity less than 8dS/m 2.5V DC@2mA5V DC@7mA 2.5VDC@2m A5VDC@7mA 2.5V D.C-3.6V D.C@10mA -40 to +60oc Table 17:FDR Sensor calibration equations 10HS, EC-10, EC-20, EC-5 sensors calibration equations relating VWC and RAW for different types of soils 10HS Sensor EC-10 Sensor EC-20 Sensor EC-5 Sensor VWC10HS = 2.97* 10-9RAW3 10HS - 7.37*10-6 RAW2 10HS+6.69 * 10-3RAW10HS-1.92 VWCEC5=0.000571X-0.376 VWC-volumetric water content mV-milli volts sensor output RAW-readily available water X-RAW sensor output VWC=0.000424X-0.29 X-RAW sensor output VWC=1.3*10-3*RAW-0.696 for potting soils VWC=6.28*10-7*RAW2+3.7*10-4*RAW-0.183 5.7 Amplitude Domain Reflectometry (ADR) Technique An electromagnetic wave (Rafael, 2012) that is sent along a transmission line, after reaching desired depth a part of its energy will be reflected back to the source (transmitter). When the reflected wave interacts with the incident wave a voltage standing wave can be seen along the transmission line. This wave reflects the change in amplitude along the length of transmission line which in turn causes a change in impedance in the transmission line. On measuring the amplitude difference (in terms of voltage), impedance of the probe can be known and thus the water content in the soil is estimated. www.iosrjournals.org 158 | Page Sensors For Managing Water Resources In Agriculture Table 18: Amplitude Domain Reflectometry Technique-Advantage vs disadvantage The above table lists the advantage and disadvantage of ADR technique Technique ADR Advantage Readings are Not affected with temperature Not expensive disadvantage Measurements are majorly affected with airgaps, stones. Small sensing volume Table 19: Characteristics of ADR Technique The above table list out the parameters that are to be examined while implementing ADR technique Parameter to be measured Reading range Accuracy Measuring range Affected by salinity Soil type not recommended Field maintenance Safety hazard Cost value 0 to saturation 0.01ft3ft-3(or) 0.05 ft3ft-3 Cylinder(about 1.2inches Effective radius) Up to 20dS/m none Not necessary No $500-$700 5.8 Phase Transmission Technique Principle: (Rafael, Field Devices for Monitoring Soil Water Content, 2012) observed that an Electromagnetic wave that is sent along a probe experiences a phase shift after travelling through a fixed distance. This phase shift depends on the distance travelled by EM wave along the transmission line, frequency and velocity of propagation’s velocity is related to moisture content and hence can be determined. Table 20: Phase Transmission Technique-Advantages and Disadvantages The above table lists the advantages and disadvantages of Phase Transmission Technique Technique Phase Transmission Technique Sensor Type VIRIB Sensor Advantage disadvantage Accurate measurements can be obtained Reduced precision due to distortion of pulse during transmission Needs permanent installation of equipment Large sensing volume Not expensive 5.8.1 VIRIB sensor is one of the most popular sensors that use RF phase transmission technique; it uses a direct current (AMET-consortium)with a voltage of 12 to 20V from external source. Principle: The Intensity of current obtained at the output of a sensor is proportional to the moisture content. It is well known for the accuracy and reliability and can measure up to capacity of 15-20 litres of water in the soil. One can obtain information of moisture content to a greater depth in the soil root zone 5.9 Remote Sensing Techniques These techniques are meant for observing the earth’s surface or atmosphere using satellites (space borne) or using aircrafts (airborne). Any information (Baumann, 2008) about an object can be known without any physical contact. Electromagnetic energy is used for remote sensing. Whenever an electromagnetic energy radiation falls on a surface, some of its energy will be absorbed, transmitted and the rest is reflected. The sensing devices (cameras, scanners ,radiometers, radar etc) that are mounted on aircrafts or satellites record the electromagnetic energy that is reflected or emitted by the earth’s surface. The information is recorded on photographic films, videotapes or as digital data on magnetic tapes. www.iosrjournals.org 159 | Page Sensors For Managing Water Resources In Agriculture Table 21 Remote Sensing Technique-Advantages and Disadvantages The above table list out the different sensors that use Remote Sensing technique, and also the advantages and disadvantages of Remote Sensing technique Technique Remote Sensing Technique Sensor Type Remote Sensors(Active and Passive) Advantages Accurate measurements can be taken over a large area at a time remotely without any physical contact. Can make observations of hydrological parameters such asevapotranspiration, precipitation, soil moisture content, rainfall mapping ,snow etc Disadvantages Equipment is large and complexity is involved Using microwave methods the signal can be penetrated to a shallow depth with less than 4inches below the ground surface and hence only near surface soil moisture can be achieved Quiet expensive Different objects on earth’s surface return different amount of energy at different wavelengths in different bands of electromagnetic spectrum. Sensors that are mounted on satellites or on aircrafts take images of earth’s surface in various wavelengths of electromagnetic spectrum. Wavelength under which object reflects or emits radiation depends on the property of material, surface roughness, angle with which ray is incident on earth’s surface, intensity and wavelength of radiant energy. 5.9.1 Stages in Remote Sensing Emission of electromagnetic radiation from source Transmission of energy from source to surface of the earth Electromagnetic energy interaction with the earth’s surface (reflection and emission of EM energy) Electromagnetic energy transmission from surface of the earth to the sensor Recording of information from the reflected or emitted electromagnetic energy in a specified format by the optical sensors Table 22: Electromagnetic Spectrum for remote sensing The above table shows different regions of electromagnetic spectrum that are available for Remote Sensing along with their wavelength ranges Photographic ultraviolet rays Visible Near and Mid infrared Thermal microwave 0.3-0.4 micrometers Available for remote sensing 0.4-0.4 micrometers 0.7-3 micrometers Available for remote sensing Available for remote sensing 3.0 to 14 micrometers 0.1 to 100 cms Radio >100cms Available for remote sensing Available for remote sensing and can pass through cloud, fog and rain Not normally used for remote sensing Behavior of electromagnetic wave when incident on vegetation crops, soil and water When an EM wave is incident on the vegetation, chlorophyll in the leaves absorb the radiation in red and blue wavelengths but reflect green wavelengths. When an EM wave incidents on the water, it is not reflected instead it will be either absorbed or transmitted When an EM wave is incident on a soil surface, it is either reflected or absorbed but only little will be transmitted. The reflectance property determines the characteristics of the soil. Microwave radiometer is one such sensing device measures the power level of the incoming radiation. The power level (P) is expresses based on the following relationship P= K*Tb*B……………………………………………………………………… (17) Tb is brightness temperature (defines the measure of intensity of radiation at microwave frequencies) K Boltzmann constant; B Bandwidth of the instrument www.iosrjournals.org 160 | Page Sensors For Managing Water Resources In Agriculture For a flat surface, Brightness temperature is proportional to the physical temperature of the surface as Tb=e*T= (1-r) T………………………………………………………………… (18) e- Emissivity r=Fresnel’s reflection coefficient From From Microwave Radiative Transfer Model L-MEB (L-Band Microwave Emission of Biosphere) the brightness temperature (TBP) is expressed as (Philip, 2012) TBP= (1-wp)(1- τ p)(1+ τ prGp)Tc+(1-rGP) pTG…....................................................(19) Tc.TG - vegetative and effective soil temperatures. rGP soil reflectivity τ p vegetation attenuation factor TBP polarized brightness temperature, where τ p=e- τ p/ cosθ θi is incident angle, τ p vegetation optical depth Soil reflectivity (rGP) depends on dielectric properties of the soil such as permittivity, permeability, conductivity etc which in turn depend on physical properties of soil such as soil moisture, temperature, salinity and geometric roughness Fresnel’s reflection coefficient(r) determines the reflectance of the soil r α θ i……………………………………………………………………(20) Small change in angle of incidence (θi<10oc) exhibits small change in r values with variation in dielectric properties of soil water mixture. Variation in soil moisture (θ i) affects dielectric properties of the soil (ε,µ ,f) which in turn affects the r value(reflection coefficients) and in turn the difference in received power level of the incoming radiation . VII. Design of Soil Moisture Based Irrigation Control System An Irrigation control system (Philpot, 2008) is a device (typically a timer) that controls the irrigation system. In the regions like Florida water is the most valuable resource. A few years ago farmers used to go for usage of traditional irrigation controllers and these devices schedule the irrigation for a fixed period of times. For example a controller is scheduled a irrigation event for about 15 minutes i.e. from Monday to Saturday at 6AM.These controller supplies water to the plant as per scheduled time even during rainy season. This caused a lot of unnecessary irrigation. As water conservation is most important issue with increase in demands of growing population, farmers thought of using a sensing device to intimate the controller to start irrigation only when is necessary. That sensing device is a rain sensor that acts as shut off device installed along with irrigation controller to bypass the time scheduled irrigation during or for a period of time after. Before designing a SMS Irrigation control systems, it is necessary to know the role of SMS (Soil Moisture Sensor) in irrigation control system. Soil Moisture Sensor connected to an irrigation system measures the moisture content in the soil before the irrigation event is scheduled by the timer for a period of time. If the moisture content (θi) above the threshold value the irrigation time that is prescheduled for a fixed period of time is stopped. This indicates that plant do not require additional water. Setting the Sensor Threshold and programming the irrigation schedule are the critical factors for efficient usage of water. This SMS controller do not impose stress to the plants or decrease the quality of the yield that farmer obtains. It is proved that in south Florida, especially in the Tomato fields with the use of SMS irrigation controller 74% of water is saved while maintaining same yield. Also evapotranspiration rates for the area showed up to 61% in water savings. 6.0.1 Setting the Sensor Threshold value Step1. Apply water to the area where the sensor is buried. Either set the irrigation zone to apply at least 1 inch of water or use a 5-gallon bucket to apply directly over the buried sensor. Step2. Leave the area alone for 24 hours, and do not apply more water. If it rains during the 24 hours, the process should be started over. The water content after 24 hours is now sensor threshold . www.iosrjournals.org 161 | Page Sensors For Managing Water Resources In Agriculture 6.0.2 Programming the Irrigation Schedule Before setting the irrigation schedule it is important to determine when to apply water and how much to apply with each irrigation event. In general irrigation allowed is already limited by water restrictions. Irrigation run time is the amount of time an irrigation zone has to be turned on to apply the desired amount of water. It is affected by the water application rate of the irrigation sprinklers and the time of the year. 6.1 Soil Moisture Irrigation Controllers 6.1. 1 Water Mark Multiple Hydro zone system Automatic Irrigation scheduling system works with irrigation controller to supply water to the plant only when it is necessary. These controllers use WS200 Sensors that are resistance type based (500-30,000 ohms) and need no maintenance and calibration. This irrigation controller contains a Watermark Electronic Module which is valve control based and not only adjustable to plant water requirement but also protects ground water supplies. Operation: Watermark Electronic Module (company, 2006-12) signals the irrigation timer to start the irrigation only if water is needed. If soil dries than threshold irrigation will be triggered. If soil is wetter than the threshold setting irrigation is not triggered. This avoids reprogramming of time clock for seasonal changes or during rainy periods. It is important to note that the designed module will not interrupt the time clock in the middle of the irrigation cycle. That’s the reason sensor reading is taken at the beginning and again at the ending of irrigation cycle. 6.1.2. An Intelligent Soil Moisture irrigation Control System The beauty underlying (Algeeb, 2010) in this design is the use of digital controllers for scheduling irrigation events for plant water requirements accordingly. The controller takes soil tension as a basis for measurement of soil moisture. In order to measure soil tension we use Watermark Sensor, a new product from Irrometer Corporation whose measurement is correlated .The sensor is resistance type based whose resistance varies with moisture content. The output signal obtained from sensor will be in analog form which represents the tension level. This analog signal will be converted to digital by ADC. Basing on the digital output obtained microcontroller determines the water requirement and triggers the irrigation accordingly by switching the irrigation pump ON. This remains until soil tension reaches below the irrigation start level. In some other systems time interval for irrigation is set internally in microcontroller in internal timer or sometimes by external timer. VIII. Summary and conclusions A novel beginning has been made in introducing the role of sensors in agriculture and water management perspective. In this process we broadly classified the sensors into two categories, one of which belongs to a group that respond to the physical input being in touch with the object and the other which responds without being in touch with the object and continued our discussion in describing the static and dynamic behavior of sensors. We moved a step ahead in bringing out the overview of technologies involved in monitoring the water content in the soil. Pertaining to the technologies, several moisture sensors have taken their way in estimating the moisture content in the soil by relating the dielectric and physical properties of soil. In this journey with respect to the technology specified, underlying principle for each soil moisture sensor is stated and related parametric values like reading range, accuracy, measuring area, filed maintenance, salinity affects, economical feasibility are tabulated. And finally concluded by briefing the design aspects of soil moisture based irrigation control systems and their role in providing the need based irrigation with their efficient control mechanism. References [1]. [2]. [3]. [4]. [5]. [6]. [7]. [8]. [9]. Amar Pratap Singh,Shakti Kumar,Tara Singh Kamal,2003.ANN Based Virtual Instrumentation System for Estimation of Non – Linear Characteristics of Sensors ,IETE Journal Of Education.Vol-44,2,pp:63-72. Algeeb A,Albaul A,A Asseni,Jomah S, Khalifa O,2010.Design and Fabrication Of an Intelligent Irrigation Control System, Advances in Sensors, Proceedings of 3rd WSEAS International Conference on Advances in Sensors, Signal and Materials,pp:119-124,U.S.A AlexanderLoew,FlorianSchlenz,JoachimFallmann,Marzahn,Wolfram,Mauser,2012.Characterists of Rape Field Microwave Emission and Implicants to surface soil moisture retrievals, Remote Sesing,vol-4,pp:247-270. Bheli, Macro, 2007 .Soil Moisture Sensors, Department of Agro Environmental Sciences & Technology, Bolonga. Baumann, Paul, R., 2008.Introduction to Remote Sensing, State University of Newyork, College at Oneonta, Newyork. Brad, Nuffer, 2010. TDT Moisture Sensor cut sheet, Acclima Inc, Meridian. Brent, Philpot, T., 2008. Field Guide to Soil Moisture Sensor Use in Florida, University ofFlorida, Florida. Chard, J., 2002. Water Mark Soil Moisture Sensor, characteristics and operating Instructions, Ulah State University, Chicago Chawn Harlow, R., Eleanor Burke, Ferre, 2003.Measuring Water Content in Saline Sands Using Time Domain Transmission Technique. Vardose Zone Journal.vol2, pp: 433-39. www.iosrjournals.org 162 | Page Sensors For Managing Water Resources In Agriculture [10]. [11]. [12]. [13]. [14]. [15]. [16]. [17]. [18]. [19]. [20]. [21]. [22]. [23]. [24]. [25]. deCampos,Rangel,A.M.,RiodeJanerio,Souza,A.P.,SouzaFernandes,Shock,C.C.,2002.Comparison Of Soil Matrix Potential Using tensiometer and watermark sensors,3rd International Conference on Unsaturated Soils(UNSAT 2002),pp:335-338. Devices, Decagon, 2010. EC-20, EC-10, EC-5 Soil Moisture Sensors User Manual, Decagon devices Inc, Pullmann WA 99163, U.S.A. Fedro, Zazueta, 1994. Soil Moisture Sensors, Bulletin 292, University of Florida, Florida. Gerrit Hurrnemann,C., Lucas Jansses,L.F., Wim Bakker,H.,2004.Principles of Remote sensing, Introductory TexBook,3rd Edition,, s International Institute of Geo Information Science and Earth observation, Netherlands. Huneycutt, B.,2000.Frequency Use & needs of Spaceborne Active Sensors,Geo Science & Remote sensing Symposium,2000 proceedings.pp:2457-2463. Irrometer Company, 2006-12, Watermark Multiple Hydro zone System, MHS Instruction Manual, Irrometer Company, Riverside. Jacques Panchard, Jean Pierre,Hubaux,Jamadagni,H.S.,Prabhakar,T.V.,2007.A Wireless Sensor Network for resource-Poor Agriculture in the Semi arid areas of developing countries, Information Technologies and International Development.Vol-1,pp:51-67. Josie Chavez, Steven Evett, 2012. Using Soil Water Sensors to improve irrigation Management, Soil & Water Management Research. Luke,G.,2006.Interpreting Tensiometer and Test Well Readings, Factsheet 44/86,Department of Agriculture, South Australia. Munoz, Rafael, 2012.Field Devices for Monitoring Soil Water Content.BUL 343, Florida. Narender reddy, Sunil Kesavan, 2006. Encyclopedia of Medical Sciences & Instrumentation, John Wiley & Sons, New Jersey. Omega Engg, Inc, 2011.Omega Complete Temperature Measurement Handbook & Encyclopedia, Omega Engineering, Pennsylvania State University, Pennsylvania Peters, Troy, R., 2012, Practical Use of Soil Moisture sensor for Irrigation Scheduling, Washington State University, IAREC, Washington. Systems, EME, 2002. Electrical Interface for Watermark or Gypsum block Sensor, EME Systems, Berkley CA, U.S.A. Tam Steephamie, 2006. Water Conservation Factsheet on Irrigation Scheduling with tensiometer, Resource management branch, Ministry of agriculture& Lands, Canada. Webster, G., 2010.Medical Instrumentation: Application and Design,4th Edition, J Wiley, IU Library, Vietnam national University, Vietnam. Webster, J.G., 1999. The Measurement, Instrumentation and Sensor handbook, vol-2,CRC/IEEE Press, Boca Raton FI. www.iosrjournals.org 163 | Page