1
PentaMetric System Instructions
Please read this first! How to use these instructions
June 1, 2011 )
The PentaMetric system is complex. Because it can perform so many different functions
these instructions must be extensive. Most applications will not require all of this
capability. Considerable thought was given to make instructions that allow you to extract
the information for the items you need, without having to read what you do not need.
These instructions assume some knowledge of battery systems and electricity: What
you should be familiar with to fully understand these:
•A general idea of how loads and charging systems are connected to a battery system circuit
to enable it to be charged and discharged.
•The meaning of amperes, volts, ampere-hour, Watts, Watt-hour.
•Understanding the principle of how to measure volts, amps and watts in a simple circuit (for
example, with a digital hand meter.)
Guide to these instructions:
Read Section1 (Overview of PentaMetric capability) for brief description of each
PentaMetric function to decide which functions are important to you. Few people will
need all the capability of the PentaMetric.
Read and refer to Section 2 and Section 3 before and during physical installation
(Some information you should know before installing the system) (Installation of
PentaMetric)
Read Section 4 to learn how to operate the PentaMetric display unit : Operator’s
instructions for display unit.
Section 5 describes the computer interface for the PentaMetric.
Section 6 is the reference section.
Section 6A gives complete information on programming each of 49 programmable
parameters.
Section 6B describes each PentaMetric display function in detail. After deciding
which PentaMetric functions you need (by reading section 1) read only the sections
pertaining to the functions that are important for you. This section tells you everything
you need to know about each function to get it to operate correctly, including the
information about necessary program mode setup. Also read the appropriate topic
in this section if you have a question or problem with some function.
Section 6C describes logged data functions in detail
Section 6D: Output control relay programming and operation.
Section 6E: Alarm options
Section 7 describes in detail exactly how the PentaMetric keeps track of the battery
state of charge.
Bogart Engineering
19020 Two Bar Road, Boulder Creek, CA 95006
(831) 338-0616
www.bogartengineering.com
1
Table of contents
PentaMetric summary of functions.............................................................................. 5
Section 1: Overview of PentaMetric capability. .......................................................... 6
1.A: PentaMetric system general capability .............................................................................................. 6
1.B: System components and interconnections. ....................................................................................... 6
1.B.1: The PentaMetric input unit .......................................................................................................... 6
Figure 1: PentaMetric wiring diagram .................................................................................................... 7
1.B.2 The PentaMetric display unit ........................................................................................................ 8
1.B.3: The PentaMetric computer interface ........................................................................................... 8
Figure 2: Display unit: Main display mode. ............................................................................................ 9
Figure 3: Display unit: Other Data Modes............................................................................................ 10
1.C: Summary of the 29 specific “real time” measurements made by the PentaMetric.......................... 11
1.C.1 Battery volts, amps, amp hours, watts, watt hours for up to 2 battery systems......................... 11
1.C.2 State of charge for up to 2 battery banks................................................................................... 11
1.C.3 Cumulative (negative) amp hours for up to 2 battery banks. ..................................................... 11
1.C.4: Charging or load current (amps) and amp hours ...................................................................... 11
1.C.5: Charging or load watts and watt hours ..................................................................................... 11
1.C.6 Days since battery was fully charged or equalized .................................................................... 11
1.C.7 Filtered volts and Filtered amps ................................................................................................. 11
1.C.8Temperature................................................................................................................................ 12
1.D: Summary of specific logged data measurements made by the PentaMetric .................................. 12
1.D.1Periodic amp-hour, watt hour, volts, amps, battery %full and temperature ................................ 12
1.D.2 Charging cycle charge efficiency, self discharge current and cycle length (hours). .................. 12
1.D.3 Discharge volts/amps profile for each battery bank for each discharge (and charge) cycle. .... 12
1.E: Visual or audible alarms (or status): ................................................................................................ 12
1.F: Relay output control: ........................................................................................................................ 13
Section 2: Some information you should know before installing the system ....... 13
Shunt requirements ................................................................................................................................. 13
500A/50mV shunt: ............................................................................................................................... 13
100A/100mV shunt: ............................................................................................................................. 13
Other shunts ........................................................................................................................................ 13
Relay output control:................................................................................................................................ 14
Maximum Battery voltage ........................................................................................................................ 14
Cable considerations from input unit to readout control unit or computer interface................................ 15
Figure 4. Wiring of 9 pin connector to battery and shunts. .................................................................. 16
Section 3: Installation of PentaMetric........................................................................ 17
Section 3A. Hardware installation (wiring) instructions ........................................................................... 17
SAFETY WARNING ................................................................................................................................ 17
Section 3B Choosing and installing program parameters for your application ....................................... 18
Section 4: User’s instructions for display unit. ....................................................... 18
4.A.1: Description of “5 data switch” mode (most common mode).................................................... 19
4.A.2: System history display logged data mode (“SH”)...................................................................... 20
4.A.3:Battery discharge profile logged data mode (“BH”).................................................................. 20
4.A.4:Program view and change (“P”) ................................................................................................. 21
4.A.5:All Data select mode (AD): ......................................................................................................... 21
Section 5.Using the Computer Interface ................................................................... 21
Setting up the computer connection:....................................................................................................... 21
Reading “real time” data: ......................................................................................................................... 22
Getting logged data: ................................................................................................................................ 22
2
Section 6: PentaMetric reference section. ............................................................... 22
6A. Detailed description of each program option (total 49)..................................... 22
How to access program modes with the PentaMetric Display Unit:........................................................ 22
P1-P5: Switch select;............................................................................................................................... 23
P6: “Volts1” label: .................................................................................................................................... 23
P7-P9: Amps labels. ................................................................................................................................ 23
P11,P12,P13: Shunt type ........................................................................................................................ 23
P14,P15: B1 and B2 battery capacity...................................................................................................... 23
P16: Filter time constant.......................................................................................................................... 24
P17-P20: Charge control parameters...................................................................................................... 24
P22-P23: Alarm Levels for battery 1 ....................................................................................................... 24
P24-P25: Alarm Levels for battery 2. ...................................................................................................... 24
P26: Batt 1 low battery alarm criteria. ..................................................................................................... 24
P27: Batt 1 high battery alarm criteria. .................................................................................................... 24
P28: Batt 2 low battery alarm criteria. ..................................................................................................... 24
P29: Batt 2 high battery alarm criteria ..................................................................................................... 24
P30-P31: Relay ON criteria and Relay OFF criteria................................................................................ 24
P32-Batt1 charged criteria....................................................................................................................... 26
P33: Batt2 charged criteria. Same as P32 except for battery system 2................................................. 26
P34-P35: Battery efficiency factor and Battery self discharge current.................................................... 26
P36: Equalize interval.............................................................................................................................. 26
P37: Maximum Charge interval. .............................................................................................................. 26
P38: Day and time set. ............................................................................................................................ 27
P39: Periodic logged data: measurement time. ...................................................................................... 27
P40: Periodic logged data: measurement times/day............................................................................... 27
P41and P42: Periodic logged data: Select data..................................................................................... 27
P43: Battery discharge profile logged data options:................................................................................ 27
P44: Backlight options ............................................................................................................................. 27
P45: Erase periodic data. ........................................................................................................................ 28
P46: Erase “Battery discharge voltage profile” data................................................................................ 28
P47 Erase battery 1“battery efficiency cycle” data.................................................................................. 28
P48: Erase battery 2 “battery efficiency cycle” data................................................................................ 28
P49: Initialize memory to factory values.................................................................................................. 28
6.B.Reference section: Detailed description of each display item: ........................ 28
AD1, AD2: Battery1 volts (AD1), Battery 2 volts (AD2)........................................................................... 28
AD3, AD4: Average (filtered) battery1 volts (AD3),Average (filtered) Battery 2 volts (AD4).................. 28
AD7, AD8, AD9: Amps1 (AD7), Amps2(AD8), Amps3(AD9). ................................................................. 29
AD10, AD11, AD12:Average (filtered) amps1 (AD10), Average (filtered) amps2 (AD11), Average
(filtered) amps3 (AD12), ......................................................................................................................... 29
AD13, AD14, AD15: #1Amp-hours (AD13), #2Amp-hours(AD14), #3Amp-hours(AD15)...................... 30
Using amp hours to keep track of battery energy content (option 1):.................................................. 30
Using “true” amp hours to measure a charging source (such as daily or weekly solar input), or load
over a period of time (option 2):........................................................................................................... 30
AD16, AD17, Cumulative (battery discharging) Amp-hours1(AD16) Cumulative (discharging) Amphours2(AD17) .......................................................................................................................................... 30
AD18, AD19, Watts1, Watts2: . .............................................................................................................. 31
AD20,AD21 Watt hours1 (AD20), Watt hours2 (AD21)........................................................................... 31
AD22, AD23 Battery Percent full 1 (AD22), Battery Percent full2 (AD23) .............................................. 31
AD24, AD25 Days since charged, for batt1 (AD24) and batt2 (AD25) .................................................. 31
AD26, AD27 Days since equalized, bat1 (AD26) ,bat2 (AD27), ............................................................. 32
AD28Temperature ................................................................................................................................... 32
AD29-40: Charge cycle efficiency and self discharge data..................................................................... 32
6.C: Reference section: Detailed description of the three Logged data functions:
...................................................................................................................................... 32
3
6.C.1: “Periodic logged data” :................................................................................................................. 32
6.C.2: Battery discharge profile Logged Data: ........................................................................................ 33
6.C.3: System “battery efficiency cycle” logged data: ............................................................................. 34
6.D. Output control Relay programming and operation........................................... 36
6.E. List of each alarm option (total 10),.................................................................... 36
Visual Alarms........................................................................................................................................... 36
Audible alarms......................................................................................................................................... 36
Alarm option list ....................................................................................................................................... 36
6.E.1:“Battery low”: .............................................................................................................................. 36
6.E.2: Battery meets charged criteria: (should be called a “notice”, not alarm)................................... 36
6.E.3: Battery voltage high” ................................................................................................................. 37
6.E.4: Time to recharge battery. ......................................................................................................... 37
6.E.5: Time to equalize battery ............................................................................................................ 37
Section 7. How the PentaMetric keeps track of battery “state of charge” ............. 37
7.A: Details of how the PentaMetric keeps track of battery state of charge ........................................ 37
7.B: Deciding on programmed value for P14, P15, P32-P35. ............................................................ 39
4
PentaMetric summary of functions
For battery systems from 12V to 48V (nominal).
Measure 1 or 2 battery systems with common negative.
With one battery system: battery current plus two charging sources/loads can be measured.
System consists of these possible components:
1.data input unit to collect, process and log data (near batteries). Required component.
2. optional readout unit with LCD display and control buttons
Connect to input unit with 4 wires up to 1000 feet away.
3. optional RS232 computer interface with software to control and read out all data.
4. optional USB computer interface with software to control and read out all data.
5. optional Ethernet/internet computer interface with software to control and read out all data.
Data may be simultaneously accessed and controlled with item 2 and/or any one of items 3,4 or 5.
Real Time Measurement capability
Basic measurements:
Volts (2 channels) . Accuracy ±0.1V. Channel 1: 8-70V. (also supplies meter power). Channel 2: 0-100 volts.
Amps, (3 channels) ±.01-200 Amps (100A/100mV shunt).± 0.1-1000 Amps (500A/50mV shunt) Accuracy ±1.5%
±least sig. digit. Optional with version 2.0 or greater: Channel 1+2 can be summed to one amps reading for
measuring two shunts for two battery strings in parallel for very large systems.
Temperature (-20° C to +65° C). Requires optional temperature sensor TS-1 with 10 ft. cord.
Secondary measurements derived from basic measurements
Amp hour (3 channels) to ±83,000 Amp-hours
Cumulative (negative) battery amp hours. (2 channels) to -1,000,000 amp-hours
(To measure total cumulative “wear” of batteries)
Smoothed (time filtered) Amps, with time constant of 0.5, 2 or 8 minutes (3 channels)
±.01-200 Amps (100A/100mV shunt).± 0.1-1000 Amps (500A/50mV shunt)
Smoothed (time filtered) Volts, with time constant of 0.5, 2 or 8 minutes (2 channels) 0-100 Volts.
Watts (2 channels: Volts1x Amps1, and Volts2 x Amps2) ) ±.01- 20,000 watts
Watt-hours (2 channels) ±21,000 kilowatt hours?
Battery %full (2 channels) 0-100%
Days since batteries charged (2 channels) .01-250 days
Days since batteries equalized (2 channels) .01-250 days
Data logging functions. Memory can hold up to months of data, depending on how frequently and how many
different data are collected. With computer interface these can be output to spreadsheet file.
Log the following from once/day to up to once/minute: Use to confirm that charging systems or loads are
performing normally.
Amp hours (3 channels)
Watt hours (2 channels)
Temperature (min/max) (1 channel)
Volts (2 channels)
Amps (1 channel)
Battery % Full (1 channel)
Log battery discharge profile. Records volts and amps every time charge level changes by 5% (or 10%)This
checks that battery capacity is still OK--.by observing that battery voltage does not decline excessively as charge
level drops.
Log battery charge efficiency factor and average battery “self discharge” current for each charge/discharge
cycle. For each “charge/discharge” cycle: Records cycle length, total amp hours charged, total amp hours
discharged, computed average “self discharge” current and charge (amp hour) efficiency.
Relay output: Supplies voltage at (system voltage) to turn relay on and off at specified voltage levels and/or
%battery state of charge. Maximum current 1 Amp.
Audible and visual alarms: Audible or visual alarms for: “Low voltage or low state of charge”, “High voltage”,
“battery is charged”, “too many days since charged”, “too many days since equalized”
Size. Input Unit and Display unit (equal sizes--including mounting flanges): 4-1/4 in x 6-1/2 x 1-3/4 (10.8 x 16.5 x 4.5
cm) Computer interface: 4 x 2 x 1 in. (10 x 5.2 x 2.5 cm).
Power requirements. Input unit only: 0.5 watt. Input unit plus display unit: While display backlight bright: 1.5
watts. After display backlight dims: 1 watt.
5
Section 1: Overview of PentaMetric capability.
1.A: PentaMetric system general capability
The PentaMetric battery system monitor provides comprehensive and flexible battery monitoring for a
variety of different types of battery systems which are charged by solar, wind or generators. It is
intended to be most useful for systems which are regularly charged and partially discharged, rather
than backup power systems that are only rarely called upon to be discharged, such as uninterruptible
power systems (UPS). The system can monitor up to two battery banks simultaneously with a
common negative connection. A typical application would be to monitor a lead acid battery system
with capacity of from 10 to 10000 amp hours, with system voltage from 12 to 48 volts, with one or
more charging systems, such as a solar array, wind power, or generator system, and which is partially
discharged daily by loads powered through an inverter. Its purpose is to provide the user with
information necessary to check that the batteries and charging system are operating correctly, to keep
users informed about how much energy is in the battery system at any time, and. to anticipate and
identify problems before they cause a loss of service.
1.B: System components and interconnections.
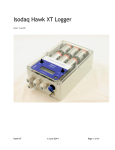
Refer to figure 1. Information on the battery system is gathered and processed by the PentaMetric
input unit which is located near the batteries and shunts. There are two ways to access and control
the data which it collects. The data can be read, and alarm setpoints and other control parameters can
be controlled by a separate PentaMetric display unit (figure 2) which has an LCD display and push
button controls. Alternatively a computer using software (for Windows operating system) and a
PentaMetric computer interface connected to its RS232 I/O port can access and control the data.
Both the display unit and computer interface may be used simultaneously. Or, the input unit may
run by itself most of the time, gathering data, but only connected to the readout unit or computer when
data needs to be read. Both connect to the input unit by a 4 wire power and communications cable
which may be as far as 1000 feet away from the input unit.
1.B.1: The PentaMetric input unit (PM-5000-U)
The PentaMetric input unit senses data from the battery system. The PentaMetric input unit (5.5
x 4.25 x1.75 inches), is located near the battery system. It has four plug in connectors, one of
which has 9 wires that sense data (from current shunts, and from the batteries) and supply power
to the PentaMetric. These wires monitor up to 3 channels of current (amperes), and 2 channels of
“volts”. Another RJ11 connector attaches a temperature sensor. From these data all the other
readable data are derived. A third connector can control a relay for starting a generator or
providing an alarm of low or high battery level. Another connector supplies 4 wires (up to 1000 ft
long) that connect to the readout unit and/or the computer interface. The input unit also internally
processes the data to produce “derived” information such as watts, watt hours, amp hours, battery
% full, etc, which may be viewed by the display unit or by computer access. The input unit also
logs data, such as daily amp hours and watt hours, charge cycle discharge information, and
records battery efficiency data to allow analysis to determine if the system is operating as
expected. Logged data may be viewed from the display unit however it is most conveniently
viewed using the computer interface.
6
4 connectors
COMMON
VOLTS 1
VOLTS 2
4 wires (2 twisted
pairs) up to 1000 ft
Pentametric
display device
(optional)
to RS232
computer port
relay
controlled by
PentaMetric
Pentametric
computer
interface
(optional)
+
-
+
AMPS 2
-
+
+
AMPS 3
To the Kelvin terminals
of up to 3 shunts max,
to measure amps1, 2
and 3.
Kelvin terminals
IMPORTANT: This shows 5 possible locations for shunts:
however the PentaMetric can only use 3 of these at one time.
Temperature
sensor
All loads and all
charging sources for
battery system 2.
+_
Shunt that measures battery
system 2 net current
Shunt that measures battery
system 1 net current
+
SHUNT: 50 MV/500 AMP
OR 100 MV/100 AMP
SHUNT 3
_
Pentametric
input unit
Shunt that measures inverter
load (or charging) current.
+
_
Inverter and
loads for
battery
system 1
-
AMPS 1
+
+
+
+
SHUNT: 50 MV/500 AMP
OR 100 MV/100 AMP
Shunt that measures
solar array current.
+
-
To Solar array and
controller
SYSTEM
GROUND IF
USED.
SHUNT: 50 MV/500 AMP
OR 100 MV/100 AMP
SHUNT 1
SHUNT 5
Fuseholders with
2 A fuse
SHUNT: 50 MV/500 AMP
OR 100 MV/100 AMP
SHUNT 2
To Wind generator and
controller
+
_
12 to 48 VOLT
BATTERY
SYSTEM #1
Shunt that measures wind
generator current.
+
SHUNT: 50 MV/500 AMP
OR 100 MV/100 AMP
12 to 48 VOLT
BATTERY
SYSTEM #2.
SHUNT 4
FIGURE 1: PENTAMETRIC TYPICAL BATTERY MONITOR CONNECTIONS. Shows some
possible locations for shunts. A maximum of 3 can be used with one PentaMetric
BOGART ENGINEERING
7/21/08
1.B.2 The PentaMetric display unit (PM-100-C)
The PentaMetric display unit is designed to be customized for simple or complex systems.
The display unit (see figure 2) allows observation of all parameters which the input unit measures-however most applications will require monitoring only some of these--in some cases only a small
number. The display unit has a two line 16 character LCD display, and also a sounder for audible
alarms. The display unit provides 5 “data select” buttons which allow access to the most commonly
used data. Each button can be assigned to display from 1 to 5 parameters of choice, according to
the user’s custom application. Thus it can be set up to measure many things for complex systems,
or each button can be assigned only one or two display items, for simpler applications. A
customized label may then be printed using a PC (computer) printer with descriptions according to
how the switches were set up, and inserted in a transparent “pocket” provided on the front, to
identify the display items assigned to each of the 5 “select” buttons. A maximum of up to 25
measurements may be shown by these 5 switches. In addition, the PentaMetric system allows
viewing and control of many “programmable parameters” to customize the monitor to a particular
system, such as shunt types, alarm and relay setpoints, what data is logged, and how the data is
presented in the display unit.
1.B.3: The three PentaMetric computer interfaces
There are now three choices of ways to access and control data from the PentaMetric by computer,
or now also through access by the internet. For this, one of the three interfaces below is required.
Connection may be made via 4 wire cable to the PentaMetric Input Unit, up to at least 300 meters
away. Using software provided for a “Windows” computer (“PMComm”) all data may be viewed,
and all programmed parameters may be controlled from the computer. Up to 6 “real time” data may
be simultaneously viewed. Also, logged data may be downloaded to the computer for display or
further analysis using a spreadsheet program such as Excel.
Here are the three computer interface types: All these will operate simultaneously with the Display
Unit (above). However only one of the following may be used at one time:
1. RS232 interface: (PM-100-C) This connects to an older computer “RS232” serial
connector.
2. USB interface.(PM-102-USB) This connects to the USB connector of a computer.
3. Ethernet interface.(PM-101-CE) This connects to an Ethernet connection on a computer
and may be accessed there, or may connect directly to an internet router. If the
PentaMetric location has a static IP address, then PentaMetric data may be accessed
anywhere (remotely) on the internet.
8
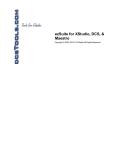
Label for top 5 switches: Each switch can be
assigned arbitrarily up to 5 display items. Assignment
for each switch to the desired items is accomplished
by program modes P1-P5. A card may then be
printed with these items and inserted in transparent
pocket of front panel. A "Word" file is available
("Pentametric Label Template") which can be
modified and printed to easily produce this label on
your printer.
Sol amp.
Batt. Amps.
Sol amp-hr
Sol W-hr
Bat%Ful. Bat volts. Days
since
charged.
5 switches on top row select the data to be
displayed from the items shown above switch.
Push switch repeatedly to cycle through all items
assigned to it. Two items (from two different
switches) can be displayed at once. Green lights
above switches show which switches are showing
display data.
"Other displays" switch selects one of
the four "display modes" in the list shown
here. See figure 3 for how switches
operate in those four modes.
IWhen an alarm is "active" this
light will flash. Pushing
"ALARM/OFF VIEW" will show
what alarm or alarms are active in
the display. "Audible" alarms also
start a sound tone sequence when
it alarm first starts. Pushing this
switch also silences this.
When an item is showing in the display that can be "reset",
this indicator light will go on. When lighted, pushing "RESET"
will show (in display) which (of possible 2 items) will be
reset. If the wrong item, quickly release and push again.
Holding "RESET" down will show a timer number in the
display that will quickly go from 9 to 0. The RESET will not
occur until the number goes to 0.
Operation of switches in the "5 button" mode.
This is the usual display mode.
When in this mode, "other displays" light will be OFF.
Figure 2
9
RIGHT and LEFT
arrow switches show
data going back or
forward in time for
the same type data.
RIGHT and LEFT arrow switches access data
going back or forward in time . Goes forward
or back in increments of 5% battery capacity.
UP and DOWN arrow switches access
the different data recorded at one
sample date/time. The "bottom" position
is the recorded date/time.
Battery discharge voltage profile logged data
mode(BH) See section 4.A.3
System History mode (SH) allows
access to "Periodic Logged Data" (see
section 4.A.2 ).
When CHANGING
DATA, the
RIGHT/LEFT
switches move the
cursor right and
left.
When OBSERVING
DATA, the UP/DOWN
switches allow view of
different program data.
When CHANGING data,
they cause data to
change.
UP and DOWN arrow switches access
different all (of about 40) different displays
available in the PentaMetric.
RESET (programon/off) button toggles from OBSERVE
DATA to CHANGE DATA. When in CHANGE DATA
mode, flashing cursor will appear in display.
Program Mode (P) allows you to observe
and change all programmable data. See
section 4.A.4.
All Data Mode (AD) allows access to all
display data available on the PentaMetric. See
section 4.A.5
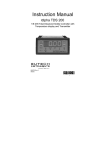
Switch functions for "OTHER DISPLAY" modes
These operate when "other display" lamp is on. Use "other displays" switch to
turn lamp on (or off) and cycle through these.
Note: blinking lamps tell you which switches are active in these modes.
Figure 3.
1.C: Summary of the 29 specific “real time” measurements made by the
PentaMetric.
These are summarized here. They are described in much more detail in section 6B.
1.C.1 Battery volts, amps, amp hours, watts, watt hours for up to 2 battery
systems
Measures instantaneous battery volts, amps, watts, in and out of batteries, amp hours from full
charge, watt-hours, for up to 2 battery banks sharing a common negative. Volts are measured to
0.1 volts, from 10.0 to 99.9 volts. Amps are measured from .1 to 1000 Amps with the 500A/50mV
shunt, or 0.01 to 300 Amps with 100A/100mV shunt. (Lower current ranges can be measured with
special shunts.)
1.C.2 State of charge for up to 2 battery banks
This shows the user how much energy is left in the battery banks. The display is shown as a
percentage. It is derived by measuring the number of the “amp hours” removed from a full battery
based on a value of “capacity” which you program into the PentaMetric. It is also possible to view
the same information as “amp hours removed from a full battery”.
1.C.3 Cumulative (negative) amp hours for up to 2 battery banks.
This measures only the discharging amp hours, without counting the charging amp hours, which
shows the total, long term accumulated discharge amp hours from each battery bank. This gives a
“bottom line” measure of how much total use the batteries have seen in their lifetime, similar to an
odometer in a car. This number is retained even if power from the meter is temporarily
disconnected.
1.C.4: Charging or load current (amps) and amp hours
It measures the input current (amps) and amp hours for up to three charging sources (such as
solar or wind) or loads (such as an inverter). The PentaMetric has 3 “amps” channels to measure
this type of data. Thus if 1 battery system is being monitored, up to two charging sources/loads
may be also measured. If 2 battery systems are being monitored then one source/load may be
measured.
1.C.5: Charging or load watts and watt hours
It shows the instantaneous input watts and watt hours, for up to two charging sources (such as
solar or wind) or loads (such as an inverter).The PentaMetric has 2 channels to measure this type
of data. (Watts=volts times amps) One channel uses “amps 1” and “volts1” measurements. The
other uses “amps 2” and “volts2”. Thus if 1 battery system is being monitored for watts, one
charging source/load may be also measured.
1.C.6 Days since battery was fully charged or equalized
It shows how many “days since battery was fully charged” and “how many days since battery
was equalized” for up to 2 battery banks. This helps insure that a battery system does not go too
long between full charges, which would impair its life.
1.C.7 Filtered volts and Filtered amps
The two “Volts” channels and three “amps” can also be viewed with a filter time constant of .5, 2,
or 8 minutes. This provides a “smoothed”, slowly changing view of all (2) volts and (3) amps
11
displays. This is useful for monitoring average wind generator “amps” input, or other rapidly varying
charging source. These are used for the “battery alarm” parameters, where it is not desired to
sound an alarm for very short term anomalous events, and for logging of volts and amps where it
would not be desirable to record a very short term event.
1.C.8Temperature
This measures temperature from -20C to 65C (-4F to 150F). The TS-1 temperature sensor
accessory is necessary when measuring temperature.
1.D: Summary of specific logged data measurements made by the PentaMetric
1.D.1Periodic amp-hour, watt hour, volts, amps, battery %full and temperature
It logs daily, or as frequently as once per minute amp hour and watt hour production (or load), to
monitor the performance of up to 3 charging sources or loads. Use this to keep records of daily (or
hourly) solar or wind power production, or total load power per day, or per hour. It also records
instantaneous “volts” and “amps” at periodic intervals to measure, for example, battery discharge
profiles. It also measures minimum and maximum temperature during the interval. It can also
monitor periodic (for example hourly) charge and discharge amp hours, watt hours, volts, amps,
and battery % full for a battery system.
If amp hours are measured each hour on all 3 channels then over 1 month of data can be
stored. If measured once/day then 2 years can be stored. See section 6.C.1 for more details.
1.D.2 Charging cycle charge efficiency, self discharge current and cycle
length (hours).
It measures the system “charge efficiency” (expressed as a percentage) of up to two battery
banks, or “self discharge” amps, recorded for each “discharge/charge” cycle. This will indicate
whether the batteries are retaining their charge properly. The “charge efficiency” means: the ratio of
“amp hours” required to charge, compared with amp hours discharged during one
discharge/charge cycle. The “self discharge” amps means the average amps lost during a period
of one cycle. These are two different ways to measure the same thing: the energy loss due to
battery self discharge current (as well as gassing when the batteries are near full charge.) The
display unit shows this efficiency (or self discharge current) over the last cycle, the last 4 cycles,
and the last 15 cycles. Using the computer interface, logged information on all past cycles may
also be displayed and shown in a table. See section 6.C.3 for more details.
1.D.3 Discharge volts/amps profile for each battery bank for each discharge
(and charge) cycle.
It logs the battery (filtered) volts and amps periodically (for up to two battery banks) while the
battery is being discharged and charged during each charge/discharge cycle. These values are
recorded each time the battery “state of charge” decreases (or increases) by an increment of 5%
of the total (programmed) battery system capacity, and therefore shows a “discharge profile” of the
battery. This provides a method of determining that the battery capacity is OK, by observing that
the battery voltage does not unduly drop as the state of charge decreases .See section 6.C.2 for
more details.
1.E: Visual or audible alarms (or status):
It provides up to 5 visual or audible alarms for “high battery”, “low battery”, “battery has gone too
long since being fully charged” and “battery has gone too long since being equalized”. It also
registers the “status”, which is not really an alarm: “battery now fully charged”. Each of these is
provided for up to 2 battery banks. All of these may be individually disabled, or enabled for either
visual, or visual and audible alarms. Also see section 6.E.
12
1.F: Relay output control:
It provides for control of a relay that: (1) turns “on” when the battery voltage drops below an “on” set
voltage or when the state of charge of the battery decreases below an “on” setpoint. and (2) turns “off”
when the battery voltage rises above an “off” set voltage, or when the state of charge of the battery
exceeds an “off” setpoint This could be used to control a generator or external alarm . It is also
possible to reverse the logic, so that the relay turns “off” instead of “on” as the voltage drops below the
setpoints and goes “on” when it goes above them. For technical relay information see section 2
“Relay Output control”. For detailed description of setup possibilities, see section 6.A under
P30-P31.
Section 2: Some information you should know before installing
the system
Shunt requirements
Shunts are required to measure current (amps) by this meter. These are large, precise, very low
resistance resistors that convert “amps” to “millivolts” that the meter reads. One shunt is needed for
each “amps” channel, up to a maximum of 3. They must all be wired in the negative side of the battery
system “in series” with the wire or cable whose current you wish to measure. The wiring diagram
(figure 1) shows numerous possible locations for the shunts, depending on the application.
There are two types of shunts that you may use depending on the range of current you need to
measure. All 3 need not be the same type.
500A/50mV shunt:
The PentaMetric can measure from 0.1 to up to 1000 amps with the 500A/50mV shunt--but shunts
of this type are usually limited to 400 or so continuous amps before they overheat. This assumes
they are connected with 1 ft (or more) of #0000 copper cable at each end to conduct away heat
(and of course, electricity).
100A/100mV shunt:
The PentaMetric can measure from 0.01 to up to 200 amps with this shunt--but shunts of this type
are usually limited to 75-100Amps continuous before they overheat. This assumes they are
connected with 1 ft (or more) with #4 wire to conduct away heat.
Other shunts
If you have a very small battery or battery system it is also possible to use other shunt values. For
example, a 10A/100mV shunt could be used if the system is measuring a small battery where an
“amps” range from 1mA to 20 amps would be desired. In this case the user would have to mentally
divide the “amps” and “amp hour” readings shown in the PentaMetric by 10.
Decide on the shunts you need, depending on what “amps” measurements you require. Most
systems with one battery system would usually have one shunt placed to measure battery current.
(shown as “shunt 1” in figure 1). Another could measure solar input (“shunt 2”), or other charging
source (“shunt 3” or “shunt 4”) to be able to measure daily input power. The diagram shows a number
of possible shunt locations for these. The shunt itself is “bipolar” and can be installed in either
direction. However the wires from the PentaMetric input unit must be connected on the correct “Kelvin”
terminals, according to the + and - signs as shown. The “+” terminal is the one electrically closest to
the battery minus terminal. This will insure that “charging” amps appear as positive values, and
“discharging” amps as negative ones. Before wiring it is advisable to make a wiring diagram for your
system. You might want to use a red pencil to draw in the shunt connections on the figure 1 wiring
diagram before installation.
If one battery system is being monitored, the battery shunt (“shunt 1”) should be connected to
“#1Amps” channel, and the terminal from the battery positive post should be connected to the Volts1
input. The “volts1” input also supplies power for operation of the PentaMetric system. The meter must
always be supplied with voltage here (minimum 9 volts) for meter operation, and if data is to be
13
logged, and amp-hour, watt-hour and battery% full data is to be preserved. Power is not needed to
preserve “programmed” data, or previously recorded “logged” data.
If two battery banks are being monitored, the second system should have a shunt in the “minus
battery” line shown as “shunt 4”. This should be connected to the “Amps2” channel and that battery
“+” terminal should be connected to the Volts2 input.. No significant current is taken from the “volts2”
input wire. (less than 200 microamps)
Important: Connect all unneeded shunt inputs (“amps” inputs) together and to the “- volts”
terminal. Figure 4 illustrates this. If you only need to measure one voltage point, you may wish to
connect the “Volts 2” input to the same point as the volts1, so that the Watts 2 channel can be used if
desired.
Relay output control:
The PentaMetric can actuate a control relay having a DC coil with a voltage requirement equal to the
battery #1 system voltage. For example it can be used to control a generator which is designed to start
with a simple contact closure.
Warning:
If used to control a generator it must be a type that is designed to operate safely with a simple
contact closure, including mechanisms to automatically start it safely, and to keep it operating
safely when not under the control of a responsible person.
The relay coil must be wired to its own connector on the input unit. (See figure 1) The relay can be
programmed to go ON (or OFF) when the “Battery 1” voltage goes below a predetermined setpoint,
OR when the state of charge of the battery goes below a predetermined setpoint. It will then go OFF
(or ON) when the Battery 1 voltage goes above another predetermined setpoint, OR when the state of
charge of battery #1 goes above another predetermined setpoint. For detailed description of setup
see section 6A Programming section, under P30 and P31.
Relay technical considerations: The relay coil voltage should be rated such that it can
accommodate the range of battery voltage expected in the system. The required current should be
less than 1A. For example, a 24V “nominal” system might be expected to have a voltage that can vary
from 21.0 to 32.0 volts. A typical example of such a relay is the R10 series manufactured by Tyco/
P&B. Here are 3 relays with their ratings suitable for ambient temperatures up to 40 degrees C (104°
F.) The “XXXX” shown in the part number represents numbers that can be different depending on the
relay contact arrangement required.
Tyco/P&B Part
number
R10-XXXX-V180
R10-XXXX-V700
R10-XXXX-V2.5K
nominal
coil volts
DC
12
24
48
Voltage range up to 40°
C (104°F) ambient
Min-Max V.
9- 16.5
18-32
36-61
Max. coil operating
current (milliamps)
99
50
27
The K10 series from Tyco/P&B can also be used if the ambient temperature does not exceed 26° C
degrees . (80° F).
Maximum Battery voltage
Volts#1 should not normally exceed 70 volts for more than a short time. The meter is fairly well
protected against short voltage transients, such as would be encountered from lightning. Volts #2 is
OK to 100 volts.
Power requirements: 18 ma at 24 volts; 30 ma at 12 volts: without display unit (computer interface
only)l.
24 ma at 24V -- or 43 ma at 12 volts with LCD backlight on “low” (after no buttons have been
pushed for 5 minutes)
14
38 ma at 24V -- or 70 ma at 12 volts with display unit, LCD backlight on “high” (just after pushing
buttons)
Cable considerations from input unit to readout control unit or computer
interface.
When runs exceed 50-100 feet, twisted pair cable (such as cat 5) should be used. Wire
resistance for each of 4 wire cable should not exceed 30 ohms from one end to the other for the
PentaMetric readout/control unit. This allows 1000 feet of length if AWG22 wire size or larger is used
or #24 for up to 600 ft. The connections to the computer interface should allow even longer distances.
When twisted pair cable is used one pair should be used for the terminals marked 3 and 4 (that carry
digital communication data). Another pair can be used for + and – (which supply power).
15
Green 9 terminal plug to PentaMetric input unit.
To Battery minus
terminal
1
2
3
4
5
6
9
+ SHUNT 3: Connect these two to a shunt
-
"VOLTS 1" To Battery plus terminal.
This must be connected in order to
supply power to meter. Nominal battery
voltage from 12-48. Max volts=65V.
"VOLTS 2" To second battery or voltage
measurement. (The meter takes no power
from this terminal). Does not need to be
connected unless "watts 2" , "watt-hr 2" or
"volts 2" is used.
8
7
-
-
+
+
that measures charging source or load
(not usually a battery shunt) . Connect
+ and - as same as described for
terminals 4-5.
"SHUNT 2": Connect these
two to second battery shunt
(or charging or load shunt).
Connect + and - as same as
described for terminals 4-5.
"SHUNT 1": Connect these two to
battery shunt (or other shunt). The
+ terminal goes to the (little) Kelvin
terminal electrically closest to the
battery negative. The - terminal
goes to the Kelvin terminal
electrically farthest from the
battery negative.
1. Decide how many shunts you need to measure( from 1 to 3) . If less than 3, connect all shunt terminals that will remain
unused (from 4-9 above) to terminal 1 shown above (to battery minus terminals) using a wire jumper.
2. Connect wires from battery and shunts to the 9 pin connector as shown here.
3 Then re check the connections--especially that the one to the plus terminal of the battery system (second from left
shown above). All unused shunt terminals should be connected together, and then to terminal 1.
page 16
FIGURE 4: PentaMetric Connections to input unit removable 9 pin connector.
BOGART ENGINEERING
8/15/05
Section 3: Installation of PentaMetric
Section 3A. Hardware installation (wiring) instructions
SAFETY WARNING
Only a qualified person who understands electrical safety procedures should
install the shunts and meter. Batteries if accidentally shorted can cause
intense heat. Systems with greater than 35 volts can present shock hazards.
CAUTION: To prevent possibly severe damage to the PentaMetric input unit,
BEFORE APPLYING POWER BY CONNECTING THE 9 PIN GREEN
CONNECTOR, (step 5 below) pay particular attention to the following:
All shunts must be located in the negative side of the battery system. One
way to verify this, and also insure that a wiring error will not result in a puff of
smoke coming from your PentaMetric, before plugging in the 9 pin green
connector, perform the following test using a multimeter: With multimeter set
to read “volts”, first connect the negative probe to pin 1 of green connector
(See figure 4). Then check the voltage (using the positive lead) checking each
pin from 3 through 9. Be sure that the voltage at pins 4 through 9 are all near 0
(less than 0.1 volts) The ONLY pins that it is OK to have a higher voltage
(usually battery system voltage) is at pins 2 and 3. Voltage here must be
positive, not negative.
1. It is advisable to make a drawing of the shunts and wiring to PentaMetric.
2. Disconnect DC power and install up to 3 shunts in necessary locations using large cables of the
same size as are presently used for conducting current from the batteries. As shown in figure 1
they must be placed in the negative side of the battery system such that all the current that you
wish the meter to read will pass through them. If placed in the positive side, it will not measure
properly, and may damage the meter.
3. Mount PentaMetric input unit. Remove cover of input unit. Remove (or obtain) the 9 pin connector
that plugs into the input unit. All wires from the batteries will attach to this connector. Refer to
figure 4 (Drawing of 9 pin connector) that shows how to connect the battery + and - terminals and
also all the shunts. It is of course much easier to wire while the plug is removed from the input unit.
The wire used has no special requirements.
NOTE 1: When installing the wire from the “+” end of the battery install an in line fuse (2 A fast
blow) near the “+” wire of the battery. This provides protection for the wires in case of short, and
provides an easy way to disconnect power to the PentaMetric if needed. (The reason for a “fast
blow” fuse is that it has less voltage drop, to make voltage measurements a little more accurate.)
NOTE 2: Any unused connections to shunt inputs must connect to pin 1 of the connector (battery
minus terminal).
NOTE 3 :If you are not using Battery volts 2 we suggest connecting this input to pin 2. (i.e. connect
pin 2 to pin 3) This will allow the meter to measure “Watts” and “Watt hours” on its Watts 2 or Watthr 2 channel, if desired.
17
4. Run 4 wire cable from input unit to PentaMetric display unit (if used) and the computer interface (if
used.) Cable requirements: We recommend twisted pair wire, such as Cat5 cable. For a short
run (less than 50 feet) probably any 4 wire cable will be OK. For longer runs use twisted pair wire
with minimum size wires of AWG#24 up to 600 ft, or AWG#22 up to 1000 ft. If more convenient you
may wire the computer interface to the display unit, then wire either of these to the input unit.
Remove or obtain the 4 wire connector that plugs into the input unit. If using twisted pair wires
one twisted pair should be used for the left two terminals and another twisted pair should
be used for the right two terminals. The wires should be connected in this sequence: The wire
going to the “left” terminal (looking from the wire entry side) on the plug in connector
should go the left terminal (also looking from the wire entry side) of the display unit.
Likewise for the computer interface. The remaining three wires should be connected to the
terminals in the same left to right sequence. For further guidance look at the markings on the circuit
board identifying the terminals: “4, 3, +, -“. When using twisted pair it’s important that 4,3 be on
one pair. Before plugging it in to the input unit, check wires for correct order on all devices again.
Then plug in the 4 terminal connector to the input unit.
5. Before applying power by inserting the 9 pin connector, check the wires from shunts and
battery(s) connector as described in caution just above step 1. Then plug in 9 terminal
connector. The backlight of the LCD display on the input unit should light up.
6. Cursory check of operation: Using program modes P11, P12 and P13 (refer to section 6.A under
P11,P12,P13 ) set the correct shunt types for channels 1, 2 and 3. See that the “volts” and “amps”
readings are reasonable, which establishes that the wiring is OK. With 0 current in any given shunt,
the “amp” display corresponding to it should show 0.0 or 0.1 at most. (But remember that the
PentaMetric takes some current too, which will be measured by the “Shunt 1” in Figure 1.) Load
currents (from turning on a load such as a light) should cause amp values to become more
negative. Charging currents should cause amp values to become more positive.
Section 3B Choosing and installing program parameters for your application
If you are using the PentaMetric Display unit, decide what display items you want to easily
select by the 5 “data select” switches. You can allocate from 1 to 5 display items to each of the
5 switches. Keeping a smaller number will provide simpler operation. If an item only very rarely
needs to be observed, the “all display” mode option can always be used--it can access all the displays,
but at the cost of a lot of button pushing to get there. Allocation to display items to particular switches
is accomplished by program modes P1-P5. Refer to programming section 6.A under P1-P5 for details
on how to do this.
A paper label identifying your choices for each switch which fits in the pocket of the PentaMetric
display may be made by visiting the bogartengineering.com website and downloading a Word file
called: “PentaMetric Label template”. Then modify the text using the Microsoft “Word” program
according to the switch allocations you have decided upon, and print it. Instructions are in that file.
Finally, for each display option you have chosen, above, refer to its detailed display description, in
Section 6.B. Each program mode that affects that display option is listed there. Then for each such
program mode check Section 6.A for how to set the correct programmed data to insure that the
display will show correct data.
Section 4: User’s instructions for display unit.
4.A: Refer to figures 2 and 3. There are five display modes. These are selected by “other
displays” switch: Most of the time it will be in the “5 switch” display mode which
allows the commonly used data to be accessed by the top row of 5 switches and also
gives the user access to the alarms when they occur. The other 4 modes are used
more occasionally for special purposes.
The quickest way to understand these is to refer to Figures 2 and 3. Then read text below
(Section 4.A.1 through 5) for complete description if necessary.
18
To get to the “5 button” display mode push the “other displays” button (lower right) repeatedly
until the adjacent yellow lamp goes off. Figure 2 has instructions for the switches in this
mode.
The four other less used display modes are accessed by pushing the “other displays” button.
Figure 3 has instructions for these. For the following four modes the “other displays” light is on.
They are identified by the first letters in the LCD display as follows:
SH:........ System History display: gives access to the “periodic log data” described in section 6.C.1.
BH:........Battery % History, or Battery discharge profile data gives access to logged data described
in section 6.C.2.
P:..........Program view and change. Allows you to observe and change all programmed parameters
described in section 6A.
AD:........Display All Data Allows access to all of the data measured by the PentaMetric (listed in
Section 6B) at the cost of a lot of button pushing
The lights by each switch will blink to show you which ones operate when not in the “5 switch”
mode. The ones that don’t blink will have no effect (except for the “extra data” switch). Usually the
up/down/left/right arrows on the switches will suggest their function.
4.A.1: Description of “5 data switch” mode (most common mode).
This mode is illustrated in figure 2. The row of 5 data select switches allow selection of data
listed above them: Each of these 5 buttons may be assigned several display functions, of your
choice depending to your application. See programming section 6A under P1-P5 for how to
assign each switch to your choice of up to 5 display functions. Up to 25 display items can be
accessed by these 5 switches. A label can be made for the clear pocket just above the switches
which describes the function or functions assigned to each switch. Use the template file available at
the www.bogartengineering.com website to make this label. Push the switch to select a display
item assigned to it--this will also light the green lamp above it. If more than one item is assigned to
a switch, push the switch repeatedly to access each one. Up to two displays may be viewed
simultaneously (from different switches) in the LCD window. .
It may be useful to know that while two items, (from two different switches) are showing in the
display--you can then (perhaps just momentarily) view another item from a third switch. After that
item has been viewed and turned off, (with its switch) the former two displays will revert back in the
display.
Alarms: While in the “5 data switch” mode, if an “alarm” occurs the “alarms active” lamp will flash,
and, if the alarm is enabled to be a “audible” alarm it will sound the (fairly quiet) alarm tone
sequence corresponding to that alarm. (Alarms are enabled or disabled by program modes P22P25). To identify the alarm, push the “alarm off/view” switch, which will also silence the
audible alarm and show in the display what the alarm is. In the event of several simultaneous
alarms they will alternate in sequence in the display. Pushing the “alarm off/view” again will cause
the alarm displays to disappear--however the red alarms active lamp will continue to flash as long
as the alarm is still valid. The audible alarm will not sound again until another alarm event begins.
For more information about specific alarms, see section 6.E:
RESET functions: Some display items can be manually reset. For example, “amp hours” or
“watt hours”, “days since charged”, “days since equalized” can be manually reset to 0 if desired, to
begin a new measurement of these quantities. If the yellow RESET lamp is lighted, that means
that one (or more) items showing in the display can be reset. While that item is in the LCD
display you may RESET that function by pushing the RESET switch--but carefully watch the
display--which will identify the item it will soon reset. This is particularly important if there are two
items in the display that can be reset. If the wrong one, release the button quickly and push again
to show the other one. Meanwhile numbers in the display will count down from 9 to 0. If you hold
the RESET down until the count reaches “0” then the RESET will actually be accomplished--but not
before.
19
4.A.2: System history display logged data mode (“SH”)
You can access this data most conveniently using a “Windows” computer with the
PentaMetric PMComm software. See below in this section.
However the “Display unit” in this mode can also be used to access this data. Refer to
figure 3 for a summary of how to navigate in this mode. The purpose of this display is to show
the periodic “logged data” (such as watt hours, amp hours, temperature) as described in section
6.C.1. When this mode is entered, the “OTHER DISPLAYS” lamp will light, and you will observe
that “SH: “ is shown as the first two letters in the top line of the LCD display. . When in this mode
you will note that lights near some switches will occasionally blink. This is to remind you which
switches are relevant and active for this particular mode. Observe that for this mode the 4 “arrow”
switches will blink. If you have just entered this mode (assuming some data has been collected)
the bottom line of the display will show a time and date number that will indicate the time that the
data was collected. The “date number” counts days with reference to the “date” that was originally
programmed using program P38. This “date” number increases by one for each passing day,
starting from whatever number was originally programmed. The top line shows the “measurement
number”, beginning with -1. Going back in time, by pushing the left arrow, changes this to -2, 3, etc., indicating previous measurements. As you do this the times and/or date number will
decrease. Pushing the right arrow key reverses the left arrow, and goes forward in time. Now,
having noted a time and date whose data you would like to observe, push the “up” arrow key to
view the first datum for that date/time. (For example: Amp-hr 2. =25.3) Each push of the up
arrow will display another datum for that date/time, up to as many as the system has been
programmed to record. Pushing the down arrow key, of course goes back down through the same
data until you get back to the “date/time” screen, after which the down arrow will have no effect.
Pushing the “OTHER DISPLAYS” button will exit this mode.
For information on how to set up this function to record what and when you want, see section 6.C.1
“Periodic data functions”
Computer access: You can get this data much more easily, and in much more presentable form
by using the computer interface. When you give the command to “download data” it will put all of
this information into a file called PM_(Date)_PeriodicData.csv. “Date” here is the date of the
download. If you open this file using Microsoft Excel it will show all the data in tabular form.
4.A.3:Battery discharge profile logged data mode (“BH”)
The purpose of this mode is to display the “Battery Discharge Profile Logged data” which is
more fully described in section 6.C.2.
This data can be most conveniently viewed using the computer interface. This is described
in Section 6.C.2. However it can also be viewed using the Display Unit as described here.
This data is intended to show if your battery bank may be getting low on capacity (“capacity” is how
much total charge the battery bank can hold, in amp-hours) To do this it regularly records the
filtered battery “volts” and “amps” as the battery discharges, (and charges) whenever the “battery
% full” display (AD22 or AD23 ) decreases (or increases) by an additional 5% (or 10%) state of
charge. When this mode is entered you will observe that “BH:” is shown as the first two letters in
the top line of the display. Note that the lamps by the right and left arrow switches will occasionally
blink, indicating that these switches will now influence the display.
Refer to figure 3 for a summary of switch functions for this mode. Assuming that such data
has been set up to be recorded, (see Section 6.C.2) and the PentaMetric has run long enough to
collect at least one data point, pushing the left arrow button will allow you to view the data
going back in time--the right arrow goes forward. The display shows the %full amount, the volts
and the amps. (Note that if you are collecting data for two battery banks, data for the two banks
will be intermixed.) As an example, suppose the battery is fully charged. As you push the left
arrow switch you can trace back in time and look at the battery amps and volts when the battery
was 95%, 90%, 85% charged, until you go as low as the battery was previously discharged. Since
these first few points represent a time when the battery was generally being charged, you would
expect the “amps” values to usually be positive. Eventually you will get to the lowest discharge
point. Going back further will show the numbers typically going up again--and since you are going
backwards in time this is tracing the time the battery was being discharged, the “amps” values will
20
be generally negative. The most interesting point to observe in this data is the voltage (and amps)
at the low point of discharge, to see that this voltage was not becoming excessively low. If the
battery voltage starts to go too low (compared with similar previous discharge levels in the past),
this would indicate a loss of battery system capacity for some reason, such as a bad cell, or bad
connection in a series string of the battery set--or just old batteries. Pushing the “OTHER
DISPLAYS” button will exit this mode.
4.A.4:Program view and change (“P”)
This allows programmed data to be observed and entered. See below, section 6A .
4.A.5:All Data select mode (AD):
Refer to figure 3 for a visual summary of switch functions for this mode. This mode allows
you to observe the entire catalog of PentaMetric data. This is the last mode to be encountered
before returning to the main “5 button” mode. Push the up or down arrow keys to index
through all 40 display items. Items may also be “RESET” from this mode, for those displays for
which a “reset” is possible, (indicated when the reset button lamp is lighted) the same way that they
are reset in the 5 button mode, using the ”RESET” button.
Section 5.Using the Computer Interface
Choose one of three computer interfaces to observe all display items, download all logged
data, and program all programmed items.
Setting up the computer connection:
Check the website for the latest version of “PMComm” computer interface program, and
download it if necessary.
If not yet installed, connect the “PentaMetric computer interface” to the “PentaMetric input unit” by
the 4 wire communication cable. This is described in section 3.A, step 4
The computer interface is designed to work with a RS232 port on a PC computer. It requires
a “regular” modem cable (not a “null modem” cable) to connect between the RS232 port to the
PentaMetric computer interface unit.
However some newer computers do not have a RS232 port, but instead have a USB port. To
connect with such a computer there are two possibilities: One is to install card in your computer
that supplies a RS232 port. Another, possibly simpler solution could be to get a USB to RS232 port
converter, which has a plug for the USB port for the computer and has a connector on the other
end for a RS232 connection.
USB to RS232 converters: There are various ones made by different vendors. Sometimes they
work with some USB ports on some computers, but not with others, and in many cases when they
don’t it is difficult to get information on why they don’t. Eventually, if we can find a foolproof
solution to this problem we will revise these instructions to include this information. Meanwhile you
may have to try one and see if it works with your computer, and suffer the frustration typical of this
kind of computer experience. Typically you will need to install software with an accompanying disk
to make it work. We have tried a model made by Radio Shack which worked on some USB ports,
but not with others. We had more luck with one made by “Cables Unlimited” model USB-2920,
purchased at a local computer store, but information is also available on their web site:
www.cablesunlimited.com. Also, there are several made by B&B electronics (bb-elec.com)
One possible advantage of the latter vendor is that they appear to have people accessible by
phone to help with technical problems, which are very common with this type of installation.
Generally it would be a good idea to determine before purchase that you can get your money back
if it doesn’t work.
(1)Get the PMComm software The PentaMetric interface PMComm software must be loaded into the
computer. The latest program may be downloaded from the website: www.bogartengineering.com.
You may copy the program file to any desired location in your computer by using Windows
“explorer”. You may want to put a shortcut icon onto your computer desktop for convenient access.
(2)Connect the RS232 port on the computer to the computer interface: Use a “regular” modem
cable (not a “null modem” cable).
21
(3)Invoke the program (double click icon) to open a window that will allow viewing data, viewing and
changing programmed data, and downloading logged data. After first opening the program
choose the “options” button and choose the correct computer “com” port which you have
connected to the PentaMetric. Then, close that window and select “Start display”. If everything
is properly connected the green “Receiving data” should periodically appear at the bottom of the
screen. If it shows in red “Error receiving data” recheck all cable connections and confirm that
the correct “com” port has been selected using the “options” box. If you get a communications
error, indicated by the red box at the bottom that says “error Port timeout” check that the
PentaMetric computer interface is properly connected to the correct computer com port with a
“regular” modem cable.(not a “null modem” cable) Also, be certain that the 4 wire cable from the
PentaMetric input unit is connected properly to the PentaMetric computer interface. If you get an
error that says “access denied”, this is because another software program on your computer is
also trying to use that same port. You will have to find which one it is and disable it.
Reading “real time” data:
After the “start display” button is actuated, click the rectangle above one of the 6 little viewing
windows, which will give you a choice of items to display. Choose one of these. After you have
done this the value should display in the viewing window. Up to 6 items may be displayed
simultaneously.
Getting logged data:
When you wish to get your logged data into the computer select that option among the choices
offered. It will show you where on your disk it will download files. If you wish to direct it to a different
place, click the “browse” button and specify the desired location. The logged data will consist of up
to 5 dated files. If you open these with Microsoft Excel the data will show in a tabular form whose
meaning should be clear if you refer to section 6.C of these instructions. If no data exists for that
file, it will not be made. Note that the date of the download is part of the filename:
Periodic data file: PM_Mar_04_2004_PeriodicData.csv,
Battery discharge Profile for battery 1: PM_Mar_04_2004_Bat1DischProfile.csv,
Battery discharge Profile for battery 2: PM_Mar_04_2004_Bat2DischProfile.csv,
Battery 1 cycle efficiency: PM_Mar_04_2004_Bat1CycleEfficy.csv,
Battery 2 cycle efficiency: PM_Mar_04_2004_Bat2CycleEfficy.csv
Programming data:
To read or change programmed data choose the “Program the PentaMetric” button. Consult these
instructions (beginning of section 6A) for detailed programming information if the data on the
screen is not sufficient for you to understand it.
Section 6: PentaMetric reference section.
6A. Detailed description of each program option (total 49)
How to access program modes with the PentaMetric Display Unit:
Refer to figure 3. Note that except for step 1, the occasionally blinking lights prompt you as to which
switches are active for that step.
(1)Push the “Other Displays” button until the “P” (program) mode appears in the display (as the
first character on the top line of the display).
(2) Select the program data you wish to view with the up/down arrow buttons.
(3) To change the data shown, push the “RESET(program) ” button once, which will start the
blinking cursor in the display, inviting you to change the data. Then:
(a) Change data with the “up/down” switches.
(b)Move the cursor left or right with the “left/right” buttons.
22
(c) After the data is changed to your liking, push the RESET(program) button again to install
the new data, and to resume viewing other program data.
(4) Continue or Exit: Provided that the cursor is not still flashing, (indicating you are not in the
program change mode) you may use the up/down switches to observe other programmed data, or
push the “OTHER DISPLAYS” button to exit this mode.
P1-P5: Switch select;
These allow assignment of each of the five “select” switches on the display unit to its desired display
options. For example, you could assign switch 1 to display only “Volts 1”, and switch 2 to display
“Amps 1 and Amps3” and switch 3 to show Amp-hr1 and Amp-hr 2 and Watt-Hr2. P1 provides the
selections for switch 1, P2 for switch 2, etc, up to P5. From 1 to 5 display items maximum can be
allocated to each switch. Select an item by putting its “AD number”, which is listed for each display
choice in the next section 6.B. (For example, “Battery 2 volts”, AD2 would be represented by “02”.
Install them from left to right. If you wish to display fewer than 5 items, enter “0” as the next item. No
items listed to the right of the “0” will display.
P6: “Volts1” label:
Allows choice of display label for “volts 1” The two choices “Bat 1 volts” or “Bat volts” are the only ones
possible. Typically “Bat 1” will be only used if you are monitoring two battery banks, so you can
distinguish them. If you are only using one battery system, “Bat” is usually preferable. Note: Volts 2 is
always called “Bat 2”, and can’t be relabeled.
P7-P9: Amps labels.
These allow choice of display identification labels that are more descriptive than, for example #1Amps
or #1Watts. Using this you can change these to be, for example “Sol Amps” , “Sol Watts” and “Sol
Amp-hr”, or “Bat Amps”, “Bat Watts” and “Bat Amp-hr” .
In each case your choices for the identifying prefix are: Sol, Wind, Hydro, Load, Bat1 or Bat
P7: Specifies a label prefix that applies to the following display modes: Amps1 (AD7), Average
Amps1 (AD10), Amp-hours1 (AD13), Watts1 (AD18) and Watt-hours1 (AD20).
P8: Specifies a label prefix that applies to the following display modes: Amps2 (AD7), Average
Amps2 (AD10), Amp-hours2 (AD13), Watts2 (AD18) and Watt-hours2 (AD20).
P9: Specifies a label prefix that applies to the following display modes: Amps3 (AD7), Average
Amps3 (AD10) and Amp-hours3 (AD13).
Refer to AD7-AD9 (section 6.B) “Program mode P7, P8 and P9” for more details.
P11,P12,P13: Shunt type
These select shunt type that is used for Amp1, Amp2 and Amp3 channels. These must be set to the
shunt types you are using, or the corresponding “amps” and “amp hour” values will be wrong by a
factor of 10. Refer to AD7,8,9 (section 6.B) Program mode P11, P12 and P13, “shunt type” for
more details on programming these.
P14,P15: B1 and B2 battery capacity.
P14 is for battery 1 and P15 is for battery 2. The “B1 battery” refers to the battery (if any) measured by
#1Amps and Volts 1. The “B2 battery” refers to the battery (if any) measured by #2Amps and Volts 2.
If a battery is being monitored by #1Amps/Volts1, then enter a value of amp hours in P14 that you
wish to assume for your battery system capacity. This value can be from 1 to 9,999 amp hours ,
indicating the battery bank capacity. The value entered here will influence the “battery % full” displays,
AD22, as explained more fully in section 7. It also determines when the “Battery discharge profile
logged data” is recorded (since the number of amp hours represented by 5% change in capacity is
determined by this). For more detail on this function, see section:7 “How the PentaMetric keeps
track of battery state of charge” It will also affect the “battery low” and “battery high” alarm functions,
and the “relay” set points, which are all referenced to “battery capacity” as entered in P14, 15,
IMPORTANT: If “Amp#1” or “Amp#2” is being used to monitor something else beside a battery
bank, such as solar or wind input amps, be sure to try to enter a “0” as “P14:battery capacity”,
which will result in “Not Used” being displayed. This will cause the #1 “amp hour” (or #2 Amp hour)
23
function to read “true” amp hours instead of being compensated by assumed battery self discharge, as
more fully described in section 7. It will also prevent the amp hours from being automatically reset to
0, which can occur if a “capacity” value is entered which is non zero.
P16: Filter time constant.
Sets the filtering time for “filtered” Amps display (AD10-AD12) and filtered “volts” display AD3, AD4.
Choose 0, 0.5, 2 or 8 minutes. This makes these displays respond more or less slowly. “0” represents
no filtering, (which will give displays which match the normal “fast” displays) with 8 minutes being the
highest degree filtering, which results in the most “sluggish” readings. See AD3, AD4 (section 6.B) for
more detailed description of what the filter times mean. Values from those (filtered) displays are also
used for determining “Alarm” battery voltage set points, “relay” set points, and they are used by the
logged data functions when recording battery “volts” and “amps”. If you do not wish to use “filtered”
values for these, you can enter “0” as the time constant
P17-P20: Charge control parameters
For possible future solar charger. These are not presently being used.
P22-P23: Alarm Levels for battery 1
This determines which alarms are activated, and whether they should be visual only, or visual with
audio alarm. See Section 6.E, “List of each alarm option” for more details.
Set all of the following to either 0= no alarm, 1= visual only alarm 2=audible and visual alarm.
P22: Lo:
Chgd:
Hi:
Alarms when Battery 1 voltage low.
Alarms when Battery 1 meets charged criteria
Alarms when Battery 1 high
P23: TimCh:
TimE:
Alarms when Battery 1 time to recharge battery
Alarms when Battery 1 time to equalize battery
P24-P25: Alarm Levels for battery 2.
Similar to P22-P23, except for battery 2.
P26: Batt 1 low battery alarm criteria.
These determine the two criteria which define a “low battery 1 alarm”. One is the (filtered) battery
voltage (AD3) below which the alarm will occur, and the other is the “Battery1 % full” (AD22) value,
below which will cause an alarm. The alarm will occur when EITHER (or both) conditions are true. If
you only want the “Battery1 % full” criterion to cause the alarm, then set the voltage very low, so that
the low voltage can’t possibly be reached. If you want only the voltage to cause the alarm, set the
“Battery1 % full” to “0”, which will cause “N/A” to appear. See section 6.E List of each alarm option,
for more details.
P27: Batt 1 high battery alarm criteria.
This specifies the voltage above which the “high battery 1” alarm will occur. See section 6.E List of
each alarm option, for more details.
P28: Batt 2 low battery alarm criteria.
Same as P26, except for battery 2.
P29: Batt 2 high battery alarm criteria
Same as P27, except for battery 2.
P30-P31: Relay ON criteria and Relay OFF criteria
The relay control is designed so that you can make the relay ON when the battery charge is low and
OFF when more fully charged. Or it can be OFF when low and ON when high depending on the
values you select. To determine the state of charge, the relay is controlled by both the “Batt1 % Full”
data (AD22) and by the “Batt 1 average voltage” (AD3). (For firmware version 2.0 or greater only,
there is an option to turn OFF (or ON) the relay when the battery #1 is sensed as “fully charged” (as
defined by program P32) Here are the six rules that govern the relay:
24
a) P30 sets the voltage that will cause the relay to go OFF.
b) P31 sets the voltage that causes the relay to go ON.
c) If the ON voltage is higher than the OFF voltage, then the relay will go ON when the voltage is
above the high voltage, and OFF when it is below the low setting. If you want the relay to work
in the opposite sense, then put the ON voltage below the OFF voltage.
d)If the “BATT%FULL” settings are disabled (with display unit: by setting it to 0), then “in between”
the voltage settings the relay will not change its state.
e) if the “BATT%FULL” settings are specified, then in between the voltage settings the value of
“BATT%FULL” can also change the relay state.
f) The “BATT%FULL” settings follow the expected logic of the “voltage” settings: so if the relay
goes ON at high voltage, and OFF at low voltage, then the relay goes ON at high
“BATT%FULL” , and goes OFF at low BATT%FULL..
g) In addition, for firmware versions 2.0 or greater: when the BATT%FULL setting is set to
100%, instead of responding when the actual “%full” (AD22) reading reaches 100, the relay will
respond when Battery #1 reaches the “charged “ criteria as defined by the settings in program
number P32.
The voltage command is always dominant: so in case the BATT%FULL setting specifies “go on”
and the voltage setting specifies “go off”, the voltage will always govern.
If you want only the VOLTS to control the relay, disable the Batt1%Full settings. You can disable
either or both %FUL settings by entering “0”. (When you do this in the “Display Unit” you will see that
“N/A” will be shown.)
If you want only the Batt1%Full to control the relay, put the VOLTS setpoints at an extreme HIGH
or LOW, such that the actual battery voltage can never reach it—but be sure to put the correct one
HIGH and LOW so the relay will change the way that you want as described in item f) above. Also, for
version 2.0 or greater, when this is set to 100%, the relay will ignore the actual “%full” reading, and
will only respond when the battery reaches “full charged” as defined in program P32.
Example1, Relay goes ON when voltage low, OFF when high: If you wish the relay to go ON below
24.5 volts and OFF above 27 volts, and not be affected by Batt1% full then program as follows
P30: (RELAY ON settings) 24.5V, Batt%=0, or disable Batt% ON.
P30:(RelayOff setings)
27.0V, Batt%=0, or disable Batt% OFF.
Example2, Relay goes OFF when voltage low, ON when high: If you wish the relay to go OFF
below 24.5 volts and ON above 27 volts, and not be affected by Batt1% full then program as follows
P30: RelayOn
27.0V, Batt%=0 or disable Batt% ON.
P30: RelayOff
24.5V, Batt%=0 or disable Batt% OFF..
In either case the relay will not change when in between these voltages.
Example3, Relay goes ON when Batt% low, OFF when high: If you wish the relay to go ON below
50%, and OFF above 80%, then program as follows (for a 24 V system):
P30: RelayOn
10.0V, Batt%=50
P30: RelayOff
35.0V, Batt%=80.
Example4, Relay goes OFF when Batt% low, ON when high: If you wish the relay to go OFF below
50%, and ON above 80%, then program the voltage “out of range” as follows (for a 24 V system):
P30: RelayOn
35.0V, Batt%=80
P30: RelayOff
10.0V, Batt%=50.
Example5, Make relay go ON when Batt% less then 50% or Batt Volts less than 22.4, and OFF
when Batt% is above 80% or BattV greater than 28.8
P30 RelayOn: = 22.4V, Batt%=50, :,
25
P30: RelayOff: 28.8V, Batt%=80.
In case of disagreement between the voltage setting and BATT%FULL setting the voltage setting will
govern. .
P32-Batt1 charged criteria.
This tells the PentaMetric when the battery system measured by “volts1” and “amps1” is to be
declared “charged”. When this occurs, the “days since charged” display (AD24 or AD25) will be reset
to zero. Also, if the “battery capacity” (program numbers P14 or P15) are set to a “non zero” capacity,
the “Battery % full” display (AD22 or AD23) will be reset to “100% and the “amp hour” display (AD13AD14) will be reset to 0. These “charged criteria” must be set correctly to get meaningful data from the
“battery efficiency” measurements, (described in section 6.C.3.)
As a battery system becomes more fully charged its voltage rises, and eventually the charging current
drops. You may specify a voltage and a current (amps) that define when the battery is “charged”.
The PentaMetric considers the battery to be “charged” when the (filtered) Battery voltage (AD3)
equals or exceeds the “voltage” setpoint entered here, and the charging amps (filtered Amps1, AD10)
current is LESS than the amps value entered. Refer to section 7B for more details, and for
suggestions for actual values to be entered.
P33: Batt2 charged criteria. Same as P32 except for battery system 2.
P34-P35: Battery efficiency factor and Battery self discharge current.
Refer to section 7 for more information on programming this: How the PentaMetric keeps track of
battery “state of charge”. The purpose of both of these parameters is to compensate for the “self
discharge” current of the battery. If you don’t compensate for battery self discharge, the “battery % full”
values could be too optimistic. Section 7 describes in more detail the reason for “battery efficiency
factor” and “self discharge current” settings. A “bottom line” conclusion is that in most cases you will
want to use either “battery efficiency factor or “self discharge current”, but not both simultaneously.
The “classic” method is to use only battery efficiency factor. A typical setting for “battery efficiency
factor” (used in the TriMetric) for a lead acid battery system is 94%--in which case you would turn off
the “self discharge” compensation by setting P35 to 0.00. This generally results in a slightly
pessimistic (low) reading for Battery % full, which is usually more desirable than having the reading too
optimistic. Incidentally, you turn off the “efficiency factor” setting by programming it to 100%.
The use of a “self discharge” compensation current is new--so it is not yet known if this method may be more reliable
than the “classic” method of using an “efficiency factor” compensation. If you use “self discharge” compensation, the
value will typically depend on the capacity of the lead acid battery system. A “typical” value would be to divide the
capacity of the battery system (in amp hours) by 500 and put this value of “amps” in P35. (This is now a pretty wild
guess. More research is needed.) Then set the “efficiency factor”, P34, to 100%, so that both methods are not being
used simultaneously.
The values that are computed by the “battery efficiency logged data”(section 6.C.3) could be helpful in
determining a suitable value for these parameters.
Incidentally, it is possible to compensate with both “efficiency factor” (P34) and “self discharge current”
(P35). However we don’t yet recommend this yet. The logic for doing this might be to program the
“battery efficiency” for the amount of overcharge at the end of cycle, and program the “self discharge
current” for the actual “self discharge” current expected.
P36: Equalize interval.
This is used to define the “alarm time” for how many days should elapse between battery
equalizations. It is only applicable when the “time to equalize” alarm is activated. See section 6.E.5;
for more information. Enter the time in days desired between equalization reminders. If two battery
banks are being monitored, the same number applies to both banks.
P37: Maximum Charge interval.
This is used to define the “alarm time” for the maximum number of days which should elapse between
times that the battery is detected as “fully charged”. See section 6.E.4 Time to recharge battery for
more information. Enter the maximum time in days desired between a full charge. If two battery banks
are being monitored, the same number applies to both banks.
26
P38: Day and time set.
This is used to set the time and day of the PentaMetric internal clock. The “time” is set in as 24 hour
time. The “date” is just an integer from 0 to 999, and can be an arbitrary number which will increase
by 1 each day that elapses. (You could, if you wish, enter the “Julian” date, which is the number of
days from the beginning of the year, beginning with Jan 1 as “1”.) It is used to determine the length of
charge cycles when recording “efficiency logged data”, and it is also used as a “date” stamp when
periodic logged data is recorded. When such data is downloaded to the computer this date (and time)
number is attached to each recorded data. The computer uses its internal “date” and “time”, along with
this data to calculate the actual time that the data was recorded. This is why it is not important to
enter the actual date here for that data to receive the correct time/date on the downloaded data file.
However if this periodic data is examined by the “PentaMetric display unit”, then the date shown there
(as an integer) will be the numerical date from this register.
Bottom line: If you are only going to look at periodic logged data by downloading into a computer it is
not necessary to set this date, because the computer will determine the relation between the number
and the actual date. However to have meaningful dates when looking at the “periodic logged data” by
the PentaMetric display unit you should put in a meaningful date: for example put “1” for the first day of
the month in which you set the date/time--which you will need to remember. Subsequent days will
then be referenced back to this initial date. However it is important to put in an actual time of day if you
use the “periodic logged data”, particularly if only recording once/day. This is necessary to insure that
the data entered in program P39 (daily time of measurement) is to be meaningful.
If power is removed from the PentaMetric the exact time and date will be rendered inexact. If that
occurs it will lose from 0 to 3 hours when power is restored. So when power resumes the time (and
date if necessary) should be re enered. Should power go off to the meter at an unknown date and
time, this time can be determined to within 3 hours by looking at this number at the moment that power
is restored, assuming that you have recorded the initial date and time that was entered.
P39: Periodic logged data: measurement time.
This specifies the time (in 24 hour format) when one of the “periodic data” measurements is to be
taken. (Refer also to section 6.C.1, Periodic logged data.) If only one measurement per day is to be
taken, this will specify the daily time of measurement. If more than one per day is to be taken, this will
be one of the times, and the other times during that day will be spaced equally in the day. For
example, if data is being collected two times per day, and this is set to 10:00, the two times when data
will be collected is 10:00 and 22:00. (10AM and 10PM)
P40: Periodic logged data: measurement times/day.
This is the number of times per day that the “periodic logged data” measurements are to be taken. It
can be set at 1, 2, 4, 6, 12, 24, 48 times per day. However if the computer interface is used, these plus
more options are possible, allowing measurements up to 1 per minute.
P41and P42: Periodic logged data: Select data.
P41 and P42 allow you to select what type of “Periodic logged data” data you wish to record. P41
allows the options to choose any combination of these: Amp Hr 1, Amp-Hr2 and Amp-Hr3. P42 allows
the options: Watt hour1, Watt hour2 and Max/min Temp. With the computer interface it is also
possible to select (filtered) “volts1” and/or (filtered) “Amps1”. See also Section 6.C.1, “Periodic
logged data”.
P43: Battery discharge profile logged data options:
For the “battery discharge profile logged data” these options allow you to:
a): Choose whether to record data every 5% or every 10% change of state of charge.
b) Read data from Battery 1, Battery 2 or both.
See also Section 6.C.2 Battery Discharge Profile Logged data.
P44: Backlight options
There are no options at this time. (Eventually “off”, “high 5 minutes” then off. high 5 minutes then low”)
27
P45: Erase periodic data.
This “program” mode allows you to erase and initialize the memory for the “periodic logged
data”..(Section 6.C.1) After entering this mode, note that the “RESET” lamp is lighted. If you push the
RESET button, a number in the display will gradually go to “0”: CAUTION: When it gets to “0” all
periodic data will be erased. This is the “amp hour”, “watt hour”, “temperature”, “volts” and “amps”
data that is recorded at specified times. It does not erase the “battery efficiency cycle” data or the
“Battery % History” logged data. It is not necessary to erase this data to “make space” for new
data. New data will always write over the oldest data previously logged.
P46: Erase “Battery discharge voltage profile” data
CAUTION:This is similar to P45, except it erases all the “Battery discharge profile logged data”. This is
the data that records “volts” and “amps” as the battery is discharged and charged in 5% or 10%
increments (Section 6.C.2). Hold the “reset” button until the numbers go down to 0 to erase. It is not
necessary to erase this data to “make space” for new data. New data will always write over the
oldest data previously logged.
P47 Erase battery 1“battery efficiency cycle” data.
CAUTION: This erases and initializes all the “battery 1” “battery efficiency cycle” data. This is the data
that is (partially) presented in display modes AD29-AD34 and described in section 6.C.3 for battery 1
. The full data is available by the computer interface. Hold the “reset” button until the numbers go down
to 0 to erase. It is not necessary to erase this data to “make space” for new data. New data will
always write over the oldest data previously logged.
P48: Erase battery 2 “battery efficiency cycle” data
CAUTION: Similar to P47 except for battery 2. Therefore it erases the data presented in display
modes AD35-AD40, which is the same logged data referred to in section 6.C.3 for battery 2..
P49: Initialize memory to factory values.
This initializes all of the “Programmed values” to their factory settings. CAUTION: This erases all
values of programmed data which you have entered since the meter was new, and restores
them to factory values. Hold the “reset” button until the numbers go down to 0 to erase. It does not
affect the recorded log data, however.
6.B.Reference section: Detailed description of each display
item:
The following is an itemized list of all measurements that the PentaMetric can make. Each one is
identified by a “display select” number (e.g. AD5), and is followed by a description.
The PentaMetric input unit measures directly 3 amps channels, which are here labeled “Amps1,
Amps2 and Amps3” and two directly measured voltage channels which are labeled “Battery 1 Volts”
and “Battery 2 Volts”. The temperature channel is “Temperature”. All other measurements are
derived from these, as described here.
AD1, AD2: Battery1 volts (AD1), Battery 2 volts (AD2)
Program modes affecting data: P6.
These each read directly the voltage at the two voltage inputs of the PentaMetric input unit. “Battery1”,
(AD1) can read from 8.0-100 (however, the actual input should not exceed 70V!) “Battery 2” (AD2)
read from 0.0 to 102.3 volts. Accuracy= better than 0.1 volt.
Program mode P6 allows you a choice of labels for “Battery 1 volts”. The choices are: “Bat1 Volts”
or alternatively (if there is only one battery bank in the system) just “Bat Volts”. Battery 2 volts is
always shown as “Bat2 Volts”.
AD3, AD4: Average (filtered) battery1 volts (AD3),Average (filtered)
volts (AD4)
Program modes affecting data: P6, P16.
28
Battery 2
These both read a “filtered” version of Battery1 volts, with a time constant which may be 0.5 minutes, 2
minutes or 8 minutes, or, (if this filtering action is not desired, it may be set to 0, in which case these
displays will be identical with AD1 or AD2.) Thus it is a very “sluggish” version of Battery1 and
Battery2 volts. The 8 minute time constant is the slowest, and most “sluggish”. The “.5 minute” time
constant means that if the input voltage suddenly changes from 20.0 to 30.0 volts, this filtered version
will take 0.5 minutes to get 63% of the way from 20 to 30, (i.e. to 26.3 volts) then another .5 minutes to
go 63% of the rest of the way, etc, etc until it finally approaches to 30.0 These “filtered” values are
used by the logged data programs that record “volts” and “amps”, so that the values it records will not
be sudden, anomalous values. It is also used for the battery “alarm” voltages, so that the alarms do
not react to a sudden and brief drop in voltage, caused, for example by a momentary motor starting
load. The choice of time constants may be entered using program mode P16. Only one choice of
filter time may be used at any one time-- in other words, the “filtered volts” and “filtered amps” will both
have the same filter time as specified in program mode P16
AD3 (Battery 2 filtered volts) is also affected by program mode P6 , (“battery 1 label”) as described
under Battery1 volts (AD1), Battery 2 volts (AD2).
AD7, AD8, AD9: Amps1 (AD7), Amps2(AD8), Amps3(AD9).
Program modes affecting data: P7, P8, P9, P11, P12, P13.
These are the three values of amps measured directly at the input device at Amps1, Amps2 and
Amps3 terminals. It shows charging (+) and discharging (-) amps, from 0.1 to 1000 Amps (with
500A/50mV shunt) or 0.01 to 200 Amps (with 100A/100mV shunt). In addition, for firmware version
2.0 or greater, it is also possible to set up the PentaMetric so that Amps2 display value will be equal
to the sum of the currents from the input shunt1+shunt2. This could be useful for very large battery
systems where the total current is so great that it is desirable to split the current between two shunts to
avoid overheating the shunts. In this case “Amps1” display will still read only the “Amps1” shunt.
Program mode P7, P8 and P9. “Amps” label: “#1 Amps”, “#2 Amps” and “#3 Amps” are the
default labels for these--but these are not helpful descriptions of the actual measurement in most
applications. The PentaMetric Program modes P7, P8, P9 allow a choice of other labels for these, if
desired. For example, “#1 Amps” can be labeled instead by any one of the following: “SOL Amps”
“WIND Amps”, HydroAmps”, “ LOAD Amps”, “Bat1 Amps”, “BATT Amps” or you may have it read
“#1 Amps”. Similar choices are available for #2 Amps and #3 Amps. (Note: eventually we also expect
that “Bat2 Amps” will also be available as a choice.) The same label that applies to “Amps1” will also
apply to “ Average amps1”, #1Amp-hours, Watts1 and Watt-hours1.
Program mode P11, P12 and P13, “shunt type” must be programmed correctly with proper shunt
type (resistance) that is used for measuring “amps” for each of the 3 “amp” displays. Otherwise the
“amps” could be off by a factor of 10. Each of the 3 amps displays allows for a choice of either a
100A/100mV shunt, or a 500A/50mV shunt. If the 100A shunt is chosen, the PentaMetric will read
amps from 0.01 up to a maximum of ±200A. (However the shunt itself usually has a limitation of 100A
or less.) If the 500A shunt is chosen, the PentaMetric will display amps from 0.1 to a maximum of
±1000A--but the shunt is generally limited to 400 amps (continuous), above which it will overheat. For
firmware version 2.0 or greater, if desired to allow Amps2 to measure the total current in shunts 1+
shunt 2, then program P12 (“Amps2 shunt type”) for “A1+A2”
AD10, AD11, AD12:Average (filtered) amps1 (AD10), Average (filtered) amps2
(AD11), Average (filtered) amps3 (AD12),
Program modes affecting data: P7, P8, P9, P11, P12, P13, P16.
These are “sluggish” or slowly varying versions of Amps1 ,Amps2, Amps3 (AD7-AD9). They are
filtered in exactly the same way as “Filtered volts”, AD3 and AD4. Refer to section on AD3 and AD4,
“Average (filtered) battery1 volts” for description of the filtering process. These filtered values are
used when values of “amps” are recorded in the data logging functions, so that short term anomalous
values are not logged. It is also useful for observing “amps” values that vary somewhat erratically,
such as wind charging current, to get a better idea of the average amps being delivered by a wind
generator that may have varying speed with the changing wind. As described in more detail in section
AD3 and AD4, Program mode P16 is used to select the time constant of filtering. Only one choice of
29
filter time is possible-- this same number is used for ALL filtering functions, so filtered volts and filtered
amps must have the same filter time applied. There is also an option for no filtering, if desired.
The labels for these 3 items are determined by Program mode P7, P8 and P9. “Amps” label: see
section above for AD7, AD8, AD9 for a description of these.
AD13, AD14, AD15:
hours(AD15)
#1Amp-hours (AD13), #2Amp-hours(AD14), #3Amp-
Two options for #1Amp hours and #2 Amp hours: AD13 and AD14 can be is used for two
somewhat different purposes depending on whether the Amps1 (or Amps 2) is being used to measure
battery current, or current from a charging source or load. How you set this up will depend on which
purpose it is used for. Note that AD15: #3 amp hours can only be used for the second purpose.
Using amp hours to keep track of battery energy content (option 1):
When used for this purpose it measures the number of amp hours removed from a fully charged
battery. A fully charged battery is indicated by zero amp hours. As energy is removed the value of
amp hours will become gradually more negative. This option also compensates for the “self
discharge” of the battery, as specified by program numbers P34 and P35. Also, when used for this
function, the PentaMetric resets the value automatically to 0 when the battery is sensed as “fully
charged”, as specified in program number P32. The measurement process is more fully detailed in
section 7: “How the PentaMetric keeps track of battery state of charge” If you are using Amphours for that purpose, refer to that section to understand how it works, and, most importantly, to
understand how the program modes must be set for this option to work correctly. Select this
option by setting “Battery Capacity”, program number P14 or P15 to a non zero value of
capacity.
Program modes affecting data when measuring battery energy content: P7, P8, P9, P11, P12, P13,
P14, P15, P32, P33, P34, P35.
Using “true” amp hours to measure a charging source (such as daily or
weekly solar input), or load over a period of time (option 2):
This option measures “true” (uncompensated) cumulative amp hours from a charging source or
load, (such as your total solar or wind energy over some period of time)—beginning at a time when
the amp hours are manually reset to 0: With this option the amp hours are never automatically
reset to 0 (which can occur with the battery option). This is the only option available for #3 amp
hours. To begin a new amp hour measurement manually reset these values to 0 using the
Reset button (described above in section 4.A.1 under “RESET”) The meter will accumulate true
amp hours until it is manually reset again. Select this measurement option by setting “Battery
Capacity”, program number P14 or P15 to “zero.” When this is done that Battery capacity will
display “NOT USED . Or specify “no battery” if using the computer interface .
Program modes affecting data when measuring “true” (non battery) accumulating amps: P7, P8, P9,
P11, P12, P13, P14, P15.
Program modes that affect AD7, AD8, (Amps1, Amps2), similarly affect this display. Refer to
section AD7 AD8,AD9 for information about program modes P7, P8, P9, P11, P12, P13.
AD16, AD17, Cumulative (battery discharging) Amp-hours1(AD16) Cumulative
(discharging) Amp-hours2(AD17)
Program modes affecting data: P11, P12, P14, P15.
This has a function analogous to an odometer in a car, in that the purpose of this is to measure how
much total duty the batteries have seen in their lifetime. It is intended to accumulate for the entire life
of batteries, if desired. It measures the discharging “amp hours” only, from the batteries. So when the
amps have a negative value (discharging) it accumulates those amp hours--however when the amps
are positive (charging) it accumulates nothing. Thus it measures the “one way” chemical change seen
by the battery, and thus is a measure of how much usage the battery has seen in its life. If a battery is
cycled from 100% full to 50% full and then back up to 100% the PentaMetric will measure the same
“wear”, or cumulative amp hours, as two cycles from 100% to 75%. This is approximately reflective of
the real wear caused by cycling a “deep cycle” battery, which will last about twice as many cycles in
30
the second case. This is an important “bottom line” number of the battery system performance, as it is
a measure of total “storage utility” gotten from the batteries. This number is periodically stored every 3
hours in “non volatile” memory, which means that if power is removed from the PentaMetric, it will only
lose the last 3 hours of data at most.
Program modes that affect AD7, AD8, (Amps1, Amps2), similarly affect this display. Refer to section
AD7 AD8, for information about these program modes.
AD18, AD19, Watts1, Watts2: .
Program modes affecting data: P7, P8, P11, P12.
Watts1 is the product of volts1(AD1) and amps1(AD7). Watts2 is the product of volts2(AD2) and
amps2(AD8). (Reminder: Power, or “Watts” used by a load is equal to “volts” across the load times
“amps” through the load.) Watts are positive when measuring from a source, such as a solar array,
and will be negative when power goes into a load.
Program modes that affect Watts1 are affected by the same program modes that affect the Amps1.
(See AD7) Likewise, Watts2 is affected by the same program modes that affect Amps2. (See AD8)
Watts1 uses the same display label as “#1 Amps” (Program mode P7). Likewise Watts2 uses the
same label as “#2 Amps”.(Program mode P8) (Also, of course, watts is affected by the programming
of shunt type (P11, P12) as described in the reference for AD7-AD8.)
AD20,AD21 Watt hours1 (AD20), Watt hours2 (AD21).
Program modes affecting data:P7, P8, P11, P12.
Watt hours1 and Watt hours2 are the time accumulation of Watts1 and Watts2. Watt hours 1 and 2
accumulate watt hours continuously (positive or negative) for as long as the amps or volts channels
are not zero. Watt hours can be manually reset to 0 whenever desired by using the RESET button
while observing the Watt hours display. Refer to Section 4.A.1 “reset functions” for how the reset
button works.
Program modes that affect Watt-hour1 are affected by the same program modes that affect Amps1.
Note that watt hour 1 uses the same display label as “#1 Amps” (Program mode P7),. (Similarly for
Watt-hour 2) Also this measurement is affected by the programming of shunt type (P11, P12) as
described the reference for AD7-AD8.)
AD22, AD23 Battery Percent full 1 (AD22), Battery Percent full2 (AD23)
Program modes affecting data: P14, P15, P11, P12, P32, P33, P34, P35,.
This display keeps track of the amount of energy in the batteries, expressed as a percentage. This
number is based on the “battery capacity” number programmed in P12 or P15, and the number of amp
hours discharged from a full battery, in AD7 or AD8. For example, if 100 amp hours is programmed as
the “battery capacity”, and the “Amp hours from full” display is -25 amp hours, then this display will
show 75% full. It only has significant meaning when the corresponding “Amp-hour” channel has the
“battery” option selected, as described under AD13-AD15. For more detail about this function, see the
section:7 “How the PentaMetric keeps track of battery state of charge”
AD24, AD25 Days since charged, for batt1 (AD24) and batt2 (AD25)
Program modes affecting data: (mainly) P32, P33
These display how many days have elapsed since the battery(s) reached the “charged criteria” as set
up in program modes P32 and P33. Lead acid batteries should be periodically charged fully to enable
them to retain their maximum capacity. This display shows how many days ago they were fully
charged—expressed with a resolution of 1/100 day. An “alarm” function can allow you to set a
maximum number of days after which an alarm will signal to recharge the batteries. For information on
the alarm function, see section 6.E.4. Also see Section 7 “How the PentaMetric keeps track of
battery state of charge” to find out how the PentaMetric determines that the batteries are “charged”.
This display will be influenced by the numbers entered in “Battery charged criteria”, program numbers
P32 and P33.
31
AD26, AD27 Days since equalized, bat1 (AD26) ,bat2 (AD27),
Program modes affecting data: None
This function is intended to show how many days have elapsed since the batteries were last
equalized--useful for those systems that need manual equalization. This function is nothing more (or
less) than a long timer that is reset to 0 with the “RESET” function-- so it does NOT automatically reset
when the batteries are equalized--you must manually reset this number to 0, using the RESET
button after you have equalized the batteries. To reset it to 0 you need to first view this function in
the display, then use the “RESET” switch as described in section 4.A.1, under “RESET”. The “days
since equalized alarm” may be used to provide an alarm for this timer after a certain number of days
have elapsed: as programmed in P36: Equalize interval. If the “days since equalized alarm” is
enabled it will alarm after the equalize interval has passed. However the data programmed in P36
does not affect this display--it only affects when the alarm occurs.
AD28Temperature
To measure temperature the optional temperature sensor must be plugged into the “input unit”. The
“display unit” will then display the temperature in Celsius degrees, from -20 to +65. If you observe the
data with the computer interface, in the “options” menu you can select whether it will display in Celsius
or Fahrenheit
AD29-40: Charge cycle efficiency and self discharge data
These displays show the system (battery) efficiency logged data. See section 6.C.3 “Where is this
data displayed” for a description of the 11 different types of displays available and their meaning.
6.C: Reference section: Detailed description of the three
Logged data functions:
6.C.1: “Periodic logged data” :
Program Modes affecting this function: P39, P40, P41, P42, P45.
NOTE: If you use this function you should download the document “How to graph and analyze
renewable system performance using the PentaMetric logged data”
This function can periodically record amp hours, watt hours, max and min temperature, battey%
full, volts or amps. You have many choices of how many times per day to record this data. The amp
hour and watt hour measurements record the amount accumulated during successive fixed time
intervals from as long as 24 hours to as short as 1/2 hour (using the PentaMetric remote display) or as
short as 1 minute with the computer interface. For example it could be used to record daily solar or
wind production, or the amount of solar production in each 1 hour interval--which would result in 24
amp-hour measurements per day. Or you could record the amount of solar input and wind input per
day, and read the wind and solar data separately from two amp hour channels. Up to 8 measurements
can be made simultaneously: Amp-hr1, Amp-hr2, Amp-hr3, Watt hr 1, Watt hr2,. and Max and min
temperature can be made with the “PentaMetric display unit”. With the computer interface you have
four additional choices of recording (filtered)Volts 1” (AD3), (filtered)Volts 2”,(AD4) Battery %
full,(AD22,23) and (filtered)Amps 1 (AD10), and in addition allows a larger number of options for the
number of times per day, from 1/day to 1/minute.
To record Periodic Data you must set up 3 things: (1) The number of measurements per day
(Program P40) (2) The reference time of day that one of these recordings will be taken (Program
P39); the rest will be distributed equally around the 24 hour day.) and (3) The data you wish to record.
(Programs P41, P42) Use Program P41 to specify which (if any) Amp Hr1, Amp Hr2 or Amp Hr3 you
wish to record. Use Program P42 to specify which (if any) Watt-hr1 or Watt-hr2 or Temperature that
you wish to record. To record “volts” or “amps” or “battery % full” you must use the computer interface
with the “PMComm” program (available by free download) to specify these.
To view the data using the PentaMetric Display unit, use the “System history logged display mode
(“SH”). See section 4.A.2. Or for much easier access use the computer interface to download the data
to a file. This may then be opened for observation by a spreadsheet program, such as Excel.
32
Before beginning to record you may wish to erase all the data recorded in the past using (Program
number P45), although it is not necessary to do this in order to “make space” for the data. When the
memory is full new data is still recorded by overwriting the oldest data.
Size of memory: Data will be recorded until the memory is filled--after which the oldest data will
gradually be overwritten with new data. To estimate the number of data points in the memory use the
formula:
First compute 61÷[3 + (2 × p)].
where p=# of items measured at each measurement time. (1-8)
Keep only the integer part. (throw away the fraction). Then multiply by 116. This tells how many times
all the data can be recorded before the oldest data will begin to be overwritten. If only one item is
being recorded you can record 1392 times. If all 8 are being recorded you can record 348. Divide by
the number of measurements per day to determine number of days.
6.C.2: Battery discharge profile Logged Data:
Program Modes affecting data: P14, P15, P32, P33, P43, P46 .
This function is intended to provide data that can show if the battery system is losing capacity. It does
so by recording (filtered) “volts” and “amps” as the battery is gradually discharged or charged. It
records these every time the discharge “state of charge” drops by 5% (or 10% if you so choose).
Typically, starting from fully charged, as a good battery discharges, the “volts” will drop only slowly at
first. At some level of % discharge however, this voltage will begin to drop more rapidly as the
batteries begin to exhaust their energy. As the battery ages, or if possibly a cell or battery connection
becomes weak, this voltage decline will occur at higher percentage of charge. (This level of voltage
will also be influenced somewhat by the current draw—which is why “Amps” are simultaneously
recorded.) If voltage begins to drop more rapidly at an unexpectedly high “state of charge”, this could
alert you to a battery bank that may soon fail. Typically one would observe the voltage data for
successive charge/discharge cycles, particularly observing when the battery is at lowest state of
charge. If over successive charge/discharge cycles this minimum voltage begins to drop (for a given %
of charge) that could anticipate a battery system failure.
To record this data you must set up Program Mode 43 which allows you to choose whether the
data is collected for every 5% or 10% change in “state of charge” as indicated by AD 22, AD23
(Battery Percent full). You may choose to record from battery bank 1, or bank 2, or both. Other
program modes affecting the data are P14 and P15 (Battery capacity). This specifies the “reference”
100% full capacity, and so thus calibrates the amount of “amp hours” represented by each 5%
additional discharge. You can determine the number of “amp hours” each 5% interval represents by
multiplying the value in P14 (or P15) by 5%.
Before beginning you may wish to erase all the data recorded in the past using (Program P46). This
is not necessary to “make space”, however. When full the oldest data in memory will be gradually be
overwritten by the newest.
To view the data using the PentaMetric Display unit, use the “Battery discharge profile display mode
(“BH”). See section 4.A.3. This data may be particularly useful using the computer interface, because
it is easier to use the computer to graph (and analyze) the data, comparing it with past discharge
profiles to identify a trend that would point to future capacity failure. In addition, the computer will show
the days (but not the time) when the data was recorded.
Size of memory: It records a maximum of 744 data points, after which it will write over the oldest data
first. For example, if the batteries go through one cycle per day, and go from 100% to 48% each day,
and if data is collected every 5%, the system would record usually 11 events while being discharged,
and 11 events while being charged, for a total of 22 per day. (This number could be higher if during
discharge the batteries are partially charged again, causing an extra “5%” boundary point to be
crossed again, after which further discharge occurs.) If one battery is being monitored it would monitor
about 33 days before overwriting the old data.
33
6.C.3: System “battery efficiency cycle” logged data:
Program modes affecting data: P14, P15, P32, P33, P47.
Data always on: This type of data is “always on”--it does not need to be programmed on. . It is
available either from the “display unit” using display modes AD29 through AD40 or as a downloaded
file using the computer interface. The downloaded file can then be accessed on your computer using
Excel, or other spreadsheet program which shows a history of previous charge cycle efficiency.
Purpose of data: This data is designed to determine how much charge (or amp hours) the battery
system loses during each charge/discharge cycle. An ideal system would lose 0 charge: you would be
able to remove the same number of amp hours while discharging as went into the batteries during
charge portion. However a real system will lose some energy each cycle due to two causes: (1) the
self discharge current of the batteries and (2) The extra charging that occurs after the batteries are
fairly well charged, which typically results in some gassing of the batteries.
When batteries are new the self discharge should be low. As they age the self discharge will
eventually increase.
Although it wastes some energy, the extra charging at the end of the charge cycle is useful to maintain
high capacity of lead acid batteries. Tracking the amount of extra charge required per cycle is useful
to see that the system is being charged sufficiently, and that the batteries’ self discharge is not
becoming excessive. Some experts recommend that lead acid batteries in solar energy systems
should be recharged with at least 110% of the amp hours that were discharged. This would represent
an “amp hour efficiency factor” of 100/110 = 91%.
Exactly how is data measured? First a brief description of how this measurement will be given--then
a more detailed description will follow. Starting from a “full” battery the PentaMetric measures the total
discharge (amp hours) leaving during its normal discharge period, and then separately measures the
charge required to recharge to “full” again for each discharge/charge cycle. As said before, a perfect
battery would result in equal amounts of “discharging” amp hours compared to “charging” amp-hours.
With a real battery however, the amount of discharge “amp hours” will be slightly less than the amount
of amp hours required to charge it originally, because of the battery’s “self discharge” current, and
also, as said, because extra beneficial charging is done which results in some charge being lost by
“gassing” of the batteries. There are two objectives of recording this data: one is to determine how
much energy is lost in one cycle, and thus determine if the “self discharge” of the batteries is becoming
excessive, due to aging or other problem. The other is to determine if sufficient additional charge is
being delivered to optimally maintain the batteries.
Here is a more precise description of how this is measured: First the PentaMetric determines when the
battery is “charged” by noting that the battery voltage has exceeded the “charge setpoint” voltage, and
the battery charging current is less than a “charge setpoint” amp value. (These setpoints are entered
by Program Modes P32 and P33.) Once this has been attained, the official beginning of the
“discharge cycle” may occur after this, the first time the battery starts to discharge: that is when the
“amps” value goes from “charging” to “discharge”. This time, and amp hour values at this time are
recorded as possible beginning data The reason for sounding somewhat uncertain, is that it is
possible that after only a tiny discharge has taken place, the battery may be re charged to “full” again,
(perhaps because a cloud obstructing the solar array has passed.) So if this occurs the old beginning
values are discarded, and new ones are taken when the battery again begins discharging. These
values are only kept and permanently recorded as the beginning data when the %full value drops
below 90% charge. Then the “begin” data is officially recorded, and two registers are zeroed with
reference to this already recorded data: one of which will accumulate all “charging” amp-hours, (i.e.
when “amps” value is positive) and the other records all “discharging” amp hours (i.e when the
“amps” are negative). Finally, when the battery again reaches “charged”, this is NOT taken yet as the
end of the cycle. The end is taken only when the next beginning occurs, as described above. So it
records data for a completely closed cycle. And, since we still don’t know if that is the real beginning
time, the cycle results are not recorded, or shown in the display until the battery charge declines below
90%, into the next cycle. At this point two numbers are calculated and recorded. One is the ratio
between discharge amp hours to charge amp hours (the “charge efficiency factor” in %). The other is
the “average self discharge” amps, which is (amp hours charged) minus (amp hours discharged), all
divided by the number of hours between the cycle. This number, “average self discharge amps”, is
recorded between 0.00 amps and 9.99 amps.
34
Note that a different way of measuring this could have been done by starting at the time as above
described, but declaring an end at the time (after discharge and recharge) at which the battery just first
met the “charged” criteria. Thus the additional charging (or gassing) of the battery that occurs after
this, while the battery is pretty well charged would not be counted. That would give a more optimistic
(higher) estimate of battery efficiency (and lower self discharge) than the one actually made by the
PentaMetric, since this “top of charge” may waste some energy due to gassing of the electrolyte. One
reason for not doing it this way is that we have discovered that some significant charging occurs
during this time--and not counting it (in some cases) can result in charging efficiencies that appear
over 100%. We believe that the method we used results in a more realistic evaluation of the total
“amp hours” lost per cycle in the system.
It should be mentioned here that the values of “charge efficiency” and “self discharge” measured here are
not exactly the values that should be used when entering the “battery efficiency” or “self discharge”
amounts in program mode 34 and 35. The values measured represent the most pessimistic values that
should be programmed there, since this value measures also the loss due to gassing of the battery at top
of charge. However it results in a lower value of “efficiency factor” than should be entered as the assumed
battery efficiency P34 and P35, or conversely a high value of self discharge current.
How this data is displayed: It is most easily observed by downloading the data using the computer
interface. (See below in this section) However it is also shown in the display unit as display data
AD29 through AD40. These display the “efficiency factor” in 3 ways: (1) the efficiency (and “self
discharge current”) calculated for the last (most recent) charge/discharge cycle (2) the efficiency
calculated for the last four cycles and (3) the efficiency calculated for the last 15 cycles. Due to the
lack of space in the display, these show up as somewhat cryptic displays as shown and interpreted
here:
Note that in the following, in the “4 cycle” and “15 cycle” cases below, if this number cycles have not
yet accumulated, the result will be shown for the number of cycles already accumulated. For example,
if only 3 cycles total have been recorded, the 4 cycle result would show as:
B1:03CySd= y.yy
. A similar statement holds for the 15 cycle case.
AD29: One Cycle Efficiency Factor:
B1:01CyEff= yy%.
Interpretation: “Battery 1, for the last cycle had measured efficiency factor=yy%
AD30: One Cycle Self Discharge current: B1:01CySd= - y.yy
Interpretation: “Battery 1, for the last cycle had measured self discharge current=y.yy amps
AD31: Four Cycle Maximum, Efficiency Factor:
B1:04CyEff= yy%.
Interpretation: “Battery 1, for the last 4 cycles had average efficiency factor=yy%
AD32: Four Cycle Maximum, Self Discharge current: B1:04CySd= - y.yy
Interpretation: “Battery 1, for the last 4 cycles had self discharge current=y.yy amps
AD33: 15 Cycle Maximum, Efficiency Factor:
B1:15CyEff= yy%.
Interpretation: “Battery 1, for the last 15 cycles had efficiency factor=yy%
AD34: 15 Cycle Maximum, Self Discharge current: B1:15CySd= - y.yy
Interpretation: “Battery 1, for the last 15 cycles had self discharge current=y.yy amps
AD35-AD40: Similar to above, but for battery 2.
The Computer download of logged data shows this data much more clearly: In the download file
“PM(Date)BatCycEfficy.csv” the data is shown in a 10 column spreadsheet table: (1) Date/Time that
the cycle began, (2)Whether the cycle was “valid” or not, (3)Cycle length in hours, (4)Total discharge
(only) in that cycle, (5)Total charge (only) in that cycle, (6)the “net” amp hours, which is the difference
35
between the charge and discharge amp hours,(7)Charge efficiency, which is item 4 divided by item 5,
8)Self discharge current, which is item 6 divided by item 3, (9) Same as item 7, except averaged over
some number N of cycles, and (10) Same as item 8 except averaged over some number N of cycles.
The number N can be selected in the “options” box, under “Efficiency average cycles.”
Over 100% efficiency possible?? Another thing that should be kept in mind is that it is actually
possible for a battery system to appear to be more than 100% efficient (and the battery would then
appear to have a self charging, or positive current instead of a self discharge (negative) current)
according to this measurement. That can occur when the battery system experiences warm ambient
temperature during the first time it is charged fully, but after one cycle takes place, the next time the
batteries are a lot colder at the moment the cycle ends. At a colder temperature the batteries can’t
absorb as much energy. Under these conditions it may take fewer amp hours to get up to the
voltage/amp criteria than were discharged, making the measurement read over 100% efficient.
However this is rarely sustained for more than 1 cycle, since the temperature can’t drop forever—and
unlikely for 4 cycles. If later the temperature rises again, for the opposite reason as described above,
the battery may now appear unusually inefficient over 1 cycle, as the battery will happily absorb more
amp hours now to get up to the same apparent state of charge, now that it is warm again, giving the
impression of inefficiency for that cycle. Over several cycles, however, the temperature can’t continue
to rise or decline radically, so over 4, or especially 15 cycles this will average out to a “true” efficiency.
6.D. Output control Relay programming and operation
Refer to programming mode section 6A P30-P31 for programming the relay setpoints . See section
2 “Relay Output control” for relay requirements.
6.E. List of each alarm option (total 10),
Each of 5 alarms may be turned off, or may manifest as a “visual alarm” only, or both visual
and audible. These choices are specified as described in Section 6.A: Program modes P26, P27,
P28, P29.
Visual Alarms
A “visual alarm” causes the “alarm lamp” to flash as soon as the alarm condition is met and goes off
when the alarm condition is no longer met. While the alarm is occurring you can push the “alarm
off/on” switch to view and identify the particular alarm. If more than one alarm is active, the display will
alternate between all active alarms.
Audible alarms
An “audible alarm” does all that the “visual alarm” does, but in addition, when the alarm first begins, it
starts a distinctive, rather quiet, sequence of tones to draw attention to the new alarm. There are
several different tone sequences depending on the alarm type. You can further identify the alarm by
pushing the “alarm on/off” switch and viewing the alarm type in the display. This also silences the
audible alarm. The alarm will not become audible again until the alarm condition first stops, then goes
again into the alarm state.
Alarm option list
There are a total of four alarms (and one “notice) for each of up to two battery banks. Battery 1 refers
to the battery bank being measured by Volts1 and Amps1. Battery 2 refers to the bank being
measured by Volts2 and Amps2. Alarms are listed as follows:
6.E.1:“Battery low”:
This results in an alarm when the battery voltage (AD1 or AD2) is less than the “battery low”
setpoint or when the “battery % full” (AD22 or AD23 ) is less than “battery % low” setpoint. There is
one alarm for “battery 1” and another for “battery 2”. Refer to programming section 6.A, P22, P24,
P26 and P28 for instructions on setting these up.
6.E.2: Battery meets charged criteria: (should be called a “notice”, not alarm)
This “notice” is activated when the “battery charged” setpoints are reached, as set by program
modes P32, P33. Although this operates like an alarm, this really might better be called a “notice”,
since the fact that the battery has reached the “charged” criteria is not usually “alarming”—but
36
might want to be “noted”, for example to turn off a generator. To activate these refer to Section
6.A, under P22, P24, P32, P33. .Section 7 describes in detail how the PentaMetric senses that the
batteries are charged.
6.E.3: Battery voltage high”
This results in an alarm when battery 1 voltage (AD1 or AD2) is greater than “battery high” voltage
setpoint or battery 1 “battery % full” (AD22 or AD23) is greater than “battery % high” setpoint. To
set these, refer to Section 6.A, under P22, P24,P27, P29.
6.E.4: Time to recharge battery.
The purpose of this alarm is to remind you to recharge the battery if too much time has elapsed
since it was last charged. To maximize their life, lead acid batteries should not go too long between
being fully charged. By entering a “number of days” ( for example, “5”) in P37, and enabling this
alarm it will remind you to charge the batteries fully if more than 5 days have elapsed since the
PentaMetric sensed that the batteries were charged. The time entered here applies to both battery
1 and battery 2. Refer to Section 6.A, under P23, P25, P37 for setup information.
6.E.5: Time to equalize battery
With “liquid electrolyte” lead acid batteries it is often recommended to “equalize” a battery system
periodically—for example every 30 to 60 days. “Equalization” is a controlled overcharge of the
batteries. In some cases this is accomplished by the user initiating the process. Some inverters or
charge controllers may do automatic periodic equalizations—however this “alarm” would typically
be used to remind a user to equalize batteries when the equalization requires operator intervention
to accomplish. It is no more (or less) than a “timed alarm” that could be used for any purpose to
remind after a certain number of days have elapsed. You set the “number of days” by program
P36. Then after that number of days elapses the alarm occurs—after which you must manually
reset the time to 0. The display modes AD26 and AD27 view a timer which advances by 1.00 for
each passing day. While viewing AD26 or AD27 (“Days since equalized, for Battery 1 or battery 2)
the display can be manually reset to 0 using the reset button. It does not automatically reset when
batteries are equalized. The alarm will again occur when this number of days shown in AD26 (or
AD27) exceeds the number programmed in P36.
Section 7. How the PentaMetric keeps track of battery “state of
charge”
This discussion affects the following displays: Amp Hour1 (AD13), Amp Hour2 (AD14), Battery %
full (AD22, AD23), Days since charged, (AD24, AD25).
For the PentaMetric to properly keep track of “state of charge” data in the following program
modes must be correctly entered: Battery Capacity (P14 and P15), Battery “charged” criteria (P32
and P33), Efficiency factor (P34) and Self Discharge current (P35).
Overview of requirements for keeping track of state of charge. The PentaMetric can keep track of
the battery “state of charge” for up to two battery banks which share a common negative connection.
Each battery bank that is to be measured must have a shunt in series with the negative leg to monitor
all current in and out of the battery, as shown in figure 1. The shunt must be connected as shown to
the “Amps 1” or “Amps 2” channel. It is not possible to use Amps 3 channel for keeping track of battery
“state of charge”. The battery bank measured by #1 Amps and #1 Volts is defined as “Battery1” and
the bank measured by #2 Amps and #2 Volts is defined as “Battery 2”. The battery bank capacity (in
amp hours) must be entered in program P14 and/or P15. Also important is to set correct “charged
voltage” and “charged current” setpoints in program P32 and/or P33, and appropriate values of
“efficiency factor” in P34 and P35 as we will discuss in this section.
7.A: Details of how the PentaMetric keeps track of battery state of charge
Step 1. Initially the battery must be fully charged. The PentaMetric senses this by monitoring
the voltage (AD3) and charge current (AD10) to the battery. When the battery is fully charged
the “battery %full” display (AD22) will be set to “100%” and the “amp hours” (AD13) will be
reset to 0. When first charging a battery that is not well charged, the voltage will first begin to rise
37
slowly. Eventually, as the battery begins to approach full charge the voltage will rise to the “bulk
voltage” setting of the charger. (This charger could be an inverter charger or solar charge controller.)
The voltage is prevented from exceeding this “bulk voltage” by the charger to prevent the battery
from gassing excessively. Further charging takes place while this voltage is maintained, however,
and as this occurs the current (amps) will gradually decline indicating that the batteries are becoming
more and more charged—typically requiring several hours for lead acid batteries. The battery can be
assumed to be well charged when the “amps” value declines to a sufficiently low value. The
PentaMetric determines that the batteries are well charged when the (filtered) voltage (AD3) exceeds
the “Charged setpoint voltage” (P32), (usually set just below the “bulk” charge control setting,) and
when the (filtered) amps (AD7) becomes less than the “Charged setpoint current” (P33).
Recommended values for “charged setpoint volts and amps” (P32 and P33) will be discussed
below. When the PentaMetric senses that the batteries are “charged” the following happens:
1. The “days since charged” display(AD24) will reset to 0
Then, as soon as the battery begins to discharge again i.e when the filtered amps (AD10) become
negative:
2. The “amp-hours” (AD13) measuring the battery will be reset to 0.
3. The “battery % full” (AD22) will reset to 100%
Step 2.Starting from this point of “100% charged”, as the battery is subsequently discharged
(amps are negative) the PentaMetric measures the charge that is removed (“amp hours” or
“amps times the time elapsed”) This will cause the “amp hours from full” (AD13) to become
more negative starting from 0. At the same time the “battery % full” will decrease
proportionally from 100%, to keep track of how full the battery is. The “Battery % full” tracks the
charge removed—at a rate determined by the “amp hour capacity” that is programmed in P14. So,
for example, if the “amp hour capacity” is programmed to 1000 amp hours, then if 100 amp hours are
removed from the battery, (for example, by having a 20 amp load for 5 hours) the “Battery % full” will
display 90%, and when 200 amp hours are removed “Battery % full” will read 80%, etc. Finally when
1000 or more amp hours are removed it will show 0%. Conversely whenever the battery is “charged”
(amps are positive) the numbers will go the opposite way. However all this is subject to the
following compensation for battery self discharge:
Compensating for battery self discharge: An ideal battery would allow you to extract during
discharge the same number of amp hours that were delivered into it while charging. Real
batteries, however, have a self discharge current that causes some loss of charge even when
there is no load on the batteries. To take this into account the PentaMetric allows two different
methods for compensating for this. It is not intended that both methods be used simultaneously
(although the meter does allow this if desired). Ordinarily just one of these methods should be
selected;
Method 1: “Using a charge efficiency factor: This is the more “traditional” method used by
the TriMetric battery monitor, and the method used by some other similar monitors. This counts
the amp-hours discharged (in AD13 or AD14) exactly, at 100% rate, but when adding amphours back (charging) they are counted at a lesser value, for example only 94% of actual
charge. This requires that to make the “battery % full” display go back up to 100% charged,
slightly more charge (6% more in this case) must be put back compared to what was
discharged. This is the effect produced by the “efficiency factor” setting (Program mode P34)
which is set at the factory to a recommended value of 94%, however you may program this to
any value you wish from 60 to 100%. To disable this function you should set it to 100%.
Method 2: Using a constant self discharge current: This method has not been used to our
knowledge, however it is probably closer to the way which “self discharge” actually occurs in a
battery. This method is to assume a constant amount of leakage (in amperes) and constantly
subtract that amount from the amp-hour total at all times. This is the “self discharge current”
(Program mode P35) which is set at the factory to 0. However you may set it to any value from
0.00 amps to 9.99 amps. The actual self discharge can vary with type of battery, temperature
and age of the batteries; however it is approximated here as a constant current. A typical lead
acid battery can have a “self discharge” that is 1% of capacity per day. For a 1000A-hr battery
bank this would be 10 amp hours/day, which is 10/24= 0.40 amps.
38
Step 3. Typically during step 2 the battery will track state of charge closely, but not exactly because
the self discharge will not be compensated precisely. Usually the recommended values will cause
the “battery % full” to read slightly lower than true, thus giving a conservative view of remaining
charge left in the batteries. However when the battery is again fully charged, the meter will
again reset to “100%” to resynchronize the battery with the meter, and then the meter will
continue as in step 2.
7.B: Deciding on programmed value for P14, P15, P32-P35.
P14, P15: Battery capacity. To keep track of “Battery % Full” you must program a non zero
value of “battery capacity”. When this is done, the meter will keep track of the battery % full
as described above in 7.A. If this number is programmed to 0, the meter will assume that no
battery is present, and no compensation for self discharge will occur, and the reset of “amp
hours” and “battery % full” will not take place as described in section 7.A. The main effect of
the “battery capacity” value is to determine the “scale” of the “battery % full” display. It changes the
rate at which the “battery % full” display declines as amp hours are removed from your batteries, as
described above in Step 2. Enter the value of your battery system capacity, in total amp hours. It is
often useful to enter a value that is lower than your actual battery capacity: from 50 to 75% of the
“nameplate” capacity. The reason is that you typically shouldn’t run your batteries right down to the
bottom of their charge. Also frequently in actual practice you will not get as much capacity as the
“nameplate” number suggests—as they are often overly optimistic. Refer to section 6.A under P14,
P15 for more information on the effect of this data.
P32, P33: Battery “charged” criteria. These are the voltage and current setpoints described above
in Step 1. Usually the “voltage setpoint” should be set to a voltage slightly lower than the “bulk
charging voltage” of a solar or generator (or other) charging system. This would be typically about
14.3 volts for a 12V lead acid “liquid electrolyte” battery system. Multiply this number by 2 for a 24V
system, or 4 for a 48V system. If you have sealed type of batteries (which do not have watering
holes at the top) this voltage will usually be a little lower. You should consult the battery
manufacturer for proper charger bulk voltage setting (that you set on your chargers) as it is
particularly important for sealed batteries to use a bulk voltage that is neither too high or too low.
Then set the “voltage setpoint” on the PentaMetric slightly below this point. A typical value for the
“current setpoint” can be found by dividing the system battery capacity (in Amp-hours) by 50 to find
the “amps” value to enter. A more stringent criterion can be imposed by reducing this “amps” value,
or it may be made less stringent by increasing it.
P34: Efficiency factor and P35: Self discharge current: Set the Efficiency factor to 94% and the
self discharge current to 0 if you are not sure what values to use. There is more information on
these in section 6.A under P34-P35, and also in the next paragraph.
Why not use the PentaMetric measurements of “battery efficiency” for these? Although you
must enter the value of “efficiency factor” (P34) and “self discharge current” (P35) that the
PentaMetric uses for keeping track of “Battery % Full”, they are also measured by the PentaMetric,
as described in section 6.C.3: System “battery efficiency cycle” data. As described there (in
excruciating detail), the amount of “self discharge” loss is measured for each charge/discharge
cycle—and the result of this measurement is expressed in two forms: one as the “battery efficiency”
per cycle, and also, simultaneously as the “self discharge” current, in “amperes”. It is computed for
the last 1, 4 or 15 cycles. Note that although the answer is supplied in two forms, they are both
measuring the same thing. As we have not gained enough experience yet with these measurements
we don’t have yet advice that we can give with confidence that these numbers can be used and
directly entered into P34-P35. Also keep in mind that the calculation there for “self discharge”
includes strictly speaking more than just the “self discharge” current. It also includes in that
measurement the current loss at the “top of charge” due to gassing when the battery is less efficient
due to the conversion of some battery electrolyte to hydrogen and oxygen gas. Also, pointed out in
section 6.C.3,it should be noted that one single cycle can give misleading results if the temperature
varies from one cycle to another—as a rise in temperature can show misleadingly low efficiency, and
a drop in temperature can show misleadingly high efficiency. Taking a 4 or 15 cycle sequential
average, however, should eliminate that problem, as the temperature cannot rise or drop a great
amount over many cycles.
39