1
9
99 Washington Street
Melrose, MA 02176
Phone 781-665-1400
Toll Free 1-800-517-8431
Visit us at www.TestEquipmentDepot.com
3.3 GHz/8.5 GHz Spectrum Analyzer
Model 2650A/2651 Series
USER MANUAL
Test Equipment Depot - 800.517.8431 - 99 Washington Street Melrose, MA 02176
FAX 781.665.0780 - TestEquipmentDepot.com
Before Using the Product
· Please note the following described on the back panel.
· For safe use:
1) When a bnormal s ound, abnormal s mell or smoke is found, stop us ing the
product and remove the battery and AC adapter.
2) Never handle this product with wet hands to prevent risks of electric shock, fire,
or damage.
3) Never use this product under lightning conditions to prevent risks of damage.
4) Never us e any AC a dapter ot her t han s pecified, or it w ill caus e da mage.
Connect the power cable only to three-terminal outlet for protection from static
electricity, otherwise this product or a device under test may be damaged.
5) Never use any battery other than specified, or it may damage this product. Turn
off the power and disconnect the AC adapter before removing the battery out of
the battery compartment.
6) Be sure to charge the battery as specified in the instructions in this manual.
Moreover, an explosion, fire or smoke may occur if battery is handled
improperly.
Please read the notes for handling the battery.
i
· Set clock function
The time information is set at Japan standard time. Set the year, month, day and
time when the 2650A series is used for the first time. (Refer to “24.4 Setting
the clock” for the details.)
· Quality assurance
Warranty
If the defect by our responsibility occurs within one year after delivered, it
shall be repaired free of charge. However, this warranty does not cover such
defect that :
1) is caused by a fire or natural disasters.
2) is caused by inappropriate handling such as dropping while moving the
unit delivered.
3) is caused by handling in contradiction to usage or precautions described
in the operating manual.
4) is caused by modification or misuse.
We will not be responsible for direct or indirect damage caused by use or
defect of this product.
Refer to the end of this manual for details.
Warm-up time
Warm up the product for at least ten minutes after turning on the power in
order to stabilize the internal circuit.
Precautions for storage
1) Avoid direct sunlight or dust.
2) Store this unit in a place where temperature is between -20 °C to 60 °C,
humidity less than 60 °C/70 %RH and variations in temperature and
humidity are small.
ii
Contents
1.
OUTLINE --------------------------------------------------------------------------------------1
1.1
1.2
1.3
1.4
2.
PRODUCT OUTLINES -------------------------------------------------------------------------- 1
STANDARD ACCESSORIES ------------------------------------------------------------------- 2
OPTIONAL ACCESSORIES -------------------------------------------------------------------- 2
OVERVIEW OF ALL FOUR MODELS ---------------------------------------------------------- 3
SPECIFICATIONS--------------------------------------------------------------------------4
2.1
2.2
PERFORMANCE-------------------------------------------------------------------------------- 4
EXTERNAL VIEW ------------------------------------------------------------------------------- 7
3.
EXPLANATION OF PANEL -------------------------------------------------------------8
4.
EXPLANATION OF SCREEN --------------------------------------------------------- 11
5.
FUNCTION MENU------------------------------------------------------------------------ 12
5.1
5.2
6.
LIST OF FUNCTION MENU------------------------------------------------------------------ 12
MENU TREE ---------------------------------------------------------------------------------- 13
PREPARING FOR OPERATION ----------------------------------------------------- 19
6.1
6.2
6.3
6.4
7.
STAND ---------------------------------------------------------------------------------------- 19
CONNECTION TO POWER SUPPLY -------------------------------------------------------- 19
BATTERY CHARGE -------------------------------------------------------------------------- 20
INSTALLATION OF BATTERY --------------------------------------------------------------- 20
CENTER FREQUENCY <FREQ> ---------------------------------------------------- 21
7.1
7.2
7.3
7.4
8.
SETTING WITH STEP KEYS ( [F1], [F2] ) ------------------------------------------------- 21
SETTING WITH ENCODER ------------------------------------------------------------------ 21
SETTING WITH NUMERIC KEY-------------------------------------------------------------- 22
ACCORDING TO MARKER POSITION ----------------------------------------------------- 23
FREQUENCY SPAN <SPAN> -------------------------------------------------------- 23
8.1
9.
SWITCHING FREQUENCY BAND ----------------------------------------------------------- 24
REFERENCE LEVEL <REFER> ----------------------------------------------------- 25
9.1
9.2
9.3
9.4
9.5
9.6
9.7
9.8
10.
10.1
11.
11.1
11.2
11.3
SETTING OF REFERENCE LEVEL --------------------------------------------------------- 25
CHANGE OF UNIT OF AMPLITUDE AXIS -------------------------------------------------- 25
SETTING OF STEP SIZE OF REFERENCE LEVEL---------------------------------------- 25
ON-OFF SETTING OF OFFSET ------------------------------------------------------------ 25
SETTING OF OFFSET LEVEL --------------------------------------------------------------- 25
SETTING OF INPUT IMPEDANCE----------------------------------------------------------- 26
REFERENCE LEVEL SETTING RANGE FOR EACH UNIT ------------------------------- 26
RELATIONSHIP BETWEEN REFERENCE LEVEL AND ATT/AMP (AT DBM) ---------- 27
DISPLAY SCALE <SCALE> ------------------------------------------------------- 28
SETTING THE FUNCTION KEY ------------------------------------------------------------- 28
RESOLUTION BANDWIDTH <RBW> ------------------------------------------- 28
MANUAL MODE ---------------------------------------------------------------------------- 28
AUTO MODE -------------------------------------------------------------------------------- 29
ALL AUTO MODE -------------------------------------------------------------------------- 29
iii
12.
12.1
12.2
12.3
13.
13.1
13.2
13.3
13.4
13.5
VIDEO BANDWIDTH <VBW>------------------------------------------------------ 29
MANUAL MODE ---------------------------------------------------------------------------- 29
AUTO MODE -------------------------------------------------------------------------------- 29
ALL AUTO MODE -------------------------------------------------------------------------- 30
SWEEP AXIS / DETECTION MODE <SWEEP> ------------------------------ 30
MANUAL MODE ---------------------------------------------------------------------------- 30
AUTO MODE -------------------------------------------------------------------------------- 30
ALL AUTO MODE -------------------------------------------------------------------------- 30
SETTING OF DETECTION MODE ---------------------------------------------------------- 30
SETTING OF TRIGGER SOURCE ---------------------------------------------------------- 31
14.
AUTO TUNING <AUTO TUNE> --------------------------------------------------- 31
15.
HOLD / RUN <HOLD/RUN> -------------------------------------------------------- 31
16.
CALCULATION FUNCTION <CALC> ------------------------------------------- 32
16.1
16.2
16.3
16.4
16.5
16.6
17.
17.1
17.2
17.3
17.4
18.
18.1
18.2
18.3
18.4
18.5
18.6
19.
19.1
19.2
19.3
19.4
19.5
19.6
20.
20.1
20.2
21.
21.1
21.2
21.3
NORMAL MODE ---------------------------------------------------------------------------- 32
MAX HOLD MODE ------------------------------------------------------------------------- 32
MIN HOLD MODE -------------------------------------------------------------------------- 32
AVERAGE MODE -------------------------------------------------------------------------- 33
OVERWRITE MODE ---------------------------------------------------------------------- 33
SPURIOUS FREE MODE (2658A ONLY) ---------------------------------------------- 33
MARKER & PEAK SEARCH <MKR> ------------------------------------------- 34
MOVEMENT AND BASIC FUNCTION OF MARKER --------------------------------------- 35
NORMAL PEAK SEARCH ------------------------------------------------------------------- 35
ZONE PEAK SEARCH ----------------------------------------------------------------------- 35
CHANGE UNIT OF MARKER LEVEL ------------------------------------------------------- 36
SAVE / LOAD <SAVE/LOAD> ---------------------------------------------------- 36
SELECTION OF STORAGE DEVICE -------------------------------------------------------- 37
SAVE FUNCTION ---------------------------------------------------------------------------- 38
ABOUT FILE NAME -------------------------------------------------------------------------- 38
LOAD FUNCTION ---------------------------------------------------------------------------- 39
DELETE FUNCTION ------------------------------------------------------------------------- 40
PRESETTING (INITIALIZATION) ------------------------------------------------------------ 40
MEASURING FUNCTION <MEAS> ---------------------------------------------- 41
CHANNEL POWER MEASUREMNT <CH POWER> ------------------------------------ 41
ADJACENT CHANNEL LEAKAGE POWER MEASUREMENT <ACP> ------------------ 42
OCCUPIED BANDWIDTH MEASUREMENT <OBW> ------------------------------------- 44
ELECTRIC FIELD STRENGTH MEASUREMENT <E/F ANT> --------------------------- 44
MAGNETIC FIELD STRENGTH MEASUREMENT <M/F PROBE> --------------------- 48
FREQUENCY COUNTER <FREQ COUNT> --------------------------------------------- 50
EMI TEST (2651) ---------------------------------------------------------------------- 50
ADDITIONAL FUNCTION FOR EMI TEST ------------------------------------------------- 50
EMI TEST ------------------------------------------------------------------------------------ 51
SCREEN CONTROL <DSPL> ----------------------------------------------------- 53
SETTING SCREEN DISPLAY COLOR ------------------------------------------------------ 54
ON/OFF SWITCHING OF LCD BACKLIGHT --------------------------------------------- 54
ADJUSTING BRIGHTNESS OF LCD BACKLIGHT----------------------------------------- 54
iv
22.
22.1
22.2
22.3
22.4
23.
23.1
23.2
23.3
23.4
23.5
23.6
24.
24.1
24.2
24.3
24.4
25.
25.1
25.2
25.3
25.4
25.5
25.6
25.7
25.8
TRACKING GENERATOR MODE (2652A) ------------------------------------ 54
SPECIFICATION OF T.G. FUNCTION ------------------------------------------------------ 54
DESCRIPTION OF I/O CONNECTOR------------------------------------------------------- 55
ON/OFF SWITCHING OF T.G. FUNCTION ----------------------------------------------- 55
NORMALIZING FUNCTION ------------------------------------------------------------------ 56
STORAGE/PRINT SCREEN IMAGE <COPY> -------------------------------- 57
SELECTION OF IMAGE AREA -------------------------------------------------------------- 57
PRINT ON PRINTER ------------------------------------------------------------------------- 57
STORAGE INTO USB MEMORY ----------------------------------------------------------- 57
TRANSFERRING INTERNAL DATA TO USB MEMORY IN LUMP SUM ----------------- 58
USB PRINTER (OPTION) ------------------------------------------------------------------- 58
USB MEMORY ------------------------------------------------------------------------------- 59
UTILITY FUNCTION <UTIL> ------------------------------------------------------- 60
LABEL FUNCTION --------------------------------------------------------------------------- 60
MENU OFF ----------------------------------------------------------------------------------- 61
BUZZER SETTING --------------------------------------------------------------------------- 61
SETTING THE CLOCK ----------------------------------------------------------------------- 61
USB DEVICE FUNCTION ----------------------------------------------------------- 63
OUTLINE -------------------------------------------------------------------------------------- 63
HOW TO CONNECT ------------------------------------------------------------------------- 63
INSTALLATION OF DRIVER ----------------------------------------------------------------- 63
SAMPLE PROGRAM ------------------------------------------------------------------------- 63
EXPLANATION OF COMMAND-------------------------------------------------------------- 64
INPUT OF FREQUENCY --------------------------------------------------------------------- 73
TRANSFER OF SPECTRUM DATA --------------------------------------------------------- 73
WRITING OF ORIGINAL COMPENSATION DATA ----------------------------------------- 74
26.
OPTION ---------------------------------------------------------------------------------- 76
27.
BASIC PERFORMANCE TEST (2650A/2651/2652A/2658A) ------------ 77
27.1
27.2
27.3
27.4
27.5
FREQUENCY CHARACTERISTICS --------------------------------------------------------- 77
ACCURACY OF REFERENCE LEVEL ------------------------------------------------------ 78
DISPLAY ACCURACY OF CENTER FREQUENCY ---------------------------------------- 78
DISPLAY ACCURACY OF FREQUENCY SPAN -------------------------------------------- 79
LINEARITY OF AMPLITUDE AXIS ---------------------------------------------------------- 79
v
1. Outline
1.1 Product outlines
The 2650A series are authentic s pectrum an alyzers in a compact a nd l ightweight f orm f actor pr oviding
performance and functions comparable to large-size bench type instruments.
The features are as follows.
1) Compact and lightweight 1.8 kg.
The dimensions are 162(W)×71(H)×265(D) mm, and the weight is only 1.8 kg including the battery, making the
instrument very convenient for field use.
2) Large color TFT display
5.7 inches, 640×480 color LCD
3) Four hours battery operation
The included Lithium-ion battery, when fully charged, can provide power for up to four hours of operation with the
backlight turned off. And about 3 ½ hours with the backlight set to the minimum level.
4) USB host adapter
USB host port can be used with removable storage USB flash drives. The screen image is stored as BMP format, and
the spectrum and the setting parameters are stored as CSV format. The port conforms to USB 1.1 standards and is
backwards compatible with USB 2.0 devices.
5) USB device for PC connectivity
USB interface with transfer rates up to 12 Mbps maximum (conform to USB 1.1 standards).
6) Accurate frequency measurement by PLL synthesizer
The center frequency is accurately set by PLL (Phase Locked Loop) synthesizer. Moreover, the frequency counter
(factory option) enables more accurate measurements of the frequency of a signal.
7) Average noise level -127 dBm
The low average noise level of -127 dBm @ 1 GHz provides a wide dynamic range.
8) 100 dB display dynamic range
Wide dynamic range display with a display scale of 100 dB/10div (at 10 dB/div) in the amplitude axis.
9) Easy operation with AUTO mode
● Auto range operation: RBW, VBW and sweep time are automatically selected based on the frequency span.
● Auto tuning operation: The center frequency is adjusted to the maximum level within full span, and the optimum
RBW, VBW and sweep time are chosen.
1
10) Abundant functions
● Measuring functions : Channel power, Adjacent channel power, Occupied bandwidth, Electric field
strength, Magnetic field strength and Frequency measurement.
● Calculation functions : Max hold, Min hold, Averaging, Over write
● Marker measurement and peak search function
● Save/Load function
● Hard copy with printer
11) PC Software
The included PC software controls all four models of the 2650A/2651 series via PC. The software emulates the front panel keys
and supports transfer of 1001 point trace data from the analyzer to the PC. Screen images can be stored in BMP format and the
spectrum data in CSV format (stores frequency and level).
12) Options
There are many options available, such as dipole antennas, magnetic field probes and USB printer
1.2 Standard accessories
1. AC adaptor MA400
2. Carrying case LC2650A
3. Accessory pouch
4. User manual
5. PC software and USB cable
6. Lithium Ion battery MB400
1.3 Optional accessories
1. Dipole antennas M401, M402, M403, M404, M405, M406
2. Magnetic field probe PR 26M with a dedicated double shielded coaxial cable
3. Printer PT2650A with AC adaptor, 4pcs of AA batteries, one roll paper
4. Roll paper PX2650A for PT2650A printer (with 10 rolls)
2
1.4 Overview of all four models
Model
2650A
2658A
2652A
2651
Contents
50 kHz to 3.3 GHz
Applications: Cellular phone, 2.4 GHz wireless LAN, 2.5 GHz WiMAX, RF-ID,
Broadcasting
50 kHz to 8.5 GHz
Covering most of the wireless communication frequency spectrum
Applications: 5 GHz wireless LAN, 3.5/5.8 GHz WiMAX, Maintenance of wireless base
station
50 kHz to 3.3 GHz
With 5 MHz to 3.3 GHz tracking generator
Applications: Frequency characteristics measurement of electronic component/circuit and
return loss measurement
50 kHz to 3.3 GHz
For EMI test
Applications: Radiated and conducted emission measurement
3
2. Specifications
2.1 Performance
Frequency section
Frequency range
Center frequency
Setting
resolution
Accuracy
RBW
frequency
error
Frequency span
Setting range
Accuracy
Display resolution
# of points per trace
Resolution bandwidth
2650A, 2652A, 2651
50 kHz to 3.3 GHz
2658A
50 kHz to 8.5 GHz
―――
Frequency
range
50 k to 3.5
GHz
3.3 G to 6.3
GHz
6.1 G to 8.5
GHz
Frequency
band
Base band
Harmonic
order
1
Band 1-
1
Band 1+
1
20 kHz
Allows rotary encoder, numeric key and function key
within ± (30+20T) kHz±1 dot
within ±(30+20T) kHz ± 1 dot
@frequency span: 200 kHz to 10 MHz,
@frequency span: 200 kHz to 10 MHz,
RBW 3 kHz, 23±5°C
RBW 3 kHz, 23±5°C
within ± (60+300T) kHz±1dot
within ± (60+300T) kHz±1dot
@frequency span: 20 MHz to 3.3 GHz,
@frequency span: 20 MHz to 8.5 GHz,
RBW 100 kHz、23±5°C
RBW 100 kHz, 23±5°C
T: sweep time (s)
T: sweep time (s)
within ±4 kHz @ 3 kHz, 10 kHz, 30 kHz
within 20% of RBW @ RBW: 100 kHz, 300 kHz
within 10% of RBW @ RBW: 1 MHz, 3 MHz
0 Hz (zero span),
0 Hz (zero span),
200 kHz to 2 GHz (1-2-5 step) and
200 kHz to 5 GHz (1-2-5 step) and
3.3 GHz (full span)
8.5 GHz (full span)
within ±3% ±1dot
@ sweep time of 0.3s, 23±5 °C
501dots on LCD screen, 1001dots readout via PC
(501 dots are visible on the display, 1001 dots of trace data are captured internally and can be
transferred to a PC via USB device interface.)
3 dB bandwidth (6 dB for 2651 @ 9 kHz, 120 kHz)
Setting range
3 kHz to 3 MHz (1-3 step) and AUTO
(2651: 3 kHz, 9 kHz, 30 kHz, 120 kHz, 300 kHz, 1 MHz, 3 MHz)
Accuracy
±20%
Selectivity
1:12 (typical, 3 dB : 60 dB)
Video bandwidth
100 Hz to 1 MHz (1-3 step) and AUTO
SSB phase noise
-90 dBc/Hz (typical)
@100 kHz offset, RBW : 3 kHz, VBW : 100 Hz, sweep time: 1 s
Spurious response
less than -60 dBc
Harmonics
less than -40 dBc @ ≧100 MHz
4
Amplitude section
Reference level
Setting range
Accuracy
2650A, 2652A, 2651
2658A
+10 to -60 dBm (1dB step)
Frequency
characteristics
Input impedance
within ± 0.8 dB ± 1 dot
@ center frequency : 100 MHz, RBW : 3 MHz, VBW : 1 MHz, REF : -15 dBm, 23±5 °C
dBm, dBV, dBmV, dBμV, dBμV/m, dBμA/m
(dBμV/m and dBμA/m are used for measurement functions)
-127 dBm (typical) @ CF : 1 GHz, RBW : 3 kHz, VBW : 100 Hz, Ref. level < - 40dBm ( preamp
automatically ON)
within ±2.0 dB ±1dot @50 kHz to 100 MHz
within ±2.0 dB ±1dot @50 kHz to 100 MHz
within ±1.0 dB ±1dot @ 100 MHz to 3.3 GHz within ±1.0 dB ±1dot @100 MHz to 8.5 GHz
50 Ω
Input VSWR
less than 2.0
Unit
Average noise level
Input attenuator
Operating
range
0 to 25 dB (1 dB step), coupled with reference level
Switching
error
±0.6 dB @100 MHz
RBW switching error
±0.6 dB
Display resolution
(vertical)
Scale
Display
scale
Accuracy
381 dots/10div
Input damage level
10 dB/div, 5 dB/div, 2 dB/div
±(0.2 dB+1dot)/2 dB ±(0.4 dB+1dot)/5 dB
±(0.8 dB+1dot)/10 dB ±(1.8 dB+1dot)/83 dB
+27 dBm (CW average power), 25 VDC
Sweep section
2650A, 2652A, 2651
2658A
10 ms to 30 s and AUTO
@frequency span : 0 to 2 GHz
30 ms to 30 s and AUTO
@frequency span : full span
1-3 step
Within ±0.1 %±1dot
@frequency span : 0 to 2GHz
within ±1.5 %±1dot @ full span
10 ms to 30 s and AUTO
@frequency span : 0 to 2 GHz
30 ms to 30 s and AUTO
@frequency span : 5 GHz, full span
1-3 step
Within ±0.1 %±1dot
@frequency span : 0 to 5GHz
within ±2.5 %±1dot @ full span
Sweep time
Setting range
Accuracy
Trigger
Trigger mode
AUTO (Available only for zero span)
Trigger source
Internal and External
5
External trigger
Input voltage range
Frequency range
Input coupling
Trigger level
Input RC
Input damage level
Input connector
Detection mode
1 to 10 Vp-p
DC to 5 MHz
DC coupling
approx. 0.56 V(fix)
approx. 10 kΩ / less than 15 pF
±50 V(DC+AC peak)
SMA(J)
Positive peak, Negative peak, Sample
( QP and AV for model 2651 only.)
Function
Save
2650A, 2652A, 2658A, 2651 common
NORM:displays frequency (8digits max) and level (4digits max) at marker point.
DELTA:displays frequency difference and level difference between two markers.
Searches for peak level with all of 10 div (NORM mode) or within ZONE specified
(ZONE mode) and displays frequency and level at peak level, and moreover NEXT peak at
NORM mode.
NORM, MAX HOLD, MIN HOLD, AVERAGE, OVER WRITE
Number of sweeps is 2 to 1024 (power of 2 ) and infinite.
Channel power, Adjacent channel power, Occupied bandwidth, Electric field strength
(needs optional dipole antenna), Magnetic field strength (needs optional magnetic field
probe) and Frequency counter
When pressing AUTO TUNE key, the spectrum of maximum level within full span is
adjusted to center, and reference level, RBW, VBW and sweep time are set to optimum
parameters.
Saves 200 spectrums and 200 setting parameters
Load
Loads one spectrum and one setting parameter
Marker measurement
Peak search function
Calculation function
Measuring function
Auto tuning
Save/
Load
General
Input connector
2650A, 2652A, 2658A, 2651 common
N(J) connector
USB Communication
Protocol
Device Connector
USB version 1.1 (will also work with USB 2.0 devices)
B plug
Transfer rate
Hard copy
12 Mbps
USB printer (option) connected to A plug (host) enables hard copy of screen.
host connector
Display
Display
Backlight
Number of dots
Power supply
Dedicated
AC adaptor
A plug
Lithium-ion battery
Charge function
Remainder indication
5.7 inches and color LCD
LED backlight
640(H) x 480(V) dots
Input : 100 to 240 VAC
Output : 9 VDC/2.6 A
MB400 : 7.4 V/5000 mAh Li-Ion battery
Capable of charging during power-off.
Indicates 4 conditions with two colors LED (red and green).
5 level indicator
6
Other
2650A, 2652A, 2658A, 2651 common
0 to 50° C (guaranteed at 23±10 °C, without soft carrying case)
less than 40 °C/80 %RH
(guaranteed at less than 33 °C/70 %RH, without soft carrying case)
Storage temperature
-20 to 60 °C, less than 60 °C/70 %RH
Dimensions
162(W) x 71(H) x 265(D) mm , 6.38 (W) x 2.80 (H) x 10.43 (D) inch
(excluding projections, protection bumper and stand)
Weight
approx. 1.8 kg or 4 lbs (including battery)
* Refer to section 22) Tracking Generator Mode for the specifications of the tracking generator, model 2652A.
Operating temperature
Operating humidity
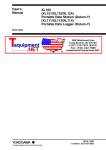
2.2 External view
[Unit : mm]
* B&K Precision reserves the right to make changes in design, specification and other information without prior notice.
7
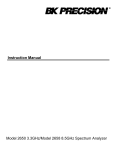
3. Explanation of Panel
1) TFT display
This is a large liquid crystal display with 640 (H) x 480 (V) dots. It simultaneously displays spectrum (10div x
10 div), various setting parameters and measured values.
2) Function key (F1 to F6)
The function can change according to the operation key.
3) Center frequency key
8
The center frequency is set with this key. The setting range is 0 to 3.3 GHz (for 2650A, 2652A, and 2651), and
0 to 8.5 GHz (for 2658A). The setting resolution is 20 kHz.
4) Frequency span key
The frequency span is set with this key.
For 2650A, 2652A, and 2651, it is set in the range from 200 kHz to 2 GHz, ZERO SPAN or FULL SPAN (3.3
GHz). For 2658A, it is set in the range from 200 kHz to 5 GHz, ZERO SPAN or FULL SPAN (8.5 GHz).
5) Reference level key
The reference level is set with this key. It can be set in the range from +10 dBm to –60 dBm by 1 dB step.
6) Resolution bandwidth key
The resolution bandwidth is set with this key. It can be set in the range from 3 kHz to 3 MHz and to AUTO.
7) Video bandwidth key
The video bandwidth is set with this key. It can be set in the range from 100 Hz to 1 MHz and to AUTO.
8) AUTO tuning key
When pushing this key, the spectrum with the maximum level is searched within full span (3.3 GHz @
2650A/2652A/2651 and 8.5 GHz @ 2658A), and then it is adjusted to the center of the screen, and the
optimum setting parameters are set. In the case when in zero span, full span, input signal level lower than –40
dBm and input frequency lower than 50 MHz, this function will not work correctly.
9) Measuring function key
Available for Channel power, Adjacent channel leakage power, Occupied frequency bandwidth, Electric field
strength, and Magnetic field strength measurement.
10) Calculation function key
Available for Max hold, Min hold, Average and Over write.
11) Display scale key
The display scale of amplitude axis can be selected as 2 dB/div, 5 dB/div or 10 dB/div with this key.
12) Sweep key
The sweep time can be set in the range from 10 ms to 30 s or AUTO. This key can also select the detection
mode.
13) Hold/Run key
Used to hold or run measurements.
9
14) Marker & Peak search key
This key is used for setting marker or peak search.
15) Save/Load key
Used for saving or loading a spectrum or settings parameters.
16) Copy key
This key allows the screen image to be printed on USB printer (option) or stored in USB memory.
17) UTIL key
Used for setting label entry, clock, and buzzer.
18) Display control key
Used for setting color, backlight ON/OFF or brightness of backlight.
19) Rotary encoder
This is used for adjusting settings and parameters.
20) Power switch
This is for power ON or OFF.
21) Input connector
N(J) connector
22) Indicator for charging condition
Two color LED indicates the charging conditions of battery.
23) Input connector for DC power source
Connect AC adaptor MA400.
24) USB A plug
For connecting USB printer (option) or USB memory.
25) USB B plug
For interfacing with a PC
10
4. Explanation of Screen
Frequency Axis Setting Values Display
Active Area Display
Center frequency, Frequency span,
Resolution bandwidth, Video bandwidth
Remaining Battery
Display
Amplitude Axis Setting Values Display
Reference level, Input attenuator,
Spectrum Display
10div x 10 div
**UNCAL Display
Display scale
Sweep Axis Setting
UNCAL
Values Display
Sweep time,
Detection mode
Calculation function display
Measuring function display
Operating Information display
Loaded spectrum information display
Function Menu
* This is also used as a display for set values
Upper: Label Display
when the measuring function is used.
Lower: Clock Display
Measured Values display
**UNCAL is displayed when a normal measurement cannot be done due to sweep rate being too fast. In such
cases, slowing down the sweep rate will change this indicator.
11
5. Function Menu
5.1 List of Function Menu
The function menu is shown in the table below. For descriptions of each function, see their respective page. For the
sequence of selection for the function menu, refer to “5.2 Menu tree”.
A
B
Function menu
ACP OFFSET
ACP
ACP WIDTH
ANT
AVG
BACK LT
BACK SPACE
BAND CNTR
BAND WIDTH
C
D
E
BRIGHT
BUZZER
CENTER FREQ ←
CENTER FREQ →
CH POWER
CLEAR
CLOCK CONFIG
COLOR
CONV
DELETE
DEVICE MEM
DET
DISP CLEAR
E/F ANT
EncST
EMI-C **1
EMI-R **1
F
I
K
L
M
FREQ COUNT
IMP
KeyST
LABEL
LOAD
M/F PROBE
MAX HLD
MEAS OFF
MIN HLD
MARKER DELTA
MARKER
NORMAL
Key Sequence
MEAS → (F2)→ F2
MEAS → F2
MEAS → (F2) → F3
MEAS → (F4)→ F1
CALC → F4
DSPL → F2
FREQ → F6 → F5
MEAS → (F1) → (F1)
→ F2
MEAS → (F1) → (F1)
→ F3
DSPL → F3
UTIL → F3
FREQ → F1
FREQ → F2
MEAS → F1
FREQ → F6 → F4
UTIL → F4
DSPL → F1
MKR → F6
SAVE/LOAD → F3
SAVE/LOAD → F4
SWEEP → F4
SAVE/LOAD → F2 →
F5
MEAS → F4
FREQ → F4
SAVE/LOAD → F6 →
F2
SAVE/LOAD → F6 →
F3
MEAS → F6
REFER → F6
FREQ → F3
UTIL → F1
SAVE/LOAD → F2
MEAS → F5
CALC → F2
MEAS → (F1~5) → F6
CALC → F3
MKR → F2
MKR → F1
Page
42
41
42
44
32
53
21
41
M
Function menu
MODE
N
NEXT PEAK
Key Sequence
MEAS → (F1 → F3)
→ F1
MKR → (F4) → F2
NORMAL
CALC → F1
31
NORMAL **1
SAVE/LOAD → F6 →
F1
MEAS → F3
REFER → F5
REFER → F3
CALC → F5
MKR → (F5)→ F1
MKR → F4
50
OBW
OFSdB
OFS STEP
OVR WR
P PEAK SEACH
PEAK SERCH
NORM
PEAK SERCH
MKR → F5
ZONE
PRE SET
SAVE/LOAD → F6
PROBE
MEAS → (F5) → F1
R RATIO
MEAS → (F3) → F2
RBW ALL AUTO
RBW → F3
RBW AUTO
RBW → F2
RBW MANUAL
RBW → F1
REFERENCE
MEAS → (F2) → F4
CENTER
REFERENCE
MEAS → (F2) → F1→
WIDTH
F5
S SAVE
SAVE/LOAD → F1
SCALE 5dB
SCALE → F3
SET MKR
FREQ → F5
SPR. FR **2
CALC → F6
SWEEP AUTO
SWEEP → F2
SWEEP MANUAL
SWEEP → F1
T T.G. MODE **3
SWEEP → F6
TRIG
SWEEP → F5
Ten Key MODE
FREQ → F6
U UNIT
REFER → F1 → 4
V VBW ALL AUTO
VBW → F3
VBW AUTO
VBW → F2
VBW MANUAL
VBW → F1
Z ZONE CENTER
MKR → (F5) → F1
ZONE WIDTH
MKR → (F5) → F2
**1 2651 only **2 2658A only **3 2652A only
O
41
53
59
20
20
41
21
59
53
33
36
36
29
38
43
20
50
50
49
25
20
58
38
47
31
41
31
33
33
12
Page
41 to 43
34
42
24
24
32
34
34
34
36
48
43
28
28
27
42
42
36
27
20
32
29
29
55
30
20
24
29
28
28
35
35
5.2 Menu Tree
The following is the sequence of selection for the function menu. The function menu corresponds to the function key
of F1 to F6.
“Function menu”
FREQ
E/F
M/F
FREQ
PROBE
COUNT
CH POWER
ACP
OBW
ANT
F1
F2
F3
F4
KeyStep
EncStep
SET
Ten Key
100 MHz
10 MHz
MKR
MODE
F5
F6
* Refer to “7. Center Frequency” for details.
CENTER FREQ
: Set the center frequency
BACK
GHz
SPAN
MHz
CLEAR
“.”
SPACE
RETURN
* Refer to “8. Frequency Span” for details.
NORMAL
FULL
ZERO
SPAN
SPAN
SPAN
SPAN
1 GHz
50 MHz
1 MHz
: Set the frequency span
REFER
* Refer to “9. Reference Level” for details.
UNIT
RL STEP
OFS STEP
OFFSET
OFS dB
IMP
dBm
1dB
1dB
OFF
0dB
50Ω
: Set the reference level
13
SCALE
* Refer to “10. Display scale” for details.
SCALE
10dB/
2dB/
5dB/
: Set the display scale
RBW
* Refer to “11. Resolution Bandwidth” for details.
RBW
MANUAL
AUTO
ALL AUTO
: Set the RBW
VBW
* Refer to “12. Video Bandwidth” for details.
VBW
MANUAL
AUTO
ALL AUTO
: Set the VBW
* Refer to “13. Sweep Axis / Detection Mode” for details.
SWEEP
* T.G. MODE is only for 2658A.
SWEEP TIME
MANUAL
AUTO
ALL AUTO
: Set the sweep time
T.G.
NORM
ON
ON
14
DET
TRG
T.G.
SMPL
INT
MODE
CALC
* Refer to “16. Calculation Function” for details.
* “SPR. FR” is only for 2658A.
NORMAL
MAX HLD
MIN HLD
AVG
OVR WR
SPR. FR
256
256
256
256
OFF
: Set the number
MKR
* Refer to “17. Marker & Peak Search” for details.
PEAK SEARCH
MARKER
NORMAL
DELTA
OFF
: Move the marker (NORM mode)
PEAK
NEXT
SEARCH
PEAK
NORMAL
CONV
ZONE
dBm → W
F4: Peak Search
RETURN
: Move the marker (NORM mode)
F5: Zone marker
ZONE
CENTER
WIDTH
RETURN
: Set the zone center frequency (ZONE mode)
15
SAVE/LOAD
* Refer to “18. Save / Load” for details.
Main menu
MODE SELECT
SAVE
LOAD
DEVICE
DELETE
MEM
PRE
USB
SET
Save menu
SAVE
OBJECT
SPECT
PARAM
BOTH
RETURN
EXECUTE
: Set the address to store the spectrum or the parameter
Load menu
File Search Step
10
1
100
LOAD
DISP
EXECUTE
CLEAR
RETURN
: Set the address to call the spectrum or the parameter
Delete menu
DELETE
File Search Step
1
10
100
EXECUTE
RETURN
: Set the address to eliminate the trace or parameter
For 2651
Preset menu for 2651
PRESET
NORMAL
EMI - C
EMI - R
16
MEAS
* Refer to “19. Measuring Function” for details
CH POWER
ACP
OBW
E/F
M/F
Freq
ANT
PROBE
COUNT
: Set the parameter
MODE
BAND
BAND
CENTER
MEAS
OFF
WIDTH
: Set the parameter
ADJ CH
MODE
BAND
OFFSET
MEAS
REFERENCE
WIDTH
CENTER
WIDTH
OFF
: Set the parameter
MODE
RATIO %
Enc Step
MEAS
N%
99.5%
1%
OFF
ANT
MEAS
M401
OFF
Input the probe ID (first time only) *Refer to “19.5 Magnetic field strength measurement” for details.
PROBE
MEAS
CP-2S
OFF
17
DSPL
COPY
UTIL
* Refer to “21. Screen Control” for details
COLOR
BACKLT
BRIGHT
COLOR1
ON
80
* Refer to “23. Storage/Print Screen Image” for details
AREA
PRINT
Bmp->USB
MEM->USB
WHOLE
EXECUTE
COPY
EXECUTE
* Refer to “24. Utility Function” for details
LABEL
012
MENU
BUZZER
CLOCK
OFF
ALARM
CONFIG
abc
ABC
@%*
BACKSP
ENTER
←
→
ENTER
: Select the character
YEAR
MONTH
DATE
HOUR
MIN
08
JUN
30
23
50
: Select the numeric value
18
6. Preparing for Operation
6.1 Stand
Utilize the stand on the back to use the screen in an easier-to-see angle on the desk.
6.2 Connection to power supply
The AC adapter MA400 is used to power the instrument and for charging the MB400 battery. (Charging starts
automatically if the AC adapter is connected and unit is power-off.) Connect the adapter as in the figure below and
connect the AC plug to the power line (100-240 VAC, 50/60 Hz). For static electricity protection, ground the unit
by connecting the three cores if possible. Not grounding the unit can damage the unit and/or device being
measured. Do not use an AC adapter other than the MA400 supplied with the unit. Using an AC adapter other
than the MA400 may cause damage to the unit.
Battery full charge time: approx. 4 hours
Battery operating time: 4 hours maximum
(with backlight set to minimum)
*Tested at normal temperature with initial setting
parameters.
Please make sure to connect to ground.
Connect to 100 to 240 VAC, 50/60 Hz
The battery indicator is divided into five levels and is displayed on the screen. When the mark of the battery
remainder displays , the buzzer will sound even if buzzer is OFF under settings, and the power will turn off
within a few minutes. Ensure to protect any data or measurements promptly by saving into memory to prevent
data lost if the unit shuts down.
19
6.3 Battery Charge
When the unit is powered off and connected to AC adaptor MA400, the battery will be charged. The charging
conditions are indicated by two colors LED , and they correspond to the table below.
Charging condition
On Charge
Completion of Charge
No battery
Abnormal
Color of LED
Red
Green
Green
Blinking Red
Good usage of battery
Remove the battery when unit is connected to the AC adaptor.
Otherwise, battery life will be shortened.
※LED is turned off at power-on.
The “abnormal” condition means that the charging time is more than the time expected, or the battery voltage
is too high.
Note: The battery charges only when the unit is turned off (and the AC adapter connected). It is not possible to
charge the batteries while the unit is turned on. Please charge batteries with ambient temperature
in the range of 0 ºC to 40 ºC.
Caution
Misuse of the battery may cause leaks, abnormal heat, fire or explosion.
For safe use, please observe the following precautions fully.
* Do not short-circuit the terminal of the removed battery.
* Do not cause an impacted shock due to throwing, dropping or striking.
* Do not disassemble or remodel the battery.
* Do not throw the battery into a fire or any sources with heat.
* Do not leave the battery in a place with high temperature.
* Do not wet the terminal of the battery.
* Do not cool the battery, and do not charge it in cold outdoor conditions. It decreases performance
and battery life.
* Do not charge the battery in any other way except according to specifications.
* When you keep the battery, please keep it in a cool, dark environment where humidity is low.
Moreover, please keep it out of reach from children.
If the battery remains not used for a long time, it might decrease its charges.
* Please exchange the battery for a new one (MB400) when operating time extremely shortens.
6.4 Installation of Battery
To install the battery, please turn off the power and unplug the AC adaptor if in use. Remove the battery cover on
the back of the unit by first pressing down with light pressure, then slide towards the direction of the arrow as
shown in Fig.1. Next, put the battery as shown in Fig.2. Move it in the direction of the arrow shown in Fig.3 until it
locks in. Use only the MB400 battery as specified. Otherwise, the unit may cause problems or malfunction.
Fig. 1
Fig. 2
20
Fig. 3
7. Center Frequency <FREQ>
When
is pushed, the following function menu is displayed.
FREQ
CENTER FREQ
KeyStep
EncStep
SET
Ten Key
←
→
100M
0.1M
MKR
Mode
F1
F2
F3
F4
F5
F6
* Center frequency setting range: 0 to 3.3 GHz for 2650A/2652A/2651, 0 to 8.5 GHz for 2658A
* The center frequency may shift for a while (up to 10 sec.), after setting is changed.
7.1 Setting with step keys ( [F1], [F2] )
1. When
F1
is pushed, the center frequency decreases in the set step size.
2. When
F2
is pushed, the center frequency increases in the set step size.
3. Setting step size:
When
is pushed, the step size is changed according to the following.
F3
AUTO
100MHz
10MHz
1MHz
100kHz
20kHz
AUTO : The step size is 1/10 of the frequency span.
However, only for 500 kHz frequency span, the step size is set to 50 kHz.
If the frequency span is less than 500 kHz, the step size is set to 20 kHz.
AUTO is recommended for normal use.
7.2 Setting with encoder
1. By rotating
, the center frequency is changed in the set step size.
2. Setting step size:
When
F4
AUTO
is pushed, the step size is changed according to the following.
100MHz
10MHz
1MHz
100kHz
20kHz
AUTO : The step size is 1/500 of the frequency span
However, if the frequency span is less than 5 MHz, the step size is set to 20 kHz.
AUTO is recommended for normal use.
21
7.3 Setting with numeric key
1. When
F6
is pushed, the following function menu is displayed.
BACK
2.
GHz
MHz
“.”
CLEAR
SPACE
RETURN
F1
F2
F3
F4
F5
F6
F1
,
F4
and
and
F2
F5
correspond to <GHz>, <MHz> and <. >
F3
correspond to <CLEAR> and <BACK SPACE>.
Changing the center frequency by encoder is available in Ten Key Mode.
3. The center frequency can be entered directly according to “Numeric Key Mapping Diagram” as follows.
“Numeric Key Mapping Diagram”
RBW
VBW
AUTO
TUNE
MEAS
CALC
1
2
3
4
5
SCALE
SWEEP
HOLD
RUN
MKR
SAVE
LOAD
6
7
8
9
0
COPY
UTIL
DSPL
.
MHz
GHz
4. The center frequency is determined by inputting the unit of frequency.
To enter the unit,
(
F1
and
UTIL
F2
and
are available.
DSPL
are also available.)
* Any figures below the setting resolution (20 kHz) will be truncated.
5. Change of setting
The setting can be changed before pushing the unit key.
F4
: The setting values are cleared.
F5
: The last input digit is deleted.
22
6. Cancel of Ten Key Mode
By pushing
FREQ
or
, unit will return to function menu.
F6
7.4 According to Marker Position
When
is pushed, the center frequency is set according to the frequency of current marker position.
F5
* Any figures below the setting resolution (20 kHz) will be truncated.
* When the marker is not displayed, this operation is invalid. (The menu option disappears.)
8. Frequency Span <SPAN>
When
SPAN
is pushed, the following function menu is displayed.
NORMAL
FULL
ZERO
SPAN
SPAN
SPAN
1GHz
50MHz
1MHz
F1
F2
F3
F4
F5
F6
By operating
SPAN
, the frequency span is set.
SPAN
2650A / 2652A / 2651
By rotating
, the frequency span is changed in the specified step size as follows.
ZERO
200k
20M
50M
500k
100M
1M
2M
200M
500M
5M
1G
10M
2G
FULL (3.3 GHz)
2658A
1. By rotating
, the frequency span is changed in the specified step size as follows.
ZERO
200k
500k
1M
50M
100M
200M
500M
2. By pushing
F2
2M
1G
5M
10M
2G
5G
F3
FULL (8.5 GHz)
, the frequency span is set to FULL SPAN. Under this condition, the instrument
will return to the former span when the rotary knob is rotated.
3. By pushing
20M
, the frequency span is set to ZERO SPAN.
23
4. When
is pushed and then the setting is FULL or ZERO span, the frequency span is returned to
F1
the last setting.
5. By pushing
F4
~
F6
, the frequency span in function menu is set.
8.1 Switching Frequency Band
2658A has three frequency bands.
Frequency band
Base band
Measured frequency range
50 kHz to 3.5 GHz
Band 1Band 1+
3.3 GHz to 6.3 GHz
6.1 GHz to 8.5 GHz
The frequency band is automatically set to the appropriate band based on the center frequency and span.
(At the span less than 200 MHz, only one band is used.)
When the setting frequency range belongs to two bands, the lower band has priority.
The frequency connection point of two bands is fixed as follows.
Two bands
Base band and Band 1Band 1- and Band 1+
Frequency connection point
3.4 GHz
6.2 GHz
Note: The spectrum may change a little at the frequency connection point.
For accurate measurement, center frequency and span should be set as the measured frequency range in one band.
24
9. Reference Level <REFER>
When
REFER
is pushed, the following function menu is displayed.
UNIT
RL STEP
OFS STEP
OFFSET
OFSdB
IMP
dBm
1dB
1dB
OFF
0.0
50Ω
F1
F2
F3
F4
F5
F6
9.1 Setting of Reference Level
By rotating
, the reference level is changed.
(Refer to “9.7 Reference Level Setting Range for Each Unit” for details.)
9.2 Change of Unit of Amplitude Axis
When
is pushed, the unit is set as follows.
F1
dBm
dBμV
dBmV
dBV
9.3 Setting of Step Size of Reference Level
By pushing
, the step size is changed to 10 dB or 1 dB.
F2
9.4 On-Off Setting of Offset
By pushing
, the offer set ON/OFF is changed.
F4
9.5 Setting of Offset Level
1. By operating
F5
, the offset of reference level is set.
When external amplifier or attenuator is used, the display level can be matched by the offset.
The setting range is -50.0 to 50.0 dB.
The reference level is displayed including the offset.
* If the offset is set, “OFST” is displayed in Amplitude axis setting values display area.
Furthermore, the level at the marker point is displayed including the offset.
25
* If the unit is changed to dBμV, dBmV, dBV or dBm, the offset is automatically changed.
2. By pushing
, the step size of offset is changed. (10 dB, 1 dB, 0.1 dB)
F3
9.6 Setting of Input Impedance
By pushing
F6
, the input compensation can be set to 50 Ω (no offset) or 75 Ω. (5.6 dB offset
compensation)
The reference level is adjusted automatically, based on the input impedance selection. When the input impedance
is set to 75 Ω, the reference level is displayed including offset and conversion of 75Ω. For the amplitude reading to
be correct, a coaxial 50 Ω /75 Ω impedance conversion adapter must be connected to the RF input.
* When “75 Ω” is selected, values in Amplitude axis setting values display area will change according to
75 Ω, and the offset is set to 5.7 dB (insertion loss of 50 Ω /75 Ω adapter ). Moreover, the offset can be
changed.
When the unit at marker point is set to W, V, V/m or other, it is converted correctly from dBm.
* Be sure to attach a coaxial 50 Ω /75 Ω impedance conversion adapter when selecting “75 Ω”
9.7 Reference Level Setting Range for Each Unit
Unit
dBm
dBμV
dBmV
dBV
Maximum
Minimum
Minimum
(shifted spectrum data)
10
-40
117
67
57
7
-3
-53
-60
47
-13
-73
“Available unit in measuring function”
Setting
M401
M402
M403
M404
M405
M406
dBμA/m
(Magnetic field strength
measurement)
CP-2S
Maximum
Minimum
Minimum
(shifted spectrum
data)
143
93
146
96
149
99
150
100
137
87
159
109
160 ~ 203
110 ~ 153
73
76
79
80
67
89
90 ~ 133
Unit
dBμV/m (Electric field strength measurement)
* When the reference level is set between “Minimum” and “Minimum (shifted spectrum data)”, the
spectrum of “Minimum” is shifted and displayed on the screen.
26
* When the reference level is set below “Minimum”, “*S/W AMP” is displayed in Amplitude axis setting
values display area on the screen.
Calculation formula (conversion from dBm)
● A[dBμV] = 107 + X [dBm]
● B[dBmV] = 47 + X [dBm]
● C[dBV] = -13 + X [dBm]
● D[dBμV/m] = 68.8 / λ×√(X/Gar) [dBm]
λ : Wavelength[m]
Gar : Antenna absolute gain[times]
● E[dBμA/m] = 107 + X + F[dBm]
F : Probe calibration coefficient[dB] **changes depending on the
frequency.
9.8 Relationship Between Reference Level and ATT/AMP (at dBm)
REFER
ATT
AMP
REFER
ATT
AMP
REFER
ATT
AMP
REFER
ATT
AMP
(dBm)
(dB)
(dB)
(dBm)
(dB)
(dB)
(dBm)
(dB)
(dB)
(dBm)
(dB)
(dB)
10
25
0
-3
12
0
-16
20
21
-29
7
21
9
24
0
-4
11
0
-17
19
21
-30
6
21
8
23
0
-5
10
0
-18
18
21
-31
5
21
7
22
0
-6
9
0
-19
17
21
-32
4
21
6
21
0
-7
8
0
-20
16
21
-33
3
21
5
20
0
-8
7
0
-21
15
21
-34
2
21
4
19
0
-9
6
0
-22
14
21
-35
1
21
3
18
0
-10
5
0
-23
13
21
-36
5
26
2
17
0
-11
4
0
-24
12
21
-37
4
26
1
16
0
-12
3
0
-25
11
21
-38
3
26
0
15
0
-13
2
0
-26
10
21
-39
2
26
-1
14
0
-14
1
0
-27
9
21
-40
1
26
-2
13
0
-15
0
0
-28
8
21
Internal input attenuator (ATT) and IF amplifier (AMP) are automatically set to the optimum values based on the
reference level (REFER). (The input attenuator cannot be set independently.)
* When the input signal level is higher than the proper level for 1st mixer’s terminal, harmonics distortion and
spurious are generated.
This product is designed so that the input signal level of 1st mixer is determined to proper level based on the
reference level.
27
10. Display Scale <SCALE>
When
SCALE
is pushed, the following function menu is displayed.
SCALE
10div/
F1
5div/
2div/
F2
F3
F4
F5
F6
10.1 Setting the Function Key
1. By pushing
F1
, 10 dB/div display scale is set.
2. By pushing
F2
, 5 dB/div display scale is set.
3. By pushing
F3
, 2 dB/div display scale is set.
11. Resolution Bandwidth <RBW>
When
RBW
is pushed, the following function menu is displayed.
RBW
MANUAL
AUTO
ALL AUTO
F1
F2
F3
F4
F5
F6
11.1 MANUAL Mode
By pushing
By rotating
or rotating
F1
, RBW is set as follows.
2650A/2652A/2658A: 3kHz
2651: 3kHz
, MANUAL mode is set.
9kHz
10kHz
30kHz
30kHz
120kHz
100kHz
300kHz
28
300kHz
1MHz
1MHz
3MHz
3MHz
11.2 AUTO Mode
By pushing
, the optimum RBW is set based on the frequency span and sweep time.
F2
* When AUTO mode is set, “*” is displayed on the right end of RBW setting value display.
11.3 ALL AUTO Mode
By pushing
, the optimum RBW, VBW and sweep time are set based on the frequency span.
F3
* When ALL AUTO mode is set, “*” is displayed on the right end of each setting value display.
* When RBW is set to 3 kHz or 10 kHz, the selectivity at 60 dB becomes larger than an actual value due to SSB
phase noise.
12. Video Bandwidth <VBW>
When
VBW
is pushed, the following function menu is displayed.
VBW
MANUAL
AUTO
ALL AUTO
F1
F2
F3
F4
F5
F6
12.1 MANUAL Mode
By pushing
By rotating
100Hz
or rotating
F1
, MANUAL mode is set.
, VBW is set as follows.
300Hz
100kHz
1kHz
300kHz
3kHz
10kHz
30kHz
1MHz
12.2 AUTO Mode
By pushing
F2
, the optimum VBW is set based on the frequency span and sweep time.
When AUTO mode is set, “*” is displayed on the right end of VBW setting value display.
29
12.3 ALL AUTO Mode
By pushing
, the optimum RBW, VBW and sweep time are set based on the frequency span.
F3
* When ALL AUTO mode is set, “*” is displayed on the right end of each setting value display.
13. Sweep Axis / Detection Mode <SWEEP>
When
SWEEP
is pushed, the following function menu is displayed.
SWEEP
DET
TRIG
T.G.
MANUAL
AUTO
ALL AUTO
SMPL
INT
MODE
F1
F2
F3
F4
F5
F6
* T.G. MODE [F6] is only for 2652A. This menu is not displayed on 2650A, 2651 and 2658A.
For the details, refer to “22. Tracking Generator Mode”. [F5] is only displayed when an external trigger signal is
detected at the trigger port.
13.1 MANUAL Mode
By pushing
F1
By rotating
, sweep time is set as follows.
10ms
or rotating
30ms
0.1s
, MANUAL mode is set.
0.3s
1s
3s
10s
30s
* For 2650A, 2651 and 2652A, when the setting is FULLSPAN, it cannot be set to 10 ms.
* For 2658A, when the setting is 5 GHz SPAN or FULLSPAN, it cannot be set to 10 ms.
13.2 AUTO Mode
By pushing
F2
, the optimum sweep time is set based on the frequency span and RBW.
* When AUTO mode is set, “*” is displayed on the right end of SWEEP setting value display.
13.3 ALL AUTO Mode
By pushing
F3
, the optimum RBW, VBW and sweep time are set based on the frequency span.
* When ALL AUTO mode is set, “*” is displayed on the right end of each setting value display.
13.4 Setting of Detection Mode
(For 2651, refer to “20. EMI test”)
30
By pushing
, the detection mode is set.
F4
POS
SMPL
NEG
POS (Positive Peak): The maximum value of the sample points is detected.
SMPL (Sample): The momentary value of the sample points is detected.
NEG (Negative Peak): The minimum value of the sample points is detected.
13.5 Setting of Trigger Source
By pushing
, the trigger source is set.
F5
INT
EXT
INT: The sweep is automatically repeated. This setting is normally used.
EXT: When the signal over the trigger level (0.56 V) is input to external trigger input, the sweep
starts. The sweep automatically starts without an input. (Available only for zero span)
14. AUTO Tuning <AUTO TUNE>
When
AUTO TUNE
is pushed, the spectrum with the maximum level is searched within full span, and then
it is adjusted to the center of the screen, and the optimum setting parameters are set.
* Set the frequency span before setting AUTO tuning.
* There is no function menu displayed for this mode. Auto tuning will execute upon pushing the key.
* The auto tuning does not operate normally in the following conditions.
1) Zero span
2) Full span
3) The signal level is –40 dBm or lower.
4) The signal frequency is 50 MHz or lower.
15. Hold / Run <HOLD/RUN>
By pushing
HOLD / RUN
, the sweep is switched to halt and continuance.
* There is no function menu displayed for this mode.
31
16. Calculation Function <CALC>
When
is pushed, the following function menu is displayed.
CALC
NORMAL
MAX HLD
MIN HLD
AVG
OVRWR
SPRI FR
* *
* *
56
* *
OFF
F2
F3
F4
F5
F6
F1
* By pushing
HOLD / RUN
* By pushing
F1
~
, the sweep is restarted.
F5
, the calculation function is selected.
, the number of times of the sweep can be set.
By rotating
16.1 NORMAL Mode
1. When
F1
is pushed, the normal mode is set. The calculation is not performed in this mode. The
number of times of the sweep is infinite. This mode is normally used.
* When this mode is set, “NORMAL” is displayed in the CALC area on the screen.
(Refer to “4. Explanation of Screen” for the details.)
16.2 MAX HOLD Mode
1. By the operation of
, the number of times of the sweep in the MAX HOLD mode
F2
is set.
2. The update spectrum data is compared with the data left last time at each point, and the larger one is retained
and displayed.
2
4
256
8
512
16
1024
32
* *
64
128
(infinite)
* When this mode is set, “MAX --- (number of times)” is displayed in the CALC area on the screen.
(Refer to “4. Explanation of Screen” for the details.)
16.3 MIN HOLD Mode
1. By the operation of
F3
, the number of times of the sweep in the MIN HOLD mode
is set.
32
2. The update spectrum data is compared with the data left last time at each point, and the smaller one is retained
and displayed.
2
4
256
8
512
16
1024
32
* *
64
128
(infinite)
* When this mode is set, “MIN --- (number of times)” is displayed in the CALC area on the screen.
(Refer to “4. Explanation of Screen” for the details.)
16.4 AVERAGE Mode
1. By the operation of
, the number of times of the sweep in the AVERAGE mode is
F4
set.
2. The simple averaging process is executed at each sweep.
2
4
256
8
512
16
32
64
128
1024
* When this mode is set, “AVG --- (number of times)” is displayed in the CALC area on the screen.
(Refer to “4. Explanation of Screen” for the details.)
16.5 OVERWRITE Mode
1. By the operation of
, the number of times of the sweep in the OVER WRITE
F5
mode is set.
2. The image on the screen is not cleared at each sweep, and the overwriting display is executed.
2
4
256
8
512
16
1024
32
* *
64
128
(infinite)
* When this mode is set, “OVER WR” is displayed in the CALC area on the screen.
(Refer to “4. Explanation of Screen” for the details.)
* Only the last spectrum is saved.
16.6 SPURIOUS FREE Mode (2658A only)
1. By pushing
F6
, the SPRIOUS FREE mode, by which the spurious response at band 1- and band
1+ is simply deleted, is selected.
* “SPR” is displayed in CALC area on the screen.
(Refer to “4. Explanation of Screen” for the details.)
33
* Differing from base band at which the up-conversion of input frequency is done with a frequency mixer, the
spurious response peculiar to band 1- and band 1+ is generated because the down-conversion is done at those
two bands.
* About SPURIOUS FREE mode
1. SPURIOUS FREE mode is a mode by which the spurious response peculiarly caused at band
1+ is simply deleted.
2. SPURIOUS FREE mode is especially effective in the measurement of a stationary wave.
3. If SPURIOUS FREE mode is used in measurement of a signal with level change or frequency
change, the phenomenon that the level goes down will occur.
4. The noise level goes down a little in case of a noise changing at random. In short, the same
phenomenon as MIN HOLD function happens.
* How to judge SPURIOUS response at band 1- and band 1+
The procedure for judging SPURIOUS response at band 1- and band 1+ is as follows.
1. Set the center frequency to < (current setting value) + f >.
2. The spectrum shifting left by f is a correct spectrum, but another spectrum shifting such as left
by 2f, left by 3f, right by f, right by 2f or right by 3f is a spurious response.
* “f ” should be changed according to SPAN for easy judgment. For reference;
f = SPAN / (10 to 50) (corresponding to 0.2 to 1 div)
Example: judging a spectrum displayed at 6.92 GHz
(setting : center frequency 6.92 GHz and SPAN 500 MHz)
1. Set the center frequency to < 6.92 GHz + 500 MHz/25 > = 6.94GHz.
2. A spectrum at 6.92 GHz (shifting left by f from 6.94 GHz) is correct. A spectrum at 6.98 GHz (shifting
right by 2f from 6.94 GHz) is spurious.
* Additionally, a spurious response mentioned above shifting right by 2f at band 1+ is largest, and other
spurious response are about 25 to 50 dB smaller than that.
17. Marker & Peak Search <MKR>
When
MKR
is pushed, the following function menu is displayed.
● Main menu of marker function
MARKER
CONV
CENTER FREQ
NORMAL
DELTA
OFF
NORMAL
ZONE
dBm →W
F1
F2
F3
F4
F5
F6
34
17.1 Movement and Basic Function of Marker
1. By rotating
, the marker moves.
2. By pushing
, the normal marker mode is selected and the marker operates as an independent
F1
marker.
The frequency and the level at the marker point are displayed in the lower right side.
3. When
is pushed, the delta marker mode is selected, and the reference marker and
F2
the active marker are displayed.
The frequency and the level at the marker points are displayed as follows;
Frequency = (freq. at active marker) – (freq. at reference marker)
Level = (level at active marker) – (level at reference marker)
4. By pushing
, the marker is erased (marker off).
F3
17.2 Normal Peak Search
● Menu of normal peak search
When
is pushed, the following function menu is displayed.
F4
PEAK
NEXT
SEARCH
PEAK
F1
F2
RETURN
F3
F4
F5
F6
1. When
F1
is pushed, the marker moves to the maximum peak position of spectrums.
2. When
F2
is pushed, the marker moves to the next highest peak. Fifty or less peaks are available.
3. When
F6
is pushed, the function menu is returned to the main menu of marker function.
17.3 Zone Peak Search
● Menu of normal peak search
When
F5
is pushed, the following function menu is displayed.
35
ZONE
CENTER
RETURN
WIDTH
F1
F2
F3
F4
F5
F6
At the Zone mode, the marker automatically moves to the maximum peak point within the range set beforehand.
When entering this mode, the zone is displayed with thin blue shadow in the spectrum display area.
The marker moves to maximum level within this zone at each sweep.
The center of the zone can be adjusted by pressing
F1
The width of the zone can be adjusted by pressing
F2
Note: The marker does not move in HOLD.
17.4 Change Unit of Marker Level
When
F6
is pushed, the unit of the marker level is changed.
If the unit of the reference level is dBm, it can be changed to [dBm]
[W].
If the unit of the reference level is dBμV, dBmV or dBV, it can be changed to
[dBμV, dBmV, dBV]
Note:
[V].
If the unit of the reference level is dBμV/m, it can be changed to [dBμV/m]
[V/m].
If the unit of the reference level is dBμA/m, it can be changed to [dBμA/m]
[A/m].
“V/M” is only displayed when the electric field strength measurement is selected
“A/M” is only displayed when the magnetic field strength measurement is selected
Each unit change as described above has their own sub-menu for more unit display options. They are
shown below:
[W]
[W, mW, μW, nW, pW, fW]
[V]
[V, mV, μV, nV]
[V/m]
[V/m, mV/m, μV/m, nV/m]
[A/m]
[A/m, mA/m, μA/m, nA/m]
18. Save / Load <SAVE/LOAD>
When
SAVE / LOAD
is pushed, SAVE/LOAD menu is displayed as follows.
36
MODE SELECT
PRE
DEVICE
SAVE
LOAD
DELETE
MEM
USB
SET
F1
F2
F3
F4
F5
F6
18.1 Selection of Storage Device
1. When
When
F4
F5
is pushed, the built-in flash memory is selected as a storage device.
is pushed, the external USB memory is selected as a storage device.
* Install the USB memory in USB A- plug on the right side firmly. Refer to the figure below.
* Once you disconnect, then reconnect the same or a different USB flash memory drive, the 2650A series
will not automatically recognize the new USB drive. After connecting the drive, you must first press the
Save/Load key, followed by F5 key (USB) in order for the 2650A to "see" the new drive., then proceed as
described below.
.
37
18.2 Save Function
When
is pushed, SAVE menu is displayed as follows.
F1
OBJECT
SAVE
PRE
RETURN
SET
SPECT
PARAMM
BOTH
EXECUTE
F1
F2
F3
F4
F5
F6
1.
In this function, the data is stored in the built-in memory or USB memory by CSV format.
The data stored in USB memory can be used with a personal computer as a CSV file.
“2650A_csvData” folder will automatically be created and the data will be stored in it as a file.
2.
The object to be stored is selected with
,
F1
F2
or
F3
.
SPECT: The current spectrum on the screen is stored.
PARAM: The setting parameters are stored.
BOTH: The spectrum and setting parameters are stored as one file.
* The selected key will look pushed-in on the display.
3.
F4
When
is pushed, SAVE is executed.
The data is stored based on the file name displayed in the active area (refer to “4. Explanation of screen”).
As for the file name, refer to “18.3 About File Name”.
Up to 200 files can be stored in the built-in memory.
Up to 1000 files can be stored in USB memory.
4.
Pushing
F6
will return to the former menu.
18.3 About File Name
1.
The file name is attached to the file stored using this function as follows.
LABEL-SP001.csv
(1) (2) (3) (4)
(1) This is the label entered from the label function. Refer to “24.1 Label function.” Note: Symbols and
spaces are not recognized as a file name.
(2) S : The object stored is the spectrum (SPECT).
P: The object stored is the setting parameters (PARAM).
SP: The object stored is both of spectrum and setting parameters (BOTH).
(3) The consecutive three digit number from “000” is automatically attached if (1) and (2) are same.
(4) This is the extension showing CSV format and is automatically attached.
38
2.
If the label is not named, “2650A” will be the first part of the file name instead. For example:
2650A_SP001.csv
3. About file name at the time of storage
When SAVE is selected, the file name is displayed in the active area following according to the above labeling
convention.
When SAVE is executed as it is, the data is stored with that file name. If the file exists in the storage device and
is rotated left
before SAVE is executed, those file names are displayed one by one.
If SAVE is executed with an existing file name displayed, the data is overwritten on it.
18.4 Load Function
When
F2
is pushed, LOAD menu is displayed as follows.
File Search Step
LOAD
DISP
1
10
100
EXECUTE
CLEAR
RETURN
F1
F2
F3
F4
F5
F6
1.
When
is rotated right or left, the stored file name is displayed one by one from the specified
storage device in the active area as follows.
1) USB : LOAD
2) 2650A_SP012.csv
3) 12
1) The storage device in which the file is stored.
(USB: USB memory, MEM: built-in memory)
2) The file name selected.
3) Number attached to file
The files in the specified folder of the storage device are sorted in alphabetical order, and this shows that
number.
2.
To search files, press
, and the file will be displayed in order of the number attached to it in the active area.
F1
The search steps can be adjusted by pressing
F3
F2
to search in steps of 10 files at a time or pressing
to search in steps of 100 files at a time.
Select it according to the number of stored files.
3.
When
F4
is pushed, LOAD is executed.
* When SPECT is selected, a spectrum waveform is loaded. The setting parameters of loaded spectrum
are displayed in the setting parameters display area.
[Refer to “4. Explanation of screen” for details.]
39
* When PARAM is selected, setting parameters are loaded.
* When the spectrum is loaded, the 2650A series enters HOLD state and the current spectrum disappears,
replacing it with the loaded spectrum on main display.
When
HOLD/RUN is pushed right after, the loaded spectrum and a current spectrum are
displayed together.
4.
When
is pushed, the loaded spectrum can be cleared on display.
F5
18.5 Delete Function
When
is pushed, DELETE menu is displayed as follows.
F3
DELETE
File Search Step
1
10
100
EXECUTE
F1
F2
F3
F4
RETURN
F5
F6
1. The file name to be deleted is selected from the specified device with
, and the active area will
indicate this name. As for the number of search steps, it is the same as “18.4 Load Function”.
2. When
is pushed, DELETE is executed. The file displayed in the active area is deleted at this
F4
time.
3. Repeat step 1 and 2 above to delete more than one file.
18.6 Presetting (Initialization)
(For 2651, refer to “20. EMI test”)
When
F6
is pushed, the setting parameters are reset to the preset values as shown below.
Items
Parameters
Center frequency
Frequency span
Reference level
Offset
Impedance
Sweep time
Detection mode
1 GHz
20 MHz
10 dBm
0.0 dB
50 Ω
30 ms
Sample mode (SMPL)
RBW
VBW
Display scale
100 kHz
30 kHz
10 dB/div
40
19. Measuring Function <MEAS>
When
MEAS
is pushed, the following function menu is displayed.
E/ F
M/F
FREQ
CH POWER
ACP
OBW
ANT
PROBE
COUNT
F1
F2
F3
F4
F5
F6
The measuring function can be selected as follows.
F1
CH POWER ----------- Channel power measurement
F2
ACP ----------------------- Adjacent channel leakage power measurement
F3
OBW ---------------------- Occupied bandwidth measurement
F4
E/F ANT ---------------- Electric field strength measurement
F5
M/F PROBE ----------- Magnetic field strength measurement
F6
FREQ COUNT --------- Frequency counter (factory option)
* Once the measuring function is set, when
is pushed, the function menu is directly returned to the last
MEAS
setting of the measuring function. In order to stop the measuring function or to select the other measuring function,
push [F6] key (MEAS OFF), then the function menu is returned to the main menu of the measuring function.
* Each of the four functions (Channel power, Adjacent channel leakage power, Occupied bandwidth and Frequency
counter) and the marker function cannot be used at the same time. When
MKR
is pushed while each of the
four functions is selected, the measuring function will stop.
Similarly, when the measuring function is selected while using the marker function, the marker function will stop.
* Although 501 points can be displayed on the screen, the number of points calculated in the instrument is 1001.
19.1 Channel Power Measuremnt <CH POWER>
The total power in the specified frequency band is measured.
Two modes, TOTAL and BAND, are available.
•
TOTAL mode [ By pushing
(MODE), TOTAL mode is selected.]
F1
The sum of power in the displayed spectrum specified by center frequency and frequency span is measured.
41
* “CP TOTAL” is displayed in MEAS area on the screen.
* The measured value is displayed at the lower right corner on
the screen.
[Measuring Mode]
•
[Measured Value]
BAND mode [ By pushing
F1
(MODE), BAND mode is selected.]
The sum of power in the band specified by band center and bandwidth is measured.
* “CP BAND” is displayed in MEAS area on the screen.
* The measured value and the setting parameter are
displayed at the lower part of the screen.
1. By
F2
(BAND ENTER)
,
the band center is set.
2. By
F3
(BAND WIDTH)
,
the band width is set.
[Measuring Mode]
[Measured Value]
[Setting parameter]
19.2 Adjacent Channel Leakage Power Measurement <ACP>
F2
The adjacent channel leakage power is measured as the ratio of power in the range specified by offset frequency
and bandwidth to carrier power. Both leakage power at the upper and lower side are measured.
Furthermore, the method for measurement is selected out of three methods based on the classification of definition
of carrier power; total power method, reference level method and in-band method.
•
Mode selection and measurement
[ By pushing
F1
(MODE), TOTAL, BAND or PEAK mode is selected.]
* “ACP TOTAL”, “ACP BAND” or “ACP PK” is displayed in MEAS area on the screen.
42
* The measured value and the setting parameter are displayed at the lower part of the screen.
1. By
F2
(ACP OFFSET)
, the
offset frequency of adjacent channel is set.
* The offset is from the center frequency of the reference
carrier.
2. By
F3
(ACP WIDTH)
, the
band width of adjacent channel is set.
3. By
[Measuring mode]
[Setting parameter]
[Measured value]
F4
(REFERENCE CENTER)
,
the center frequency of the reference carrier is set.
* [F4] is only for TOTAL and BAND mode.
4. By
F5
(REFERENCE WIDTH)
,
the band width of reference carrier is set.
* [F5] is only for BAND mode.
•
Definition of Reference Carrier for each Mode
TOTAL (total power method)
BAND (in-band method)
PEAK (reference level method)
This is based on the sum of power in the
This is based on the sum of power in the
This is based on the power of peak on the
displayed spectrum. The center frequency
specified bandwidth. The center
screen. The center frequency of the
of the reference carrier is set by [F4].
frequency of the reference carrier is set by
reference carrier is automatically set to the
[F4].
peak on the screen.
43
19.3 Occupied Bandwidth Measurement <OBW>
F3
It is possible to measure the occupied frequency bandwidth defined as the width of points at N(%) of the total
power (N% POWER), or as the width of points that are X(dB) lower than the peak level (XdB DOWN).
•
N% POWER mode [ By pushing
(MODE), N% POWER mode (N%) is selected.]
F1
The bandwidth of points at N(%) of the total power is measured.
* “OBW N%” is displayed in MEAS area on the screen.
* The measured value is displayed at the lower right corner on the screen.
1. By
F2
(RATIO %)
, the percentage of the
total power is set.
* Setting range : 80.0 to 99.9%
2. By
[Measuring mode]
•
[Setting parameter]
F3
, the step size of RATIO % can be set to 1% or 0.1%.
[Measured value]
XdB DOWN mode [ By pushing
(MODE), XdB DOWN mode (X dB) is selected.]
F1
The bandwidth of points that are X(dB) lower than the peak level is measured.
* “OBW XdB” is displayed in MEAS area on the screen.
* The measured value is displayed at the lower right corner on the screen.
1. By
F2
(XdB)
, the down level from
the peak level is set.
* Setting range : 0.1 to 99.0dB
2. By
[Measuring mode]
[Setting parameter]
F3
, the step size of XdB can be set to 1dB or 0.1dB.
[Measured value]
19.4 Electric Field Strength Measurement <E/F ANT>
F4
Connecting a dipole antenna (option) to the RF input enables the measurement of the electric field strength.
Other than the optional antenna is also available by creating the original compensation data.
(Refer to “25.8 Writing of Original Compensation Data” for the details.)
44
[Antenna connection]
[Measurement environment]
Antenna
M401
M402
M403
M404
M405
M406
Connect to
RF INPUT.
2650A series
* Turn the back to the signal source.
[Specifications of dipole antenna (The antenna gain and VSWR are specified at the center of frequency range.)]
Items
M401
M402
M403
M404
M405
M406
Type
Sleeve
Sleeve
Sleeve
Sleeve
¼ λ whip
Sleeve
Frequency range
0.8 to 1GHz
1.25 to 1.65GHz
1.7 to 2.2GHz
2.25 to 2.65GHz
300 to 500MHz
4.7 to 6.2GHz
Antenna gain
>1dB
>1dB
>1dB
>1dB
>1dB
>1dB
VSWR
< 1.5
< 1.5
< 1.5
< 1.5
< 1.5
< 1.5
Dimensions
7.5φ ×280mm
7.5φ ×280mm
7.5φ ×210mm
7.5φ ×210mm
8.0φ ×212mm
7.5φ ×152mm
Weight
Approx. 58g
Approx. 60g
Approx. 58g
Approx. 56g
Approx. 62g
Approx. 54g
93 to 143
96 to 146
99 to 149
100 to 150
87 to 137
109 to 159
dBμV/m
dBμV/m
dBμV/m
dBμV/m
dBμV/m
dBμV/m
Reference level
setting range
(except for the
minimum value in
screen shift)
* When M405 is used, the measurement errors will occur due to how to hold of instrument and influence of
human body, because M405 is ¼ λwhip antenna. The error value will be several dB or more. In order to
reduce the error, separate 2650A series from human body as much as possible.
•
Mode Selection and Measurement
By pushing
F1
(ANT), the antenna (M401/M402/M403/M404/M405/M406/USER) can be selected
The measurement starts as soon as the antenna is selected.
45
* “E/F M40X” or “E/F USER” is displayed in MEAS area on the screen.
* “USER” is the original compensation data which is created by the user.
(Refer to “25.8 Writing of Original Compensation Data” for the details.)
* The spectrum may exceed the area on the screen depending on the antenna gain compensation.
The unit of amplitude axis automatically changes into [dBμV/m].
* The optimum center frequency and frequency span are automatically set according to the antenna.
In addition, a spectrum other than the frequency range of the antenna is not displayed.
•
Directivity of Antenna (reference data)
E plane: X-Y axis (X direction=0°)
0°
270°
90°
180°
* The following are the data when the antenna is connected to RF input directly with no obstacles around.
Actually, the directivity changes due to the human body when handling the unit.
* However, the data of M405 is the reference data which is included the influence of the human body.
M401 (900 MHz, E plane)
Antenna gain vs. Frequency
46
M402 (1.5 GHz, E plane)
Antenna gain vs. Frequency
M403 (2 GHz, E plane)
Antenna gain vs. Frequency
5.5
5
ANT Gain (dBi)
4.5
4
3.5
3
2.5
2
1.5
1
0.5
1.7
1.8
1.9
2
2.1
2.2
Fr
equency(GHz)
M404 (2.4 GHz, E plane)
Antenna gain vs. Frequency
5.5
5
ANT Gain (dBi)
4.5
4
3.5
3
2.5
2
1.5
1
2.25
2.35
2.45
Fr
equency(GHz)
47
2.55
2.65
M405 (horizontal plane)
Antenna gain vs. Frequency
M406 (5.4 GHz, E plane)
Antenna gain vs. Frequency
3.5
ANT Gain (dB)
3
2.5
2
1.5
1
4.70
4.95
5.20 5.45 5.70
Frequency(GHz)
19.5 Magnetic Field Strength Measurement <M/F PROBE>
The magnetic field distribution can be measured by using the magnetic field probe CP-2S (option).
48
5.95
F5
6.20
[Magnetic field probe connection]
The tip of the magnetic field probe CP-2S is made of glass-ceramic board. Take
care when handling the probe even though the strength of the glass-ceramic
board is durable under normal operation.
“Specifications of magnetic field probe CP-2S” (Refer to the operating manual of CP-2S for the details.)
Item
Specifications
Frequency range
10 MHz to 3 GHz
approx. 0.25 mm
(depending on objects)
Space resolution (-6 dB)
Reference level setting range: maximum
160 to 203 dBμA/m
Reference level setting range: minimum
(except for the minimum value in screen shift)
Measurement error
•
110 to 153 dBμA/m
approx. ±1 dB (probe simple substance)
Mode Selection and Measurement
By pushing
F1
(PROBE), CP-2S or USER mode is selected.
The measurement starts as soon as the probe is selected.
* “M/F CP2S” or “M/F USER” is displayed in MEAS area on the screen.
* “USER” is the original compensation data which is created by the user.
(Refer to “25.8 Writing of Original Compensation Data” for the details.)
The unit of amplitude axis automatically changes into [dBμA/m].
* A spectrum other than the frequency range of the probe is not displayed.
49
19.6 Frequency Counter <FREQ COUNT>
F6
This function currently not supported.
20. EMI Test (2651)
20.1 Additional Function for EMI Test
Detection mode (Refer to “13.4 Setting of Detection mode”)
By pushing
SWEEP
POS
F6
SMPL
NEG
, the detection mode can be set.
QP
AV
In the 2651, QP detection and AV detection are added for EMI measurement.
POS (Positive Peak)
: The spectrum of the maximum value between the sample points
SMPL (Sample)
: The spectrum of the momentary value between the sample points
NEG (Negative Peak)
: The spectrum of the minimum value between the sample points
QP (Quasi Peak)
: The spectrum of the quasi peak value between the sample points
AV (Average)
: The spectrum of the average value between the sample points
As for QP detection, the following characteristics are chosen according to RBW settings.
(based on CISPR16)
RBW
•
charging
dis-charging
meter
time constant
time constant
time constant
9kHz
1ms
160ms
160ms
120kHz
1ms
550ms
100ms
Preset (Initialization) (Refer to “18. Save / Load”)
In the 2651, the radiated emission measurement and the conducted emission measurement are added to the
preset as a default setting.
By pushing
SAVE/LOAD
F6
, the menu is displayed
F1
NORMAL : The initial parameters of normal mode are set.
F2
EMI-C : The initial parameters of conducted emission measurement are set.
F3
EMI-R : The initial parameters of radiated emission measurement are set
In the radiated mission measurement, “USER” is selected as an antenna.
It is necessary to input the compensation data of antenna beforehand.
50
20.2 EMI Test
The QP detection is usually used in both of the radiated and conducted emission measurements, and the AV
detection is usually used in the conducted emission measurement. The measurement time can be shortened by
using them in the final measurement to the spectrums narrowed by the PK detection.
Conducted Emission Measurement
The conducted emission discharged through the power supply line is measured.
In this measurement, LISN* (Line Impedance Stabilization Network) device is needed.
The connection is shown in the figure below. Please refer to the manual of LISN for details of the
connection and notes.
Power Supply
EUT
LISN *
2651
1. Turn on the power of the 2651 after the connection.
2. Set the initial parameters of conducted emission measurement by pushing
SAVE/LOAD
. The setting parameters are as follows.
F6
F2
Center Frequency
: 25.5 MHz
Frequency span
: 50 MHz
RBW
: 9 kHz
VBW
: 1 MHz
Sweep time
: 3 sec
Detection mode
: Positive peak mode
3. Confirm whether the connection and the operation are correct by supplying the power to the EUT and
measuring.
4. Set the number of times of the sweep in the MAX HOLD mode by operating
CALC
F2
.
5. Search the frequency of disturbance noise that exceeds the AV or QP limits by using the marker
function.
6. Set the center frequency to the point that exceeds the limits, the SPAN to 2 MHz and the SWEEP to
0.1 sec. And measure the frequency accurately.
51
7. Moreover, measure the frequency detected in the above with QP or AV detection, then the SPAN is
200 kHz and the SWEEP is 10 sec.
Radiated Emission Measurement
The electric field strength of disturbance noise that EUT radiates in the air is measured.
Antenna
EUT
2651
1. Set the compensation data of the antenna beforehand.
Refer to “25.8 Writing original compensation data” for the details.
2. Turn on the power of the 2651 after connection.
3. Set the initial parameters of radiated emission measurement by pushing
SAVE/LOAD
. The setting parameters are as follows.
F6
F3
Center Frequency
: 515 MHz
Frequency span
: 1 GHz
RBW
: 120 kHz
VBW
: 1 MHz
Sweep time
: 0.3 sec
Detection mode
: Positive peak mode
4. Confirm whether the connection and the operation are correct by supplying the power to the EUT and
measuring.
5. Set the number of times of the sweep in the MAX HOLD mode by operating
F2
CALC
.
6. Search the frequency of disturbance noise that exceeds the QP limits by using the marker function.
7. Set the center frequency to the point that exceeds the limits, the SPAN to 50MHz and the SWEEP to
30 msec. And measure the frequency accurately.
8. Moreover, measure the frequency detected in the above with QP detection, then the SPAN is 1MHz
and the SWEEP is 30 sec.
52
EMI standards (selected)
Frequency
Quasi Peak
CISPR22 class A
Limits of conducted disturbance at
mains ports
0.15 MHz to 0.50 MHz
0.50 MHz to 30 MHz
79 dBuV
73 dBuV
CISPR22 class B
Limits of conducted disturbance at
mains ports
0.15 MHz to 0.50 MHz
0.50 MHz to 5 MHz
5 MHz to 30 MHz
66 to 56 dBuV
56 dBuV
60 dBuV
56 to 46 dBuV
46 dBuV
50 dBuV
Decreasing linearly with the logarithm of the
frequency
CISPR22 class A
Limits of radiated disturbance
30 MHz to 230 MHz
230 MHz to 1000 MHz
1000 MHz to 3000 MHz
3000 MHz to 6000 MHz
40 dBuV/m
47 dBuV/m
76 dBuV/m
80 dBuV/m
----56 dBuV/m
60 dBuV/m
Measurement distance 10 m
CISPR22 class B
Limits of radiated disturbance
30 MHz to 230 MHz
230 MHz to 1000 MHz
1000 MHz to 3000 MHz
3000 MHz to 6000 MHz
30 dBuV/m
37 dBuV/m
70 dBuV/m
74 dBuV/m
----50 dBuV/m
54 dBuV/m
Measurement distance 10 m
VCCI class A
Limits of conducted disturbance at
mains ports
0.15 MHz to 0.50 MHz
0.50 MHz to 30 MHz
79 dBuV
73 dBuV
66 dBuV
60 dBuV
VCCI class B
Limits of conducted disturbance at
mains ports
0.15 MHz to 0.50 MHz
0.50 MHz to 5 MHz
5 MHz to 30 MHz
66 to 56 dBuV
56 dBuV
60 dBuV
56 to 46 dBuV
46 dBuV
50 dBuV
Decreasing linearly with the logarithm of the
frequency.
VCCI class A
Limits of radiated disturbance
30 MHz to 230 MHz
230 MHz to 1000 MHz
40 dBuV/m
47 dBuV/m
-----
Measurement distance 10 m
1000 MHz to 3000 MHz
3000 MHz to 6000 MHz
76 dBuV/m
80 dBuV/m
56 dBuV/m
60 dBuV/m
Measurement distance 3 m
30 MHz ~ 230 MHz
230 MHz ~ 1000 MHz
30 dBuV/m
37 dBuV/m
-----
Measurement distance 10 m
1000 MHz to 3000 MHz
3000 MHz to 6000 MHz
70 dBuV/m
74 dBuV/m
50 dBuV/m
54 dBuV/m
Measurement distance 3 m
FCC part15 subpartB class A
Limits of conducted disturbance at
mains ports
0.15 MHz to 0.50 MHz
0.50 MHz to 30 MHz
79 dBuV
73 dBuV
66 dBuV
60 dBuV
FCC part15 subpartB class B
Limits of conducted disturbance at
mains ports
0.15 MHz to 0.50 MHz
0.50 MHz to 5 MHz
5 MHz to 30 MHz
66 to 56 dBuV
56 dBuV
60 dBuV
56 to 46 dBuV
46 dBuV
50 dBuV
Decreasing linearly with the logarithm of the
frequency.
FCC part15 subpartB class A
Limits of radiated disturbance
30 MHz to 88 MHz
88 MHz to 216 MHz
216 MHz to 960 MHz
over 960 MHz
39.1 dBuV/m
43.5 dBuV/m
46.4 dBuV/m
49.5 dBuV/m
---------
Measurement distance 10 m
FCC part15 subpartB class B
Limits of radiated disturbance
30 MHz to 88 MHz
88 MHz to 216 MHz
216 MHz to 960 MHz
over 960 MHz
40 dBuV/m
43.5 dBuV/m
46 dBuV/m
54 dBuV/m
---------
Measurement distance 3 m
VCCI class B
Limits of radiated disturbance
Average
(Note: Information provided in this table serves as a reference only. B&K Precision is not liable for any damages due to any mistakes in the table.)
21. Screen Control <DSPL>
When
DSPL
is pushed, the following function menu is displayed.
53
COLOR
BACK LT
BRIGHT
COLOR1
ON
80
F1
F2
F3
F4
F5
F6
21.1 Setting Screen Display Color
When
F1
COLOR1
•
•
•
COLOR1
COLOR2
MONO
is pushed, the color of screen display can be selected.
COLOR2
MONO
: For normal use
: For printing screen
: Monochrome
21.2 ON/OFF Switching of LCD Backlight
Use
F2
button to toggle the backlight ON or OFF.
21.3 Adjusting Brightness of LCD Backlight
Use
F3
to set the brightness. It can be set in the range of 0 to 100.
22. Tracking Generator Mode (2652A)
22.1 Specification of T.G. Function
Item
Frequency range
Output Level
Output flatness
Output impedance
Output VSWR
Output connector
Specification
5 MHz to 3.3 GHz
-10 dBm ± 1 dB @1 GHz(Fixed value)
±1.5 dB
50 Ω
Less than 2.0
N(J) connector
54
22.2 Description of I/O Connector
1) Input connector
N (J) connector
Input for an external signal
Make sure that the total power of input signals does not exceed +27 dBm.
2) Output connector
N (J) connector
It is an output terminal of Tracking Generator.
*Please set to “TG : OFF” to prevent the influence of the leak from the Tracking
Generator in case of disuse of the T.G. function..
22.3 ON/OFF Switching of T.G. Function
When
SWEEP
is pushed, the following function menu is display.
SWEEP
AUTO
MANUAL
F1
1. When
F2
F6
ALL AUTO
F3
is pushed, T.G. MODE is set.
55
DET
TRIG
T.G.
SMPL
INT
MODE
F4
F5
F6
T.G.
NORM
ON
ON
F1
F2
2. Each time
F1
F3
F4
F5
F6
is pressed, T.G. output is alternately switched to ON or OFF.
22.4 Normalizing Function
NORM ON: The input level is made flat to the red line on the screen.
1. When
SWEEP
2. When
F6
is pushed, the same function menu as the previous item is displayed.
is pushed, TG. MODE is set.
F2
3. Each time
is pushed, the normalizing function is alternately switched to ON or OFF.
If the normalizing function is switched to ON, “NORM ON” is displayed on the screen.
* If the setting is changed as follows, the normalizing function is automatically turned off.
· The span is expanded. · The center frequency is changed beyond the range normalized.
( When SPAN is changed from FULL SPAN according to center frequency, it is turned off.)
· The magnetic field strength measurement is selected.
· The AUTO tuning is executed. · The power supply is turned off. · The presetting is executed.
* When the scale is 2 dB or 5 dB, the normalizing function does not operate correctly if the spectrum level is not
displayed at a proper position on the screen.
56
23. Storage/Print Screen Image <COPY>
The following function menu is displayed when
is pushed.
COPY
AREA
PRINT
Bmp → USB
MEM → USB
WHOLE
EXECT
COPY
EXECT
F1
F2
F3
F4
F5
F6
23.1 Selection of Image Area
When
F1
is pushed, the image area to be stored or printed can be selected.
WHOLE : the whole screen image is stored or printed.
SPECT : only the spectrum display area is stored or printed.
23.2 Print on Printer
When pushing
F2
after connecting the printer (option), the area selected in 23.1 is printed.
23.3 Storage into USB Memory
When pushing
F3
after connecting USB memory (removable storage) to this unit, the area
selected in 23.1 is stored in USB memory in BMP (bit map) format. As for the file name, the number is
automatically set and incremented in the form “2650A_001.bmp”. In the case when some characters are
written in the label area, the file name will consist of it and the number put automatically such as
“LABEL001.bmp”. The folder “2650A_IMG” is automatically generated and these files are stored
inside.
To change the color of the display before print, refer to “21. Screen Control”.
57
※ Once you disconnect, then reconnect the same or a different USB flash memory drive, the 2650A
series will not automatically recognize the new USB drive. After connecting the drive, you first must press the
Save/Load, followed by F5 key (USB) in order for the 2650A to "see" the new drive, then proceed with copying
data to the drive.
23.4 Transferring Internal Data to USB Memory in Lump Sum
F5
When pushing
after connecting USB memory (removable storage) to this unit, the data
stored in the internal memory with SAVE/LOAD function are transferred to USB memory in a lump
sum. During the transfer process, the screen on the lower right corner will display “Saving”. Wait until it
disappears, indicating that transfer is complete, before continuing operation. The folder
“2650A_SaveAll” is automatically generated and these files are stored inside.
※ Once you disconnect, then reconnect the same or a different USB flash memory drive, the 2650A
series will not automatically recognize the new USB drive. After connecting the drive, you must first press the
Save/Load key, followed by F5 key (USB) in order for the 2650A to "see" the new drive, then proceed as normal.
23.5 USB Printer (option)
The 2650A/2651 series enables a hard copy of the screen by connecting a USB printer (option) to USB A
plug with the included USB cable.
58
USB B plug
USB A plug
Printer
* Turn on the power of the 2650A/2651 series unit first. After that, turn on the power of USB printer.
Otherwise, it will not work correctly.
23.6 USB Memory
USB memory can be used as a removable storage.
59
24. Utility Function <UTIL>
When
is pushed, the following function menu is displayed.
UTIL
LABEL
F1
MENU
BUZZER
CLOCK
OFF
ALWAYS
CONFIG
F2
F3
F4
F5
F6
F1
Label Function
: Enters the label menu for customizing filename.
F2
Menu Off
: Turns off menu and active area display.
F3
Buzzer Setting
: Sets the condition of the buzzer sound.
F4
Clock Function Setting
: Sets the built-in clock.
24.1 Label Function
When
UTIL
F1
abc
012
F1
ABC
F2
F3
is pushed, the following function menu is displayed.
@%*
BACKSP
ENTER
+
←
→
F4
F5
F6
1. The kind of character to be written is selected with
F1
to
F4
.
F1
012
: 0 to 9 (numeral)
F2
abc
: a to z (lower case alphabet)
F3
ABC
: A to Z (upper case alphabet)
F4
@%*
: Special characters ( ! ” # $ % & ’ ( ) * + , - . / : ; < = > ? @ [ ¥ ] ^ _ ` { Ω } µ)
*Note: Certain special characters may not be recognized or valid as a filename.
2. A block cursor will be displayed in the label display area.
By rotating
, a number, small letter alphabet, capital letter alphabet or special character will
be indicated on the cursor position. Turn the knob until the desired label character is displayed.
3. When
F6
is pushed, the cursor position will move right by one character. And the previous character
is set.
60
4. When
is pushed, the cursor position will move left by one character. To change the
F5
character, turn the encoder. To delete, press F5 again. Characters previously entered can be deleted
by consecutively pushing F5.
5. When finished, press
to exit the label menu.
UTIL
24.2 Menu Off
By pushing
F2
, the display of the function menu and the active area can be turned off
temporarily.
24.3 Buzzer Setting
By pushing
F3
, the buzzer sound can be set to beep when keys are pressed or rotary encoder
is turned. The following three options are selectable by pressing F3 until the desired option is displayed.
OFF
: The buzzer is off.
ALARM
: The buzzer will sound off when an incorrect setting is made.
ALWAYS
: The buzzer will sound whenever a key or the rotary encoder is
operated.
※ When the battery voltage becomes low during battery operation, the buzzer will sound.
(Even if OFF is selected, it will sound.)
24.4 Setting the Clock
When
UTIL
F4
is pushed, the following function menu is displayed.
YEAR
MONTH
DATE
HOUR
MIN
08
JUN
30
23
50
F1
F2
F3
F4
F5
ENTER
F6
The year, month, day and time are displayed below the screen. (Refer to “4. Explanation of Screen”)
Set the year, month, day and time when 2650A/2651 series is used for the first time.
The time information is updated even if the power is turned off.
61
1. By rotating
, the values for a selected parameter (choosen by pressing any button between F1 and F5)
can be changed.
2.
F1
Used to set the year. Two last digits of the year are displayed. This can be set from 00 to 99.
F2
Used to set the month. This can be set from 1 to 12.
F3
Used to set the date. This can be set from 1 to 31.
F4
Used to set the hour. It is displayed in twenty-four hour format. Values can be set from 1 to 24.
F5
Used to set the minute.
3. By pushing
F6
, the values which are set from item 2. above are saved. The values are updated only
when this key is pushed.
* The clock function of the 2650A/2651 series is driven by a dedicated LSI, and the power is supplied by a
built-in lithium battery.
62
25. USB Device Function
25.1 Outline
The 2650A/2651 series is equipped with two kinds of USB connecters; A and B plugs. The A plug is for USB
host and is connected to USB devices such as USB memory or printer. The B plug is for USB device and is
connected to USB host such as a personal computer. The device function is explained in this chapter.
As for the host function using USB A plug, refer to “23. Storage and print of screen image”.
25.2 How to Connect
When using the USB device, connect with the included USB cable as illustrated
USB A plug
USB B plug
25.3 Installation of Driver
An instrument specified USB driver is necessary in order to control the 2650A/2651 series with a PC via USB
interface, and should be installed in the PC prior to using the software. The driver along with instructions can be
downloaded from our website (Go to the Support section and select download). After the
downloaded file is unzipped, the 2650A/2651 series is connected to a PC with the USB cable and then the power
is turned on. The detection wizard for the USB driver starts on the PC screen the moment the power of the
2650A/2651 series is turned on, and install it following this wizard.
25.4 Sample Program
Please contact us to request a sample code which demonstrates how to write a
custom program using the commands in the following se2658A_thumb.gifction.
63
25.5 Explanation of Command
* “CR(0D[HEX])+LF(0A[HEX])” is added to the end of every command. When the command is sent from PC,
2650A/2652A/2651 and 2658A return some responses, which include “OK” + CR + LF, “ERR” + CR + LF, or
“(response to command)” + CR + LF.
* By inputting “?” instead of “* *” for each command, the current setting parameters will be queried and a
response of the value will be received by the PC.
(Except for “ ---- Request” command and the command for inputting corrected data.)
1) Setting center frequency
Command : FREQ* * * * * * *
(* * * * * * *: Refer to “25.6 Input of frequency”)
Example: FREQ1.235G
Query: FREQ?
2) Request set marker
Command : FREQSETMK
* The center frequency is set according to the frequency of current marker position.
3) Setting frequency span
Command : SPAN* * * *
2650A, 2652A, 2651:
(* * * * = ZERO, 200K, 500K, 1M, 2M, 5M, 10M, 20M, 50M, 100M, 200M, 500M,
1G, 2G, FULL [unit : Hz])
2658A :
(* * * * = ZERO, 200K, 500K, 1M, 2M, 5M, 10M, 20M, 50M, 100M, 200M, 500M,
1G, 2G, 5G, FULL [unit : Hz])
Example: SPAN500K
* When the unit is other than dBm, convert
Query: SPAN?
into dBm by using calculation formula in
“9.8 Relation between reference level and
4) Setting reference level
ATT/AMP”.
Command : REF* * *
(* * * = -60 to 10 [1 step, unit : dBm] )
Example: REF 5
Query: REF?
5) Setting reference level unit
Command : UNIT * * * *
(* * * * = DBM, DBUV, DBMV, DBV)
Example: UNITDBUV
64
Command
Unit
DBM
DBUV
DBMV
DBV
dBm
dBμV
dBmV
dBV
6) Setting RBW
Command : RBW* * *
2650A, 2652A, 2658A :
( * * * * = 3K, 10K, 30K, 100K, 300K, 1M, 3M, AUTO, ALL [ unit : Hz ])
2651 :
( * * * * = 3K, 9K, 30K, 120K, 300K, 1M, 3M, AUTO, ALL [ unit : Hz ])
* ALL : The optimum RBW, VBW, and sweep time are set based on the frequency
span.
* AUTO : The optimum RBW is set based on the frequency span.
Example: RBW3M
Query: RBW?
7) Setting VBW
Command : VBW* * * *
( * * * * = 100, 300, 1K, 3K, 10K, 30K, 100K, 300K, 1M, AUTO, ALL [ unit : Hz ] )
* ALL : The optimum RBW, VBW and sweep time are set based on the frequency
span.
* AUTO : The optimum RBW is set based on the frequency span.
Example: VBW300
Command
Measuring function
Query: VBW?
CP
Channel power measurement
ACP
Adjacent channel power measurement
8) Selecting Measuring Function
OBW
Occupied bandwidth measurement
Command : MEAS* * *
EF
Electric field strength measurement
(* * * = CP, ACP, OBW, EF, MF,
MF
Magnetic field strength measurement
FC, OFF)
FC
Frequency counter (factory option)
Example: MEASOBW
OFF
OFF
(To change measuring function when in
a different measurement mode, set function OFF first by sending MEASOFF)
Query: MEAS?
9) Request measuring result
Command : MEASRES
* Example of measuring result
Channel power measurement ----- POW: - 25.5 dBm
Adjacent channel power measurement ----- L: - 47.7 dBc U: - 48.3 dBc
Occupied bandwidth measurement ----- C: 1.45 G W: 20.00 k
Frequency counter ----- FC: 2400.0000 M
* If the frequency counter is not installed, “Invalid for F/C” is responded.
* If the level of spectrum is low and unmeasurable, “Non Signal” is
responded.
65
10) Setting mode for channel power measurement
Command : CPMODE* * * * * * *
( * * * * * * * = TOTAL, BAND)
Example: CPMODETOTAL
Query: CPMODE?
Command
TOTAL
BAND
Mode
The sum of power on the screen is
measured.
The sum of power in the band specified is
measured.
11) Setting zone center frequency for channel power measurement
Command : CPCNTR* * * * * * *
( * * * * * * *: = 0-500: screen position, center = 250)
Example: CPCNTR300
Query: CPCNTR?
12) Setting zone width for channel power measurement
Command : CPWIDTH* * * * * * *
( * * * * * * *: = 0-500: screen position, center = 250)
Example: CPWIDTH200
Query: CPWIDTH?
13) Setting mode for adjacent channel power measurement
Command : ACPMODE* * * * *
Command
(* * * * * = TOTAL, BAND, PEAK) TOTAL
Example: ACPMODEPEAK
BAND
Query: ACPMODE?
PEAK
Mode
TOTAL (total power method)
BAND (in-band method)
PEAK (reference level method)
14) Setting band offset for adjacent channel power measurement
Command : ACPOFS* * * * * * *
( * * * * * * *: = 0-500: screen position, center = 250)
Example: ACPOFS100
Query: ACPOFS?
15) Setting bandwidth for adjacent channel power measurement
Command : ACPCHBW* * * * * * *
( * * * * * * *: = 0-500: screen position, center = 250)
Example: ACPCHBW30
Query: ACPCHBW?
16) Setting reference band center frequency for adjacent channel power measurement
Command : ACPREF* * * * * * *
66
( * * * * * * *: = 0-500: screen position, center = 250)
Example: ACPREF250
Query: ACPREF?
17) Setting reference bandwidth for adjacent channel power measurement
Command : ACPREFBW* * * * * * *
( * * * * * * *: = 0-500: screen position, center = 250)
Example: ACPREFBW50
Query: ACPREFBW?
18) Setting mode for occupied bandwidth measurement
Command : OBWMODE* *
( * * : N%, DB)
Example: OBWMODEN%
Query: OBWMODE?
Command
Mode
N%
DB
N% POWER mode
XdB DOWN mode
19) Setting N% RATIO for occupied bandwidth measurement
Command : OBWRATIO* * *
(* * *: 80.0 to 99.9 [ 0.1 step , unit : %] )
Example: OBWRATIO85.6
Query: OBWRATIO?
20) Setting XdB DOWN for occupied bandwidth measurement
Command : OBWDB* * *
( * * *: 0.1 to 99.0 [ 0.1 step , unit : dB] )
Example: OBWDB45.3
Query: OBWDB?
21) Setting antenna for electric field strength measurement
Command : EFANT* * * *
Command
( * * * *: M401 / M402 / M403
M401
/ M404 / M405 / M406 / USER)
M402
Example: EFANTM405
M403
Query: EFANT?
M404
Antenna
Setting data for M401
Setting data for M402
Setting data for M403
Setting data for M404
M405
Setting data for M405
M406
Setting data for M406
USER
Setting data for user’s original antenna
22) Transfer user-compensation data for electric field strength measurement
Command : EFUSER* * * * *
(Refer to “25.8 Writing of Original Compensation Data” for the details.)
Example: EFUSER300M:0.0DBI,350M:1.0DBI
67
23) Setting probe for magnetic field strength measurement
Command : MFPROBE* * * *
( * * * *: CP2S / USER)
Example: MFPROBECP2S
Query: MFPROBE?
24) Transfer user-compensation data for magnetic field strength measurement
Command : MFUSER* * * * *
(Refer to “25.8 Writing of Original Compensation Data” for the details.)
Example: MFUSER300M:0.0DBI,350M:1.0DBI
25) Start and Stop calculation function
Command : CALC* * *
(* * *: OFF / MAX / MIN / AVE / OVR)
Example: CALCMIN
Query: CALC?
Command
Calculation
OFF
MAX
MIN
AVR
OVR
OFF
MAX HOLD
MIN HOLD
AVERAGE
OVER WRITE
26) Setting number of times to sweep for MAX HOLD
Command : MAXNO* * * *
( * * * * : 2 / 4 / 8 / 16 / 32 / 64 / 128 / 256 / 512 / 1024 / 0) * 0 = unlimited)
Example: MAXNO1024
Query: MAXNO?
27) Setting number of times to sweep for MIN HOLD
Command : MINNO* * * *
( * * * *: 2 / 4 / 8 / 16 / 32 / 64 / 128 / 256 / 512 / 1024 / 0) * 0 = unlimited)
Example: MINNO512
Query: MINNO?
28) Setting number of times to sweep for AVERAGE
Command : AVENO* * * *
( * * * *: 2 / 4 / 8 / 16 / 32 / 64 / 128 / 256 / 512 / 1024 / 0) * 0 = unlimited)
Example: AVENO16
Query: AVENO?
29) Setting number of times to sweep for OVERWRITE
Command : OVWNO* * * *
( * * * *: 2 / 4 / 8 / 16 / 32 / 64 / 128 / 256 / 512 / 1024 / 0) * 0 = unlimited)
Example: OVWNO128
Query: OVWNO?
68
30) Setting display scale
Command : SCALE* *
( * *: 2 / 5 / 10 )
Example: SCALE10
Query: SCALE?
Command
Display scale
2
5
10
2dB/div
5dB/div
10dB/div
31) Setting sweep time
Command : SWEEP* * * *
( * * * * : 10M / 30M / 0.1S / 0.3S / 1S / 3S / 10S / 30S / AUTO / ALL)
Command
Sweep time
Command
Sweep time
10M
30M
0.1S
0.3S
1S
10ms
30ms
0.1s
0.3s
1s
3S
10S
30S
AUTO
ALL
3s
10s
30s
AUTO
ALL AUTO
Example: SWEEP0.1S
Query: SWEEP?
32) Setting detection mode
Command : DET* * *
( * * *: POS / NEG / SMP )
Example: DETPOS
Query: DET?
33) Setting trigger source
Command : TRG* * *
( * * *: INT / EXT)
Example: TRGEXT
Query: TRG?
34) Request AUTOTUNE
Command : AUTO
Command
Detection mode
POS
NEG
SMP
QP
AVG
Positive peak mode
Negative peak mode
Sample mode
QP mode (only for MSA438E)
AVG mode (only for MSA438E)
Command
Trigger source
INT
EXT
Internal
External
* The response is returned after tuning.
35) Hold/Run function
Command : HOLD
Command : RUN
36) Request marker information
Command : MKRRES
Query: MKRRES?
* Example of returned data : 1.42G -15dBm
69
37) Setting marker mode
Command : MKR* * * * *
( * * * * *: NORM / DELTA)
Example: MKRDELTA
Query: MKR?
Command
Marker mode
NORM
DELTA
Normal marker
Delta marker
38) Setting marker position by frequency
The position of active marker is set by frequency.
Command : NORMMKR* * * * * *
( * * * * * * *: Refer to “25.6 Input of Frequency”)
Query: NORMMKR?
39) Setting marker position by number of points on horizontal axis
The position of active marker is set by number of points on horizontal axis.
Command : MKRPOSI* * *
( * * *: 0 to 500 ; 0 = far left, 500 = far right)
Example: MKRPOSI40
40) Setting peak search mode
Command : PEAK* * * *
( * * * * : NORM / ZONE)
Example: PEAKZONE
Query: PEAK?
41) Request peak search
Command : PKSEARCH* *
( * *: 01 / 02 / 03 / 04 / 05 / 06
/ 07 / 08 / 09 / 10 / 11)
Example: PKSEARCH09
Command
Peak search mode
NORM
ZONE
Normal peak search
Zone peak search
Command
Destination of marker
01
02
The maximum peak on the screen
The 2nd peak on the screen
···
···
11
The 11th peak on the screen
42) Setting zone center frequency for peak search
Command : PKCNTR* * * * * * *
( * * * * * * *: Refer to “25.6 Input of Frequency”)
Example: PKCNTR1.345G
Query: PKCNTR?
43) Setting zone width for peak search
Command : PKWIDTH* * * * * * *
( * * * * * * *: Refer to “25.6 Input of Frequency”)
Example: PKWIDTH256M
Query: PKWIDTH?
70
44) Setting unit of marker
Command : CONV* * *
( * * *: DBM / W / DBV / V / DBUVM / VM)
Example: CONVDBUVM
Query: CONV?
Command
Unit of marker
DBM
dBm
W
W
DBV
dBV
V
V
DBUVM
dBμV/m
VM
V/m
45) Request print on printer
Command : PRTSIW
USB printer connected to USB A plug prints.
46) Request for transfer of spectrum
Command : SRS* * * *
( * * * *: CURR / 000 to 199)
Example: SRSCURR
Command
Transferred spectrum
CURR
000
Current spectrum
Spectrum data of 000
···
···
199
Spectrum data of 199
*The number of the commands is given to the saved file.
*Refer to “25.7 Transfer of Spectrum Data” for the returned data.
47) Request for transfer of spectrum in USB memory
Command : SRSU* * * *
Command
( * * * *: 000 to 199)
000
Example: SRSU111
···
999
Transferred spectrum
Spectrum data of 000 in USB memory
···
Spectrum data of 999 in USB memory
* The number of the command is given to the saved file.
* Refer to “25.7 Transfer of Spectrum Data” for the returned data.
48) Request for transfer of spectrum data of 1001 points
Command : SRSF
* Refer to “25.7 Transfer of Spectrum Data” for the returned
data.
49) Request preset
Command : PRESET
Command
ON
OFF
50) Setting remote control
Command : REMOTE* * *
( * * *: ON / OFF)
Example: REMOTEON
Query: REMOTE?
71
Remote control
Operation by function key and encoder cannot be done.
Control the unit with USB commands.
Operation by function key and encoder can be done.
USB commands are available
* When the remote control is ON, “REMOTE” is displayed in the operating
information area on the screen. ( Refer to “4. Explanation of Screen” for the details.)
51) Single sweep
Command : CAPT
* It sweeps only once and will be in a HOLD state.
52) Setting offset level
Command : OFFSET* * * * *
(* * * * *: -50.0 to 50.0 [0.1 step, unit: dB] )
Example: OFFSET-25.6
Query: OFFSET?
Command
Offset level
50
Offset level is set to 0dB.
53) Setting input impedance
75
Offset level is set to 5.7dB.
Command : IMP* *
(* * : 50 / 75)
Example: IMP75
Query: IMP?
* When the input impedance is selected, the offset level is set as described above.
54) Clearing spectrum data and parameter
Command : MCLR* * *
( * * *: ALL / 000 to 199)
Example: MCLRWALL
* For internal memory only.
Command
Cleared data
ALL
000
All of spectrum data
Spectrum data of 000
···
···
199
Spectrum data of 199
55) Setting character for label
Command : LBL* * *
( * * *: The number of characters is 16 or less)
Example: LBLsample_spectrum
Query: LBL?
56) Setting clock
Command : CLC * * * * * * * *
( * * * * * * * * : aabbccdd ; aa: two last digits of year, bb: month (01 to 12), cc: hour
(00 to 23), dd: minute (00 to 59)
Example: CLC0902111103
Query: CLC?
72
57) Setting tracking generator
Command : TG* * *
( * * *: ON / OFF)
Example: TGON
Query: TG?
58) Setting normalizing function
Command : NORM* * *
( * * *: ON / OFF)
Example: NORMOFF
Query: NORM?
59) Save/Load function
Command : DEV***
( * * *: MEN/USB)
60) Request On/Off of Offset Level
Command: OFFSETOF?
*Returned data: ON or OFF.
61) Request firmware version
Command: VER
25.6 Input of Frequency
The frequency is input as follows.
*******
: 0.0k to 999.9k (0.1 step, unit: Hz)
: 0.0M to 999.9M (0.1 step, unit: Hz)
: 0.0000G to 3.3G (0.0001 step, unit: Hz) ---- 2650A, 2652A, 2651
: 0.0000G to 8.5G (0.0001 step, unit: Hz) ---- 2658A
* The offset frequency and the zone width can be input only in the range decided by the center frequency
and frequency span. If the value out of the range is input, an error occurs.
* The offset frequency and the zone width change when the frequency span is changed.
25.7 Transfer of Spectrum Data
73
The spectrum data outputs as a numeric string separated by commas “,”. [**.**, **.**, ……, **.**]
The unit is dBm, and it is available up to two decimal places.
•
Description
String
Explanation
Example
SPECT
The data which follows the string "SPECT" is the spectrum data. SPECT
* *, * *, · · ·
It is the spectrum data. This string consists of all data points
separated by a comma “,” after each data value, and the string
can have a total of ten data points per line. For example,
transferring spectrum data of 1001 points require a total of 101
lines.
-102.01, -102.03, · · ·, · · ·,
-110.12,
25.8 Writing of Original Compensation Data
When antennas or probes other than the option is used in electric field strength measurement or magnetic field
strength measurement, it is necessary to write each original compensation data into the unit.
Please write the data into the unit according to the following description.
There are two methods for writing. Either use the 2650A PC Software or write a custom program using interface
commands.
1) Preparation items
* Windows PC (with USB interface) [The writing can be done with 2650A/2651 series unit only.]
* 2650A PC software (Refer to 3) below)
2) Example of writing data
As an example, the compensation data (antenna gain) of antenna M405 and the compensation data
(compensation coefficient) of magnetic field probe CP-2S are shown below.
* Compensation data (antenna gain) of antenna M405
Frequency
Antenna gain
300MHz
0.0dBi
350MHz
1.0dBi
400MHz
1.4dBi
450MHz
1.4dBi
500MHz
0.0dBi
* Compensation data (compensation coefficient) of magnetic field probe CP-2S
Frequency
Compensation
coefficient
10MHz
100MHz
1GHz
2GHz
3GHz
86.7dB
69.2dB
50.7dB
44.9dB
40.1dB
* Data of ten points or less can be written. 0Hz is not valid as a data point.
3) Using 2650A PC software for writing
1. Create the text file of compensation data.
74
Create a new text file, and open it with a text editor.
Write the frequency and compensation data in the following format.
* Format
“frequency”: ”compensation data”, “frequency”: “compensation data”, · · ·
Example of M405
300M:0.0DBI,350M:1.0DBI,400M:1.4DBI,450M:1.4DBI,500M:0.0DBI
* Write the unit with a capital letter as it is case sensitive. G (GHz) is also available.
2. Write the text file into the unit with 2650A PC software.
Connect the personal computer to 2650A series with the included USB cable and turn on the power of
the 2650A/2651 series.
From the upper menu of the PC software,
select [File] → [Write E/F User Data] in case of electric field strength measurement, or
select [File] → [Write M/F User Data] in case of magnetic field strength measurement.
When the text file created beforehand is selected, the data is written.
* Install the specified USB driver in the personal computer prior to using the PC software.
(Refer to “25.3 Installation of Driver”)
4) Method of using original program for writing
1. Prepare the USB communication software.
Connect the personal computer to the 2650A/2651 series with the included USB cable and turn on the
power of the 2650A/2651 series.
2. Write the data into the unit.
Transfer the data in the following format with the USB communication software.
* Format
In case of electric field strength measurement;
EFUSER “frequency”: ”compensation data”, “frequency”: “compensation data”, · · ·
In case of magnetic field strength measurement;
MFUSER “frequency”: ”compensation data”, “frequency”: “compensation data”, · · ·
Example of CP-2S
MFUSER10M:86.7DB,100M:69.2DB,1G:50.7DB,2G:44.9DB,3G:40.1DB
* Write the unit with a capital letter as it is case sensitive. G (GHz) is also available.
3. When the writing ends correctly, “OK” is returned.
5) How to use
Set the measuring function of the 2650A/2651 series to electric field strength measurement mode or
magnetic field strength measurement mode.
By pushing [MEAS] → [E/F ANT], electric field strength measurement mode is set.
By pushing [MEAS] → [M/F PROBE], magnetic field strength measurement mode is set.
Select “USER” from antennas or probes on the display by pushing [F1].
Then, the measurement by the written data will begin.
* The written data remains even if power is turned off.
* The measuring mode returns to a usual measurement mode when turning off power.
6) About antenna gain
75
In the following context, the antenna gain means an absolute gain.
When the antenna gain is a relative gain, it can change into an absolute gain by adding +2.15 dB.
Absolute gain [dBi] = Relative gain [dBd] + 2.15 dB
As a reference, the conversion formula to electric field strength is indicated below:
E = √(480π2 x Pa) / (Ga x λ2))
E: Electric field strength [V/m]
Pa: Received electric power [W]
Ga: Antenna gain [times] = 10(antenna gain [dBi] ÷ 10)
λ : Wavelength [m] = (3 × 10⁸) ÷ frequency [Hz]
26. Option
Dipole antenna M401 to M406
Connector : N (P)
Refer to “19.4 Electric Field Strength Measurement” for the
details.
Magnetic field probe CP-2S.
Refer to “19.5 Magnetic Field Strength Measurement” for the
details.
Specification
USB printer
Specification
Roll printer (10 rolls)
Frequency range
Space resolution
Dimensions
:
:
:
Connectors
:
10 MHz to 3 GHz
approx.0.25 mm (depending on objects)
outside 12 φ ×135 mm
probe tip 2 mm(W)×1 mm(T)
SMA(P)
With AC adaptor and one roll of paper
Refer to “23. Storage / Print of Screen Image” for the details.
Printing method
Paper
Power source
:
:
:
Dimensions
Weight
:
:
For USB printer
76
Thermal line dot method
80 mm width thermal paper
internal : AA-sized alkaline battery (4 pcs)
external : 7.5 VDC/3 A (dedicated AC
adapter)
134(W)×60(H)×180(D) mm
approx.450 g (mainframe only)
27. Basic Performance Test
(2650A/2651/2652A/2658A)
To keep the quality of the unit, regular performance testing is recommended. This section describes a method and
specification of basic performance testing. If a problem is found in the results of basic performance testing, or formal
testing is required,please contact B&K Precision.
[Connection diagram]
Receiver for calibration
Spectrum analyzer calibration unit
2650A/2651 series
27.1 Frequency Characteristics
Adjust the output level of the spectrum analyzer calibration unit (thereafter, “calibration unit”) so that the displayed
power v alue i s -15dBm at e ach f requency for t his u nit, a nd m easure t he absolute va lue with a r eceiver for
calibration (microwave power meter, etc.).
Setting of 2650A/2652A/2651/2658A
Center frequency
Frequency span
RBW *1)
50 kHz
200 kHz
10 kHz
100 kHz
200 kHz
30 kHz
1 MHz
2 MHz
100 kHz
10 MHz
10 MHz
3 MHz
100 MHz
10 MHz
3 MHz
1 GHz
10 MHz
3 MHz
2 GHz
10 MHz
3 MHz
3.3 GHz
10 MHz
3 MHz
6.2 GHz *2)
10 MHz
3 MHz
8.5 GHz *2)
10 MHz
3 MHz
Measurement
value
Specifications
Within Reference±2.6 dB±1dot
Within Reference±2.6 dB±1dot
Within Reference±2.6 dB±1dot
Within Reference±2.0 dB±1dot
Reference
Within Reference±1.0 dB±1dot
Within Reference±1.0 dB±1dot
Within Reference±1.0 dB±1dot
Within Reference±1.0 dB±1dot
Within Reference±1.0 dB±1dot
Judgment
*1) RBW switching error is included at RBW other than 3 MHz. *2) 2658A only
· Setting of 2650A/2652A/2651/2658A
Reference level
VBW
Sweep time
Detection mode
Display scale
:
:
:
:
:
· Setting of calibration unit
-15 dBm
1 MHz
1s
SMPL
2 dB/div
77
Frequency
:
Same as a center frequency of
2650A/2652A/2651/2658A.
Output power
:
Adjust the power indication of
2650A/2652A/2651/2658A to -15
dBm.
27.2 Accuracy of Reference Level
Adjust the output level of the calibration unit so that the displayed value of this unit is the 0th div from
the top, and calibrate the absolute value with the receiver for calibration (microwave power meter, etc.).
Setting of 2650A/2652A/2651/2658A
Reference level
Specifications
+10 dBm
0 dBm
-10 dBm
-15 dBm
-20 dBm
-30 dBm
-40 dBm
within ±1.4 dB±1dot
within ±1.4 dB±1dot
within ±1.4 dB±1dot
within ±0.8 dB±1dot
within ±1.4 dB±1dot
within ±1.4 dB±1dot
within ±1.4 dB±1dot
Measurement value
Judgment
* Input attenuator switching error is included at the reference level other than -15 dBm.
·Setting of 2650A/2652A/2651/2658A
Center frequency
Frequency span
RBW
:
:
:
100 MHz
10 MHz
3 MHz
VBW
Sweep time
Detection mode
Display scale
:
:
:
:
1 MHz
1s
SMPL
2 dB/div
· Setting of calibration unit
Frequency
Output power
:
:
100 MHz
Adjust it so that the indicated
value of
2650A/2652A/2651/2658A
is at the 0th div from the top.
27.3 Display Accuracy of Center Frequency
Measure the frequency with the peak search function of 2650A/2652A/2651/2658A.
Setting of 2650A/2652A/2651/2658A
Center frequency
Frequency span
RBW
100 MHz
100 MHz
100 MHz
100 MHz
1 GHz
2 GHz
3.3 GHz *1
6.1 GHz *2
8.5 GHz *2
200 kHz
10 MHz
20 MHz
200 MHz
20 MHz
20 MHz
20 MHz
20 MHz
20 MHz
3 kHz
30 kHz
100 kHz
100 kHz
100 kHz
100 kHz
100 kHz
100 kHz
100 kHz
*1 2650A/2652A/2651 only
· Setting of 2650A/2652A/2651/2658A
Reference level
VBW
Sweep time
Detection mode
Display scale
:
:
:
:
:
Measurement
value
Center
frequency
100 MHz
100 MHz
100 MHz
100 MHz
1 GHz
2 GHz
3.3 GHz *1
6.1 GHz *2
8.5 GHz *2
Specifications
within ±50 kHz±1dot
±RBW x 6%
within ±360 kHz±1dot
±RBW x 20%
Judgment
Frequency
span
200 kHz
10 MHz
20 MHz
200 MHz
20 MHz
20 MHz
20 MHz
20 MHz
20 MHz
*2 2658A only
· Setting of calibration unit
-15 dBm
AUTO
1s
SMPL
10 dB/div
Frequency
Same as a center frequency of
2650A/2652A/2651/2658A.
Output power : -15 dBm
* However, calibrate the signal generator in advance.
78
:
27.4 Display Accuracy of Frequency Span
Adjust the frequency of the calibration equipment so that the peaks are at the positions of f1 and f9, and
measure the frequencies of f1 and f9. Calculate from f1 and f9 the display accuracy of the frequency span.
* f1: 1st div from the left on the spectrum display
Setting of 2650A/2652A/2651/2658A
f1
Measurement
value
Specifications
Frequency span
Center
Frequency
RBW
200 kHz
100 MHz
3 kHz
within ±180 kHz ×3%±1dot
10 MHz
100 MHz
100 kHz
within ±8 MHz ×3%±1dot
20 MHz
100 MHz
300 kHz
within ±18 MHz ×3%±1dot
200 MHz
100 MHz
3 MHz
within ±180 MHz ×3%±1dot
500 MHz
1 GHz
3 MHz
within ±400 MHz ×3%±1dot
2 GHz
1 GHz
3 MHz
within ±1.8 GHz ×3%±1dot
FULL(3.3 GHz)*1
1.65 GHz
3 MHz
within ±2.64GHz ×3%±1dot
2 GHz *2
4.8 GHz
3 MHz
within ±1.8 GHz ×3%±1dot
2 GHz *2
7.4 GHz
3 MHz
within ±1.8 GHz ×3%±1dot
FULL(8.5 GHz)*2
4.25 GHz
3 MHz
within ±6.8 kHz ×3%±1dot
*1 2650A/2652A/2651 only
· Setting of 2650A/2652A/2651/2658A
Reference level
VBW
Sweep time
Detection mode
Display scale
:
:
:
:
:
f9: 9th div from the left on the spectrum display
f9
Measurement
value
(f9 - f1)
Judgment
*2 2658A only
· Setting of calibration unit
-15 dBm
AUTO
1s
SMPL
10 dB/div
Frequency
:
Output power
:
Adjust it to the positions of f1
and f9.
-15 dBm
27.5 Linearity of Amplitude Axis
Adjust the level of the calibration unit so that the peak is at the top of the amplitude axis (0th div), and regard the
point set at that time as the reference. Gradually lower the output, starting from the reference, and measure the
amplitude value of 2650A/2652A/2651/2658A.
Setting of
2650A/2652A/2651/2658A
Display scales
10 dB/div
5 dB/div
2 dB/div
Output of calibration unit
Specifications
Measurement
value
XdBm (adjust it to the 0th div)
Reference(-15 dBm)
(-15 dBm)
X-10 dBm
Within -25 dBm±0.8 dB±1dot
XdBm (adjust it to the 0th div)
Reference(-15 dBm)
X-5 dBm
Within -20 dBm±0.4 dB±1dot
XdBm (adjust it to the 0th div)
Reference(-15 dBm)
X-2 dB
Within -17 dBm±0.2 dB±1dot
·Setting of 2650A/2652A/2651/2658A
· Setting of calibration unit
79
(-15 dBm)
(-15 dBm)
Judgment
Center frequency
Reference level
Frequency span
RBW
VBW
Sweep time
Detection mode
:
:
:
:
:
:
100 MHz
-15 dBm
10 MHz
3 MHz
1 MHz
1s
SMPL
Frequency
80
:
100 MHz
25. USB Device Function
25.1 Outline
The 2650A/2651 series is equipped with two kinds of USB connecters; A and B plugs. The A plug is for USB
host and is connected to USB devices such as USB memory or printer. The B plug is for USB device and is
connected to USB host such as a personal computer. The device function is explained in this chapter.
As for the host function using USB A plug, refer to “23. Storage and print of screen image”.
25.2 How to Connect
When using the USB device, connect with the included USB cable as illustrated
USB A plug
USB B plug
25.3 Installation of Driver
An instrument specified USB driver is necessary in order to control the 2650A/2651 series with a PC via USB
interface, and should be installed in the PC prior to using the software. The driver along with instructions can be
downloaded from our website (Go to the Support section and select download). After the
downloaded file is unzipped, the 2650A/2651 series is connected to a PC with the USB cable and then the power
is turned on. The detection wizard for the USB driver starts on the PC screen the moment the power of the
2650A/2651 series is turned on, and install it following this wizard.
25.4 Sample Program
Please contact us to request a sample code which demonstrates how to write a
custom program using the commands in the following section.
63
99 Washington Street
Melrose, MA 02176
Fax 781.665.0780
TestEquipmentDepot.com
Visit us at www.TestEquipmentDepot.com
Test Equipment Depot - 800.517.8431 - 99 Washington Street Melrose, MA 02176
FAX 781.665.0780 - TestEquipmentDepot.com
82