1
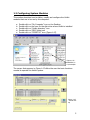
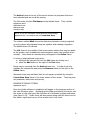
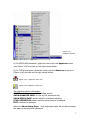
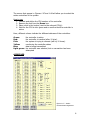
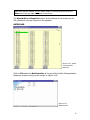
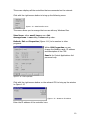
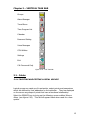
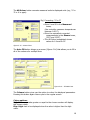
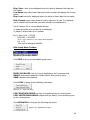
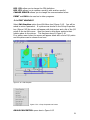
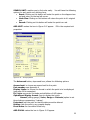
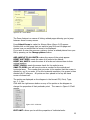
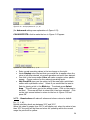
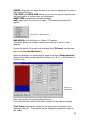
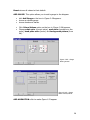
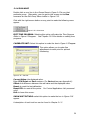
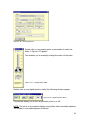
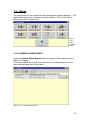
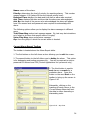
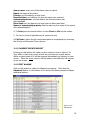
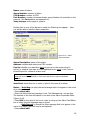
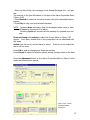
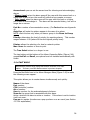
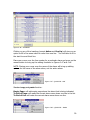
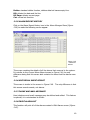
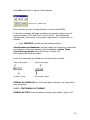
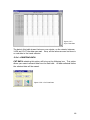
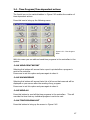
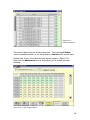
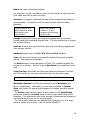
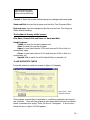
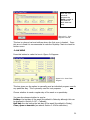
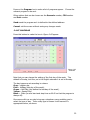
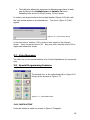
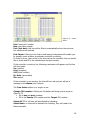
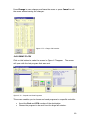
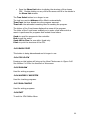
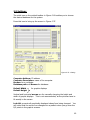
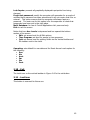
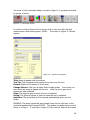
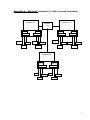
UniArt User’s Manual
Version 1.6 January 2001
Control Applications Ltd.
3 Tvuot Ha’aretz St, Tel Aviv, 69546, Israel
Ph: 972-3-647 4998 Fax: 972-3-647 4598
Email: [email protected] Website: www.ddc.co.il
(Compiled by Caroline Johnson)
Contents
LIST OF FIGURES ..........................................................................................1
SECTION 1: GETTING STARTED ...................................................................3
CHAPTER 1 GENERAL .......................................................................................4
1.1
Software Installation Instructions ..............................................4
1.2
Configuring Systems Modules....................................................5
SECTION 2: WORKING WITH UNIART ........................................................11
CHAPTER 1 TASK BARS... .................................................................................12
CHAPTER 2 VERTICAL TASKBAR........................................................................13
2.1
2.1.1
2.1.2
2.1.3
2.1.4
2.1.5
2.1.6
Group......................................................................................13
Creating and editing logical groups............................................13
Group Properties ......................................................................14
Edit ....... .................................................................................16
Edit Graphics ........................................................................... 21
Edit Groups ............................................................................. 29
Run Mode ................................................................................ 30
2.2
2.2.1
2.2.2
2.2.3
2.2.4
2.2.5
2.2.6
2.2.7
2.2.8
Alarms..................................................................................... 33
Current Alarm Report ............................................................... 33
Current Events Report .............................................................. 35
Edit Alarms .............................................................................. 35
Fast Build ................................................................................ 38
Alarm Report History ................................................................ 40
Historical Event Report ............................................................. 40
Phone and Mail Messages ......................................................... 40
Print Alarm List ........................................................................40
2.3
2.3.1
2.3.2
2.3.3
2.3.4
Trend Reports.......................................................................... 41
Creating and editing trends ...................................................... 41
Graphical display of trends ....................................................... 42
Text display of trends ............................................................... 45
Deleting data ........................................................................... 46
2.4
2.4.01
2.4.02
2.4.03
2.4.04
2.4.05
2.4.06
2.4.07
2.4.08
2.4.09
2.4.10
2.4.11
2.4.12
Time Program/Time dependant actions ..................................... 47
Send Print Report..................................................................... 47
Show Errors ............................................................................. 47
Send All................................................................................... 47
Time Program List .................................................................... 47
Duplicity Check ........................................................................50
Send .......................................................................................51
Calendar..................................................................................52
Export to HTML........................................................................53
CPU Clock ................................................................................53
Sort.........................................................................................53
See Time History......................................................................55
Sort the list..............................................................................55
2.4.13
2.4.14
2.4.15
Print ........................................................................................55
Fast Edit ..................................................................................55
Exit .........................................................................................56
2.5
Calendar..................................................................................57
2.6
Password Setting .....................................................................57
2.7
Voice Messages........................................................................58
2.8
2.8.1
2.8.2
2.8.3
2.8.4
2.8.5
2.8.6
2.8.7
2.8.8
Special Programming Features ..................................................58
Check Active ............................................................................58
Send to CPU ............................................................................60
Build Tree................................................................................61
CPU Clock ................................................................................61
Run BAK ..................................................................................61
Mapped Y Register ...................................................................61
Run Compile ............................................................................61
Exit .........................................................................................61
2.9
Settings ...................................................................................62
2.10
Exit .........................................................................................63
2.11
Last icon..................................................................................63
SECTION 3: HORIZONTAL TASK BAR ..........................................................64
APPENDIX A – NETWORK (includes PC’s, COM’s, Ports and Controllers) ..........67
List of Figures
CD-ROM icon in “My Computer”............................................................1.01
PRJSETUPin C:\UniArt\Bin....................................................................1.02
UniArt Setup .......................................................................................1.03
UniStarter location ..............................................................................1.04
Appserver menu icon...........................................................................1.05
Netserver menu icon ...........................................................................1.06
UniArt Communication Appserver .........................................................1.07
UniArt Communication Netserver ..........................................................1.08
NetControllers.....................................................................................1.09
NetController Menu .............................................................................1.10
CPU Properties....................................................................................1.11
Netserver IP address ...........................................................................1.12
Main Menu icon...................................................................................2.01
Vertical Taskbar ..................................................................................2.02
Groups Menu ......................................................................................2.03
Edit Menu Box ....................................................................................2.04
Group Properties.................................................................................2.05
Operational Planning Document ...........................................................2.06
Group Menu .......................................................................................2.07
I/O Configurations...............................................................................2.08
Edit Group Menu- Extended .................................................................2.09
Type/Eng/f(x) .....................................................................................2.10
CPU/File/Points/Port/Level/Display limits ...............................................2.11
Conversion Formulae...........................................................................2.12
Linear Software ..................................................................................2.13
Fill Multi Lines.....................................................................................2.14
Edit Group Menu toolbar......................................................................2.15
File sub-menu.....................................................................................2.16
Copy sub-menu...................................................................................2.17
Replaces sub-menu .............................................................................2.18
Edit Graphics ......................................................................................2.19
Group properties sub-menu .................................................................2.20
Unit Properties....................................................................................2.21
Zoom Editor........................................................................................2.22
Edit Unit.............................................................................................2.23
Unit Properties for 1,1,Ai......................................................................2.24
Color Effects .......................................................................................2.25
Add sub-menu ....................................................................................2.26
Vessel Editor.......................................................................................2.27
Gauge Editor- general .........................................................................2.28i
Gauge Editor- colors/values .................................................................2.28ii
Slide Editor- general ............................................................................2.29i
Slide Editor- colors ..............................................................................2.29ii
Add Label ...........................................................................................2.30
Animation Selector ..............................................................................2.31
Group Menu Toolbar............................................................................2.32
Edit Groups sub-menu .........................................................................2.33
Point Menu .........................................................................................2.34
Set Unit..............................................................................................2.35
Unit Properties 2 .................................................................................2.36
Analog Value Slider .............................................................................2.37
Digital Value Buttons ...........................................................................2.38
Run Mode Toolbar...............................................................................2.39
1
Alarm Manager Menu ..........................................................................2.40
Current Alarms Report .........................................................................2.41
Key Sorts ...........................................................................................2.42
Edit Alarms.........................................................................................2.43
Alarm Properties Editor........................................................................2.44
Alarm Properties Editor – Advanced ......................................................2.45
Fast Build ...........................................................................................2.46
Quick Edit – add .................................................................................2.47
Quick Edit – delete ..............................................................................2.48
Historical Alarms .................................................................................2.49
Select Trend and sub-menu .................................................................2.50
Trends Editor .....................................................................................2.51
Foyer Graphical Data ...........................................................................2.52
Trend Toolbar.....................................................................................2.53
Trend Toolbar sub-menu .....................................................................2.54
Timing ...............................................................................................2.55
Select Time ........................................................................................2.56
Foyer Text Data ..................................................................................2.57
Cut Trend Data ...................................................................................2.58
Time Program Menu ............................................................................2.59
Time Program List...............................................................................2.60
Time Program Editor ...........................................................................2.61
Time Program Check A ........................................................................2.62
Time Program Check B ........................................................................2.63
Send Time Program.............................................................................2.64
Calendar ............................................................................................2.65
Send Clock .........................................................................................2.66
Time Program Sorted List ....................................................................2.67
Time History .......................................................................................2.68
Password Setting ................................................................................2.69
Access Level Setup..............................................................................2.70
CPU Utilities Menu...............................................................................2.71
Check Active ......................................................................................2.72
Change CPU number ...........................................................................2.73
Compile and Send programs ................................................................2.74
Setting ...............................................................................................2.75
Horizontal taskbar ...............................................................................3.01
AutoZoom Properties...........................................................................3.02
2
SECTION 1
GETTING STARTED
Chapter 1- GENERAL
UniArt is a PC-based, user-friendly SCADA software package intended for
monitoring and controlling DDC/PLC controllers.
UniArt establishes a natural Man Machine Interface (MMI) between the
control staff and the site’s control system.
UniArt is especially designed to monitor and control heating, ventilation and
air-conditioning (HVAC) systems as well as electrical, energy, fire detection,
lighting and extinguishing systems.
The communication server that connects the UniArt to the controller is the
centre of the system. This server sets the communication protocol between
the computer/PC and the controller.
The standard system includes the following items:
• Communication server
• Menu
• Alarm
• Miscellaneous
UniArt uses it’s own database. Each page of the database can contain up to
40 groups and each group can be connected to 80 points.
1.1 Software Installation Instructions
NOTE: Close down all applications already running in Windows as this may conflict with
the set-up procedure.
Insert the CD to the CD drive. The program should run automatically.
If not, follow these steps:
a. Double-click on “My Computer” icon on the Desktop (see Figure 1.01)
b. Double-click on CD-ROM icon
c. Find the UniArt.exe icon and double-click
d. Follow the program’s installation instructions
Double-click on CD-ROM icon
Figure 1.01 – CD-ROM icon in “My
Computer”
4
1.2 Configuring System Modules
This section describes how to define, modify and configure the UniArt
modules that are to be run by the computer.
a.
b.
c.
d.
e.
Double-click
Double-click
Double-click
Double-click
Double-click
on
on
on
on
on
“My Computer” icon on the Desktop
the icon for the disk drive where UniArt is installed
“UniArt directory” icon
“BIN” folder icon
“PRJSETUP” icon (Figure 1.02)
Figure 1.02 PRJSETUP in
C:\UniArt\Bin
The screen that appears in Figure 1.03 offers the user the basic functions
needed to operate the UniArt system.
Figure 1.03
- UniArt SetUp
5
The Active frame at the top of the screen shows the programs that have
been selected and are currently running.
The files under the title File Name are the default items. They include:
appserver.exe 1
mainmenu.exe
alarmrun.exe
trendrun.exe
NOTE: If you are connected via ethernet you must change
appserver.exe 1 to netserve.exe in Create New Item.
The column entitled Wait shows the delay time between running programs
so as to prevent all programs being run together and creating congestion.
The default time is 5 seconds.
The List frame in the middle of the screen shows options that may be added
to the system, such as additional communications ports (use scrollbar when
needed). Once items are selected they will appear in the Active frame.
In order to select/activate a new item:
a. highlight the relevant file from the List frame by clicking on it
b. press the Add button to the right of the List menu.
Items may be removed from the Active frame only. In order to do this,
highlight the relevant file and press the Remove button to the right of the
Active frame.
Advanced users may add items that do not appear as default by using the
Create New Item frame in the lower section of the screen. They may also
set parameter, delay time and priority.
EXAMPLE OF DEFAULT ITEMS:
appserver.exe 1…
Once the UniArt software is installed it will appear in the program section of
the main Windows menu. Highlighting this folder and placing the cursor over
the arrow on the right-hand side will show the UniStarter program sub-menu,
(see Figure 1.04). UniArt icons will also appear along with the other icons in
the bottom right-hand corner of the screen next to the clock.
6
Figure 1.04 –
UniStarter location
a) For RS232/485 connection, place the cursor over the Appserver menu
icon (Figure 1.05) and click on the right mouse button.
b) For TCP/IP connection, place the cursor over the Netserver menu icon
(Figure 1.06) and click on the right mouse button.
Figure 1.05 – Appserver menu icon
Figure 1.06 – Netserver menu icon
The following options will appear:
ABOUT: details about currently installed version
SHOW MANAGER PAGE: for use by CAL personnel only
SHOW DEBUG PAGE: allows selection of active controllers
LEVEL DEFINITION: allows security access level to be defined
EXIT: to close the program
Select the Show Debug Page. Only authorised users will be able to access
this page by entering their password.
7
The menus that appear in Figures 1.07 and 1.08 will allow you to select the
active controllers in the system.
How to use:
1. Connect and define the CPU number of the controller.
2. Remove the tick from the Demo box.
3. Place a tick in the box(es) next to the relevant CPU(s).
4. Wait for the CPU to turn green and so confirm that the controller is
active.
Here, different colours indicate the different statuses of the controllers.
Green:
Red:
Pink:
Yellow:
Blue:
Light green:
the controller is active
the controller is inactive (after 10 tries)
the system is trying to connect (will try 10 times)
monitoring the controller status
data is being transmitted
the controller was selected, but no connection has been
attempted
APPSERVER
Figure 1.07 – UniArt
communication Appserver
8
Make sure that the system is not in demo mode, by removing the tick from the
Demo box at the top right-hand side of the screen.
The Special All and Reset On buttons at the bottom of the screen are for
CAL personnel only and should not be adjusted.
NETSERVER
Figure 1.08 – UniArt
communication
Netserver
Click on File and then NetController at the top of the UniArt Communication
Netserver screen to bring up the screen in Figure 1.09.
Figure 1.09 –
NetControllers
9
This screen displays all the controllers that are connected on the network.
Click with the right mouse button to bring up the following menu.
Figure 1.10 – NetController menu
This menu allows you to arrange the icons as with any Windows files.
View Icons: either small, large or as a list.
Arrange icons: in ascending or descending order.
Refresh, Exit and Properties (Figure 1.11) to be used as in other
programs.
Within Edit Properties you can
change the NetBios name, IP address
and description of the CPU.
Send is for Control Applications Ltd.
personnel only.
Figure 1.11– CPU Properties
Click with the right mouse button on the relevant CPU to bring up the window
in Figure 1.12.
Figure 1.12 – Netserver IP address
Enter the IP address of the controller here.
10
SECTION 2
WORKING WITH UNIART
Chapter 1 – TASK BARS
•
The horizontal bar features a set of icons that represent groups of
critical functions.
• The vertical bar is smaller than the horizontal and is used for editing
functions, creating alarms, creating groups, setting times and more.
See map of the task bars at the bottom of the page.
Once the programs are loaded their respective icons appear on the bottom
right-hand side of the screen in the task tray next to the computer’s clock.
Click with right mouse button on the main menu icon (Figure 2.01).
Figure 2.01 – Main Menu icon
The following menu will appear:
ABOUT: details about currently installed UniArt software
NORMAL UNI BAR: will show the task bars only when the cursor
approaches the top left of the screen
SHOW UNI BARS: allows continuous display of task bars
HIDE UNI BARS: hides the taskbar
EXIT: to close the program
12
Chapter 2 – VERTICAL TASK BAR
Groups
Alarm Manager
Trend Menu
Time Program List
Calendar
Password Setting
Voice Messages
CPU Utilities
Settings
Exit
CAL Personnel Only
Figure 2.02 – Left Task Bar
2.1 - Folder
2.1.1 CREATING AND EDITING LOGICAL GROUPS
Logical groups are made up of input points, output points and parameters
which are defined by their addresses on the controller. They are displayed
on the screen as groups of points that have a functional relationship.
Select the GROUPS icon to bring up the following screen entitled Groups
Menu, (see figure 2.03). This list will appear blank when used for a new
system.
13
Figure 2.03 – Groups Menu
To edit any of the lines in the Groups Menu, place the cursor over the line
and click on the right mouse button. The following box should appear,
(Figure 2.04).
Figure 2.04 – Edit menu box
2.1.2 GROUP PROPERTIES
Select Group Properties in the Edit Menu box, (figure 2.04) to make the
box in Figure 2.05 appear.
NOTE: This box will appear blank, as in figure 2.05, if the line is not in use.
Figure 2.05 – Group properties
14
Name: Give a name to the group, eg. A/C No.1.
Group Number: Line number in Groups Menu box.
Acc. (access) Level: to be assigned by the supervisor to limit access to
displaying group data.
Reset will return all levels to their default as defined in Chapter 9 – Settings.
Picture Name: Press the change button to select an image either from
Control Applications Ltd.’s library, user’s library or another source. This will
serve as background picture for the displayed group.
Jump to page: enables the user to ‘jump’ straight to a defined page by
double-clicking on that line in the Group Menu. This allows for easy access
to pages when the user is working with many pages.
View as table: Can view data as a table rather than a picture.
Font Color: to change the color of the group name.
Advanced: for Control Applications Ltd. personnel only.
15
2.1.3 EDIT
The user creates groups in his/her own logical manner so that the points on
site can be viewed from his/her computer.
Each group represents a collection of points, (for example these can be points
of a specific device or a zoom).
Choose a blank line in the Group Menu (Figure 2.03) and select EDIT from
the Edit Menu box (figure 2.04).
For this example, Line 1 the AHU 1-1 Foyer, has been chosen.
Figure 2.07 – Edit Group
Menu
i.
ii.
iii.
Fill in the name of the group in the Group Name box.
Fill in the Name of each point, one per line.
Click on the desired line in the Type column and a menu box will appear
(see figure 2.08) for easy selection of I/O configuration.
A. In = analog in
A. Out = analog out
D. In = digital in
D. Out = digital out
Par. = parameter
D. Par. = digital parameter
Figure 2.08– I/O configurations
iv.
v.
vi.
Click on the desired I/O point to select.
Fill in the CPU column with the number of the controller.
NOTE: groups may include points from more than one controller.
The File column refers to the program associated with the point. This
is only relevant when the point is defined as a parameter (Par.).
16
vii. Point refers to the number of the I/O point.
NOTE: OUT points are numbered n (1-32) and IN points are numbered
n+50 (51-83).
viii. Eng. refers to the engineering unit.
Select the suitable unit where relevant by clicking on the desired line
and choosing one of the options that appear in the menu box.
NOTE: Digital points will not need this.
The Advanced button at the bottom of the screen enables the user to access
additional editing options (Figure 2.09).
Figure 2.09 – Edit group menu-extended
The Access Level box in the top right hand corner of the screen allows the
user to choose an access level for the group. Once an access level has been
selected the user will be required to enter a password in order to access this
editing option, (see Chapter 2.6 – Password Settings for more details).
Access levels may also be established for each point in the column headed
Level.
Reset Acc. Level:
There are two columns entitled Protect:
• Ticking the left boxes (P) will lock the specific points so that the data
may not be changed.
• Ticking the right boxes (H) will hide the specific points on any graphic
display of the system.
Click on the titles of the columns (eg Type or CPU) to make the boxes in
figures 2.10 and 2.11 appear. These boxes allow the user to fill in the same
value for many lines as oppose to one at a time.
17
Figure 2.10– Type/Eng./F(x) value box
• Click on Type, Eng. and
F(x) to make the box in
figure 2.10 appear.
• Type in the lines you would
like to fill.
• Click OK
•
•
For Type, a menu box with I/O point options will appear.
Define the same I/O point for all chosen lines.
•
Click on CPU, File, Points, Port, Level and Display limits so the box
in Figure 2.11 appears.
•
Select the lines you would
like
to fill and place number in the
Value box, (for Display Limits
select min. and max. value).
•
Press OK.
Figure 2.11- CPU/File/Points/Port/Level/Display limits value box
For Port address see Appendix A.
Fill All: to include all lines that you have selected. If this option is not
chosen all lines with the value of zero will remain with a value of zero.
Ignore Empty Names: lines that have not been named will not be altered.
Clicking on any line under the F(x) column will make the box in Figure 2.12
appear.
Figure 2.12 – Conversion formulae
This box enables the user to define the A/B values and to convert the units
measured by the controller to those to be displayed on the PC (UniArt).
18
The AB Solver button converts measured units to displayed units (eg., °C to
°F or V to ppm).
Eg.) Converting °C to °F
• Enter 0 and 50 in the Measured
boxes,
(the controller measures temperatures
between 0-50°C).
• Enter the equivalent converted
measurements in the Shown boxes,
(32°F and 122°F).
• The AB Solver immediately shows
values A=1.8 and B=32.
Figure 2.13 – Linear Solver
The Auto Fill button brings up a screen (Figure 2.14) that allows you to fill in
all of the columns for multiple lines.
Figure 2.14 – Fill Multi Lines
The Colours button gives you the option to colour the displayed parameters.
Pressing this button again returns you to the regular screen.
Colour options:
High Value: any value greater or equal to the chosen number will display
the chosen colour.
Disp. High: text to be displayed when the value is higher than the high
value.
19
Disp. Inter.: text to be displayed when the value is between the high and
low values.
Low Value: any value lower than the chosen number will display the chosen
colour.
Disp. Low: text to be displayed when the value is lower than the low value.
Disp. Format: uses a box similar to that in figures 2.10 and 2.11 allowing
you to choose the format that you want values to be displayed in.
Use #’s and/or 0’s to set the display format.
#: keeps the place of a number to be displayed
0: places 0 where there is no number
Eg.) ####.### = 234.56
0000.000 = 0234.560
#.# = if the value here is zero nothing will be displayed
0.0 = 0.0
Time can be displayed HH:MM
Edit Group Menu Toolbar:
Figure 2.15 – Group Menu Toolbar
Press FILE to bring up the following sub-menu.
Figure 2.16 – File sub-menu
EXCEL PCU RULES: Use for Control Applications Ltd. personnel only.
ABOUT: Information about the UniArt version that you are using.
SAVE: standard save feature.
Press COPY to bring up the following sub-menu.
Figure 2.17 – Copy sub-menu
COPY ANOTHER GROUP: to copy a complete group to current group.
COPY UNITS FROM GROUP: copies units (at least 2) from another group
to the current group.
Press REPLACES to bring up the following sub-menu.
Figure 2.18 – Replaces sub-menu
20
REP. CPU: allow you to change the CPU definition.
REP. STR: allows you to replace a word(s) with another word(s).
CHANGE SERVER: allows you to change the communication server.
PRINT and RUN to be used as in other programs.
2.1.4 EDIT GRAPHICS
Select Edit Graphics option from Edit Menu box (Figure 2.04). You will be
asked to enter a password. If a picture was chosen in the Group Properties
box (Figure 2.05) the screen will appear with that picture and a list of the I/O
points in the top left corner. Now you have to drag these points to their
relative place on the picture. This has been done in Figure 2.19.
If no picture was chosen the screen will appear blank with a list of I/O points
and the picture can be chosen from here.
Figure 2.19 - Edit Graphics
Figure 2.20 – Group Properties sub-menu
GROUP PROPERTIES: opens box in Figure 2.05.
21
SEARCH UNIT: enables you to find units easily. You will have the following
options for each point once clicking here.
• Reset: Clicking on this button will make the point on the diagram turn
red and return to the top left corner.
• Undo Size: Clicking on this button will return the point to it’s original
size.
• Search: Clicking on this button will make the point turn red.
ADD UNIT: makes the box in Figure 2.21 appear. Fill in the required unit
properties.
Figure 2.21 – Unit properties
The Advanced button, depressed here, allows the following options:
Access level: to choose an access level for the point.
Port number: see Appendix A.
Display Limits: to choose the format in which the point is to be displayed
(see page 20 for examples).
F(x) type: conversion formulae and definition of A/B values.
Operational Display format (how to display the units):
Normal (sliding gauge), Valve, Gauge or Discrete (option to set
three buttons representing 3 values).
Protected: lock the point so that the data cannot be altered.
Hidden: hide the point in any graphic display.
Excel Rules: for use within Israel only.
ADD ZOOM: makes the box in Figure 2.22 appear.
22
Figure 2.22 - Zoom Editor
The Zoom feature is a means of linking related pages allowing you to jump
between them for easy access.
Press Select Group to make the Groups Menu (figure 2.03) appear.
Double-click on the group that you want to jump to from this page and
choose how you would like the zoom to be displayed.
If you wish to view the zoom as a picture, choose a related picture from your
file by pressing on the Change picture button.
ADD LABELS TO ALL UNITS: makes the name of the points appear.
RESET UNIT SIZE: resets the sizes of all units to the default.
RESET ALL UNITS: resets the sizes of all units and returns them to their
original position.
RESET LEVELS: resets the access levels for the units to zero.
SNAP TO GRID: you will have to enter a number for the vertical and
horizontal axes. The number that you enter is the number that the screen is
divided by, eg) if you enter 10 for the horizontal resolution, the screen is then
divided into 10 columns. All points are then placed in the top left hand
corner of closest cell.
The points are displayed on the diagram in the format CPU, Point, Type,
eg., 1, 1, Ain.
Click with the right mouse button on any of the points on the diagram to
change the properties of that particular point. The menu in Figure 2.23 will
appear.
Figure 2.23 – Edit Unit
EDIT UNIT: allows you to edit the properties of individual units.
23
Figure 2.24 – Unit properties for 1, 1, Ai.
(for Advanced settings see explanation of Figure 2.21).
COLOR EFFECTS: click to make the box in Figure 2.25 appear.
Figure 2.25 – Color effects for 1, 1, Ai.
•
•
•
•
Enter normal operating values in the two boxes on the right.
Under Display enter the text that you would like to appear when the
value is less than desired, at normal operation and more than desired.
One click in the boxes under Color will make a regular colour palette
appear. Choose colours for the relevant operating levels.
Use Flood Fill gives you the option to fill an area with a solid black
outline with a particular colour. Select if you would like the area to
flash by placing a tick in the Blink box. To activate press Select
Area. This will return you to the editing screen. Click on the area to
be filled. This area will flash to show that it has been selected. Click
on the right mouse button to return to the box in Figure 2.25 and
press OK.
NOTE: - Reset colors will make all values and colours return to default.
Eg., (1, 1, Ai)
Normal operating levels are between 20°C and 30°C.
When the value is greater than 30°C it will display red, when the value is less
than 20°C the point will be blue and when it’s operating within the normal
range the point will be yellow.
24
RESIZE: allows you to change the size of the point by dragging the arrows in
the corners of the box.
COPY SIZE and PASTE SIZE: allows you to copy the size of a specific point
and then paste it in another place on the diagram.
RESET SIZE: changes the size back to default.
ADD: place cursor on arrow to the right. The following sub-menu will
appear.
Figure 2.26 – Add sub-menu
ADD VESSEL: click so the box in Figure 2.27 appears.
This option allows you to add a vessel such as a tank or boiler to your
diagram.
Choose the colour of the area that is already filled (Fill color) and the area
that is not filled (Not filled color).
Select the direction you would like the vessel to be filled (Filling direction).
Values will be filled in automatically for filling L to R, R to L, top to bottom or
bottom to top.
Figure 2.27 –
Vessel Editor
Move the scroll bar to check the filling direction.
If you wish that the vessel be filled at an angle fill in the values manually.
Total Points indicates the number of red points that are located on the
diagram to the left. These points may be dragged to change the shape of
the vessel.
25
Reset returns all values to their default.
ADD GAUGE: This option allows you to add a gauge to the diagram.
•
•
•
click Add Gauge so the box in Figure 2.28i appears.
choose a suitable gauge.
choose knobs and hands.
•
•
Click Colors/Values option so the box in Figure 2.28ii appears.
Choose value color (current value), scale color (numbers on the
scale), knob plate color (knobs) and background picture (from
file).
Figure 2.28i – Gauge
Editor-general
Figure 2.28ii – Gauge
Editor-Colors/Values.
ADD ANIMATION: click to make Figure 2.31 appear.
26
Figure 2.31 – Animation
Selector.
Select the appropriate picture to be added to the point by clicking on it and
then on OK.
The picture will appear in the top right corner of the screen and can be
dragged using the mouse to it’s desired position.
NOTE: some of the objects have parts that move either clockwise or anticlockwise.
Place the cursor on the picture and click once with the right mouse button.
This will enable you to Edit, Find Unit, Resize, copy size, paste size and
delete animation.
ADD SLIDER: allows you to add a slider to your diagram.
(Figure 2.29i):
Choose slider direction eg., up/down or left/right – Slider direction.
Choose the Frame style.
Choose scale to be above/below or to left/right of the bar – visible
scale.
• Choose Inverse Direction to change the direction of the slider.
Styles
•
•
•
27
Figure 2.29i – Slide
Editor – general
Colors (Figure 2.29ii):
• Choose value color (current value), scale color (numbers on the scale),
knob color (knobs), back color (background colour), frame bright
color and frame shadow color (two colours of the frame).
Figure 2.29ii – Slide
Editor - Colors
ADD LABEL: enables you to add a label to any point.
Allows you to add a label to any point.
Figure 2.30 – Add label
28
•
•
•
•
High Text will appear when the value is higher than the High Value.
Low text will appear when the value is between the High Value and
Hide Value.
Values lower than the Hide Value will be hidden.
Select desired colours.
ADD REAL TIME GRAPH: enables you to add a line graph to track the
progress of certain points, (usually analog).
After adding graph press run to activate.
DELETE UNIT: to remove the unit.
CANCEL: standard cancel function.
Toolbar:
Figure 2.32 – Edit Group Menu Toolbar
Press FILE for the following options:
SAVE: normal save function
RESTORE: will restore all data changed since last save.
EXIT: to leave the edit page.
Press PRINT and RUN to be used as in other programs.
Press EDIT for the Group Properties sub-menu, as in Figure 2.20.
2.1.5 EDIT GROUPS
Figure 2.33 – Edit groups sub-menu
Select Edit Groups option from Edit Menu box (Figure 2.4) to bring up the
box in Figure 2.33.
This menu allows you to delete, copy and paste groups.
29
2.1.6 RUN MODE
Double click on any line in the Groups Menu in Figure 2.03 to run that
particular group. Alternately, you can get to this screen via the Run
command on the Edit Group Menu toolbar in Figure 2.15.
Click with the right mouse button on any point to make the following menu
appear.
Figure 2.34– Point Menu
EDIT TIME PROGRAM: Selecting this option will make the Time Program
Editor in Figure 2.34 appear. See Chapter 2.5.04 for details on setting time
programs.
CALIBRATE UNIT: Select this option to make the box in Figure 2.35 appear.
This option allows you to make fine
adjustments to each point for optimal
functioning.
Figure 2.35 – Set Unit
Current Value: the displayed value.
Enter CPU/Point and Port numbers (For Port address see Appendix A).
Offset: the difference between the real value and the displayed value.
Reset: to reset the last calibration.
Reset CPU: to reset all the points. For Control Applications Ltd. personnel
only!!
Exit: to leave this screen.
SHOW UNIT DETAILS: select this option to make the box in Figure 2.36
appear.
A description of each text box can be found in Chapter 2.1.3.
30
Figure 2.36 – Unit Properties 2
Double-click on any analog point or parameter to make the
slider in Figure 2.37 appear.
This enables you to manually change the value of the point.
Figure 2.37 – Analog Value Slider
Double click on any digital point to make the following window appear.
Figure 2.38 - Digital Value buttons
This window allows you to turn a particular point on or off.
NOTE: The point on the graphic display turns yellow when manually adjusted.
The toolbar in run mode appears as follows:
31
Figure 2.39 – Run Mode Toolbar
Slide: Press this button and then resize the window to place scroll bars at
the right and bottom. The window can also be resized by dragging it’s
corners, but data may be omitted if the screen is reduced too much.
Edit: returns you to Edit Graphics screen in Figure 2.19.
Sound: Play: to play any prerecorded messages.
Record: opens a standard Windows recorder and can be used to
record messages eg) explanation of the system.
Clicking on the back arrow returns you to the last screen you visited.
32
2.2 - Alarms
The second icon on the vertical task bar represents the Alarm Manager. This
option will enable you to create and monitor alarms. Click on the icon to
bring up the box in Figure 2.40.
Figure
2.40 –
Alarm
Manager
Menu
2.2.1 CURRENT ALARM REPORT
Press the Current Alarm Report button in Figure 2.40 to make the box in
Figure 2.41 appear.
This screen allows you to see all current alarms, including those that have
been acknowledged but not yet fixed.
Figure 2.41 – Current Alarms Report
33
Name: name of the alarm.
Priority: determines the level of priority for reporting alarms. This number
ranges between 1-99 (where 99 has the highest priority level).
Received Time: displays the date and time that an alarm was received.
Ack. Time: displays the date and time that the alarm was acknowledged.
Ack. By: the name of the person who acknowledged the alarm will appear
here if an access level and password were required to acknowledge the
alarm.
The following options allow you to display the alarm messages in different
ways:
Text/Show Msg: makes text message appear. Eg, text may be instructions
as to what to do when that specific alarm is ringing.
Voice/Play Msg: plays sound/voice message.
Grp: runs the group in which the current alarm is located.
Current Alarm Report Toolbar:
The toolbar is located above the Alarm Report table.
1. The first button on the left shows a door allowing you to exit the screen.
2. The second button to the left allows you to delete the alarm. This option
is for debugging and testing purposes only. You will be required to enter a
password for Access Level 100 (Control Applications Ltd. personnel only).
3. The third button is used to
sort alarms or search for a
particular alarm. Press this
button or the word Sort on the
toolbar to bring up the screen in
Figure 2.42.
Alternately, clicking on the
headings of each column in the
Current Alarms Report will sort
the data in either ascending or
descending order.
Figure 2.42 – Key Sorts
34
Query name: enter part of the alarm name to search.
Name: full name of the alarm.
Priority: sort the data by priority level.
Received time: sort data by the time the alarm was received.
Acknowledged time: sort the data by the time the alarm was
acknowledged.
Fixed time: sort the data by the time that the alarm was fixed.
Name of acknowledging party: find the alarm by the name of the person
who acknowledged it.
4. To Print press the fourth button or enter Print via File on the toolbar.
5. For use by Control Applications Ltd. personnel only.
6. Full Desc.: allows the full name description to be displayed by removing
the Priority and Received Time columns.
2.2.2 CURRENT EVENTS REPORT
Pressing on this button will make a screen similar to that in Figure 2.41.
They differ in that here current events are reported not current alarms.
When an alarm goes off it will be reported immediately by flashing on your
screen. When an event occurs it will be listed in this table but will not pop
up on the screen.
2.2.3 EDIT ALARMS
Click on this button to make the following box appear. Note that the
Advanced button on the bottom of the screen has been pressed to display
additional options.
Figure 2.43 –
Edit Alarms
35
Name: name of alarm.
Alarm Number: number of alarm.
CPU Number: number of CPU.
Port Number: number of communication server/location of controller on the
network, (for Port address see Appendix A.)
Jump to page: which page to jump to.
Double click on any of the alarms to make the following box appear. Here
you will be able to edit the alarm properties.
Figure 2.44 – Alarm
Properties Editor
Alarm Description: name of the alarm.
Address: includes both alarm and CPU number.
Pop Up: whether you want the alarm to pop-up on the screen when it
occurs, or whether you want it to be registered as an event in the Current
Events Report for review at a later time.
An example of an alarm (pop-up) may be a fire or another critical situation, whereas an
event may be a blown light bulb or some event that does not require immediate
attention.
Auto Print: select this box in order to print in the case of an alarm.
Notes: - Help Msg: to enter the text message that is to appear in the event
of an alarm.
- Press select/edit.
- Enter the title of the text message in the Text Message box- one per line.
The number of the line will feature in the box in the Alarm Properties Editor
(Figure 2.44).
- Press Edit on the right of the line in order to bring up the Alarm Text Editor
box in which the text message may be typed.
- Help Record: to record the voice message that is to appear in the
event of an alarm (you will need a microphone).
- Press select/edit.
36
- Enter the title of the voice message in the Sound Messages box - one per
line.
The number of the line will feature in the box in the Alarm Properties Editor
(Figure 2.56).
- Press Record to make the recording screen with all the standard buttons
appear.
- Press Play to play your prerecorded message.
NOTE: Selecting Auto will ensure that the messages (either voice or text)
will appear in the event of an alarm.
Selecting Cycle will ensure that the message is repeated over and
over.
Zoom to Group: click select to make the Groups Menu in Figure 2.03
appear. From here, double click on the group that is to be associated with
the alarm.
Active: tick the box to set the alarm to active. If the box is not ticked the
alarm will not occur.
Press OK to save all changes and close the window.
Press Cancel to close the window without saving changes made to the data.
Press the Advanced button on the Alarm Properties Editor in Figure 2.44 to
make the following box appear.
Figure 2.45 – Alarm
Properties Editor Advanced
37
Access Level: you can set the access level for silencing and acknowledging
alarms
- Silence Level: when the alarm goes off the user with this access level or a
higher one is able to turn the sound off while the box remains on screen.
- Ack. Level: when the alarm goes off the user with this level or a higher
one is able to acknowledge it. The alarm will be recorded history, but will no
longer be on screen.
Port No.: number of communication server, (For Port address see Appendix
A).
Auto Grp: will make the picture appear in the case of an alarm.
NOTE: mark this box only when you have a group in the Zoom to Group
area.
Priority: determines the level of priority for reporting alarms. This number
ranges between 1-99 (where 99 has the highest priority level).
Printer: allows the selection of a local or network printer.
Max. lines: the number of lines to print.
The Tree Select button is no longer in use.
The two buttons at the bottom of the Alarm Properties Editor (Figure 2.44),
named UniCall and Email, are optional and not installed automatically with
UniArt.
2.2.4 FAST BUILD
Be extremely careful when using this function as there is no undo
option. If unsure, use Edit Alarms screen in previous chapter.
Press the Fast Build icon in the Alarm Manager Menu (Figure 2.40) to make
the following screen appear.
This option allows you to create alarms simultaneously and quickly.
Name of the alarm.
Port number.
CPU (controller) number.
Alarm number.
Security number: for the acknowledgment of alarms.
Zoom to the group that is associated with this alarm.
Active: whether the alarm is active or inactive. If the alarm is set to inactive
it will not occur.
Pop-up: to register the alarm as a pop-up alarm or as an event (see Section
2.2.3 for explanation).
38
Figure 2.46 – Fast Build
Clicking on any of the headings (except Active and Pop-Up) will give you an
option to fill in the same value for more than one line. You will have to fill in
the start line and finish line.
Place your cursor over the line number for a particular alarm and press on the
mouse button to bring up the editing functions in Figures 2.47 and 2.48.
NOTE: Placing your cursor over the name of the alarm will bring up editing
options for the name of the alarm alone, not the entire alarm.
Figure 2.47 – Quick Edit - Add
Standard copy and paste function.
Empty Page: will add empty page above the alarm that is being indicated.
To End of Page: will make the current alarm move down one line in the list.
To End of List: will make the current alarm move down one line.
Figure 2.48 – Quick Edit – Delete
39
Delete: standard delete function, deletes data but leaves empty line.
Kill: deletes the data and the line.
Kill Page: deletes current page.
Cut: normal cut function.
2.2.5 ALARM REPORT HISTORY
Click on the Alarm Report History icon in the Alarm Manager Menu (Figure
2.58) to make the following screen appear.
Figure 2.49
– Historical
Alarms
This screen contains the details of all the alarms that occurred in the system.
It is similar to the Current Alarm Report screen in Figure 2.41, the only
difference being that this screen also contains the times that the alarms were
fixed.
2.2.6 HISTORICAL EVENT REPORT
This screen is similar to the screen in Figure 2.49. The only difference is that
this screen records events, not alarms.
2.2.7 PHONE AND MAIL MESSAGES
Here telephone and email messages may be defined and edited. This feature
is optional, it is not standard to UniArt.
2.2.8 PRINT ALARM LIST
This function will print all of the alarms created in Edit Alarms screen (Figure
2.43).
40
2.3 - Trend Reports
The third icon on the vertical taskbar in Figure 2.02 enables the creation of
trend reports.
Press this icon to bring up the following screen.
Figure 2.50 – Select
Trend and sub-menu
Place the cursor over the first line in the table to bring up the menu box as
above.
2.3.1 CREATING AND EDITING TRENDS
Select EDIT to bring up the
screen in Figure 2.51.
Note that the Advanced
button is depressed.
Figure 2.51 – Trends Editor
41
The easiest way to enter data is from a group that has already been defined.
To do so press Choose Group and the Groups Menu from Figure 2.03 will
appear. To select, double click on the desired group. The group will appear
automatically in Group Name. Press save.
NOTE: Reset the computer in order to activate the trend collector.
The group in the above example is group 1 on page 1.
Trend Name: name of the trend. Entering a name will not bring up the
statistics for that group, it is for the users purposes only.
Group Name: name of the group of points.
Start and End Date: the day for the trend to begin and end.
Non/Active: to activate the trend.
Sync: the trend cycle will be synchronised with round numbers (hours or
minutes)
Active square: activates that start and stop hour.
Start hour: time to start gathering data.
Stop hour: stop gathering data.
Scan Cycle: how often to collect data according to HH:MM:SS.
Edit Trend Units: to change any data from a chosen group, or to enter data
without choosing a group (Choose Group).
Save: to save any changes made.
Reset Trend data: CAUTION when using this button, as all past trend data
will be erased.
2.3.2 GRAPHICAL DISPLAY OF TRENDS
DISPLAY: (from sub-menu in Figure 2.50) will show trend as a graph, as can
be seen in Figure 2.52. Alternately, double clicking on the desired trend will
make this graph appear. All the values here are zero so the recorded data
appears as one straight line.
NOTE: data will be displayed as graph only after 5 cycles of data collection.
Data can be read as text before 5 cycles are complete, see Section 2.3.3.
42
Figure 2.52 – Foyer graphical data
NOTICE that when the cursor scans over the graph it turns to a +. The
position of the cursor on the graph is recorded in the top right hand corner of
the screen.
Trend Toolbar:
Figure 2.53 – Trend Toolbar
•
Press GRAPH to bring up the following sub-menu.
Figure 2.54 – Trend Toolbar sub-menu
Back Color: Pressing this button will make a colour palette appear. Select
the background colour of the graph.
Grid: gives you the option to set the graph with horizontal grid, vertical grid
or both.
Zoom: to zoom in and focus on data within a smaller range and zoom out to
return you to the entire graph. Alternately you can use the Zoom In button
directly underneath the toolbar.
- When scrolling over the graph with your mouse the cursor changes to a plus
(+). With this +, drag and highlight the area that you wish to magnify with
the zoom.
43
Select: to choose from which points from the group (AHU 1-1 Foyer) to
display. Each point is defined by a different colour.
Line Width: to choose the width of the line graph (1=thin, 6=thick).
NOTE: It may be necessary to exit and re-enter the screen after changing
data.
•
Press EDIT to allow you the following options:
Copy: to copy the data and paste it where it can be viewed in text form
(Word, Excel or Notepad). The table will be similar to that in Figure 2.57.
Copy Picture: to copy the graph and paste in any program that supports
pictures (Word, Paint Shop Pro or PhotoShop). The graph will be similar to
that in Figure 2.58.
•
Choose to PRINT either This Graph or Text Data.
•
Press SCALE to allow you the following options:
Proportional: will set line graphs in proportion to each other on one of their
scales. The name that appears will determine the scale. In order to change
the scale, press NEXT on the toolbar.
Full Scale: Will set the display data in the scale as defined in Define Range
to Data.
Define Range to Data: to set the range of the scale. Pressing AutoAll will
select all of the points and set the scale automatically according to the data.
Select Times: the screen in Figure 2.55 will appear, allowing you to limit the
displayed data according to dates and times.
Figure 2.55 - Timing
Here, you will have to define the start and stop times and dates for the data
collection.
44
Press OK and the box in Figure 2.56 will appear.
Figure 2.56 – Select Time
Enter the time cycle for the data collection in the format HH:MM.
In the above example, although unrealistic, an average is taken every 10
minutes between 15:20 and 16:00 on the 2/11/00. As the data was
collected every one minute, the average is taken from 10 values every 10
minutes.
•
Press STATISTIC to allow you the following options:
See Minimum and Maximum: provides a table with minimums, maximums
and averages of all points between the times defined in Select Times.
Create Average Graph: opens the screen in Figure 2.55.
Fill in appropriate times and dates.
In the line underneath the toolbar you will see arrows as below:
Jump to first page
Jump to last page
Go back 1 page
Go forward 1 page
DISPLAY AS GRAPH (2): for old format graph collectors, not supported in
most computers.
2.3.3 – TEXT DISPLAY OF TRENDS
DISPLAY AS TEXT: press this button to bring up the table in Figure 2.57.
45
Figure 2.57 –
Foyer Text Data
The data in this table shows that every one minute, on the minute, between
14:56 and 15:07 the data was read. Here, all the values are zero as there is
no real data in the trend collector.
2.3.4 – DELETING DATA
CUT DATA: selecting this option will bring up the following box. This option
allows you erase irrelevant data from the hard disk. All data collected before
the selected date will be erased.
Figure 2.58 – Cut Trend Data
46
2.4 - Time Program/Time dependant actions
The fourth icon on the vertical taskbar in Figure 2.02 enables the creation of
time dependant actions.
Press this icon to bring up the following menu.
Figure 2.59 – Time Program
Menu
With this menu you can edit and send time programs to the controllers in the
system.
2.4.01 SEND PRINT REPORT
Selecting this button will ensure that a report is printed after a program is
sent to the controller.
Press once to set this option and press again to close it.
2.4.02 SHOW ERRORS
Selecting this button will ensure that a list of all errors that occurred will be
displayed on your screen after the sending of any program.
Press once to set this option and press again to close it.
2.4.03 SEND ALL
Press this button to send all the time programs to the controllers. This will
override the time that any individual program is set to be sent.
2.4.04 TIME PROGRAM LIST
Press this button to bring up the screen in Figure 2.60.
47
Figure 2.60 –
Time Program List
This screen displays the list of time programs. The right-hand Status
column indicates whether or not the program is Active at the current time.
Double click on any of the lines to bring up the screen in Figure 2.61.
Note that the Advanced button at the bottom of the screen has been
selected.
Figure 2.61 – Time Program Editor
48
Name: the name of the time program.
For every day, you can set different hours for the program to start and stop.
Click inside each cell to insert the times.
Scenario: this number represents a group of time programs that follow the
same schedule. All programs with the same number follow the same
timetable.
Changes made to any
time program will affect
all programs in the
same scenario.
Where the scenario
number is “0” the
programs do not belong
to any group.
Change: Pressing this button will make a box appear with the scenario
numbers and their associated program lists. This box enables you to change
the scenario number.
See List: Pressing this button will show you a list of the time programs and
their scenario number.
Advanced options open up Port, CPU, File and Point columns.
Over: this gives you the option to manually override the current timetable
setting. Send program to activate.
The Active button, shown depressed in Figure 2.61, indicates whether the
program is to be sent. When it is set to Not Active the program will not be
sent.
Copy First Day: once Start and Stop times have been entered in the first
day of the week, you can copy these same times for the entire week.
To change the first day of the week see Chapter 2.4.07 – Calendar.
Weekdays/Specials: currently the calendar is set to Weekdays (the
button is depressed). Alternately, you can set the calendar to Special
Days, which allow for special time programs for holidays and other special
events.
- The Active buttons at the bottom of each column in the Special Days
screen are similar to the Active button in the top right hand corner of the
timetable. The difference is that these activate or deactivate the settings for
each special day and not for the whole program.
- The row directly underneath the Special Days, numbered 1-8, is to insert
dates as oppose to just times. Use the format DD/MM/YY.
49
Time programs are sent
daily at 00:00 (midnight)
unless defined differently.
Cancel: to leave the screen without saving any changes that were made.
Send and Exit: to send the program and exit the Time Program Editor.
Exit and save: save the changes to the disk and exit the Time Program
Editor without sending.
The toolbar at the top of the screen:
File: Save, Cancel, Exit and Save and Send and Exit.
Send Program:Today: to send the current program now.
Over: to send the override program.
Open: to send start time as 00:00 and close as 24:00 so that it is
continuously open.
Close: to send start time as 00:00 and close as 00:00 so that it is
continuously off.
Special 1-8: to send one of the Special Days numbered 1-8.
2.4.05 DUPLICITY CHECK
Press this button to make the screen in Figure 2.62 appear.
Figure 2.62 – Time
Program Check A
This program ensures that no duplicate or conflicting parameters are sent to
the controller. Once all time programs have been searched and no problems
found a comment box saying “Done, No Errors” will appear. If errors were
found the box in Figure 2.63 will appear.
50
Here the error
occurred
because the
Point number is
the same for
both start and
stop.
Figure 2.63 – Time
Program Check B
This box is coloured red and outlines where the first error is located. Once
this error is fixed it is recommended to redo the Duplicity Check to check for
further errors.
2.4.06 SEND
Press this button to make the box in Figure 2.64 appear.
Figure 2.64 – Send Time
Program
This box gives you the option to manually send an individual program now for
any particular day. This is primarily used for test purposes.
Choose whether to send a regular day of the week or a special day.
You can also choose whether to send a:
Holiday: the last day of the week (the default is Saturday although this can
be changed in Section 2.4.07 - Calendar),
Half day: the day before the last day of the week (the default is Friday),
Close, open or override (see above Section 2.4.04 for definition).
51
Press on the Program box to make a list of programs appear. Choose the
relevant program to be sent.
Other options that can be chosen are the Scenario number, CPU number
and Port number.
Send: send the program as it is defined to the defined address.
Cancel: exit the screen without saving any changes made.
2.4.07 CALENDAR
Press this button to make the box in Figure 2.65 appear.
Figure 2.65
- Calendar
Note that you can change the setting of the first day of the week. The
default is Sunday, but here, as in the English calendar it is set to Monday.
The day types are set according to colours.
Grey = regular day.
Pink = Holiday (last day of the week).
Green = Half Day (day before the last day of the week).
Yellow = Special Day.
Black = Close (to send start and stop time as 00:00 so that the program is
always off).
One mouse click on any day brings up a dropdown menu enabling you to
select the type of day. Once a day type is chosen it will become it’s
appropriate colour, as above.
52
You will then be required to give a name to the day. In order to delete this
name click again on the particular day, set it to Normal (or other) and in the
place of the name description click once on the spacebar.
2.4.08 EXPORT TO HTML
Clicking on this button will convert the time programs to HTML format. You
will find the file in your database.
2.4.09 CPU CLOCK
Press this button to make the box in Figure 2.66 appear.
Figure 2.66 – Send Clock
This screen enables you to send the new time to either one or all of the
controllers in this particular Appserver.
Read allows you to see the time in the chosen controller.
In order for the program to be sent to the right controller you must insert a
Port number. For Port address see Appendix A. When sending to one
controller only, the CPU number should also be included.
Current Time: the checkbox next to Clock allows you to set the clock
according to that of the computer (tick) or some other time (no tick). The
arrows are used to change the time manually.
Time Last Read: this box displays the time that was sent to the controller.
Press Read to see the time in the chosen controller.
If the controller did not receive the sent time a special message will appear.
The Tree Select button is no longer in use.
2.4.10 SORT
Press this button to make the box in Figure 2.67 appear.
53
Figure 2.67 –
Time Program
Sorted List
The Time Program List sorts all the programs and displays line by line each
start and stop points.
This screen is used mainly for debugging purposes and checking for
duplicates.
The last four columns (apart from Edit) classify the programs according to
their addresses including file numbers (Pf) and parameter numbers (Pn).
This list displays the following time program details:
Line Number
Program Number
Name
Start/Stop
Port
CPU
Pf (parameter file)
Pn (point number)
Click on Edit in the right hand column to open the Time Program Editor in
Figure 2.61. This screen enables further editing options.
54
2.4.11 SEE TIME HISTORY
Press this button to make the screen in Figure 2.68 appear.
Figure 2.68 –
Time History
This screen displays all the time programs as they were last sent.
Clicking on the Check Times button at the bottom left of the screen will start
a check of the status of parameters in the controller at the time of the check.
The results will appear per line on the right hand side column.
The number of time programs will determine the amount of time this check
will take.
Error messages indicate that either there is a problem with communicating
with the controller or the parameters or addresses have not been properly
defined.
2.4.12 SORT THE LIST
Click on this button to sort the time programs in descending order on the
disk.
This button will not make a time program list appear automatically.
Changes can be seen in the screen displayed in Figure 2.60 in Section 2.4.04.
NOTE that this button does not perform the same function as Sort in Section
2.4.10. This button sorts the list in order of the time program names
whereas the button in Section 2.4.10 sorts the list according to points.
2.4.13 PRINT
Press this button to print a list of the time programs.
2.4.14 FAST EDIT
This button is for the use of Control Applications Ltd. personnel only!
55
2.4.15 EXIT
To close the Time Program Menu window as displayed in Figure 2.59.
56
2.5 - Calendar
The fifth icon on the vertical taskbar in Figure 2.02 makes the same calendar
as shown in Figure 2.65 appear.
This icon acts as a shortcut to the calendar with all the same functions as
explained in Section 2.4.07.
2.6 - Password and Access Level Setting
The sixth icon along the vertical taskbar in Figure 2.02 is key-shaped and
enables the setting of all passwords and access levels in UniArt.
The allocation of access levels to individual screens is usually performed in
the Properties Editor of that particular screen.
Eg.) access levels for alarms can be set in the Advanced Alarm Properties
Editor in Figure 2.45.
Clicking on this icon will require that the user enter a password for User level
99. This is the highest access level and is recommended for supervisors.
Once a password has been entered the screen in Figure 2.69 will appear.
Figure 2.69 –
Password
Setting
•
•
•
This screen enables the supervisor to allocate passwords and access
levels to the workers.
Every user should have their own password.
User level can be any number between 1-99.
57
•
This table also allows the supervisor to allocate access times to each
user by filling in the Validate from and Validate To boxes.
Validating from and to 00:00 will ensure 24 hour access.
In order to set access levels for the vertical taskbar (Figure 2.02) click with
the right mouse button on the desired icon. The box in Figure 2.70 will
appear.
Figure 2.70 – Access Level set-up
In this box enter a number 1-99 in order to limit access to the relevant
screen. Here, the access level is 50. Any user with a security level of 50 or
higher can access this screen.
2.7 - Voice Messages
The sixth icon on the vertical taskbar is for Control Applications Ltd. personnel
only.
2.8 - Special Programming Features
The seventh icon in the vertical task bar in Figure 2.02
brings up the window in Figure 2.71.
Figure 2.71 – CPU Utilities Menu
2.8.1 CHECK ACTIVE
Press this button to make the screen in Figure 2.72 appear.
58
Figure 2.72 – Check
Active
Port: insert port number.
Bus: insert bus number.
Port (text box): this box will be filled in automatically when the port and
bus numbers are inserted.
Fast Check: Clicking on this button and leaving it depressed will enable you
to speedily check whether a particular controller is working.
In order to do so, place a tick in the box next to the controller that you would
like to check and fill in the relevant bus and port number.
If the controller is working, the following parameters will appear and the line
will turn green:
Ver (version)
Prog (program)
S.N (serial number)
Ep. Date (eprom date)
Sta (status)
If the controller is not working, the line will turn red and you will get a
message in the Status (sta.) column.
The Tree Select button is no longer in use.
Change CPU number: Clicking on this button will bring up the screen in
Figure 2.73.
• Fill in bus and port numbers.
• Fill in the Source CPU number and the Target CPU number.
Select All CPU’s: all lines will be selected for checking.
Select None: no lines will be selected for checking, they will need to be
ticked manually.
59
Press Change to save changes and leave the menu or press Cancel to exit
the menu without saving the changes.
Figure 2.73 – Change CPU number
2.8.2 SEND TO CPU
Click on this button to make the screen in Figure 2.74 appear. The screen
will open with the last program that was sent.
Figure 2.74 – Compile and Send Programs
This screen enables you to choose and send programs to a specific controller.
•
•
Insert the Port and CPU number of the destination.
Choose the program to be sent from the large left window.
60
•
Press the Show List button to display the structure of the chosen
CPU. Double-clicking on any of the file names will fill in the details in
the Show List window.
The Tree Select button is no longer in use.
The text box next to Address will be filled in automatically.
Time Past: the time lapsed since the program was sent.
Time Left: the estimated remaining time for sending the program.
The higher of the 2 text boxes displays the name of the program.
The lower of the 2 text boxes enables you to enter a few letters while a
search is performed for programs that include those letters.
Send: to send the program to the controller.
End: to exit the menu.
Send #99 to Pico: for use within Israel only.
Print: to print the structure of the CPU.
2.8.3 BUILD TREE
This button is being discontinued and is longer in use.
2.8.4 CPU CLOCK
Pressing on this button will bring up the Send Clock screen in Figure 2.66.
See Section 2.4.09 for the functions of this screen.
2.8.5 RUN BAK
Used for writing programs.
2.8.6 MAPPED Y REGISTER
Used for checking programs.
2.8.7 RUN COMPILE
Used for writing programs.
2.8.8 EXIT
To exit the CPU Utilities Menu.
61
2.9 Settings
The ninth icon on the vertical taskbar in Figure 2.02 enables you to choose
the desired database for the system.
Press this icon to bring up the screen in Figure 2.75.
Figure 2.75 - Setting
Computer Address: IP address
Computer Description: name of the computer
Browse: for a computer
Database path and Browse for database.
Default Width
Default Height
for graphic displays
Vertical and horizontal arrows are for manually changing the height and
width of graphic displays. This is not recommended, as the pictures have to
fit exactly to the screen.
Lock All: prevents all graphically displayed values from being changed. You
will notice that the cursor icon changes into a padlock when you go over the
I/O points in the graphic screens.
62
Lock Inputs: prevents all graphically displayed input points from being
changed.
Forget last password: usually the computer will remember for a couple of
minutes that a password has been entered and it will not require that it be reentered. This option ensures that the computer will always require a
password. The main use for this option is for the supervisor to check that
passwords have been put in the right place.
Multi Database: for use of Control Applications Ltd. personnel only.
Exit: to exit the screen.
Notice that here Acc. Levels is depressed and has opened the bottom
section of the screen.
• Edit: set access level for all Edit options.
• Time Program: set level for access to time programs.
• Quit: set access level for quitting UniArt via the vertical toolbar and
the taskbar next to the clock.
Operating: sets default for new data and for Reset Access Levels option for
the following:
• Run
• Ain
• Aout
• Par
• Din
• Dout
2.10 - Exit
The tenth icon on the vertical taskbar in Figure 2.02 is the exit button.
2.11 - Last icon
This button is reserved for future use.
63
SECTION 3
HORIZONTAL TASKBAR
The icons on the horizontal taskbar, as seen in Figure 3.1, represent shortcuts
to groups of points.
Figure 3.1 – Horizontal Taskbar
In order to create a Zoom link to a group, click on any icon with the right
mouse button while holding down <Shift>. The screen in Figure 3.2 should
appear.
Figure 3.2 – AutoZoom Properties
Title: Name to appear with the picture.
Tool Tip: Text to appear when resting the cursor over the icon.
Picture: Name of the picture (if it has one).
Change Picture: Click here to open Select Image screen. From there you
can choose an image to appear as the icon. Here the box is grey as no
picture has been selected.
Page: The page to jump to when the icon is selected.
Group: The group of points to jump to when the icon is selected.
Auto Run: The group that is to be opened automatically when you run
UniArt.
EXAMPLE: The above properties were chosen from the far right icon on the
horizontal taskbar that I named FOYER. This button has been set to zoom to
Group 1 in Page 1. If you look in Figure 2.03 you will see that the first group
65
on the first page is AHU1-1 FOYER. Pressing on this button will make you
jump to the same picture as in Figure 2.19 .
66
Appendix A - Network (includes PC's, COMs, Ports and Controllers)
Computer #1
COM 1
COM 2
Port 11
1-31
64-93
32-63
Computer #2
Network
Line
COM 1
Port 12
COM 2
Port 21
1-31
1-31
64-93
64-93
32-63
32-63
Port 22
1-31
64-93
32-63
Computer #3
COM 1
COM 2
Port 31
1-31
Port 32
1-31
64-93
32-63
64-93
32-63
67