1
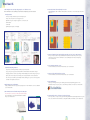
Technical Specifications
Software
Analysis Types
RIT113 Windows-based software with interactive, real
time graphical user interface.
• Planar
• Composite
• 3-Dimensional
Required Computer Configuration
• Pentium-based or Centrino Duo computer
(desktop or portable, must have one standard size 32 bit PCI slot
available for Adaptec card, or a PCMCIA slot if using a Vidar scanner
in SCSI mode)
• Adaptec SCSI Interface (for use with film digitizers)
(Adaptec 2930U for PCI, Adaptec 1460D PCMCIA, or Adaptec 1480B
PCMCIA)
• USB2 (if using the Vidar Dosimetry Pro Advantage w/USB2)
Dose Map Formats
RIT113 can import dose map files in the
following generic formats:
• DICOM-RT
• Binary (with or without a header)
• Matlab
• RT0G Binary
• K&S Diamond
RIT113 V5 interfaces to every
commercially available treatment planning system. Contact
us to setup an interface with a
system that is not listed.
• Adaptec USB2Connect 4000 (full size PCI for desktops)
• Adaptec USB2Connect (AUA-1420A) PCMCIA card for laptops
• 1 GB RAM Minumum
• Minimum hard disk space for installation:
1.1 GB (After installation is complete, optional files may be removed
reducing the required disk space to as little as 500 Mbytes.)
• CD-ROM reader
• Video graphics card and monitor capable of
1280 x 1024 minimum resolution and displaying
16 bit colors
• Windows 2000 Professional w/Service Pack 4 or
Windows XP Professional w/ Service Pack 2
• Printer - Color or black and white (most facilities
prefer color since many of the RIT113 outputs are in color)
Output Format
All plots output appropriate data in ASCII format suitable
for import into Excel. TM Plots and images may be saved
as .tif, .bmp, .png, .pcx, and .jpg files.
RIT plots also output in PDF
format for import into R&V
systems like IMPAC Patient
Archiving Systems. Contact
your system manufacturer for
their recommended configuration.
• Floppy Drive or thumb USB drive (only used if a license
transfer is necessary)
Supported Film Digitizers
• Vidar VXR16 Dosimetry Pro with Firmware Version 13.0
• Vidar Dosimetry Pro Advantage
(Vidar part number 16321-004 or -005 with Firmware Version 46.3
and pass code suffix “BVVVNN”)
• Vidar Dosimetry Pro Advantage
(Vidar part number 16321-007 (LED) with Firmware Version 49.6,
pass code suffix “BVVVNN” , serial number 341000 or greater)
Classroom Training
The purchase of RIT113 Software includes tuition for one
participant to attend our class, RIT113 Training Class With
IMRT, held at the RIT Training Center in Colorado Springs,
Colorado. This hands-on class gives you the skills to easily
integrate RIT113 into your IMRT program.
Service and Support
•
•
•
•
•
Comprehensive user’s manual
Integrated Help System
Complimentary telephone and Internet tech. support
Internet Web Site knowledge base
1 year complimentary support and software update
package (extended plans available)
• Classroom Training
• Integrated Quick Start Guide
RIT reference images may be
exported in MATLAB format for
additional analysis outside the
RIT113 software.
Digital Image Import
RIT113 can import images from any system with a
DICOM output and these digital systems:
• Varian aS500/1000
• Elekta iView GT™ EPID
• Kodak CR
• Siemens
Film
RIT113 can be used with many different types of transparent media. The most commonly used films are:
• Kodak EDR2
• Kodak XOMAT-V
• Radiochromic
Ion Chamber Arrays
• Wellhofer I’mRT MatriXX
• PTW 2D-Array with seven29 Ion Chambers
719-590-1077 • [email protected] • www.radimage.com
© 2007 Radiological Imaging Technology, Inc.
Protected by Patents 6528803, 6675116, 6934358, 6934653, 6937751, 7013228,
7016464, 7024026, 7233688, EU Patent 1252550, JP Patent 3817176
and other pending US and foreign patents
ISO 13485 Certified • FDA 510(k) Clearance • CE Marked
0470
Rev. 7/07
What’s New in V5
1. New Analysis Pane and Reporting Interface. It’s All About You!
For more information see the Customizing Your User Interface and Reporting section of this brochure.
4. New Radiochromic Film Uniformity Correction
An RIT Mathmagical solution for fibrous dosimetry films. Use this routine to correct for fiber scatter and scanner
roller issues.
Viewing Features
What’s New in V5
• View up to 6 analyses simultaneously in our new analysis panes
• Change colors, lines, fonts in screen display preferences
• Right click on any plot to change the appearance of colors, lines, fonts
• Add Annotations
• Isoline Editor
• Significantly faster updates on all displays
5. Improved Statistical and Trend Analysis Reporting. It's not just for MLC anymore!
Now you can import results from any quantifiable beam measurement and track and report all of your test
data and trends over time. For more information see the Customizing Your User Interface and Reporting
section of this brochure.
6. New CyberKnife Alignment routine
For more information see the More Beam Measurements section of this brochure.
Customized Reporting Features
• Set preferences for which plots will auto run when you perform any routine.
• Set-up your reports in your preferred format and RIT113 will remember that format until it is changed.
• Changing a parameter or tolerance in your images will automatically update all of the images in your report.
• Report options can be changed for each analysis pane to display annotations for various calculations.
7. Improved Light Field Coincidence routine
For more information see the More Beam Measurements section of this brochure.
• Save and send your customized reports in multiple formats, including pdf, to your record and verify system to
be included in the patient electronic chart.
8. New Matlab Import
Bring in your own images from any source including customized treatment planning systems. For more
information on import and export options see the Technical Specifications on the back cover of this brochure.
2. Daily Output Factor Adjustments
Adjust your calibration files based upon your daily output factor. For more information see the Dose Calibration
section of this brochure.
3. New PTW seven29 Ion Chamber Array Direct Interface
It's even easier to use than your Vidar film scanner interface.
For more information see the Using Film, CR, EPID, & Ion Chamber
Arrays section of this brochure.
1
9. Automatically read in all formats of Varian aS images
You no longer have to correctly select the proper Varian image format. RIT113 automatically identifies and opens it
in the correct manner. For more information see using Film, CR, EPID, & Ion Chambers section of this brochure.
2
Using Film, EPID, CR & Ion Chamber Arrays
Film Dosimetry for QA
Importing & Calibrating EPID Images for QA
Precision is the entire point of IMRT and IGRT. For 16 years film dosimetry has been the gold standard
tool for the high resolution images that are the cornerstone of QA testing. Speed and efficiency are
critical to a busy treatment center, but obtaining the most accurate dose analysis possible is the real
responsibility.
Use your Elekta, Varian or Siemens EPID for QA dose images with a seamless interface that do not require additional manufacturer hardware and software. New in V5, you can now automatically read in all types of Varian aS images.
You’re Going To Love This
RIT’s patented Plan Base Calibration routine gives you the ability to make quick relative or absolute comparisons between any
dose map and your Film, EPID, CR and Ion Chamber Array images! See page 18 for more information.
You’re Going To Love This
RIT’s patented Plan Base Calibration routine gives you the ability to make quick relative or absolute comparisons
between any dose map and your Film, EPID, CR and Ion Chamber Array images! See page 18 for more information.
Radiochromic Film Uniformity Correction New in V5
A Mathmagical Solution for fibrous dosimetry film!
RIT has developed a complex set of image processing algorithms to
correct for the non-uniformities in each piece of film. Use this routine
to correct for fiber scatter and scanner roller issues.
Automated 21 Point Film Processor Correction
US patent #6528803, EU Patent #1252550
Changes in the film processor can result in large differences in calibration curves. This routine compensates* for the
causes of processor variation:
• Replenishment rate of chemicals
• Temperature changes
• Type of developer
• Changes in chemicals
• Oxidation of some of the chemicals • Type of film - EDR2 is more sensitive to processor variations then XV
*Within reasonable operational limitations. Uses SensiX model sensitometer.
• Number of films run per day
Eletka iView Calibration
Since the iView panel is very linear, you only need three dose
points to develop a calibration curve. Use measured doses
from three or more images to quickly develop this calibration
curve.
Sensitometry
The Sensitometry routine uses the PTW SensiX sensitometer to automatically analyze the sensitometry strip according to FDA specifications, and
plots a characteristic and gamma curve.
Varian aS Calibration
The Varian aS units can be calibrated with
a simple wedge (using parallel calibration), the MLC step wedge (for one shot
calibration), or several perpendicular
exposures. It’s your choice!
2D Scanner Spatial Calibration
A two dimensional correction using 4 marks on the film that automatically calculates the correct pixel sizes in the scan and feed direction,
then develops the correction. This must be done for each scanning
resolution.
3
4
Using Film, EPID, CR & Ion Chamber Arrays
RIT only supports FDA Cleared film scanners at 12 or 16 bits resolution because the FDA has mandated since 1993 that 8 bit scanning is insufficient for dosimetry, and will not provide clearance
for systems that use 8 bits. Scanners that are not FDA Cleared, and QA software that allows 8 bit
scanning, do not provide the repeatability that is essential to perform reliable dose analysis. The
product that you use to perform QA must be as regulated and reliable as the product you use to
deliver dose. Precision treatment requires precision QA.
Quickly and easily convert single and groups of EPID images into RIT format. Add together any number of EPID images for a
composite image.
Using Film, EPID, CR & Ion Chamber Arrays
Ion Chamber Arrays for QA
RIT113 fully supports digital images from the Kodak 2000RT and other CR equipment. DICOM
files are easily converted to RIT format, giving you the complete palette of RIT113 routines and
functionality. You get the precision of RIT113 dosimetry and the ease of a filmless system.
Import dose maps from your PTW seven29 or Wellhofer MatrixX ion chamber arrays and use any of the RIT analysis routines
to compare films or plans to the array. The high precision of an ion chamber and the traceability to a national standard mean
that your calibrations have very high accuracy.
RIT sells the KODAK CR system for Dosimetry. Please call RIT for a quote on the Kodak 2000RT
for use with your RIT113 Dosimetry Software.
You’re Going To Love This
RIT’s patented Plan Base Calibration routine gives you the ability to make quick relative or absolute comparisons between
any dose map and your Film, EPID, CR and Ion Chamber Array images! See page 18 for more information.
You’re Going To Love This
RIT’s patented Plan Base Calibration routine gives you the ability to make quick relative or
absolute comparisons between any dose map and your Film, EPID, CR and Ion Chamber Array
images! See page 18 for more information.
A.J. Olch, "Evaluation of a computed radiography system for megavoltage photon beam dosimetry", Medical Physics, Vol. 32, No. 9 September 2005, pages 2987-2999.
"Validation of a Plan-based Calibration Method for Relative Dosimetry", A. J. Olch, AAPM 2006 Meeting, Poster paper #SU-FF-T-499.
3D CR Flatness & Uniformity Correction
Corrects for flatness in
• Scan and feed direction
• All of the clinically usable dose ranges
A 3-dimensional correction matrix is developed as well as a 2dimensional spatial calibration, using the Kodak test pattern,
which will correct for spatial non-linearity. An "auto-crop" feature
has been added to
automatically remove
artifacts near the edges
of the plate.
Kodak CR Perpendicular Calibration
Easily calibrate your Kodak CR images to dose with at little as three uniform images
at different dose levels.
PTW seven29 Direct Interface New in V5
Even easier than our film scanner interface!
RIT113 includes a new direct interface to the PTW
seven29 that operates similar to our direct interface to
your film scanner. It simplifies temperature and pressure value entry, making them very quick and easy.
Using either timed or untimed measurements you can
get 3D plots and 2D plots that let you examine individual chambers and Fast Central Axis Plotting. The data
collected from your seven29 can then be analyzed
using the full palettes of RIT113 routines.
Kodak CR Spatial Calibration
Automatically correct for spatial non-uniformities in the scan and
feed direction.
3D Gels and Solids for QA
Take advantage of a full 3D data set by using 3D Gels and Solids with the RIT113 software.
Whether you use your own "octopus" tomogaphic laser scanner, or send your gel to MGS
research to be scanned, you can import those files into RIT113 for dose analysis. MGS claims
resolutions up to 0.3mm per slice.
5
6
Using Film, EPID, CR & Ion Chamber Arrays
Importing And Using CR Images for QA
IMRT & IGRT Analysis
Gamma Function
Distance To Agreement
Profiles
Analysis
Subtraction
Composite Analysis
Isodose Curves
Addition
IGRT Alignment
Register Template
IMRT Fine Tune
3D QA Phantom
As the originator of IMRT QA, RIT gives you 34 of the most powerful, flexible, fast, and precise IMRT
routines available to medical physicists. They use 2D and 3D dose maps from your TPS, giving you
unparalleled precision measurements and interactive visualization and reporting of image comparisons. Commissioning and performing day-to-day IMRT will be fast, precise and powerful.
Profiles
After you bring in any two images and register them, this routine will plot a profile through both images at the same spatial location.
Both profiles may be plotted with a Difference and/or 1D Gamma plot. Histograms are also provided to illustrate the difference
between profiles.
New In V5. You now also have RIT113's User Analysis Pane and Reporting User Interface.
Learn more about it in the Customizing Your User Interface Tab Section of this brochure.
IMRT & IGRT Analysis
•
•
•
•
•
•
•
•
•
•
•
•
You’re Going To Love This
RIT’s patented Plan Base Calibration routine gives you the ability to make quick relative or absolute
comparisons between any dose map and your Film, EPID, CR and Ion Chamber Array images! See
page 18 for more information.
Gamma Function
This routine combines the dose difference measurement with the distance to agreement (DTA) to provide one metric for each pixel.
Gamma values greater than one indicate failure of both criteria. The calculation of gamma throughout the measured dose distribution provides a presentation that quantitatively indicates the delivery accuracy relative to the acceptance tolerances. The Gamma
Function can be calculated for one or two dimensional dose distributions. You can also look at Gamma Pass/Fail plots and Gamma
Histograms. This routine is based on a technique by Lowe, Harms, Mutic and Purdy of Mallinckrodt Institute.
Low, Harms, Mutic, Purcy, "A Technique for the quantitative evaluation of dose distributions," Medical Physics, Vol 25, May 1998, 656-661.
Low, Dempsey, Mutic, “Evaluation of the gamma dose distribution comparison method”, Medical Physics, Vol. 30, #9, September 2003, 2455-2464.
Subtraction
Use this routine to see the exact dose differences, on a pixel-by-pixel basis, between two images. The output of this routine provides
a difference image and a difference histogram. You can set an acceptable threshold (e.g. + -3%) and the software will tabulate the
number and percent of pixels exceeding your tolerance in red, and cold pixels exceeding your tolerance in blue. Then change your
threshold and watch as the analysis is recalculated in an instant. You can also view a Subtraction Histogram and/or Subtraction 3D
Surface Plots.
This routine gives you the ability to compare step and shoot to sliding window techniques; compare treatment with different numbers
of beams; compare plans delivered at different dose rates; or compare plans from two different types of treatment planning systems.
Distance To Agreement
DTA is the distance between a measured dose value and the nearest point in the calculated dose distribution that contains the same
dose. In this routine you set the tolerance (+/- %) and the maximum search area (in cm) and the calculations are performed. This
important tool is critical to analyzing IMRT deliveries in the high gradient regions. You can also view DTA Pass/Fail, Histogram and
3D Surface Images.
Composite Analysis
The plot from this routine combines the subtraction and DTA Pass/Fail plots into one display. In color coding it shows the areas that
pass and/or fail the DTA and Dose Difference Tolerances.
Green:
Blue:
Yellow:
Red:
Pixels that pass both the current DTA and current Dose Difference tolerances
Pixels that pass the current DTA tolerance and fail the current Dose Difference tolerance
Pixels that fail the current DTA tolerance and pass the current Dose Difference tolerance
Pixels that fail both the current DTA and current Dose Difference tolerances
The Composite Analysis is a more stringent test than the Gamma Analysis as the pixels have to pass each tolerance independently.
Pixels that fail the Gamma Analysis will also fail the Composite Analysis. Pixels that fail the Composite Analysis may not fail the
Gamma Analysis.
7
8
IMRT & IGRT Analysis
Register Template
This routine brings in any two dose images and then performs isodose contouring on either image or the overlay. It is often used to determine if the execution of the plan matches the plan in the TPS. All IMRT routines include a feature to control dose thresholding to exclude
pixels below your specified level as well as an improved isodose editor with store and recall for multiple configurations.
This routine interfaces with your TPS template or a
phantom to be used as a template. When you generate
a template file using the Register Template routines, the
registration points for the dose map will be automatically moved to the specified point locations in your
plan. This means that you will only have to specify the
location of the fiducial markers (pin pricks for the template) in the film image. This technique can dramatically increase accuracy and save quite a bit of time. For
your convenience, RIT has included several sample template files that correspond to commercially available
phantoms.
IMRT & IGRT Analysis
Isodose Curves
IMRT Automatic Fine Tune Registration
Addition
This routine helps you analyze multiple complex treatments which much be administered separately (in order to avoid a critical organ, boost
the dose to a portion of the tumor, etc.). It allows you to add the dose of two images and view an image that is the sum or an Isodose
image of the sum of those images.
This routine is an automated correction for small errors
in the image registration that result from situations such
as large TPS pixels, positions of QA equipment, selection
of registration points or other causes. You pick an initial
set of points that are "close" to the optimal registration
points and the Automatic Fine Tune routine will optimize
the point locations for a best fit between the images.
3D QA Phantom
Your TPS executes a preset plan onto a film contained in the CIRS IMRT Phantom, Gammex 496 IMRT and Gammex 473 Phantom,
Target QA Blue Box phantom, Standard Imaging IMRT phantom, Quasar Verification and Multi-Purpose Body Phantoms, CIRS Cube
phantom, MedTec IMRT Phantom, and the Standard Imaging Lucy 3D+ Universal QA Phantom. The RIT113 aligns the films with a 2D
dose map from your TPS, and then compares the plan to the irradiated film. All of the RIT113 Analysis routines can be used with these
phantoms or with solid water. These tools dramatically increase both the accuracy and the speed of the required measurements.
Analysis
Bring in a plan from a TPS and a film irradiated to that plan, and compare them using Van Dyk's criteria, the most critical of the tests for
an IMRT system because it verifies the patient exposure on a pixel by pixel basis. You can view histograms or pixel images for any of the
gradiant/dose combinations.
Van Dyk, J., Barnett, R., Cygler, J, and Shragge, P., "Commissioning and Quality Assurance of Treatment Planning Computers," Int. Journal Radiation Oncology, Biol. Phys., 26, pp 261-273, 1003.
IGRT Alignment
The IGRT Alignment routine is used to measure the spatial
misalignment between the IGRT imaging system and the
treatment beam.
“Output, Energy and Imaging-to-Treatment Alignment for a Helical Tomotherapy
System". S.L. Mahan, D.J. Chase, and C.R. Ramsey, AAPM 44th Annual Meeting;
Med Phys 31 (6), 2005.
9
10
Customizing Your User Interface and Reporting
Customized Reporting Features
Viewing Features
•
•
•
•
• Set up reports in your preferred format for each individual routine that will be remembered and run in
that format until it is changed.
• Changing a parameter or tolerance will automatically update all of your plots.
• Report options can be changed for each analysis pane to display annotations for various calculations.
• Save and send your customized reports in multiple formats, including pdf and jpg to your record and verify
system to be included in the patient electronic chart.
• Save and copy individual plots with a right click.
•
•
•
•
•
•
Improved Statistical Trend Analysis
Monitor Calibration
Image Information Tool
Measurement Tool
Normalization
Palette Selection
Tolerance
View up to 6 analyses simultaneously in our new Analysis Panes.
Change colors, lines, fonts in screen display preferences.
On the fly right click on any plot to change appearance of colors, lines, fonts.
Add Annotations.
Isoline Editor.
Significantly faster updates on all displays.
Changing a parameter or
tolerance will automatically
update all of your plots.
View up to 6 analyses
simultaneously in our new
Analysis Panes.
Fine Tune
Registration
Check Box
Add Annotations
Isoline Editor
Measurement Tool
Save, copy, and print individual plots with
a right click
11
Change colors, lines, fonts in screen
display preferences.
12
Customizing Your User Interface and Reporting
New User Analysis Pane and Reporting User Interface
Customizing Your User Interface and Reporting
Statistical Trend Analysis Reporting Improved in V5 Now For ALL RIT113 Routines!
Monitor Calibration With TG18 and SMPTE
This reporting routine gives you the power to save all your test results in a database for later viewing and analysis. It gives you a Statistical Process
Control run chart with limits designed to separate random and non-random variation in your data. It also gives you a histogram showing the distribution statistics of the data. For researchers using Matlab, the database is archived in a file readable by Matlab versions 7+.
Perform monitor QA with the SMPTE or the AAPM TG18 test patterns. Select from the full suite of TG18 images for your QA.
© AAPM 2005, used with permission. Samei E. Badano A, Chakraborty D, Compton K, Cornelius C, Corrigan K, Flynn MJ, Hemminger B, Hangiandreou N, Johnson J, Moxley M, Pavlicek W, Roehrig J,
Rutz L, Shepard J, Uzenoff, R, Wang J, Willis C. "Assessment of Display Performance for Medical Imaging Systems", Report of the American Association of Physicists in Medicine (AAPM) Task Group
18, Medical Physics Publishing, Madison, WI. AAPM On-Line Report No. 03, April 2005.
Image Information Tool
This tool provides useful image metrics about the current image including:
• Raw unfiltered, uncropped statistics
• Current (filtered and cropped) statistics
• DICOM tags for DICOM images
ASCII Export
All measurements can be easily exported to an ASCII file for import to other software including Excel.
Measurement Tool
Interactively perform measurements on any image or plot including graphical and statistical analysis with direct viewing of original data values. By
right clicking on the measurement tool, a profile can be generated through any image or image type plot (isodose, subtraction, gamma, DTA) at any
angle. Histograms of the data can be plotted and the ASCII data can be exported.
13
14
Customizing Your User Interface and Reporting
For more information on the use of Statistical Process Control and run charts see: Pawlicki, Whitaker, Boyer, "Statistical Process control for radiotherapy quality assurance", Medical Physics, Vol.32,
September 2005, 2777-2786.
Static and Dynamic MLC
•
•
•
•
•
Bayouth MLC Analysis
Memorial Sloan Kettering Test Pattern
MLC Transmission Analysis (TG50 Recommended)
50% Fluence Analysis (TG50 Recommended)
Varian DMLC Test Patterns Analysis
MLC Transmission Analysis (TG50 Recommended)
This routine tests the MLC operations as defined in the AAPM TG50 recommendations. The transmissions for each leaf is reported. The high resolution of the film scanner provides unparalleled accuracy in MLC performance analysis for each leaf.
Static and Dynamic MLC
RIT113 gives you measurement solutions to the unique set of problems associated with
Static and Dynamic MLC treatments such as leaf leakage, leaf position, leaf transmission, position accuracy, leaf synchronization, leaf speed, and beam-on delay. With its
high spatial resolution, dose level resolution, ability to integrate dose at multiple points
over time, automated analysis routines, and quick setup, RIT113 can make short work
of performing this suite of QA tests that will give you confidence in your MLC treatments.
These tests can be used during commissioning and on a routine basis because they are
fast, accurate, and easy to use, and you will be meeting the recommendations in
"Guidance document on delivery, treatment planning, and clinical implementation of
IMRT: Report of the IMRT subcommittee of the AAPM radiation therapy committee"
which specifies that IMRT QA protocol should include use of an MLC test pattern analysis that can be done at any gantry and collimator angle(s).
V5 now allows you to view multiple analyses simultaneously with the new user interface.
See the Customize Your User Interface Section of this brochure for more information.
Bayouth MLC Analysis
This routine measures leaf position, field junctions, FWHM, and spatial difference histograms.
“MLC quality assurance techniques for IMRT applications", J.E. Bayouth, et, al, Med. Phys 30 (5) May 2003 pp. 743-750.
50% Fluence Analysis (TG50 Recommended)
This routine measures the MLC operation as defined in the AAPM TG50 recommendations. Position, transmission and FWHM are computed automatically for each leaf at each position.
Memorial Sloan Kettering Test Pattern
This simple test pattern is great for routine QA checks on your MLC to help comply with TG53's recommendations for treatment planning and delivery. This one test pattern measures stability of leaf speed, effect of lateral disequilibrium on dose profiles between adjacent leaves, significance of
acceleration and deceleration in leaf motion, effect of positional accuracy and leaf shape effects. Performing these tests at different gantry angles
ensures that mechanical performance is within tolerance throughout the entire delivery. Leaf errors as small of 0.2mm are easily resolved.
Choi, Spiridon, Spirou, LoSasso, "Testing of dynamic multileaf collimation", Memorial Sloan-Kettering Cancer Center, Medical Physics 23, May 1996, pp 635-641.
15
Varian DMLC QA Test Patterns Analysis
RIT113 automatically analyzes the 9 Varian DMLC test patterns to determine proper MLC operation. Quantitative results as well as Pass/Fail results
are reported. These tests evaluate positional accuracy of the leaves, kinetic properties (Including leaf speed stability), leaf acceleration, and fractional dose delivery. This method utilizes test patterns for step-and-shoot and sliding window techniques.
16
Dose Calibration
•
•
•
•
•
•
New Daily Output Factor Adjustment
New Calibration Data Point Highlighter
Plan Based Calibration US Patents 7233688, 7024026
MLC Calibration Technique US Patents 6675116, 6934653, International Patents Pending
2D Scanner Spatial Calibration
Monitor Calibration With TG18 and SMPTE
Perpendicular Dose Calibration
MLC Calibration Technique
Varian aS Calibration
iView Calibration
Parallel Dose Calibration
Kodak CR Perpendicular Calibration
Kodak Spatial Calibration
PDD Table Editor
Daily Output Factor Adjustment and Calibration Data Point Highlighter New in V5
Adjust your calibration files based upon your daily output factor. Inspecting calibration points is even easier with the new Calibration Datapoint Highlighter.
Just click on any point in the calibration table and the associated value on the curve will be highlighted.
Use this RIT patented technique to calibrate to dose in just 2
films! RIT113 supplies an MLC file to generate a step wedge
in dose. This step wedge has 13 dose steps on a single film.
This dose step film combined with an unexposed film (for
zero) dose is all you need for a complete calibration curve.
You can also generate your own MLC step wedge file with
more than 13 steps. Alternatively, you can use your primary
collimators to direct the beam to a narrow band, then step
your couch to achieve the same steps of dose. For even more
accurate dose conversion, multiple MLC step calibration
films (at different dose levels) may be combined using the
Calibration Merge Utility into one super calibration film. For
those using compensators, .decimal® now makes a compensator step wedge for our patented calibration routine that
may be purchased from RIT. In addition, this can be used
with the Automated 21 point Film Processor Correction routine to reduce the number of calibrations needed.
Dose Calibration
•
•
•
•
•
•
•
Daily
Output
Factor
PDD Table Editor
Import your PDD table for use in any parallel calibration routine. This editor makes it easy to change, add,
or remove values. Many PDD tables can be saved and recalled for calibration.
Calibration
Datapoint
Highlighter
Plan Based Calibration US Patents 7233688, 7024026
You’re Going To Love This
Parallel Dose Calibration
This graphical calibration editor lets you easily select
dose points on a parallel image and assign dose values.
You may also import a PDD table with these values.
RIT’s patented Plan Base Calibration routine gives you the
ability to make quick relative or absolute comparisons
between any dose map and your Film, EPID, CR and Ion
Chamber Array images! Using any dose map images (no
special patterns needed), another image can be calibrated. Overlaying this calibration with an existing absolute
calbration can give you an idea of the overall accuracy.
This technique can be used to eliminate field size dependencies in film, EPID and CR images. It can also be used
with an ion chamber array to produce fast absolute dose
calibration at a multitude of points.
This routine was developed in cooperation with Dr Arthur Olch, PhD, Chief of
Physics, Children's Hospital, Los Angles, CA. "Validation of a Plan-based
Calibration Method for Relative Dosimetry", A. Olch, AAPM 2006 Meeting, Poster
paper #SU-FF-T-499.
More Dose Calibration routines on the next page...
17
18
Stereotactic Analysis
Dose Calibration (continued)
• Stereotactic Cone Profiles
• Stereotactic Alignment
Perpendicular Dose Calibration
Develop standard perpendicular dose curves quickly and easily from two or
more films. Zero dose entry has been simplified to speed up the last part of this
process.
V5 now allows you to view multiple analyses simultaneously with the new User's Choice Interface. See the Customize Your User Interface Tab Section of this
brochure for more information.
Stereotactic Alignment
This routine automatically measures the relative positions of multiple stereotactic cones and radio-opaque balls to check for proper alignment. Non circular cone
shapes such as those generated by MLC leaves are supported.
RIT113 determines the exact centroid of the ball and reports the exact centroid of the cone. This give you significantly higher levels of repeatability and it’s dramatically faster than hand measurements.
Elekta iView Calibration
Since the iView panel is very linear, you only need three dose points to develop a calibration
curve. Use measured doses from three or more images to quickly develop this calibration
curve.
Stereotactic Cone Profiles
Varian aS Calibration
This routine automatically measures the radial and transverse profiles from a calculated centroid to check for proper alignment. By automatically finding the center of the cone and taking profiles, this routine removes the guess work and greatly enhances the repeatability of this measurement. FWHM, Flatness, Symmetry,
Penumbras, and basic statistics are measured for each profile.
The Varian aS units can be calibrated with a simple wedge (using parallel calibration), the MLC step wedge (for one shot calibration), or several
perpendicular exposures. It’s your choice!
In the V5 analysis panes you can view the Transverse Profile, the Radial Profile, the Mean Radial Profile, and the Difference of the Profiles simultaneous, or individually.
Kodak CR Perpendicular Calibration See Using CR section of this brochure for more information.
19
20
Stereotactic Analysis
The RIT113 Stereotactic routines utilize advanced image processing techniques to automatically locate the center of stereotactic fields and analyze objects
within these fields. These techniques ensure that the measurements are made with very high spatial precision. The high level of dose resolution available with
the RIT113 provides unprecedented measurements in the penumbra regions. These tools provide the accuracy needed for performing quality assurance on
stereotactic fields.
More Beam Measurements
•
•
•
•
•
Cyberknife Alignment New in V5
Star Shot Analysis
Radiation/Light Field Coincidence Improved In V5
Asymmetric Field/Matchline
Depth Dose
•
•
•
•
•
Cross Sections
3D Dose Profiles
Electron Energy
Quick Flatness & Symmetry
Isodose Contours
V5 now allows you to view multiple analyses simultaneously with the new User's Choice Interface. See the
Customize Your User Interface Tab Section of this
brochure for more information.
Isodose Contours
Full image analysis in just seconds, at resolutions you have only dreamed about. Our user interface gives you the power to adjust the
line width, color, style, and palette for graphical outputs. Images statistics may also be viewed in the image report.
This routine measures the misalignment between the CyberKnife Cone and the laser system. The CyberKnife is moved
to the desired location and an image of the cone is captured on film. The intersection of the lasers is marked on the
film with a pin prick. The routine measures the difference between these two points. (Other CyberKnife routines will be
added soon.)
Asymmetric Field/Match Line
This routine, which is critical for head and neck treatments, plots and measures the overlap or undershoot associated with independent collimators and calculates the width of the matchline region.
Depth Dose Profiles
Dmax, D10, D20 and Ionization Ratio are computed. Extracted profiles can be smoothed and then exported in a
variety of formats.
3D Dose Profiles
This routine can be used to aid in visualization of a complex treatment area. The data is plotted with
dose as the third dimension.
Cross Sections
This routine measures FWHM, Flatness, Symmetry and Penumbra on a profile of an image. User selectable definitions
of Flatness, Symmetry, and Penumbra allow you to choose the method of calculation that is most appropriate.
Integrated Dose and Dose Under the Curve are reported for Gamma Knife Users.
Star Shot Analysis
This routine measures the mechanical alignment of the gantry, the collimators, and the table. It automatically finds
the starshot beam centers and edges to calculate misalignment using a variety of measures and finds the:
• Smallest tangential circle that will touch or cross all beam centers
• Largest perpendicular distance from the beam center intersection centroid to any beam center
• Largest perpendicular distance from a user defined point (such as the laser intersection) to any beam center
• ANSI Standard N449.1 Gantry misalignment statistics
• Maximum distance between beam intersections
Electron Energy Analysis TG25
This TG25 routine gives you percent depth dose calculations for normalized surface dose, depth of
R100, dose at R100, location of each of the user specified "R" values in cm, calculation of EO, practical range (Rp), measurement of dose due to x-rays, therapeutic range, depth of Rp in cm, and normalized dose gradient (G0).
The beam geometry data can be exported for further calculations.
Radiation/Light Field Coincidence
Improved in V5
This routine can use the MEDTEC Iso-align or the Mick Nuclear IBCII phantom
to accurately measure how well the radiation and light field match up. Analysis
includes Field Symmetry, Field Flatness, Radiation/Light Field Width and
Height, Light-Localizer/Cross-Hair/Radiation Field Centricity, Penumbra Width,
and Field Edge Orthogonality in vertical and horizontal directions for conforming to TG40 recommendations. This flexible routine can also be used with
phantoms developed by users. V5 adds the capability to analyze non-symmetric light fields.
Quick Flatness and Symmetry
One routine to do Horizontal and Vertical Profiles, and Isodose Analysis all in one page.
21
22
More Beam Measurements
CyberKnife Alignment New in V5
Technical Specifications
Software
RIT113 Windows-based software with interactive, real
time graphical user interface.
Required Computer Configuration
• Pentium-based or Centrino Duo computer
(desktop or portable, must have one standard size 32 bit PCI slot
available for Adaptec card, or a PCMCIA slot if using a Vidar scanner
in SCSI mode)
• Adaptec SCSI Interface (for use with film digitizers)
(Adaptec 2930U for PCI, Adaptec 1460D PCMCIA, or Adaptec 1480B
PCMCIA)
• USB2(if using the Vidar Dosimetry Pro Advantage w/USB2)
• Adaptec USB2Connect 4000 (full size PCI for desktops)
• Adaptec USB2Connect (AU
A-1420A) PCMCIA card for laptops
Analysis Types
• Planar
• Composite
• 3-Dimensional
Dose Map Formats
RIT113 can import dose map files in the
following generic formats:
• DICOM-RT
• Binary (with or without a header)
• Matlab
• RT0G Binary
• K&S Diamond
RIT113 V5 interfaces to every
commercially available treatment planning system. Contact
us to setup an interface with a
system that is not listed.
• 1 GB RAM Minumum
• Minimum hard disk space for installation:
1.1 GB (After installation is complete, optional files may be removed
reducing the required disk space to as little as 500 Mbytes.)
• CD-ROM reader
• Video graphics card and monitor capable of
1280 x 1024 minimum resolution and displaying
16 bit colors
• Windows 2000 Professional w/Service Pack 4 or
Windows XP Professional w/ Service Pack 2
• Printer - Color or black and white
(most facilities
prefer color since many of the RIT113 outputs are in color)
• Floppy Drive or thumb USB drive
(only used if a license
transfer is necessary)
Supported Film Digitizers
• Vidar VXR16 Dosimetry Pro with Firmware Version 13.0
• Vidar Dosimetry Pro Advantage
(Vidar part number 16321-004 or -005 with Firmware Version 46.3
and pass code suffix “BVVVNN”)
• Vidar Dosimetry Pro Advantage
(Vidar part number 16321-007 (LED) with Firmware Version 49.6,
pass code suffix “BVVVNN” , serial number 341000 or greater)
Classroom Training
The purchase of RIT113 Software includes tuition for one
participant to attend our class, RIT113 Training Class With
IMRT, held at the RIT Training Center in Colorado Springs,
Colorado. This hands-on class gives you the skills to easily
integrate RIT113 into your IMRT program.
Service and Support
•
•
•
•
•
Comprehensive user’s manual
Integrated Help System
Complimentary telephone and Internet tech. support
Internet Web Site knowledge base
1 year complimentary support and software update
package (extended plans available)
• Classroom Training
• Integrated Quick Start Guide
Output Format
All plots output appropriate data in ASCII format suitable
TM
Plots and images may be saved
for import into Excel.
as .tif, .bmp, .png, .pcx, and .jpg files.
RIT plots also output in PDF
format for import into R&V
systems like IMPAC Patient
Archiving Systems. Contact
your system manufacturer for
their recommended configuration.
RIT reference images may be
exported in MATLAB format for
additional analysis outside the
RIT113 software.
Digital Image Import
RIT113 can import images from any system with a
DICOM output and these digital systems:
• Varian aS500/1000
• Elekta iView GT™ EPID
• Kodak CR
• Siemens
Film
RIT113 can be used with many different types of transparent media. The most commonly used films are:
• Kodak EDR2
• Kodak XOMAT-V
• Radiochromic
Ion Chamber Arrays
• Wellhofer I’mRT MatriXX
• PTW 2D-Array with seven29 Ion Chambers
0470
g r o u p e
q u a l i m e d i s
2 rue Louis Pergaud, 94700 Maison-Alfort, France
Tel : + 33 1 43 53 68 20
Fax : + 33 1 43 53 68 25
Mail : [email protected]
www.view-tec.com