1
User Manual
© Copyright 2013 Rapid Insight® Inc. All Rights Reserved
2
Rapid Insight
®
Veera™ - User Manual
TABLE OF CONTENTS
This Document ................................................................................................................. 6
Hardware Requirements ................................................................................................. 6
Additional Resources ....................................................................................................... 7
VIEWS IN VEERA........................................................................................ 8
Workspace Tab ................................................................................................................ 8
DESCRIPTION .......................................................................................................................................... 8
MAIN MENU ........................................................................................................................................... 8
Job Tabs ........................................................................................................................... 8
DESCRIPTION .......................................................................................................................................... 8
MAIN MENU ........................................................................................................................................... 8
Data View Tabs ................................................................................................................ 9
DESCRIPTION .......................................................................................................................................... 9
MAIN MENU ........................................................................................................................................... 9
Scheduled Jobs Tabs ........................................................................................................ 9
DESCRIPTION .......................................................................................................................................... 9
MAIN MENU ........................................................................................................................................... 9
Docking / Undocking Windows ..................................................................................... 10
DESCRIPTION ........................................................................................................................................ 10
WORKSPACE TAB (“OPERATIONAL WORKSPACE”) .................................. 11
Data Connections in the Workspace ............................................................................. 11
DATA CONNECTIONS OVERVIEW.......................................................................................................... 11
Creating a Data Connection ........................................................................................... 11
Selecting Tables for a Data Connection ......................................................................... 12
Data Connections Source Types .................................................................................... 12
ACCESS SOURCE TYPE ........................................................................................................................... 12
EXCEL SOURCE TYPE ............................................................................................................................. 13
ORACLE SOURCE TYPE .......................................................................................................................... 13
SAS SOURCE TYPE ................................................................................................................................. 14
SPSS SOURCE TYPE ............................................................................................................................... 14
SQL SERVER SOURCE TYPE .................................................................................................................... 14
TEXT SOURCE TYPE ............................................................................................................................... 14
XML SOURCE TYPE ................................................................................................................................ 16
Jobs in the Workspace ................................................................................................... 17
JOBS OVERVIEW ................................................................................................................................... 17
HOW JOBS ARE ORGANIZED ................................................................................................................. 17
Rev. 7/14
3
Rapid Insight
®
Veera™ - User Manual
JOB DETAILS SECTION ........................................................................................................................... 17
Active Processes ............................................................................................................ 17
Backing Up The Workspace ........................................................................................... 17
JOB TAB .................................................................................................. 18
Connections ................................................................................................................... 18
INPUT NODES ADDED TO JOBS ............................................................................................................. 18
QUERY NODES ADDED TO JOBS ............................................................................................................ 18
COMBINE INPUTS NODES ADDED TO JOBS .......................................................................................... 19
EDI NODES ADDED TO JOBS.................................................................................................................. 20
Tasks .............................................................................................................................. 20
OVERVIEW ............................................................................................................................................ 20
SETUP TOOLBARS ................................................................................................................................. 20
APPEND TABLES .................................................................................................................................... 21
MERGE TABLES ..................................................................................................................................... 22
LOOKUP COLUMN DATA ....................................................................................................................... 24
SAMPLE RECORDS................................................................................................................................. 24
FILTER RECORDS ................................................................................................................................... 24
AGGREGATE RECORDS .......................................................................................................................... 26
MEDIAN OF COLUMN DATA ................................................................................................................. 27
CLEANSE COLUMN DATA ...................................................................................................................... 27
TRANSFORM COLUMNS ....................................................................................................................... 29
SORT RECORDS ..................................................................................................................................... 32
DEDUP RECORDS .................................................................................................................................. 32
FIND DUP RECORDS .............................................................................................................................. 32
QUANTILE RECORDS ............................................................................................................................. 33
RENAME/EXCLUDE COLUMNS .............................................................................................................. 33
CONVERT COLUMN DATA TYPE ............................................................................................................ 34
RANKING RECORDS............................................................................................................................... 34
TRANSPOSE COLUMNS ......................................................................................................................... 35
CACHE RECORDS ................................................................................................................................... 36
SUBROUTINES OVERVIEW .................................................................................................................... 36
INPUT PROXY ........................................................................................................................................ 37
OUTPUT PROXY .................................................................................................................................... 37
SUBROUTINE......................................................................................................................................... 38
REDUCE VARIABLES .............................................................................................................................. 39
R PROJECT ............................................................................................................................................. 40
MODEL .................................................................................................................................................. 40
Share ..................................................................................................................................................... 42
Reports........................................................................................................................... 42
Rev. 7/14
4
Rapid Insight
®
Veera™ - User Manual
OVERVIEW ............................................................................................................................................ 42
FORMAT COLUMN DATA ...................................................................................................................... 42
CROSS TAB REPORT .............................................................................................................................. 43
FREQUENCY REPORT ............................................................................................................................ 43
GROUPBY REPORT ................................................................................................................................ 44
PROFILE REPORT ................................................................................................................................... 44
CHART DATA ......................................................................................................................................... 45
Runable .......................................................................................................................... 48
RUNABLE OVERVIEW ............................................................................................................................ 48
OUTPUT TABLE ..................................................................................................................................... 48
OUTPUT REPORT .................................................................................................................................. 49
FTP (GET OR PUT) FILE .......................................................................................................................... 51
COMMAND (EXECUTE EXTERNAL ENTITY) ............................................................................................ 52
COMPRESS OR UNCOMPRESS FILES ..................................................................................................... 52
CALL (ANOTHER) JOB ............................................................................................................................ 53
CALL (ANOTHER) JOB FOR EACH INPUT ................................................................................................ 53
STOP JOB .............................................................................................................................................. 53
DYNAMIC FILE NAMING........................................................................................................................ 53
Custom Nodes (Add-Ins) ................................................................................................ 54
SLEEP ADD-IN........................................................................................................................................ 54
TDE OUTPUT ADD-IN ............................................................................................................................ 55
TABLEAU ONLINE – APPEND TO EXTRACT NODE ................................................................................. 55
TABLEAU ONLINE – REFRESH EXTRACT NODE ...................................................................................... 56
Job Workspace ............................................................................................................... 58
JOB WORKSPACE OVERVIEW ................................................................................................................ 58
JOB WORKSPACE TOOLBAR .................................................................................................................. 58
Wizards .......................................................................................................................... 60
IMPORT SCORING MODEL (with/without SEP) ..................................................................................... 60
JOBS IN VEERA ........................................................................................ 62
Jobs Overview ................................................................................................................ 62
Creating Jobs.................................................................................................................. 62
PLACE NODES (CONNECTIONS, TASKS AND RUNABLES) INTO A JOB ................................................... 62
RESYNCRONIZING A TEXT SOURCE INPUT NODE.................................................................................. 62
CONNECTING NODES TO CREATE PROCESS PATHS .............................................................................. 63
CONFIGURE NODES TO DEFINE A PROCESS .......................................................................................... 64
ENABLING OPTIMIZATION TO IMPROVE A PROCESS ............................................................................ 64
CLONING, COPYING AND PASTING NODES ........................................................................................... 65
Notating Jobs (“Floating Notes”) ................................................................................... 65
Rev. 7/14
5
Rapid Insight
®
Veera™ - User Manual
Testing Jobs ................................................................................................................... 66
VALIDATE A JOB .................................................................................................................................... 66
PREVIEW DATA ..................................................................................................................................... 66
Running Jobs .................................................................................................................. 66
“RUN JOB” TOOLBAR CONTROL ........................................................................................................... 66
RUN TO THIS OUTPUT ONLY ................................................................................................................. 66
DISABLE................................................................................................................................................. 66
RUNNING JOBS FROM THE COMMAND LINE ....................................................................................... 66
Scheduling Jobs.............................................................................................................. 67
SCHEDULE EDITOR ................................................................................................................................ 67
SCHEDULED JOBS TAB .......................................................................................................................... 67
SCHEDULED JOBS DETAILS AND HISTORY ............................................................................................. 67
SENDING EMAIL NOTIFICATIONS FROM SCHEDULED JOBS .................................................................. 67
Distributing Reports by Email ........................................................................................ 68
Saving Jobs ..................................................................................................................... 68
Exporting and Importing Jobs ........................................................................................ 68
Collaborative Cloud ....................................................................................................... 69
CONTRIBUTING TO THE COLLABORATIVE CLOUD ................................................................................ 69
GETTING ITEMS FROM THE COLLABORATIVE CLOUD .......................................................................... 69
CONTRIBUTING AND READING COMMENTS ABOUT ITEMS IN THE COLLABORATIVE CLOUD ............. 70
DELETING ITEMS FROM THE COLLABORATIVE CLOUD ......................................................................... 70
Printing Jobs................................................................................................................... 70
APPENDIX A - TASK FUNCTIONS SUMMARY ............................................ 71
Function Descriptions (Multi-Variable Transform Task) ............................................... 71
Function Operators ........................................................................................................ 75
Date and Time Format Specifiers .................................................................................. 76
Special Parameters ........................................................................................................ 78
Contact Us .............................................................................................. 78
Rev. 7/14
Rapid Insight
6
®
Veera™ - User Manual
ABOUT VEERA
Veera (Visual Engine for Enterprise Reporting and Analysis) is a powerful tool that allows you to turn
data into actionable knowledge. Using Veera, you can transform data into workflow processes, create
and share jobs with colleagues and simplify data and reporting needs. Having the ability to merge and
integrate data from any one or multiple disparate data sources allows for:
A revolutionary new way of working with data
Implementing solutions quickly, based on existing architecture
Getting the right data, at the right time, to make the right decisions
Streamlining and automating reporting
Easily finding and tracking errors in current reporting processes
Trusting results
In short, Veera makes meaningful data highly accessible whenever you need to ask questions of your
data.
This Document
Though Veera is designed to be intuitive, users may not always agree. This User Manual is intended to
provide in-depth descriptions of all aspects of the program’s function and features.
Hardware Requirements
Systems intending to host Veera must meet the following hardware requirements:
Minimum System Requirements
Windows Vista SP2 or later, or Windows Server 2008 SP2 or later
.NET Framework 4.0 and its requirements
2 GHz 32-bit (x86) or 64-bit (x64) processor
1 GB of system memory
20 MB available hard drive space
32 MB of graphics memory
Internet access
Recommended System Requirements
Windows 7 x64 or later
.NET Framework 4.0 and its requirements
2.8 GHz 64-bit (x64) processor
4 GB of system memory
1 GB available hard drive space
512 MB of graphics memory
Internet access
Rev. 7/14
7
Rapid Insight
®
Veera™ - User Manual
Additional Resources
For more specialized information, try one of these other Veera documentation resources:
Installation Guide; provides step-by-step instructions for installing the program
Getting Started Guide; a quick reference and tutorial - includes several “How To…” examples
In-program Help; accessed from the Veera Toolbar menu
In-program “Tooltip” help; placing the mouse cursor over a feature often causes a brief
description to appear
Rev. 7/14
8
Rapid Insight
®
Veera™ - User Manual
VIEWS IN VEERA
Workspace Tab
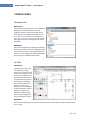
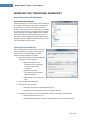
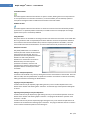
DESCRIPTION
The Workspace tab (also known as the “Operational
Workspace”) automatically opens when the
program first starts. It serves as the place where
users organize and manage data projects (see Jobs
in the Workspace), data source connections (see
Data Connections in the Workspace), and see what
jobs might currently be running (known as “Active
Processes”).
MAIN MENU
The main menu appearing at the top of the window
provides several options unique to Workspace when
in view. Note that there is only one Workspace tab.
If closed, it can be reopened by selecting Workspace
from the program’s Window toolbar menu.
Job Tabs
DESCRIPTION
A Job tab (also known as the
“Job Workspace”) opens
when a user creates a new job
or selects an existing job. Jobs
are projects, created by users,
that gather data from one or
more data sources (known as
“Connections”), manipulate
that data with various tools
(known as “Tasks”), and
produce one or more outputs
in the form of files or report s
(known as “Reports” and
“Runables”). Many Job tabs
may be opened, though only
one can be viewed at a time.
MAIN MENU
The main menu appearing at the top of the window provides several options unique to Jobs tabs when
one is in view.
Rev. 7/14
9
Rapid Insight
®
Veera™ - User Manual
Data View Tabs
DESCRIPTION
A Data View tab opens when a user selects “Data
View” from the toolbar menu or “View Data” when
right-clicking on a connection, task or runable. The
tab will display a sample of the data records from
the file currently selected. Many Data View tabs
may be open, though only one can be viewed at a
time. If the toolbar menu View > Tabs is turned off
and the Window menu to Tile the windows is used,
several data views can be reviewed simultaneously.
MAIN MENU
The main menu appearing at the top of the window provides options similar to those offered when the
Workspace tab is selected.
Scheduled Jobs Tabs
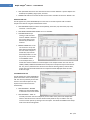
DESCRIPTION
The Scheduled Jobs tab opens when a user
selects Schedule > Scheduled Jobs from the
toolbar menu. The tab will display the
names of those jobs scheduled to run, along
with the current status, next scheduled run
date/time, last scheduled run date/time
and the last run result. See Scheduling Jobs
for a description of job scheduling
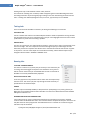
A user may also use the buttons located at the bottom of the tab
to perform a number of tasks. These include:
OPEN: Opens the job selected in the list
SCHEDULE: Opens the Schedule Viewer window for that job
schedule
DELETE: Deletes the selected schedule
STOP: Stops the selected scheduled job from running
DETAILS: Displays details of the last running of the selected job
schedule
HISTORY: Displays details of all the scheduled runs of the job
selected
MAIN MENU
The main menu appearing at the top of the window
provides options identical to those offered by a Data
View tab.
Rev. 7/14
10
Rapid Insight
®
Veera™ - User Manual
Docking / Undocking Windows
DESCRIPTION
With the exception of the Workspace tab, tabs may reordered in the program or even undocked from
Veera to float as a separate window. This is done by selecting the tab then clicking and dragging it to a
new location. The tab will be removed from the list and a free-floating window of the same name and
contents will appear on the screen.
To dock a floating Veera window, select the frame then on its copy of the menu click VIEW > DOCKED.
The free-floating frame will disappear and a tab of the same name and content s will appear in the
program window.
Rev. 7/14
11
Rapid Insight
®
Veera™ - User Manual
WORKSPACE TAB (“OPERATIONAL WORKSPACE”)
Data Connections in the Workspace
DATA CONNECTIONS OVERVIEW
A data connection (or just “connection”) can be thought of
as a pointer. It shows Veera where data is located on the
local computer, or on another computer on the local
network. It can reference either a file folder or a database
on a server. Once created, a connection may be used over
and over again by any number of different jobs. The Data
Connections section of the Workspace tab is where all
connections used throughout the product appear and are
managed (created, modified or deleted). New connections
can also be made from any Job tab.
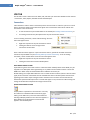
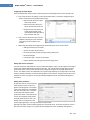
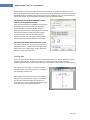
Creating a Data Connection
Note - creating a data connection does not actually
create any folders, files or tables. It only creates a
reference within Veera pointing to an existing
folder on the host computer or network.
Open the Create New Connection dialog box
by doing one of the following:
o Right-click anywhere in the
Workspace > Data Connections
section and select ‘New
Connection’,
o Right-click in any Jobs >
Connections section and select
‘New Connection’, or
o Select Toolbar > Connection >Add
New
Enter a unique Connection Name.
Select a Data Source by either
o Clicking the icon of the corresponding data type, or
o Selecting the corresponding data type from the drop down list.
The dialog box changes to request the information unique to each type. This means either
o Identifying the folder location, or
o Identifying the database server location, database name and connection information
Rev. 7/14
12
Rapid Insight
®
Veera™ - User Manual
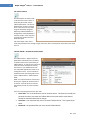
Selecting Tables for a Data Connection
Once a data connection is saved, the user can create references to the
specific files, worksheets, or database tables/views found in that
location. These specific references are collectively referred to as
“tables”. Tables appear beneath their parent connections in alphabetic
order. To add a table:
Right-click on the data connection and choose Select Tables.
Select the file(s), worksheets, etc. to be used from the
connection location.
For Text file data connections, the properties often need to be
defined (see TEXT SOURCE TYPE)
If the desired table does not appear in the Files/Table list, rightclick in the space and click Add Table By Name to manually enter
the file/table name into the list.(not available for Excel or Text).
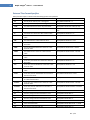
Data Connections Source Types
Connections are automatically grouped by data source type. Data source types Veera can support
include:
Access
PostgreSQL
DB2
SAP HANA
DSN (ODBC Connections)
SAS
Excel
SPSS
FoxPro
SQL Server
MySQL
Text/CSV
Oracle
UDL
OtherDBMS
Vertica
OtherFile
xBase
Paradox
XML
Which data source types are available is often dependent upon whether the drivers or providers for
that type are installed on the computer. Drivers (OLE DB, ODBC, ADO.net or native drivers) are freely
available for download from the corresponding manufacturer.
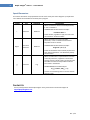
ACCESS SOURCE TYPE
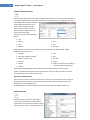
Configuring an Access-based data source doesn’t require a server
location or connection credentials. However, unlike other
connection types, it does require specifying the file name at this
stage.
Also note that there are two Access file types to choose from – the
Office 2007 version (.accdb) and the legacy JET version (.mdb). The
correct file type must be selected for the intended data source to
appear as an option.
Rev. 7/14
13
Rapid Insight
®
Veera™ - User Manual
EXCEL SOURCE TYPE
Configuring an Excel-based data source requires specifying the file
folder location. When the specific data table is being identified,
the user will specify the workbook file name and choose between
the worksheets within the workbook. In this way, each sheet can
serve as a separate data source.
Also note that there are three Excel file types to choose from –
two Office 2007+ versions (.xlsx and xlsb) and the legacy version
(.xls). The correct file type must be selected for the intended data
source to appear as an option.
Rapid Insight Excel Driver
It has come to our attention that Microsoft Excel Input data drivers attempt to determine a column's
data type using the first eight records and, as a result, often passes numeric values as nulls. Formatting
of the corresponding column in Excel has no effect on this behavior.
To mitigate this, Rapid Insight has developed its own Excel data driver for use when connecting to data
sources and destinations. It appears in the driver list as “Excel File (*.xls, *.xlsx, *.xlsb)” and is the
default driver selected when the Excel icon is clicked.
The driver actively reads the formatting of the original worksheet cells to develop its columnar data
types. When this information is not available, it will attempt to infer this information from the fields in
a column. The number of fields used to make this educate guess is specified in the Type Guess Sample
Size field under the Options menu.
As an output driver, it takes the Veera column types and matches them to corresponding Excel format
types when writing to a worksheet.
ORACLE SOURCE TYPE
Setting up a PC to connect to your Oracle Database
If the user is currently connecting to the Oracle
server from their machine, then it’s a simple matter
of picking an appropriate driver from the list of
available drivers as part of their Veera data
connection. We recommend either the Oracle
OLEDB, ADO.NET for Oracle, or .NET for Oracle
drivers, though any Oracle driver that appears in the
list of available drivers should work.
If the user isn't currently connecting to Oracle, their
machine needs to be configured to do so. Usually this
requires an IT person to setup the machine.
Verify that the IT department will allow the
Veera user to directly access the Oracle
Database.
Have IT create access credentials on the
Oracle server, granting the Veera user at
least read access to the desired database,
schemas or specific tables.
Identify and install the correct Oracle Client,
with all available drivers, on the Veera user’s
computer. The Oracle Client version should be compatible with the Oracle server’s version.
Rev. 7/14
14
Rapid Insight
®
Veera™ - User Manual
If known, the user may type the Oracle server and database names directly into the appropriate fields.
The only method Veera supports for "browsing" for the available Oracle database servers is TNS. In
that case the local names can be seen in the drop list for the of the connection window.
Using the Oracle Net Configuration (or comparable) tool, generate a “tnsnames.ora” file and
placing it in the correct folder.
If the user gets the error "Could not find file '%TNS_ADMIN%\tnsnames.ora'." when using the
Databases drop down list, this means that the computer needs help locating the tnsnames.ora file.
Confirm that the TNS_ADMIN environment variable (found under CONTROL PANEL > SYSTEM >
ADVANCED SYSTEM SETTINGS > ENVIRONMENT VARIABLES) points to the tnsnames.ora file
folder. The IT department may need configure this.
Once all the required information has been filled out, the Test and Ok buttons become enabled. The
user may test the connection (confirming the information is valid) or save the contents and exit the
window.
SAS SOURCE TYPE
To download the driver for SAS, navigate to:
http://www.sas.com/apps/demosdownloads/oledbproviders_PROD_9.1.3_sysdep.jsp?packageID=000
366
SPSS SOURCE TYPE
To download the driver for SPSS, navigate to: http://www.spss.com/drivers/clientSPSS.htm
SQL SERVER SOURCE TYPE
Configuring a SQL Server-based data source requires specifying a server location, connection
credentials, database name, and table schema.
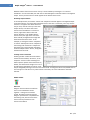
TEXT SOURCE TYPE
If a text type data connection is saved, the user will then need to create references to the specific text
files that will serve as data sources. If the text file selected does not have an [X] beside the file name,
the properties need to be defined. (NOTE – typically, the defaults that appear on the following three
windows will be acceptable and no changes will need to be made.) Click the Properties button
associated with the file to start the process.
File Properties Tab
The first tab of the File Properties window
defines the file’s general data formatting.
These include:
DELIMITED or FIXED WIDTH:
Determines how the data will be
separated into columns.
FILE TYPE: Special format types
used under special circumstances.
Options are: Default, OEM, ASCII,
Unicode, UTF8, UTF7
ROW DELIMITER: Determines what
constitutes a new data row.
Options are: {CR} (carriage return), {LF} (line feed), {CR}{LF} (default), comma, semicolon, tab,
and vertical bar.
Rev. 7/14
15
Rapid Insight
®
Veera™ - User Manual
TEXT QUALIFIER: Determines how data that contains a column delimiter is quoted. Options are:
Double Quote (default), Single quote, and none.
SAMPLE SIZE: Defines the number of data rows to load to evaluate the structure. Default is 20.
Delimited Fields Tab
This tab appears only if the DELIMITED option was chosen on the File Properties Tab. Provides a
sample of the data set using the Field Delimiter chosen.
FIELD DELIMITER: Options include: comma (default), semicolon, tab, vertical bar, tab, colon,
and other – with entry field.
FIRST ROW CONTAINS FIELD NAMES: Yes or no checkbox.
COLUMN COUNT: Drops
existing or adds new data
columns. Default is based on
the current column count
detected by the delimiter
selected.
IMPORT FORMAT FILE: If the
user chooses to set up the
data columns automatically,
the user needs to import a
format file (.fmt) with the
desired parameters. To start
the process, the user clicks
on the IMPORT button.
In the example shown, a
format file has been selected. Its contents appear in the sample window. The user uses the
Field#1, Field#2, Field#3 and Field#4 entries to help Veera interpret the layout of the format
file. This, in turn, defines the four columns in the data file. Starting Column, Column Name,
Length and Type should all be defined. The sample format file displayed shows the valid
choices for Type.
Fixed Width Fields Tab
This tab appears only if the FIXED WIDTH
option was chosen on the File Properties
Tab. The user may manually set the data
column’s start and end points or may
import a format schema to do this
automatically.
FIELD POSITIONS – RECORD
WIDTH: sets the intended width
in characters of each row of data
FIELD POSITIONS – FIELD: To
manually set column start and end points, the user clicks on the point in the sample data
where a data column starts. Columns will alternately shade as they are added. User may
remove a column pointer by clicking on the same point. The TOTAL COLUMNS counter keeps
track of the columns designated.
Rev. 7/14
16
Rapid Insight
®
Veera™ - User Manual
IMPORT FORMAT FILE: If the user chooses to set up the data columns automatically, the user
needs to import a format file (.fmt) with
the desired parameters. To start the
process, the user clicks on the IMPORT
button.
In the example shown, a format file has
been selected. Its contents appear in the
sample window. The user uses the Field#1,
Field#2, Field#3 and Field#4 entries to help
Veera interpret the layout of the format
file. This, in turn, defines the four columns
in the data file. Starting Column, Column
Name, Length and Type should all be
defined. The sample format file displayed
shows the valid choices for Type.
Column Properties Tab
This final tab of the File Properties window defines the data types and labels of each data column. The
user clicks on the column from the sample data field and then sets the following values.
CURRENT COLUMN: Alternate method for selecting the column being configured.
NAME: Column’s name.
DATA TYPE: The supported types include Integer, Text, Date, Yes/No, Unknown, and Decimal.
DATE FORMAT: If the column’s data
type is DATE, this field sets the
date formats as they will appear in
Veera coming from this source.
DECIMAL PLACES: If the column’s
data type is DECIMAL, this field
sets the number of digits as they
will appear in Veera coming from
this source
INSERT/DELETE COLUMN: Drops
existing or adds new data columns
which can then be configured.
XML SOURCE TYPE
Veera makes use of an integrated driver to both read and write XML-formatted data. Users should be
aware of the following conditions that may affect their use of this data type.
The XML driver will…
Read the records from any XML-formatted data file
Parse incoming data records using schema imbedded in the XML file.
Parse incoming data records using schema contained in a co-located XSD (XML Schema
Definitions) file if it is named the same as the XML file.
Ignore any attribute information incorporated into data records. Such records should be
parsed by the user outside of Veera into a more conventional format prior to use.
Write files which imbed any needed schema information into file itself.
Rev. 7/14
17
Rapid Insight
®
Veera™ - User Manual
Jobs in the Workspace
JOBS OVERVIEW
Jobs are projects, created by users, that gather data from one or more data sources (Data
Connections), manipulate that data with various tools (known as Tasks), format that data using several
reporting styles (known as Reports) and produce one or more outputs in the form of files or reports
(each known as a Runable).
The Jobs section of the Workspace tab is where all jobs created or imported into in Veera are
managed. From here, users can import, export, copy, rename, organize, schedule and delete jobs. For
an explanation on how to build a new job or edit an existing one, see the section “JOBS IN VEERA”.
HOW JOBS ARE ORGANIZED
Jobs can be easily organized by placing them in
folders and sub-folders. Folders are created by
right-clicking anywhere in the Jobs section and
selecting “New Folder”. Folders and the jobs
they contain are ordered alphabetically. Jobs
can be dragged and dropped between folders.
JOB DETAILS SECTION
The Job Details section reports the properties of
the current (or most recent) job selected from
the Workspace Jobs list. Details include:
Job Name
Create Date
Last Modified
Last Used
# of Output Nodes
# of Nodes
Connections
# of Input Nodes
Notes
By clicking the appropriate control, this section may be hidden (>>) or viewed (<<) at any time.
Active Processes
The Active Processes section of the Organizational Workspace displays the names and elapsed times of
jobs currently running in Veera. If no jobs are running, this portion of the Workspace remains blank.
Backing Up The Workspace
The content and structure of the Workspace may be backed up and restored
to guard against catastrophic loss and corruption or to allow users of Veera
to share their content. Open the File > Database menu from the main
program toolbar. Veera automatically performs a backup when the program
is updated.
Note that individual jobs may be exported and imported without having to
resort to backing up and restoring the whole program content.
Rev. 7/14
18
Rapid Insight
®
Veera™ - User Manual
JOB TAB
The Job Tab in Veera is where users can build, edit, and view a job. Each tab is divided into five sections
- Connections, Tasks, Reports, Runables and the Job Workspace.
Connections
Jobs need data in order to work. Connections point to sources of data. In order for a job to use a set of
data, a connection pointing to that data must appear in the Connections section of the Job tab. This
can be done in one of two ways:
A new connection may be created while on the Job tab (see Creating a Data Connection), or
An existing connection may be imported into the job’s Connections section.
To use an existing connection, choose “Select Existing” from the
menu that appears when
Right-click anywhere in the job’s Connections section
Clicking the down arrow to the right of the
Connections section label.
Once a data connection appears in a job’s Connections section, specific file and table connection
references may be added to it (see Selecting Tables for a Data Connection). To use an existing
connection, choose “Select Tables” from the menu that appears when
Right-click anywhere in the job’s Connections section
Clicking the Connections section label dropdown.
INPUT NODES ADDED TO JOBS
Input Node is a generic term used to refer to a data connection added (or about to be added) to a job.
It appears as an ADD option when right-clicking on any table in the Connections section or under the
NODE menu. When used, the selected table will be added to the current job.
Double-clicking on an Input Node allows the user to review the data structure (column names and data
types) of the connection. Check boxes are also available that select or deselect specific columns from
appearing at the node’s output. Changes made to the data source structure since the last time the
window was opened will be represented - removals will appear in red, new entries in blue. Saving and
closing the window will incorporate the changes into the node.
QUERY NODES ADDED TO JOBS
A Query Node is a special form of connection. It can only
be created from a database table connection by rightclicking on the table entry in the Connections field and
selecting Add Query Node from the menu that appears. A
Query Node icon representing that connection will
appear in the Job Workspace.
Rev. 7/14
19
Rapid Insight
®
Veera™ - User Manual
Running SQL Scripts in Veera Using a Query Node
The Query Node setup window is different from that of other connections. Instead of displaying a list
of available variables it presents a query window. The node will be tied to a database connection and it
will have a default query if it was created from a table connection. The user may edit this script, using
the syntax for the version of the SQL scripting language native to the database server being accessed.
In addition to SQL scripting, the Query Node can make use of user defined functions and stored
procedures hosted on a database server, as long as the entire “query” expression returns a “result set”
i.e. something that looks like a table.
COMBINE INPUTS NODES ADDED TO JOBS
A Combine Inputs node is a special data connection that appends the records of several co-located
data files together and makes them available as if they were a single source. Once configured, it is
integrated and used in jobs like any other Input node.
Right-click on a file-based Connection entry in the
Connections field and select Add Combine Inputs
Node from the menu that appears to add one to a
job. Double click on the node to configure.
Select the files to be combined by entering some
common portion of their names. Wildcard
characters (*) may be needed to achieve this (such
as College Enrollment Data FA*.csv). “Regex:” may
also be used to specify groups of files to match when
wildcards alone won’t suffice. As an example,
“Regex:CI-..\.xls.*\.*$” will match all Excel
worksheets in workbooks that start with “CI-“, are
followed by 2 characters, and have a file extension
that starts with “xls”.
Checking the Create Source ID Column option box
and entering a name will add a new column to the
incoming data. The name of the source file for each
record will appear in the field.
Checking either the Create File Created Column
and/or Create File Modified Column option boxes will add new columns to the incoming data. They will
be filled with the relevant file information for that data row.
Defining the Schema in the Combine Inputs Node
The schema of the first matching table will be used to define the data layout the Combine Input node
presents to a job. In addition to opting in or out of certain fields using the individual column check
boxes, users may select a schema mode to further control how this node behaves.
FIXED will not adapt to changes to the list of columns. Discrepancies will be reported as errors.
EXTENDABLE will automatically allow new data columns to appear in the output. Missing
columns will be reported as errors.
DYNAMIC will automatically alter the columns output to match the first table schema.
LOCKED will always output the original columns list. Missing columns will populate with nulls.
Rev. 7/14
20
Rapid Insight
®
Veera™ - User Manual
EDI NODES ADDED TO JOBS
An EDI Node is a special form of connection. It can only be created from a data source that Veera
interprets being formatted as an EDI (electronic data interchange) file. To make use of this node on
such a data source, right-clicking on the file entry in the Connections field and selecting Add EDI Node
from the menu that appears. An EDI Node icon representing that connection will appear in the Job
Workspace.
Tasks
OVERVIEW
Tasks are tools used from within a job to manipulate data. Veera provides 25 unique tasks that can be
incorporated into any job. There is no limit to the number or types of tasks that can be used, though
there are some restrictions on their order.
The 25 tasks are:
1.
Append Tables
18. Cache
2.
Merge Tables
19. Subroutine
3.
Lookup Column Data
20. Input Proxy
4.
Get Sample Records
21. Output Proxy
5.
Filter Records
22. Reduce Variables
6.
Aggregate Records
23. R Project
7.
Median of Column Data
24. Model
8.
Cleanse Column Data
9.
Transform Columns
25. Share (under NODE > ADD TASK
menu only)
10. Sort Records
11. DeDup Columns
12. Find Dup Records
13. Quantile Records
14. Rename/Exclude Columns
15. Convert Column Data Type
16. Rank Records
17. Transpose
Right-clicking on a task will open the Help Menu entry for that icon in a separate window.
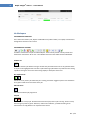
SETUP TOOLBARS
Tasks are configured once they are place in the Job tab’s Working Area. Though the setup options of
each task are unique, there are some controls that are common to most. These are typically found as
one or more toolbars within the task’s setup screen.
Rev. 7/14
21
Rapid Insight
®
Veera™ - User Manual
Find
The binoculars bring up a dialog box to search for a particular column if there are a number of entries.
Get Values
The Get Values control displays a list of every unique value found in the selected field. An associated
Sample Rows drop down selects how many rows to search through to gather the sample:
Parameter
Parameters (i.e. named variables) are user-defined, specific to each job and configured under the Edit
Parameters button of the Job Toolbar. The parameter button appears in association with many nodes
and tools. It opens a List Box, allowing the user to select a pre-defined parameter to incorporate in a
command or action.
Reorder Columns
The up and down arrows move the selected column up or down in the display order. These controls
also adjust the order in which certain dependent activities (like sorting) is done.
Save/Save and Exit
The Save button (blue disk icon) saves without closing the setup window. Save and Exit (green check)
saves the completed work and closes the setup screen.
Sorting Options
The A-Z option sorts the data in ascending order. The Z-A option sorts the data in descending order.
The AxZ option un-sorts the data, putting in its original order.
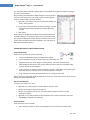
APPEND TABLES
Overview
Append “stacks” records from two or more sources to create one combined output. For example, if
two datasets are appended, one containing 5,000 records and the other containing 10,000 records, the
appended dataset will contain 15,000 records.
Rules For Appending Data
Append is intended to combine datasets with the same type of data (more-or-less) using the same
columns/variables. This, however, is not mandatory. When column names of the data sources do not
exactly match, the resulting output will contain each unique column.
Rev. 7/14
22
Rapid Insight
®
Veera™ - User Manual
Whether columns from several sources “line up” can be verified by reviewing the “Is in Source”
checkboxes – if a box is checked, then that source’s data will appear under that column in the Append
output. The key to which source is which appears at the bottom of the screen.
Renaming Output Columns
In the example shown, the columns “Phone” and “Telephone” will both appear in the Append output
as separate columns, even if the data contained in them is the same. Fortunately, users may rename
columns in an Append. This allows data from
two (or more) sources to end up in the same
output column, even when their source
column names are different. To rename a
column, right-click a column name and
choose ‘Rename’ or just double-click the
column name, then type in the new name.
Once entered, the Append will re-align with
other fields of the same name. In the
example, re-naming the column “Telephone”
to “Phone” will keep the column “Telephone”
from having to be created. The “Telephone”
data coming from source #2 will now appear
under the output column “Phone”, along with
the data from source #1.
Creating a Source Id Column
Checking the box “Create Source ID Column”
creates the new variable, “Source ID”, in the
output file. It stores a value indicating from
which input the specific record came from. By
default, the values will be integers from 1 to #
(# of files being appended). The column name
may be changed by entering a new one in the ‘Name” field. To change the values used, double-click on
one and type in a new value. If any value contains a character, the “Text” radio button should be
selected.
MERGE TABLES
Overview
Merge is used to combine records from
two or more related data sources
together – making one record from
several. Each data source entering the
Merge is represented as a separate box in
the working area, with the name of the
source at the top and the list of its
column names below.
Rev. 7/14
23
Rapid Insight
®
Veera™ - User Manual
Joining Sources
The first step in a Merge is to join the data sources together. Though the mechanics of joining are
straightforward, the right approach might not always be so clear. The user must consider how these
data sets are related and what is the desired outcome. Identifying which field(s) will make a record
unique in the output is often a good start.
Dragging one or more columns from one data source and dropping them onto the matching columns
of another data source forms joins between those columns. A line is drawn between the columns to
represent the join. In the example shown, there are 2 joins between three data sources.
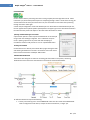
Join Types
There are four Merge Join types:
“Only matching records from both
sources” (inner join). An output
record is created only if records
are found in both sources with
matching data in the joining
column. By default, the initial
join is always of this type. It is depicted by a line with no arrowheads.
“All records from [data source 1] and matching records from [data source 2]” (left join). One
output record is created for each [data source 1] record paired with each matching record
from [data source 2]. It is depicted by a line with an
arrowhead pointing to [data source 2].
“All records from [data source 2] and matching records
from [data source 1]” (right join). One output record is
created for each [data source 2] record paired with each
matching record from [data source 1]. It is depicted by a
line with an arrowhead pointing to [data source 1].
“All records from both sources” (full outer join). Every
unique combination of records from both sources will
appear in the output. This is comparable to a union of both left and right joins.
To change the Join Type, right-click on the line joining the two data sources. The line turns blue and the
Join Type dialog box appears. Select the type from the list.
Selecting the Outputs
Once all the joins are defined, the user must specify which columns from each source will appear in the
output of the Merge. There are two options for selecting columns.
Select the asterisk at the top of the data source. This brings
ALL columns of that source over to the output.
Individually double-click on each data source column
When a column is selected, it appears in bold type within the data
source table. It also appears in the “Output Column” list on the right
side of the screen, along with its source. Deleting a column from the
“Output Column” list removes the column from the Merge output.
This is done by right-clicking the entry and selecting delete or
selecting the entry and pushing the DEL key.
The column may be renamed when it appears in the output. Enter the new name in the “Output
Column” field.
Rev. 7/14
24
Rapid Insight
®
Veera™ - User Manual
Creating a Source ID Column
Users have the option to create one new variable for
every data source participating in the merge. These
store a value to indicate whether that source
contributed data to the record. Placing a check in the
“Create” box beside the source creates the variable.
The indicator values will be 0 or 1. The column name
may be changed by entering a new one in the ‘Flag Column Name” field.
LOOKUP COLUMN DATA
Lookup Column provides a fast and efficient way to
retrieve values from a lookup table. One data
source will appear as the Input source and the
second is the lookup source. In the example shown,
the first source contains a code for “Major” and the
second source contains the description being looked up.
The user chooses the “Lookup By” column - in this case it’s the ‘Major_CD’ field. It is joined to the
‘MAJOR_CODE’ in the ”Lookup Source”. The column to add to the output is the one containing the
value looked up, above it’s the ‘Major Description’ coming from the lookup source.
Lookup Column is limited to 10000 unique values in the Lookup By column
SAMPLE RECORDS
Sample Records outputs a subset of the data entering it. The user determines the number of records to
be output (or skipped) and the method of their selection. There are five different sampling methods:
Random
Top
Bottom
Skip top N rows
Range (From/To)
An integer parameter may be used in place of an explicit, number-of-records value.
FILTER RECORDS
Overview
Filter is used to filter records based on one or more user-defined tests.
Rev. 7/14
25
Rapid Insight
®
Veera™ - User Manual
Defining a Test
Double-clicking on a column name from the list on the left selects it as the source of the data to test. In
the example shown, “State” has been selected. Then the type of test is chosen from the following
options:
In (specified list)
Not In (specified list)
Contains (found within column
value)
Does Not Contain (not found
within column value)
Starts With (the specified value)
Ends With (the specified value)
Like (matches a pattern)
Equals (=)
Not Equals (<>)
Greater Than (>)
Greater Than or Equal To (>=)
Less Than (<)
Less Than or Equal To (<=)
Between (two specified values)
Is Missing (no value exists)
Is Not Missing (a value exists)
EXPRESSION (offers range of DATE-specific operators that rely upon the computer system clock
for reference, such as TODAY)
Next, the user must enter the data value(s) to test for. As an aid, a “Get Sample” button is provided,
permitting the user to view unique values found in the column being tested. Values may be selected
directly from this list (holding the Ctrl key allows multiple selections).
Creating Multiple Tests
Once a test is defined, it is added to the filter
by clicking the Add Filter button (green funnel).
It will then appear in the area just below the
control. A corresponding SQL statement
describing the test will also appear in the
bottom-most box. An existing test may be
removed from this area by highlighting it, then
clicking the Delete Filter button (blue funnel).
Multiple tests may be combined to construct
sophisticated filtering criteria. The following
tools are provided to facilitate this.
Rev. 7/14
26
Rapid Insight
®
Veera™ - User Manual
Insert/Remove Parenthesis
Parentheses may be useful when combining several tests. The parentheses are used to group test
criteria together so they can run together instead of separately. The parentheses can also be removed.
Select each one, then use the arrow next to each parenthesis and choose the remove option.
And/Or Statements
Multiple tests may be joined together by adding AND or OR between them. To change one to the
other, select the value then click the desired button to change it. Selecting the OR Otherwise, by
default, tests are initially joined by AND
Move Up/Down
If there is more than one test, their order can be changed using this tool. Select the test and click the
move up or move down arrow.
Delete All Filters
This deletes all of the test criteria from the filter.
Filtering Parameter
This button appears in conjunction with most filter operators. It opens a List Box, allowing the user to
select a parameter to incorporate in a filter. Parameters (i.e. named variables) are user-defined,
specific to each job and configured under the Edit Parameters button of the Job Toolbar.
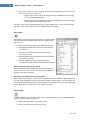
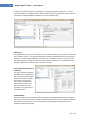
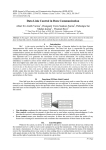
AGGREGATE RECORDS
The Aggregate Records task allows
the user to aggregate the data
entering it. A single aggregate can
be produced from the entire
dataset which would produce one
row of data.
Alternately, the user can choose to
“Aggregate By” specific fields. One
row of aggregated data will be
produced for each unique
combination of “Aggregate By”
values.
The following may be calculated
for those records matching the
Rev. 7/14
27
Rapid Insight
®
Veera™ - User Manual
unique “Aggregate By” combination:
Min – minimum value found in that field
Max – maximum value found in that field
Mean – average of all non-null values for a numeric field
Count – count of all non-null values for a field
Sum – sum of all non-null values for a numeric field
Count Distinct – count of the distinct # of values for a field (only one per aggregate)
First –the first, non-null value encountered in that field
StdDev – calculates the standard deviation of the numeric field
In the example shown, there is only one “Aggregate By” variable (“Gender”) and three aggregates
selected, indicated by the checkmarks placed in the corresponding boxes. If “Gender” contains two
values, “Male” and “Female”, the output from the Aggregate Node would consist of two rows and
three new output columns - Probability_Mean, Probability_Sum and Student ID_Distinct
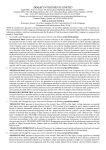
MEDIAN OF COLUMN DATA
Median creates a special aggregate of the source data. A column placed in the “Median Columns” list
will be used to create a new variable that displays the median value of that column using all incoming
records. The output data will consist only of these new variables.
Columns placed in the “Median By Columns” list
will also apear in the output. Together, these
columns determine how many records appear in
the output. In effect, one data record will be
output for each unique combination of values
found in the columns listed in this section.
In the example shown, the two SAT scores are
being aggregated to find their median values.
Because these scores are being aggreagated by
“Gender”, one record of median SAT scores will
appear for each unique value of gender found in
the incoming data.
CLEANSE COLUMN DATA
Overview
Cleanse Data is used when column data need
to be replaced or rounded based on one or
more user-defined tests.
Rev. 7/14
28
Rapid Insight
®
Veera™ - User Manual
Defining a Replacement Test
Clicking on a column name from the list on the left selects it as the source of the data to test. Then the
type of test is chosen from the following options:
Equals (=)
Not Equals (<>)
Greater Than (>)
Greater Than or Equal To (>=)
Less Than (<)
Less Than or Equal To (<=)
In (specified list)
Not In (specified list)
Contains (found within column value)
Does Not Contain (not found within column value)
Starts With (the specified value)
Ends With (the specified value)
Is Missing (no value exists; may be
filled with the value of an earlier,
lagging record )
Always (always replace with the value
of an earlier, lagging record)
Clicking on ADD will save the test and the
intended action. When the conditions are
met, Cleanse will overwrite the existing data
with the new value.
Rounding Tests
When a numerical column is selected for
evaluation, additional test options are made
available. These include:
Round Up
Round Down
Round away from zero
Round to the Nearest (even)
In the second example shown, the column “High School GPA” was selected from the column on the
left. A test was added to ‘Round Up’ the values encountered.
Multi-Select / Bulk Replacement or Rounding
If the same Cleanse action needs to be performed on several columns, hold the Ctrl button while
clicking on the desired names. This will select multiple columns around which a test may be designed.
Once added, a separate entry for each column will appeared in the list of Cleanse actions. Note that
the Get Values button is disabled when multiple columns are selected and that all columns selected
must be of the same data type (text, integer, real, etc).
Rev. 7/14
29
Rapid Insight
®
Veera™ - User Manual
TRANSFORM COLUMNS
Overview
The Transform Node allows you to create new columns from existing columns. Once a Transform Node
is connected to another node, it shows a list of all of the fields that exist in that node.
There are several options for different types of variables that can be created. Along the top of the
Transform Window, there are four tabs (Binning, Multi-Variable Formula, String Functions, Date/Time).
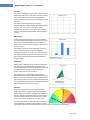
Binning
The binning option allows users to
create bins from another variable. To
do this, first select the column that
users want to create the bins with, on
the left side. Next name the first
bin/category. To do that, simply type in
a name for that bin where it says ‘First
Category =’. Next, define the definition
for that bin.
For example, perhaps users have a field
containing SAT Math scores, and want
to define ‘low’, ‘medium’, and ‘high’
bins. In that case, name the first
category ‘low’. Then define that
category as (SAT Math <= 500).
Once defined, click the ‘validate’ button. Then name and define the next category.
Perhaps a user wants to name the next category as ‘medium’, and define it as SAT Math > 500 and SAT
Math <=600. Click validate again, and define the next category. Once all categories are defined, type
the name of the new variable where it says ‘New Variable Name’.
Finally, click the ‘create variable’ button. This new Transform now appears at the bottom of the
window where it says ‘Transform Operations’. The Transform can be edited at any time by clicking it,
making any changes, and then clicking the ‘update’ button.
A good way to test whether the transform was created correctly, without having to run the entire job,
is to save and exit the Transform Node, then right click the Transform Node and choose ‘preview data’.
By default, this runs the job using the first 1,000 records from any inputs, and shows the results, with
the new variable as the last variable.
Note: If the variable being used to create the binned variable is a categorical variable like ‘state’, users
can retrieve the unique values by clicking the ‘get sample’ button in the upper right corner. Users can
then choose the ‘in’ operator, hold down the shift or control keys and choose any values to be placed
into each bin.
Multi-Variable Formula
The contents of a new column can be
derived from a single, solvable formula
using one or more existing columns.
First, choose any columns to be used as
variables in the formula. Veera assigns
Rev. 7/14
30
Rapid Insight
®
Veera™ - User Manual
formula tags to each of the chosen columns.
In the example shown, two columns are chosen to work with (SAT Verbal and SAT Math). A variable of
A is assigned to SAT Verbal, and B is assigned to SAT Math.
In the formula box, any formula can be entered. In the example A+B is typed. This adds the two fields.
Next choose a Result Type from the drop-down box. Then decide how to treat missing values both in
the formula and in the results. Finally, name the new variable, and click Create.
IF Function
The IF function returns one value if a condition specified evaluates to TRUE, and another value if that
condition evaluates to FALSE. The syntax for the IF function is: if(P1,P2,P3), where:
P1 is the condition to test
P2 is the value to return if the
expression is true
P3 is the value to return if the
expression is false
As an example IF([A]>50,’high’,’low’) would
return the value of ‘high’ if the field represented by A was
greater than 50, and ‘low’ if it is not greater than 50. Note in
this case, since the output values are text, single quotes are
put on ‘high’ and ‘low’, and the result type would need to be
set to text.
Functions Operations
Clicking the f(?) button displays a list of functions. Clicking a function shows the definition and
parameter requirements of the function. The function can either be manually entered into the formula
box, or double clicked to automatically appear in the formula box.
MATCHESREGEX FUNCTION
MatchesRegEx is a function that takes a text column and returned a 1 when the text string matches the
desired regular expression (RegEx). In effect, MatchesRegEx acts as a universal IS function, although
users must develop the testing expression. Fortunately, searching the Internet for regex provides a
wealth of examples. For example:
This RegEx will only match a valid social security number (i.e. it won't match 000-00-0000):
^(?!000)([0-6]\d{2}|7([0-6]\d|7[012]))([ -]?)(?!00)\d\d\3(?!0000)\d{4}$
This RegEx will match currency (with or without cents, and optional $ sign):
^\$?\d+(\.(\d{2}))?$
This RegEx will match positive integer: ^\d+$
Boolean Operations
Users can create Boolean (true/false or 0/1) variables. Choose the columns to work with, to assign
variable tags. Type an expression and choose the output type of either Boolean which results in a true
or a false output, or choose Binary, which results in 0 or 1 output.
Rev. 7/14
31
Rapid Insight
®
Veera™ - User Manual
Formula Parameter
This button appears above the formula field. It opens a List Box, allowing the user to incorporate one
or more parameters into a formula. Parameters (i.e. named variables) are user-defined, specific to
each job and configured under the Edit Parameters button of the Job Toolbar.
Validate Formula
This button appears above the formula field. It checks the contents of the formula field for possible
syntax issues. If a potential problem is detected, an Invalid Formula error is displayed. No message
appears if the syntax is successfully validated.
String Functions
Only TEXT columns are available on the String Functions tab. Choose the text column to work with then
fill in any parameters that are requested (the function definition as well as the parameter definitions
are contained in the Function Definition box). Once the required parameters are filled in, name the
new transform and click the Create button. If no text columns are found, the column list is blank.
Date/Time Functions
Only DATE/TIME columns are available on
the Date/Time tab. Choose the date field to
work with from the left. Next, fill in any
parameters that are requested (the function
definition as well as the parameter
definitions are contained in the Function
Definition box). Once the required
parameters are filled in, name the new
transform then click the Create button. If no
date/time columns are found, the column
list is blank
Editing a Transform Operation
Transforms can be edited at any time by clicking the transform at the bottom of the window. Once the
edits are made, click the Update button to update the transform. A transform can also be removed by
clicking the transform and clicking the Delete button.
Copying a Transform Operation
Formulas and bins may be copied by right-clicking the entry in the Transform Operation list at the
bottom of the window and selecting Clone Transform. An identical copy of that operation will appear
in the list.
Exporting and Importing a Transform Operation
Formulas and bins may be exported by right-clicking the entry in the Transform Operation list at the
bottom of the window and selecting Export Transform. The program will allow the operation to be
saved as a *.ritd file.
Formulas and bins may also be imported by right-clicking the entry in the Transform Operation list at
the bottom of the window and selecting Import Transform. The program will allow the user to select a
saved *.ritd file and add its operation to the existing list.
Rev. 7/14
32
Rapid Insight
®
Veera™ - User Manual
SORT RECORDS
Sort reorders the records as specified by the user. The left column shows the Input columns. These are
the available columns you can select to sort by. There may be many columns chosen to sort by.
In the example, “State” was selected using the arrow and
then appears in the Sort By: list. From there, select how it
should be sorted - Ascending or Descending. If many columns
are added to the Sort and the order needs to change, use the
up and down arrows in the header to move in the proper
order.
Note: The default sorting direction can be changed from the
toolbar TOOLS > OPTIONS menu.
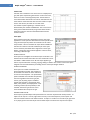
DEDUP RECORDS
Dedup identifies and removes duplicate records based upon criteria set up by the user. There are 3
elements in the DeDup Node:
Input Columns: Input columns are the available
columns coming from the node they were
connected to. You can use these columns in
the DeDup By Columns window or as a
selection rule.
DeDup By Columns: These are the column or
columns that identify duplicate values. In the
example below, duplicates are identified
based on the same Student IDs. You may have
multiple columns that identify duplicates,
such as Last Name, First Name and Birth date.
Selection Rules: These allow you to have
control over which duplicate record continues towards the output. In the example below, the
SAT – Math is being used as a Selection Rule. Therefore, if a duplicate Student ID is found, it
takes the record with the Max SAT – Math score. Other options are Min, Not Null and Null.
Any values in the Input Columns may be used in the Selection Rules. Applying the Discard All
option removes each and every copy of a record that has duplicates.
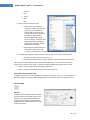
FIND DUP RECORDS
Find Dup is used to find duplicate records that may exist in a data
source and output these records.
All of the input columns will appear on the left hand side. The user
can then select one or more columns to find duplicates by. One can
then connect an output node to this to receive all of the duplicate
Rev. 7/14
33
Rapid Insight
®
Veera™ - User Manual
records. In order to get just a list of those duplicate records, the user may wish to add a dedup node
right after the find duplicate to see a list of those IDs or names that are considered duplicates.
QUANTILE RECORDS
The Quantile Node creates a new quantile variable that indicates a record’s relative location compared
to the other records values in that column.
The quantile is created by ranking the data based on the chosen field, and then splitting into N equal
groups. To create a quantile, choose the variable that you want to base the quantiles on, choose the
quantile type, and name the variable (or leave it as the default name).
For example, a decile creates 10 groups. It creates entries based on a GPA variable, so a record with a
decile value of 9, means that 90 percent of the GPA values in the data fall below the value for that
record. Another option is to create quartiles, which rank the data and split the records into 4 groups. In
th
this case, if a record is in the 4 quartile, that record is
higher than ¾ of the other records (higher than 75%). If a
record is in the second quartile, that record is higher than
25% of the other records. Below is a list of all of the default
quantile options:
Quartile (4)
Quintile (5)
Nonile (9)
Decile (10)
Duo-decile (12)
Vingtile (20)
Percentile (100)
Custom quantiles may also be entered in the # of Quantiles
field. Quantiles may be assigned in ascending or descending order.
RENAME/EXCLUDE COLUMNS
The Rename Node changes the names of columns or
excludes them completely from appearing on the
output. The new names appear in any node that is
connected after the rename node. When the rename
node is first opened, a list of all of the fields appears.
To rename a field, type the new name in the ‘New
Name’ column, directly to the right of the old name.
To exclude a column, uncheck the corresponding
KEEP box.
Rev. 7/14
34
Rapid Insight
®
Veera™ - User Manual
CONVERT COLUMN DATA TYPE
Convert Column Data type is used to easily change column data types. For example, when attempting
to merge two disparate data sources that have the same information but are of different data types –
like INTEGER and TEXT. Also used when
need to append information of the
same content, but different type.
All of the input columns are listed
followed by their Original Data Type.
These are read-only fields.
The New Data Type has the following
options:
Text
Integer
Date
Real
Time
Boolean
DateTime
Designating the Format becomes possible if selecting a new data type of TEXT, DATE, TIME or
DATETIME. Format options are:
Scientific
Date
SSN; with and without dashes
Time
Phone #; various styles
DateTime
Currency
Integer
Number
Fixed 1-15: This allots the number of
characters after a decimal point
Percent
DATE, TIME, and DATE/TIME provide a wide range of formatting options for column values.
All of the available formats appear in the drop down box. After you make your choices, select the
green checkbox to save and exit from the node.
Multi-Select and Bulk Convert
If the same convert action needs to be performed on several, co-located columns, select a range of
New Data Type fields using the mouse and the SHIFT key. Then select the new data type for the
topmost entry in the highlighted list.
An additional option to convert all fields to text can be found under the window’s Edit menu.
RANKING RECORDS
This task creates a new column and assigns a
rank to each record based on ranking criteria.
Input Columns contain all of the columns coming
from the previous node. You have the option of
Rev. 7/14
35
Rapid Insight
®
Veera™ - User Manual
selecting any of the input columns into Group By or Rank By.
Rank By is used to sort and rank. If no Group By is chosen, rankings are created for the entire
population, or for every record based on the Rank By variable. Only one variable may be chosen to
rank by. If values are null, they are excluded from the rank. If duplicate values exist, Veera ranks them
all based on the first one it comes to.
Rank order is set to either Ascending or Descending. New Rank Column Name displays the new column
name. The optional Group By field orders the ranked values by the selected column(s) which should
contain a limited number of unique values.
CREATE INDEX
If neither the Rank By nor Group By fields are populated, the task will rank records by their position
in the dataset, starting with 1.
TRANSPOSE COLUMNS
Transpose allows users to identify the unique entries
found under a specific column and build one or more
sets of new columns from them. All the data records
are then reorganized to populate the new columns
with the selected values.
As a simple example, take a dataset containing
three columns: salespersons’ names (person), sales
months (month) and the number of sales made that
month (sales). The dataset contains several records
per person (each one reflecting a unque month and
its sales figures).
Suppose it was preferable to have just one record
per person. It would then be necessary to create a
new column for each unique month (Jan, Feb, Mar)
and store that month’s sales number underneath it.
To do this, the column “month”is selected to be
Transposed By and the data in column “sales” is
selected to populate the new monthly columns that will be created.
Clicking the Values button opens the Get Values utility where the
unique values are defined. Identifying these values can be done
automatically by clicking the Get Values button, by typing values in
directly or a combination of both methods.
The resulting records still contain an unchanged “person” column.
But in place of the original “month” and “sales” columns
are three new columns that capture the transposed data
(“sales_jan”, “sales_feb”, “sales_mar”). To flatten this
dataset to just one record per person, an aggregate
node will need to be used. Aggregate By the “person”
column and select the First real value of each of the
other columns.
Rev. 7/14
36
Rapid Insight
®
Veera™ - User Manual
CACHE RECORDS
Cache is used to shorten processing time when running complex jobs with large data sources. When
inserted in a job, all the data processed prior to and passing through a cache is saved. If the running job
accesses data from this same point more than once, this saved data are used rather than processing
through the earlier nodes again.
A Cache may be configured to retain data between job runs. When data is retained between job runs,
the icon appears with a yellow cylinder superimposed in the upper right corner. Data will be retained in
the Cache until the preset time expires or the Flush Cache Now button is clicked.
Splitting and Recombining Process Paths
A process that splits at a Cache may be recombined later in the same job
using a node such as Merge or Append. This is a behavior unique to
Cache – splitting a process at any other node and attempting to
recombine it further on will produce an error or unpredictable results.
Viewing Cached Data
Caches allow users to directly view cached data by right-clicking the node
and selecting View Data from the menu. This feature is the same as that
found on Data Connections and Output Tables nodes.
SUBROUTINES OVERVIEW
Subroutines allow designers to make use of existing jobs from within a new process, shortening
development and running times while opening a new range of processing possibilities.
An effective subroutine requires the following:
A "base" job containing one or more SUBROUTINE nodes must be created. Each SUBROUTINE
node is configured to send data to, and pass on data received from, a "target" job.
Rev. 7/14
37
Rapid Insight
®
Veera™ - User Manual
One or more "target" jobs must be created. Such jobs are designed to be used only as part of a
subroutine and not run on their own.
o A target job may receive some or all of their data from a SUBROUTINE node through
one or more INPUT PROXY nodes.
o A target job must contain one (and only one) OUTPUT PROXY node. Data entering this
node is passed back to a SUBROUTINE node.
The effect is as if all the nodes providing data to the OUTPUT PROXY in the "target" job were actually
part of the "base" job at the point where the SUBROUTINE node is located.
INPUT PROXY
INPUT PROXY is a type of data connection node. It's the point where
data is received from the SUBROUTINE node that originally caused
the job to run.
Multiple INPUT PROXY nodes may be added to a single job.
Jobs with INPUT PROXY nodes may also include other data
connections.
This node may provide data to other nodes but cannot
directly receive data.
An INPUT PROXY may be configured either by converting an
INPUT node or manually.
Note that, regardless of setup method, any columns
configured in the INPUT PROXY will be considered required.
Manually Configuring an Input Proxy Node
Double-clicking on an INPUT PROXY node placed in a job opens its
setup window. Here, column names and data types may be directly
typed into the columns provided.
Replacing an Input Node with an Input Proxy Node
Once an INPUT node is place in a job, it may be converted into an INPUT PROXY by right-clicking on the
icon and selecting "Replace with Input Proxy Node" from the menu that appears. Double-clicking on a
converted INPUT PROXY node opens its setup window. Here, the column names and data types found
in the original INPUT node may be seen and, if desired, changed.
OUTPUT PROXY
An OUTPUT PROXY is a type of output node. It's the point where data is returned to the SUBROUTINE
node that originally caused the job to run.
Only one OUTPUT PROXY may be added per job.
Data can enter this node from only one source.
Rev. 7/14
38
Rapid Insight
®
Veera™ - User Manual
The OUTPUT PROXY need not be the only output from the job, though when called from a
SUBROUTINE node, only the OUTPUT PROXY will be updated.
There are no configuration settings for this node.
SUBROUTINE
A SUBROUTINE node defines the location and
the conditions for incorporating one job's
process into another. The node itself acts as a
matchmaker, marrying the individual data
sources entering the SUBROUTINE node with
specific INPUT PROXY nodes found in the called
job. Once that called job finishes running, any
data entering its OUTPUT PROXY node is then
passed back to SUBROUTINE to continue on
through the job. Unlike most nodes, SUBROUTINE can accept multiple streams of data as inputs.
CONFIGURING A SUBROUTINE NODE
To configure, add the SUBROUTINE node to the job, then double-click on the icon to access its setup
window. This window is divided into three sections.
JOB NAME Field
The Job Name dropdown is use to
identify which job this
SUBROUTINE will
interact with.
Clicking the control
will open a view of
the WORKSPACE >
JOBS area from which
the job can be
selected.
JOB PARAMETERS Fields
The selected job may or may not have parameters configured.
If it does, the value of the parameter may be changed when
the job is run by entering content in the New Value field.
INPUT Field
This section is where the associations between the streams of
data entering the SUBROUTINE node, and the INPUT PROXY
nodes found in the called job, are established. Each INPUT
PROXY node will be represented by a tab. The user selects
(using the Input field) which stream of data entering the
SUBROUTINE node will be uniquely associated with which
INPUT PROXY. When a selection is made, the grid below will
list and compare (using check boxes) the variables found in
Rev. 7/14
39
Rapid Insight
®
Veera™ - User Manual
both the INPUT PROXY and the SUBROUTINE nodes. Excess columns coming from the SUBROUTINE are
acceptable, but all fields found in the INPUT PROXY of the called job are required and must have a
match in the SUBROUTINE.
REDUCE VARIABLES
The Reduce Variables node is intended to facilitate the creation of a predictive modeling dataset for
use in Veera’s sister product, Analytics. It looks to identify those columns that statistically relate to a
user-selected Y-variable and output them.
Y Variable Field
The Y Variable represents the one item that a predictive model is intended to predict. It can be any
linear (real or integer) or binary (1 or 0) variable present in the list on the left-hand side of the setup
screen. The arrow button to the left of the Y Variable field is clicked to loading the desired, highlighted
column.
Setting Test Options
There is one main Variable Reduction configuration option affecting testing - P-Value threshold. This
determines a minimum level on how confidence the program has in the variable’s relatedness. The
larger the p-value, the less confidence there is in the specific variable. The default is 0.01.
Identifying Related Fields
When the Find Related Now
button is clicked, the node will
perform a series of statistical
tests (Chi-Square, F-Test, etc) on
the data in each column. In
addition to the variable itself,
several mathematical
transformations of the original
are also evaluated for relevance.
These variations include square,
square root, cube, cube root,
log10 and natural log.
Rev. 7/14
40
Rapid Insight
®
Veera™ - User Manual
Those variables in the list that are sufficiently related to the selected Y Variable will be colored green,
those related but not meeting the p-value threshold will be colored red and those not related will be
colored black. Beside each variable is also listed its statistical test results and the transform providing
the strongest statistical fit.
Output Options
There are three main Variable Reduction configuration options:
Keep Column. Columns marked in blue will be kept if relevant and left behind if not. This
setting may be manually overridden to always keep (checked) or always discard (unchecked).
Create Related Best Fit Transforms. Checking this option will direct Veera to create those
transformed variables that were judged to be the best statistical fit.
Create Related Category Transforms. Checking this option will direct Veera to create binary
variables from those individual categories judged to be statistically relevant.
View Relationships Chart
Selecting a variable from the list will graphically display its relationship to the Y Variable.
R PROJECT
The R Project node provides a
means of incorporating scripts
from the popular open source
statistical language R into Veera
jobs. The node initially offers
several pre-programmed scripts
to pick from, though this list may
be supplemented by the user.
The R Project screen is
comprised of several sections.
The R Scripts dropdown lists the
available scripts to pick from. By
editing the RScripts.config file located in the program folder, users may add new R scripts, modify
existing ones or delete some altogether.
Once an R script is selected, the input parameters required by the script, along with their data types,
are listed in the Parameter Name field. Users then select each listed parameter in turn and designate
which of the available data columns will be used to satisfy its requirements.
The output of the R Project node is determined by the script it’s running. This will either be a report
based upon a single text-based column or a multi-column dataset.
MODEL
The Model node is used to perform the mathematical computations necessary to build a statistical
model predicting behavior of a chosen, Y-variable. The model is a mathematical formula that is
comprised of one or more of the other variables found in the dataset.
Rev. 7/14
41
Rapid Insight
®
Veera™ - User Manual
In order for the Model node to be used effectively, it must be preceded by a VRE node. . It’s there
that TEXT variables are evaluated for their model-worthiness and, when appropriate, broken apart and
converted into categorical BINARY variables for use at the modeling stage..
Model Types
By using the Model Types, users can customize their regression model. Logistic regression is used when
the Y-variable is a binary. The resulting model looks to predict the likelihood of an event to take place.
Ordinary Least Squares (OLS) Regression is used when the Y-variable is continuous. Users may select
the Logistic regression method to model continuous variables, though this is not recommended. The
resulting model looks to predict the rate or quantity of an event.
Include VRE Generated Columns
Checkboxes
This option should be used when
the Model node is preceded by a
VRE node where related category
and best fit transform variables
were created. Then the new
columns will be evaluated for
their statistical impact on the
chosen Y-variable and, when
appropriate, they will appear in
the model formula.
Build Model Now
The easiest and fastest way to build a model is by clicking the “Build Model Now” button. This option
allows Veera to build what it feels is the best model that can be built on the current dataset. It takes all
non-linearities in the data into account and makes all of the appropriate transformations on the
candidate variables automatically.
Rev. 7/14
42
Rapid Insight
®
Veera™ - User Manual
MODEL INFORMATION
The “Model Information” window contains all of the variables available when building a model. It also
displays the model’s variable coefficients, standard errors, t-values, and p-values. All of the regression
analysis steps taken to obtain the current model are also available by expanding the Model Steps
section.
Share
A process that splits at a Share may be recombined later in the same job using a node such as Merge or
Append. This is a behavior unique to the Share and Cache nodes – splitting a process at any other
node and attempting to recombine it further on will produce an error or unpredictable results.
This node is available only from the Job Tabs Program Toolbar under the NODE > ADD TASK menu.
Reports
OVERVIEW
These are report formatting options designed to be used in
conjunction with an Output Report runable to provide a
particular look or style. Veera provides 6 unique report
styles that can be incorporated into any job. There is no limit
to the number or types of reports styles that can be used,
though there are some restrictions on their order. The 6 report types/styles are:
1.
Format Column Data (found only under the Node> Add Report menu)
2.
Cross Tab Report
3.
Frequency Report
4.
Group By Report
5.
Profile Report
6.
Chart Data
Right-clicking on a report will open the Help Menu entry for that icon in a separate window.
FORMAT COLUMN DATA
Format Data is used to set specific formatting on fields for
report outputs. Other options exist, such as those listed. The
Keep column allows users to select which columns will or will
not appear at the output of the node.
Regardless of their original column types, all data emerging
Rev. 7/14
43
Rapid Insight
®
Veera™ - User Manual
from this node are converted to type Text. Because of this, care should be taken when using the
output of this task.
NOTE – Format appears only under Node> Add Report
CROSS TAB REPORT
Cross Tab reports create
summaries (counts, means,
sums) across two or more
fields. They generate
summary data in a grid
where the rows and
columns represent groups
of data.
The user selects what the
Cross Tab rows and
columns will be. Clicking
the ellipse button under the Values section of a Cross Tab Column will open the Get Unique Values
utility. This is where unique values that organize and label the columns are defined. Identifying these
values can be done automatically by clicking the Get Values
button, by typing values in directly or a combination of both
methods.
The Cross Tab values are populated using the checkboxes on the
left hand side. Cross Tab Values may also include Row and Column
Sum and Percentage (%), or Cell Percentages (%) by checking the
relevant boxes. Cross Tab must output to a Report node in order
for the headers to be seen. The column headers that appear will
consist of all the entries found in the Input node, regardless of
whether this data had been removed at some stage. Use the
report’s Remove Empty Column setup option to hide any
unwanted columns.
NOTE - Regardless of their original column types, all data emerging from this node are converted to
type Text. Because of this, care should be taken when using the output of this node.
FREQUENCY REPORT
Frequency Reports help to understand the counts of unique
values represented in the data for any particular field. In
the example below, the frequency is being determined by
Gender. At the bottom right of the window, you can select
the sort by and sort direction of the data. You can also
choose the percent format.
Running this to an output gives each unique value of
gender, the number of times it was represented in the
Rev. 7/14
44
Rapid Insight
®
Veera™ - User Manual
data, the % it amounted to, as well as the cumulative frequency and percent.
Frequency must output to a Report
node in order for the headers to be
used – otherwise they will appear as
a row of data.
NOTE - Regardless of their original
column types, all data emerging
from this node are converted to type
Text. Because of this, care should be
taken when using the output of this
task.
GROUPBY REPORT
GroupBy Report is used in designating how an output
should be sorted and grouped and the associated
column values formatted GroupBy must output to a
Report node in order for the headers to be used –
otherwise they will appear as a row of data.
NOTE - Regardless of their original column types, all data
emerging from this node are converted to type Text.
Because of this, care should be taken when using the
output of this task.
PROFILE REPORT
A Profile Report is used to summarize a column’s basic
statistics. The user may choose any column to profile.
Select from the left side and double-click or use the
arrow to identify the Profile columns. There are
several options on how to profile the data. They
include:
Min Value
Max Value
Range (Max-Min)
Mean
Number of observations
Number of missing values
Number of unique values
All data unable to be calculated (due to variable type) will be left blank in the output.
Rev. 7/14
45
Rapid Insight
®
Veera™ - User Manual
Profile must output to a Report node in order for the headers to be used – otherwise they will appear
as a row of data.
NOTE - Regardless of their
original column types, all data
emerging from this node are
converted to type Text.
Because of this, care should be
taken when using the output
of this task.
CHART DATA
Overview
The Chart Data task permits users to incorporate charts
into reports - graphically depicting selected data. The
node offers six charting types – Pie, Bar, Line, Column,
Radar and Scatter. All charts (except Scatter) use a
similar screen to select data for display. This screen is
also where a chart’s presentation style is selected from a
list of available options. Chart styles are user-configured
on the Chart Styles screen, accessed from the TOOLS
menu.
Pie Chart
The number of slices appearing in a Pie chart is determined
by the record count of the data entering the node. The
slices are labeled with data found in the column selected to
be the Selected Legend Column. Note that each data row
must contain a unique value in this column, otherwise an
error will result.
The size of each slice is determined by the values of data
found in the column selected as the Selected Data Column.
Note that only a single data column may be selected and
that column must be numeric.
Bar Chart
The number of sets of horizontal bars appearing in a Bar
chart is determined by the record count of the data
entering the node. Each set of bars is labeled using data
found in the column selected to be the Y-Axis Label
Column. Note that each data row must contain a unique
value in this column, otherwise an error will result.
How many bars appear in each set is determined by the
number of columns selected to be Selected Data
Columns. The length or height of each bar is determined
by the values of data found under these same Selected
Data Columns. Note that the Selected Data Columns must be numeric.
Rev. 7/14
46
Rapid Insight
®
Veera™ - User Manual
Line Chart
A Line chart is displayed as a grid. The horizontal X-axis is
labeled with data found in the column selected to be the
X-Axis Label Column. Note that each data row must
contain a unique value in this column, otherwise an error
will result.
The number of lines apearing in a Line chart is
determined by the number of designated Selected Data
Columns. The Y-axis of a Line chart grid is scaled
automatically using all the values found in these same
columns. Note that the Selected Data Columns must be
numeric.
Column Chart
A Column chart is displayed as a grid. The horizontal Xaxis is labeled with data found in the column selected to
be the X-Axis Label Column. Note that each data row
must contain a unique value in this column, otherwise an
error will result.
The number of vertical columns appearing in a Column
chart is determined by the number of designated
Selected Data Columns. The Y-axis of a Line chart grid is
scaled automatically using all the values found in these
same columns. Note that the Selected Data Columns
must be numeric.
Radar Chart
A Radar chart is displayed as a series of concentric rings.
The outermost ring is labeled with data found in the
column selected to be the X-Axis Label Column. Note that
each data row must contain a unique value in this
column, otherwise an error will result.
The number of areas appearing in a Radar chart is
determined by the number of designated Selected Data
Columns. A minimum of three is required with this chart
type. The radius of each ring is scaled automatically using
all the values found in these same columns. Note that the
Selected Data Columns must be numeric.
Dial Chart
A dial chart resembles an old-style automotive gas
guage. The number of pointers appearing in the dial is
determined by the number of designated Selected Data
Columns. Note that the Selected Data Columns must be
numeric and that each data row must contain a unique
value in this column, otherwise an error will result.
The Dial Chart is unique in that areas of the dial may be
colored differently to denote the importance of certain
value ranges. These may be specified either in the chart style or in the node’s setup window.
Rev. 7/14
47
Rapid Insight
®
Veera™ - User Manual
Scatter Chart
A Scatter chart resembles a Line chart in that it is displayed as a
grid, with points representing data entries. Unlike a Line chart,
there are no lines connecting these points. The horizontal Xaxis is labeled with data found in the column selected to be the
X-Axis Column. Note that each data row must contain a unique
value in this column, otherwise an error will result.
The number of points appearing in a Scatter chart is
determined by the number of Added Pairs. The Y-axis of a Line
chart grid is scaled automatically using all the values found in
these same columns. Note that the Selected Data Columns
must be numeric.
Chart Styles
How a specific chart looks is dependent upon the chart style
applied to it. Chart styles are selected for use with a specific chart
using the Chart Style drop down control within a chart node’s
setup window. All user-created chart styles will be available for
selection from this list as well as a Default style. Chart styles
aren’t necessarily associated with a single chart or chart type.
Rather, a single chart style could be applied to a host of charts,
each using a different type.
CHART STYLES LIST
Chart styles are managed from the Chart Styles List window. This
window can be accessed from either the chart node itself or from
the TOOLS > CHART STYLES menu. All chart styles appearing in
this list may be selected for renaming, copying, editing or deletion. The name of a new chart style is
assigned from this window before proceeding into the Chart Style designer window.
CHART STYLE EDITOR
Chart styles are created and edited in the
Chart Styles Editor window. This window can
be accessed from either the chart node itself
or from the Chart Styles list. The presentation
options available on this window are primarily
the same regardless of the chart type (bar,
column, pie, etc) being styled. Attributes
include titles, boarders, chart legends, data
labels, color palettes, and display fonts. A 3-D
rendering of charts (all except Radar) is also
available. Each chart type also has one or
more attributes tabs unique to its type.
SHARING CHART STYLES
Chart Styles may be developed and exported from one user then imported and used by another. To
export a chart style as a .vcst file, right-click on its entry in the Chart Styles List, select Export and
select the location where the file will be created. To import a .vcst file as a new chart style, right-click
in any empty space in the Chart Styles List and select Import to load the new style into the system.
Rev. 7/14
48
Rapid Insight
®
Veera™ - User Manual
Runable
RUNABLE OVERVIEW
Runables are the finishing steps for jobs in Veera. They provide the point where the results of the
process are saved, reported on and/or sent along to someone else. There are no limits to the number
or types of runables that can be used in a job, though there are some restrictions on their order.
Output Table
Output Report
FTP (get or put) File
Command
Compress or Uncompress Files
Call (Another) Job
Stop Job
Right-clicking on a runable will open the Help Menu entry for that icon in a separate window.
OUTPUT TABLE
Overview
The Output Table Runable provides the means of saving data to a file or table. Data can enter this node
from only one source.
Configuring an Output Table Destination
Once the Output Table setup window is opened:
Enter a unique Connection Name.
Select a Data Destination. The types of data
destinations available for use are generally the
same as those available as data sources (i.e.
Connections). As with Data Connections, which
data destination types are available is often
dependent upon whether the drivers for that
type are installed on the computer. ODBC, OLE
DB and ADO.net drivers are freely available for
download from many manufacturers. These can
include:
o Access
o Excel
o FoxPro
o Oracle
o SAS
o SPSS
o SQL Server
Rev. 7/14
49
Rapid Insight
®
Veera™ - User Manual
o Text/CSV
o UDL
o Vertica
o xBase
o XML
Select an Output Connection Type
o Output Create. This creates the
output file or table. Note that this
option may not be available or
functional for every Destination
Type. By default, Veera ships with
the ability to create tables in
databases like Oracle and SQL
Server turned off. To enable, check
Allow Create Table in Databases
option under the toolbar TOOLS >
OPTIONS menu window.
o Output Append. Adds the data to an
existing file or table rather than
creating a new destination or overwriting any existing content.
The dialog box changes to request the information unique to each type. This means either
o Identifying the folder location, file name, etc., or
o Identifying the database server location, database name and connection information
Once the information is populated, the Test button becomes active so the connection information
entered can be checked. Once saved, an “Output” dialog box appears listing the columns in order.
Columns can be excluded by un-checking the Output box
Columns may be individually formatted under the Format column.
Passing Data Out of an Output Table
An Output Table can serve as an intermediate “save point” in a process. That is to say, connections can
be made coming from an Output Table and passing data on to another node, continuing the process.
OUTPUT REPORT
Overview
An Output Report Runable provides users with
the opportunity to immediately report on the
results of a job. Unlike the Table Runable, a
single Report Runable will accept data from
multiple sources, combining them into a single,
multi-section report.
Rev. 7/14
50
Rapid Insight
®
Veera™ - User Manual
Configuring an Output Report
Once the Output Table setup window is opened, perform the following actions on the “Header” tab:
Enter a Full File Name. By clicking on the Full File Name ellipse, a “New File” dialog box opens.
What is entered here accomplishes three things:
o Names the file where the report
data will be stored
o Names the location where the
report data file will reside, and
o Designates what the report type
will be. Supported file types
include PDF, HTML, MHT, Word,
Excel, and Rich Text (rtf).
Enter a Title. A title for the report can be
added by selecting the ‘Title’ checkbox
and typing a name to appear in the
header.
Make other formatting choices affecting the main body of the report. These include:
o Adding a timestamp to the report
o Section the report by data source
o Formatting the Title, Header and report body (“Data”) text
o Document Margins
o Presentation Style – Portrait or Landscape
o Column and Row auto-sizing and removal of empty fields.
Adding Data Sources to Reports
For each connection made between a source of data and a Report node, a tab will appear in the Report
node’s setup window labeled with the data node’s title. The order of these tabs will determine their
presentation order in the report itself and can be changed by using the left and right Move Section
arrows. The display order is also depicted in the Layout image appearing on the right side of the setup
window. Opening a tab offers custom formatting options for the section. Though a Section Title can be
added at any time, most options can only be edited and applied once the Use Default Settings box is
unchecked.
Adding Charts to Reports
As with data sources, each connection
made between a Chart node and a
Report node will appear in the Report
node’s setup window as a tab labeled
with the chart node’s title. The order
of these tabs will determine their
presentation order in the report itself
and can be changed by using the left
and right Move Section arrows. The
display order is also depicted in the
Layout image appearing on the right side of the setup window.
Opening a tab offers custom formatting options for the specific chart. Some of these options, such as
title font and section margins, can only be edited and applied once the Use Default Settings box is
Rev. 7/14
51
Rapid Insight
®
Veera™ - User Manual
unchecked. Others, such as Section Title, can be entered at any time. Some of these options are
unique to charts appearing in reports, with the effects of choices seen in the Layout depiction (the
selected chart highlighted in blue):
Chart Size. This governs the relative size of the graphic and how it will fit with other items in
the report.
Force New Section. This checkbox locates a chart to a new row in the report regardless of other
spacing considerations.
FTP (GET OR PUT) FILE
The FTP Runable provides a connection between a Job and an FTP site. Data can be downloaded from
or uploaded to the site, ostensibly for use in the Job. This can be done using one of five selectable
protocols:
FTP
Secure FTP (SFTP)
SCP
HTTP
WebHDFS (Hadoop)
In all cases, the user must fill in the
appropriate host, port, and user
information. The connection can
then be tested (using the TEST
button) to ensure everything
functions properly. The remote and
local file information will also need
to be configured to specify the file
names and locations.
As with all Runables, the “Set Run
Order” Job Workspace Toolbar
control is used to determine when
the Command Node is run. Unlike
most other nodes, connections are
not made from or to it.
FTP Download
Select the “Download” radio button
to have the Runable automatically
download a specified file from the
FTP site. In this way, any Data
Connections pointing to an existing
copy of that file could be assured to provide the latest copy of the dataset to the Job in which the FTP
Runable appears.
FTP Upload
Similarly, selecting the “Upload” radio button directs the Runable to copy the specified data file to the
FTP site.
Rev. 7/14
52
Rapid Insight
®
Veera™ - User Manual
COMMAND (EXECUTE EXTERNAL ENTITY)
The Command Runable is another unique Job
tool. When placed in a job, this node
opens/runs the file or program selected in the
“File Name” field. If a file is selected, it opens
the file in the program associated with it. If the
program or file uses conditional arguments as
part of its execution, these can be entered in
the “Arguments” field.
As with all Runables, the “Set Run Order” Job
Workspace Toolbar control is used to
determine when the Command Node is run.
If “Wait for Exit” is checked, the job will pause
indefinitely until the external program that was opened is closed or until the number of seconds
entered in the “Wait Timeout” field have passed. In the latter case, the external program will remain
open unless the “Kill Process on timeout” box is checked.
Unlike all other nodes (except FTP, Call Job and Compress), no connections are made from or to it.
COMPRESS OR UNCOMPRESS FILES
The Compress/Uncompress Runable is another
unique Job tool. When placed in a job, this
node permits the compressing or
uncompressing of files using the ZIP format.
As with all Runables, the “Set Run Order” Job
Workspace Toolbar control is used to
determine when the Command Node is run.
Unlike all other nodes (except FTP, Call Job and
Command), no connections are made from or
to it.
Uncompress Files
Select the Uncompress File radio button to configure the Runable to automatically uncompress the
selected *.ZIP file (Compressed File Name) into the specified folder (Uncompress To).
Compress Files
Select the Create Compressed File radio button to configure the Runable to select a single file (File) or
set of files matching a pattern (File Name Pattern) and compress them into a single ZIP file
(Compressed File Name).
Rev. 7/14
53
Rapid Insight
®
Veera™ - User Manual
CALL (ANOTHER) JOB
The Call Job Runable is another unique Job tool. This node passes new
parameters to and runs another Veera job selected from the “Job
Name” drop down list. Note that only the SAVED version of a selected
job will run. As with all Runables, the “Set Run Order” Job Workspace
Toolbar control is used to determine when the other job is run. Unlike
all other nodes (except Command, FTP and Compress), no
connections are made from or to it.
CALL (ANOTHER) JOB FOR EACH INPUT
Like the standard Call Job node, the Call Job for Each node runs
another Veera job that has been selected using its “Job Name”
drop down list. Unlike its sister node, the Call Job for Each is
designed to run the target job multiple times - each time
providing a different value for one or more of the target job's
parameters.
This is done by connecting a data source to the node (also unlike
Call Job) that serves as a “reference file”. The user matches fields found in this reference file to
parameters in the job being called.
The job called/run by the Call Job for Each node will be run once for each record found in the reference
file. Each of these records will pass its values for the parameter(s) its fields were matched up with,
potentially creating a unique result each time.
STOP JOB
The Stop Job runable is unlike any other node, in
that it can be used either as an intermediate step
within a job or as one of the job’s endpoints. It
provides a means of halting a job before completion
by testing whether there are data records entering
the node or not. Meeting the criteria selected for the test may stop just the part of the job that the
node is a part of or the whole job.
DYNAMIC FILE NAMING
File Name Parameter
Several Runables allow for the incorporation of one or more parameters into the file name. Parameters
(i.e. named variables) are user-defined, specific to each job and configured under the Edit Parameters
button of the Job Toolbar.
Rev. 7/14
54
Rapid Insight
®
Veera™ - User Manual
To use, enter a file name in the field provided. Then, place the cursor at that position in the file name
where the parameter value should appear. Finally, click the parameter icon to view and select from the
available list. Once done, the file name will appear containing the name of the parameter selected.
When the job is run and the file is created, the parameter name is replaced with parameter’s value.
File Name Timestamp
Several Runables allow for the incorporation of current date/time information into the name of the
resulting file.
To use, enter a file name in the field provided. Then, place the cursor at that position in the file name
where the date/time content should appear. Finally, click the Timestamp icon (beside the file name
field) to view and select from the list of available date/time format options. Once done, the file name
will appear containing code designating the format selected.
When the job is run and a file using a timestamp is created, the formatting code is replaced with
entries corresponding to the date and/or time at the file’s creation.
Custom Nodes (Add-Ins)
Add-Ins provide users with the opportunity to create their own, custom nodes. Developing Add-Ins
requires a strong working knowledge of a .NET-compatible programming language such as C#. There
are no restrictions.
Add-Ins are incorporated into Veera as supplemental DLL files, stored in the “C:\ProgramData\Rapid
Insight Inc\Veera\AddIns” folder of the program. A sample Add-in DLL is included with Veera to serve
as an example to would-be node developers.
Add-In nodes won’t appear along with the other, standard icons on a Job Tab. Rather, Add-Ins are
accessed through the NODE > ADD ADD-IN menu. Selecting an entry from this menu will place the
corresponding 32x32 pixel node image in the Job Workspace.
For further details on developing, integrating and using Add-In nodes, contact Rapid Insight Customer
Support.
SLEEP ADD-IN
Sleep is an Add-In Node that allows user-defined delays to
be incorporated into jobs.
Users enter the length of the delay (in minutes and
seconds) in the setup window. Like other "special" nodes,
Sleep does not connect to other nodes directly. Rather,
it’s participation in a job is managed through its run order,
much like data outputs, FTP nodes, etc.
Rev. 7/14
55
Rapid Insight
®
Veera™ - User Manual
TDE OUTPUT ADD-IN
The TDE Output is an Add-In node.
It allows Veera to store data in a
proprietary file format called a
Tableau Data Extract. This format
facilitates the use of the resulting
file as a data source for the widerange of visualization programs
offered by Tableau Software Inc.
Configuration of the TDE Output is
relatively simple. Users only need
to specify the .tde file name and
destination path.
Like other output nodes, Veera
nodes may feed data into it through a single connection, but it will not permit connections to be made
out of it.
TABLEAU ONLINE – APPEND TO EXTRACT NODE
The Tableau Online – Append to Extract
Node add-in node allows users the ability
to update a data source automatically to
Tableau Online. In order for this node to be
used, there must already be an existing
data source in your Tableau Online site.
This output will append new records to an
existing data source. If you would like to
update/overwrite the existing data source
use the Tableau Online – Refresh Extract
Node.
NOTE: it is important that for this add-in to
be used, the original file will have to be in
csv format. Once all values are entered,
this behaves just like any other runnable
node.
There are 7 required parameters for this node:
Server URL – this is the destination site for the data source. This does not include your
personal site name, but rather the Tableau Online site name and this value should
already be entered and should not change.
Username – the username that you use to access Tableau Online. This is generally an
email.
Password – the password that you use to access Tableau Online.
Rev. 7/14
56
Rapid Insight
®
Veera™ - User Manual
Sitename – This is specific to your institution’s online account. If you are unsure what
your site name is, this can be found in the web address to tableau online:
Datasource – The name of the data source as listed in your Tableau Online account. If
you go to the Data Sources tab in Tableau Online this will be the value that is listed
under Name.
Project – the name of the project that the data source was originally published to. This
is also available in the data source tab in Tableau Online
Original File – The original source of the data extract. For this node to work the original
data source has to be a csv file. The value entered into the node should contain the file
extension ‘.csv’. If you are unsure of the original file this is also available in the data
source tab in Tableau Online under the ‘Connects to’ field.
TABLEAU ONLINE – REFRESH EXTRACT NODE
The Tableau Online – Refresh Extract Node add-in node allows users the ability to update a data source
automatically to Tableau Online. In order for this node to be used, there must already be an existing
data source in your Tableau Online site. It is important to note that this output will update and
overwrite the existing data source. If you would like to just append to the existing data source use the
Tableau Online – Append Extract Node.
Rev. 7/14
57
Rapid Insight
®
Veera™ - User Manual
NOTE: it is important that for this add-in to be used, the original file will have to be in csv format. Once
all values are entered, this behaves just like any other runnable node.
There are 7 required parameters for this node:
Server URL – this is the destination
site for the data source. This does not
include your personal site name, but
rather the Tableau Online site name
and this value should already be
entered and should not change.
Username – the username that you
use to access Tableau Online. This is
generally an email.
Password – the password that you use
to access Tableau Online.
Sitename – This is specific to your institution’s online account. If you are unsure what
your site name is, this can be found in the web address to tableau online:
Datasource – The name of the data source as listed in your Tableau Online account. If
you go to the Data Sources tab in Tableau Online this will be the value that is listed
under Name.
Project – the name of the project that the data source was originally published to. This
is also available in the data source tab in Tableau Online
Original File – The original source of the data extract. For this node to work the original
data source has to be a csv file. The value entered into the node should contain the file
extension ‘.csv’. If you are unsure of the original file this is also available in the data
source tab in Tableau Online under the ‘Connects to’ field.
Rev. 7/14
58
Rapid Insight
®
Veera™ - User Manual
Job Workspace
JOB WORKSPACE OVERVIEW
This is where Connection, Task, Report and Runable icons (called “nodes”) are copied, connected and
configured to construct a Job in Veera.
JOB WORKSPACE TOOLBAR
A toolbar is located at the top of the Job Workspace. These controls provide a variety of tools and
functions for use with the Job in view. The individual controls on the toolbar are described below.
Validate Job
Use this to check the job before running it. Reviews the job and alerts the user to any potential issues
in the job. Veera highlights each issue with a yellow warning symbol above any nodes that are causing
a problem. Placing the mouse over the warning displays a description of the error.
Run Job/Pause Job
Use this to run or pause a job. When the job is running, the button toggles to pause. Press the button
at any point to halt the current status of the job.
Hide Job Status
This control hides the job progress bar.
Stop Job
Use this button to stop a job. The button becomes active (red) when a job is running. Press it to stop
the running of a job at any point. Note that, under some conditions, a job will be waiting for an
external driver to reply before it can respond to this control.
Rev. 7/14
59
Rapid Insight
®
Veera™ - User Manual
Delete Selected Item(s)
Use this button to delete any items that are selected in the Job Workspace.
Connect Nodes
Use this button to toggle on/off the ability to connect nodes together. Once on, select the source
node, then the destination node. A line will connect the two. An arrowhead indicates data flow.
Set Run Order
Use this button in cases where there are multiple Runable outputs and the order of those outputs to
run is important to specify. The order may be specified in one of two ways once this button is clicked.
The first is to click all visible Runable nodes in the order they should be completed. The second is to
arrange the Runables within the Rank Order List table.
Show/Hide Grid
Use this button to show or hide the grid in the Job Workspace. By default, the grid is hidden. To show
the grid, press the button. When selected, the grid pattern appears in the Job Workspace. This is OFF
by default.
Snap Moved Nodes to Grid
Use this button to force new or dragged nodes to fall onto the grid. This is ON by default.
Align All Nodes to Grid
Use this button to move all existing nodes onto the grid. This button is only functional when the
Snapped Moved Nodes to Grid is off when nodes are dropped onto the Job Workspace.
Grow Workspace Area
Use this button to expand the workspace area, navigated using scroll bars.
Edit Notes
Select a specific node then click this button to add a note to that node. A yellow note icon will appear
in the corner of the node once saved. To add a node to the entire job, be sure that no node is selected
(click into any clear space of the job) before clicking on the note button. To read the note that is
created, place the mouse pointer above a node’s note icon.
Rev. 7/14
60
Rapid Insight
®
Veera™ - User Manual
Edit Parameters
This control manages the parameters established by users and
available for use in configuring the nodes of the current job.
Parameters (named variables) are user-defined, specific to each job
and applied to formulas found in a variety of nodes.
Checking the Prompt for Value box will cause a pop-up dialog box
to appear any time the job is run requesting the user enter a new
value for the parameter.
Undo/Redo
Use these buttons to undo or redo any recent actions performed in the Job Workspace.
Save, and Save and Exit
Use the first button to save any current work. Use the green checkmark to save any current work and
exit the node or exit the job.
Wizards
IMPORT SCORING MODEL (with/without SEP)
Overview
When users of the Rapid Insight Analytics product create a predictive model, it is saved as an “.rism”
file. That file contains the mathematical formula, the optional standard error of the prediction (SEP)
and all the related variables that define the model. It’s typically used within Analytics to apply
probability scores to records - trying to predict the behavior the model was designed to address.
The Import Scoring Model Wizard allows a user of Veera to make use of that same “.rism” model file.
This way, Veera can be used to assign probability scores, then be able to report on the results.
Scheduling a scoring process is also possible – something not available in Analytics. The wizard
translates the contents of the model into nodes – recreating the formula, creating additional variables
if necessary, replacing missing data with the appropriate substitute values, etc.
Adding a Model to a Job
The Modeling Wizard is accessed by right-clicking on a node or connection and selecting the menu
entry Wizard > Import Scoring Model. A navigation window opens, allowing the desired .rism modeling
file to be selected. Once a model file is chosen, several nodes are added at that location.
Rev. 7/14
61
Rapid Insight
®
Veera™ - User Manual
Create Variables Transform
If new variables created in Analytics also
appear in the predictive model’s formula,
the Modeling Wizard creates a Transform
node to recreate them in Veera. This
Transform behaves just like the standard
node added by a user. Contents can be
edited, removed or the whole node
deleted. If no variables created in Analytics
appear in the model’s formula, then this
node will not be created by the Modeling
Wizard.
If the model uses created variables that, in
turn, were used to create still more
variables, then multiple transforms may be
produced to enable this in the job.
Clone Columns Transform
All variables participating in the modeling that weren’t created at the Create Variables stage are
duplicated here. This is done to permit more effective replacement of missing values later in the
modeling process. Duplicate fields are labeled using the prefix “Clone_”.
Missing Values Handling Cleanse
The Modeling file often contains
instructions on how to handle values
missing from the dataset. Settings within
the Transform nodes will replace missing
entries with zeros or with the column’s
mean value when appropriate. This later
Cleanse function is available only in the
model importation process and is not
otherwise editable.
Calculate Probability Transform
The Modeling Wizard always creates a
Transform node to incorporate the
probability model formula into the Veera
job. If the formula uses variables that are not available at this location in the job, the formula will be
displayed in red, indicating a problem. Note that this Transform behaves just like the standard node
added by a user. Contents can be edited, removed or the whole node deleted. The scoring results are
stored in a new field called “Probability”.
Drop Created Columns Rename
This node removes the “cloned” and created columns produced as part of the model import. Only the
new “Probability” column is retained.
Rev. 7/14
62
Rapid Insight
®
Veera™ - User Manual
JOBS IN VEERA
Jobs Overview
Jobs are projects, created by users, that
gather data from one or more data
sources (Data Connections), manipulate
that data with various tools (known as
Tasks or Reports), format that data using
several reporting styles (known as
Reports) and produce one or more
outputs in the form of files or reports
(each known as a Runable).
Creating Jobs
Creating a job involves several steps. These steps may
be performed any number of times and in any order
desired.
PLACE NODES (CONNECTIONS, TASKS AND RUNABLES)
INTO A JOB
These components are placed into the Job Workspace
in one of three ways:
Double-clicking on the Connection, Task or
Runable icon, or
Dragged and Dropped
Right-click on a Connection (only) and select
“Add Input Node”
Once in the Job Workspace, icons are referred to as “nodes”. Nodes may be repositioned by dragging
and dropping them.
Nodes may be removed from the Job Workspace by:
Selecting the node and pressing the DEL key
Right-click on the node and selecting “Delete” from the menu
Draw a group select box around several nodes, and then use the “Delete Selected Item(s)” tool
from the Job Workspace Toolbar.
RESYNCRONIZING A TEXT SOURCE INPUT NODE
Changes made to a text file data source may not always appear in the related Input Node – or worse,
an error may result. In the past, replacing an affected Input Node was the only solution. Now, clicking
Rev. 7/14
63
Rapid Insight
®
Veera™ - User Manual
the “Resynchronize to Connection” button allows an Input Node to recognize and reflect any changes
in its text source’s schema.
Resynchronizing an Input Node to reflect changes in its text type data
source is a two-step process. First, check to see if the File Properties
of the Connection Table need to be updated.
Right-click on the table’s entry in the Connections window and
select “Text Properties”
If you receive a “Schema doesn’t match file” message, click the
“Discard Schema” button located in the upper right of the
window
Click “Finish”
Second, open the configuration window of each affected Input Node
by double-clicking on it. The button will be found in the bottom right
corner of the configuration window. Click on the button to resync the
node to the new schema. Removals will appear in red, new entries in
blue. Save and close the window.
CONNECTING NODES TO CREATE PROCESS PATHS
Connection Methods
Nodes can be connected in one of several ways:
Use the Job Workspace toolbar tool Node Connect Mode
Use Alt-Left Mouse to drag the source node to the destination node
Right-click the source, select “Begin Connecting Nodes”, then select the destination
While holding Alt-Left Mouse, draw a group select box around several unconnected nodes,
and then release the mouse button.
Drag a node over an existing connection between two other nodes. When the connecting line
turns blue, drop the node to insert it into the existing path at that point.
Drag and drop a new node (the destination) onto an existing (source) node.
When connected, a line graphic be drawn between the nodes. An arrowhead at one end of the line will
indicate the direction data will flow.
Disconnection Methods
To remove a connection to a node:
Right-click on a connecting line and select “Delete” from the menu.
Select a connecting line and press the DEL key.
Select a connecting line and then use the “Delete Selected Item(s)” tool from the Job
Workspace Toolbar.
Right-click on any node (except those with multiple input or output connections) and select
DISCONNECT or DELETE from the menu.
Connection Rules
Some connection rules to consider:
Data Connection nodes can never be the endpoint of a connection from another node.
Rev. 7/14
64
Rapid Insight
®
Veera™ - User Manual
Except for Output Files, runable nodes cannot be the starting point of a connection to another
node.
Call Job, Command, Compress/Uncompress, and FTP nodes can never be connected to
another node
Only a few nodes can accept more than one input. These include:
o
Append Table
o
Merge Table
o
Lookup Column Data
o
Output Report
These nodes should directly output only to Output Table and Report nodes:
o
Format Column Data
o
Cross Tab Report
o
Frequency Report
o
GroupBy Report
o
Profile Report
CONFIGURE NODES TO DEFINE A PROCESS
Each node is configured differently. Please refer to the section of this document describing the specific
node for guidance.
ENABLING OPTIMIZATION TO IMPROVE A PROCESS
Optimization is a data processing option that takes advantage of the
filtering and sorting capabilities of data source host servers (if any exist)
when a job is run.
Optimization Program Option
The “Enable In Database Optimizations” control under the TOOLS >
OPTIONS menu determines the global default setting of the option. Only
Jobs whose “Use Optimization” properties are set to use the program
value are affected. Enabled is the default setting.
Optimization Job Property
The “Use Optimization” property under the JOB > PROPERTIES menu
determines the Optimization use status for the current Job. The control
has three states, selected by the user:
Box is blue (default) – Optimization is enabled or disabled in the job based on the program’s
global Optimization setting
Box is empty – Optimization is disabled and
cannot be used by any node in the job
Box is checked – Optimization is enabled for use
by nodes in the job, subject to their specific
settings.
Rev. 7/14
65
Rapid Insight
®
Veera™ - User Manual
Optimization Node Property
Each Input Node may be individually configured by the user to permit or deny the use of its data server
to optimize filtering and/or sorting functions when the job is run. These setting only have an effect
when Optimization is also enabled in the job’s properties.
Enable (default)/Disable Filter Optimization
Enable (default)/Disable Sort Optimization
Additionally, each Filter Node in a job may be individually
configured to permit or deny optimizing its specific filtering task.
Each Sort Node may also be individually configured to permit or
deny optimizing its specific sorting task. In both cases, these
setting only have an effect when Optimization is also enabled at
both the Job and Input Node levels.
CLONING, COPYING AND PASTING NODES
Cloning Nodes
Cloning one or more nodes effectively copies the selected icons, their interconnections and any
connections providing data to them, and pastes them immediately into another part of the same job.
Once those nodes to be cloned have been selected (by individual Ctrl-left clicks, or by “boxing in” the
nodes) the user may either
Right-click on part of the selection and select Clone from the menu that appears, or
Ctrl-left mouse on part of the selection and drag the cloned nodes to their new location.
Copying and Pasting Nodes
Copying and pasting one or more selected nodes and their connections operates much like cloning
nodes, but with two important differences – the user has more control over where the new nodes are
placed and copied nodes may be pasted into other jobs.
Once the nodes to be copied have been chosen (by individual Ctrl-left clicks, or by “boxing in” the
nodes) the user right-clicks on part of the selection and clicks Copy from the menu that appears. The
user picks where in the same job or in another job the nodes are to be pasted before right-clicking and
selecting Paste from the pop-up menu.
Notating Jobs (“Floating Notes”)
In addition to the “yellow sticky” notes that may be
attached to nodes using the Edit Notes tool, users can
imbed “floating notes” into a job. To create a floating
note, users must right-click on any open space in the job
and select Create Floating Note from the menu that
appears. A text box opens where the content of the note
is entered. To save the note, the user simply clicks the
mouse outside of the text box. There is no cap on the
number of floating notes that can be added to a job.
Like other nodes, floating notes may be repositioned,
cloned, copied, pasted and deleted. Their contents may
be edited by double-clicking on the node or by right-clicking and selecting Edit from the menu.
Rev. 7/14
66
Rapid Insight
®
Veera™ - User Manual
Floating notes may not be attached to other nodes, however.
The contents of a floating note are always visible and appear against a selectable background color.
This background color may be changed by right-clicking on the note and selecting Set Color from the
menu. Floating note defaults (background color, font color, type and size) are not editable.
Testing Jobs
There are several tools available to evaluate a job during and following its construction.
VALIDATE A JOB
Use the “Validate Job” tool from the Job Workspace Toolbar to check the job before running. Reviews
the job and alerts the user to any potential issues in the job. Veera highlights each issue with a caution
symbol above any nodes that are causing a problem.
PREVIEW DATA
The user can right-click on any node (except Connections, report or FTP) to select “Preview Data” from
the menu to begin. This runs a sample set of records through the job up to and through the node
where the preview was requested. This allows users to evaluate the results of their work at any point
in the process. The size of the sample set can be edited manually, and the default sample may be
changed under the TOOLS > OPTIONS > GENERAL menu.
Running Jobs
“RUN JOB” TOOLBAR CONTROL
This control is used to run (or pause) the job currently in view. When the job
is running, the button toggles to all pause. Press the button at any point to
halt the current status of the job. All available data records are used and all
Runables not currently disabled will be populated.
RUN TO THIS OUTPUT ONLY
A user may right-click on any Runable node to select “Run This Output Only”
from the menu. This runs the job, but only through the nodes necessary to
provide data to the selected output.
DISABLE
Runables may be individually disabled, to keep them from participating in any running of their job.
Right-click on any Runable node and select “Disable” from the menu. Nodes that have been disabled
will appear bordered in red.
RUNNING JOBS FROM THE COMMAND LINE
Veera jobs may be run using a command executed from the Command Line Prompt or the RUN
function under the Windows Start menu. The command itself is comprised of two parts. The first is the
file path where the Veera program file "VeeraWorkstation.exe" is located. On a machine using the
Windows 7 OS, this would be:
C:\Program Files (x86)\Rapid Insight Inc\Veera\VeeraWorkstation.exe
Rev. 7/14
67
Rapid Insight
®
Veera™ - User Manual
Next would be the actual command to run a job ("/runjob"), followed by the name of the job and its
organizational structure within Veera placed in quotes (i.e. "/Testing/New Freshmen Retention") A
fully-assembled command would read something like this...
C:\Program Files (x86)\Rapid Insight Inc\Veera\VeeraWorkstation.exe /runjob "/Testing/New
Freshmen Retention"
Scheduling Jobs
Veera permits users to schedule jobs to be run at
later dates and times. Jobs may be scheduled as
single events or as reoccurring actions.
SCHEDULE EDITOR
To configure a new event or edit an
existing one for the current job, open
the “Schedule” menu on the main
program toolbar and select “Job”. The
Schedule Viewer will open to display
the existing schedule. Click the “Edit
Schedule” button to open the
Schedule Editor window.
The styles of scheduling available are selected from the “Type” dropdown
list. Once a type is selected, other fields may or may not be active in
response to the choice. In most cases, a “Commence” and “Conclude”
date and time must be entered. When additional days/times might also
need to be chosen, this is done by clicking the “Selected Times” button.
To select a date or time on the screen that appears, select the choice with
the mouse then click the “Set” button.
SCHEDULED JOBS TAB
Select Schedule > Scheduled Jobs from the toolbar menu
to review all jobs currently scheduled. This will open a new
tab in the program labeled “Scheduled Jobs”. NOTE: Veera
must be open for a scheduled job to run.
SCHEDULED JOBS DETAILS AND HISTORY
The “Detail” and “History” buttons on the Scheduled Jobs
tab open windows that provide additional information on
jobs that have been run and their results when selected.
SENDING EMAIL NOTIFICATIONS FROM SCHEDULED JOBS
Scheduled jobs may be configured to email notification of their success or failure to one or more
recipients. Right-click on the job name listed on the Workspace Tab and select Properties from the
Rev. 7/14
68
Rapid Insight
®
Veera™ - User Manual
menu. The Email Notifications tab lists all the email recipients entered
into Veera. It provides two fields, On Success and On Failure, into
which they may be copied. When a scheduled job is run, an outcome
email is sent to those on the designated distribution list.
Distributing Reports by Email
Reports can be set up to auto-email themselves when created by a job
run. To configure this feature:
Select Tools > Options from the main toolbar menu
Enter local email service setting on the SMTP Information and
Distribution Lists tabs
To configure a particular report node to use the feature:
Open the report setup window and check Enable Distribution
Click the Distribution Setup button and select the recipient(s)
Saving Jobs
Jobs are saved by:
Clicking the “Save” or “Save and Exit” controls on the Job Workspace toolbar, or
Selecting the Job > Save option from the main program menu
Exporting and Importing Jobs
Veera allows users to share their jobs by exporting and importing them individually. This is done by
either:
Selecting the Job > Export option from the main program menu,
Right-clicking on the job from the Workspace tab and select “Export” from the menu,
Drag and drop the job from its location in the Jobs section of the Workspace tab to the desired
location on the computer
Jobs will be saved as files with the Veera Job File type (.vjf)
To import a job (the new job will appear in the Jobs section of the Workspace tab):
Right-click in the Workspace > Jobs section and select Import Job and select the .vjf file to be
imported, or
Select Job > Import Job from the main toolbar menu and select the .vjf file to be imported, or
Rev. 7/14
69
Rapid Insight
®
Veera™ - User Manual
Drag and drop the .vjf from its location on the computer into the desired folder of the Jobs
section of the Workspace tab.
Imported jobs often need to be reconnected to a data source in the new environment. Either…
Create connections and select files/tables whose names match those in the job, or
Remove the job’s current connections and use existing connections to replace them.
Collaborative Cloud
Rapid Insight hosts a free forum for users to share and trade copies of their Veera work with one
another – the Collaborative Cloud. Currently, four types of content may be contributed to and copied
from the Collaborative Cloud – jobs, transforms, chart
styles and add-ins. This forum is accessed from within
Veera.
CONTRIBUTING TO THE COLLABORATIVE CLOUD
Right-click on the item to be uploaded (job, transform,
chart style, add-in) then select the Contribute (item type)
to RI Collaborative Cloud menu option. For example, rightclick on a Veera job within the Jobs section of the
Workspace tab. Once selected, the Contribute to Rapid
Insight Collaborative Cloud window will open with the
original name of the item already entered at the top.
The user must enter a unique name, a description of the
item and check the Terms and Conditions box before the
item can be contributed. Additional files, typically related
sample data, may also be contributed as part of the
submission. Click the Contribute button to perform the
transfer.
GETTING ITEMS FROM THE COLLABORATIVE CLOUD
To copy an item from the Collaborative Cloud and add it to the list of those available, right-click on the
table or folder where items of that type are listed. For example, right-click a job folder within the
Workspace Jobs section where the job should be stored. Select Get Job from RI Collaborative Cloud
from the list of options. A clean
copy of the Rapid Insight
Collaborative Cloud window will
open. To see what items of that
type are available to download,
enter specific search criteria (or
use Search All) in the Search field
before clicking the Search button.
A list of items, their titles,
descriptions, and dates posted to
the Collaborative Cloud will list.
This list may be sorted on one of
several options selected from the
Sort By control.
Rev. 7/14
70
Rapid Insight
®
Veera™ - User Manual
Double-clicking on an entry will open the item’s Details window. In addition to information on the
item itself, attached files will also be listed. Once the Terms and Conditions box is checked, clicking the
Download button on the Details page will start the process of adding the item. Any attached files will
also be downloaded, with the user being directed to select the destination folder.
CONTRIBUTING AND READING COMMENTS ABOUT
ITEMS IN THE COLLABORATIVE CLOUD
Users may read comments on Collaborative Cloud items
by clicking in its # Comments field or by clicking the
Comments button on the items Details window. A
separate Comments window displaying all the comments
their authors and their contribution dates will open.
To add a comment, click into the lower half of the
Comments window and start typing. Clicking the Add
Comment button will upload the text as a new entry.
DELETING ITEMS FROM THE COLLABORATIVE CLOUD
Only the contributor of an item may delete it from the
Collaborative Cloud. A Delete button will appear at the
bottom of the item’s Details page. Clicking the button
will permanently remove the item.
Printing Jobs
There is an option to print the job. Go to File, and then Print Preview. It will then generate a preview
of what the job looks like. If printing from there, it will have the job itself as well as all of the
underlying functionality (connection names/location, node specifics, notes, output names & locations).
The larger the job, the longer it may take to generate
the print preview. Veera will alert you to it’s progress in
the ‘Generating Previews’ box.
Once all pages have cached, the Print preview window
will appear. The first page will contain a screen shot of
the job itself. Subsequent pages will contain every
detail of the job. Users can page through by hitting the
up or down arrow in the upper right portion.
Rev. 7/14
71
Rapid Insight
®
Veera™ - User Manual
APPENDIX A - TASK FUNCTIONS SUMMARY
Function Descriptions (Multi-Variable Transform Task)
Abs
ABS( )
ACos
ACOS( )
ASin
ASIN( )
ATan
ATAN( )
ATn2
ATN2( #y, #x )
Ceiling
CEILING( )
Char
CHAR( )
CharIndex
CHARINDEX( 'string', )
Contains
CONTAINS( 'string', )
Cos
COS( )
Cot
COT( )
Date
DATE( '' )
Returns the absolute, positive value of the given
numeric expression
Returns the angle, in radians, whose cosine is the
given real expression
Returns the angle, in radians, whose sine is the
given real expression
Returns the angle in radians whose tangent is the
given real expression
Returns the angle, in radians, whose tangent is the
quotient (Y/X) of given real expressions
Returns the smallest integer, greater than, or equal
to, the given numeric expression
A string function that converts an int ASCII code to a
character
Returns the starting position of the specified
expression in a character string. Returns -1 if not
found
Returns 1 if the specified expression is in the
character string, otherwise returns 0
Returns the trigonometric cosine of the given angle
(in radians) in the given expression
Returns the trigonometric cotangent of the
specified angle (in radians) in the given real
expression
Converts a string to a date
DateStr
DATESTR( )
Convert a date to a string
DateStr
DATESTR( , 'd' )
Format a date as a string
Day
DAY( )
DayOfWeek
DAYOFWEEK( )
DayOfWeekN
DAYOFWEEKN( )
DayOfYear
DAYOFYEAR( )
Returns an integer representing the day date-part of
the specified date (1-31)
Returns a string representing the day date-part of
the specified date (Sunday, Monday, etc.)
Returns an integer representing the day date-part of
the specified date (1-7)
Returns an integer representing the day date-part of
Rev. 7/14
72
Rapid Insight
®
Veera™ - User Manual
the specified date (1-366)
DaysBetween
DAYSBETWEEN( , date )
Degrees
DEGREES( )
DistanceBetween
DISTANCEBETWEEN( ,
zipcode )
DISTANCEBETWEENLATLON(
, lon1, lat2, lon2 )
DISTANCEBETWEENMGRS( ,
mgrsCoord )
DISTANCEFROM( , 'zipcode'
)
DISTANCEFROMLATLON( ,
varLon1, constLat2,
constLon2 )
DISTANCEFROMMGRS( ,
'mgrsCoord' )
DistanceBetweenLatLon
DistanceBetweenMGRS
DistanceFrom
DistanceFromLatLon
DistanceFromMGRS
Exp
EXP( )
Floor
FLOOR( )
Greatest
GREATEST( , expr, ... )
Hour
HOUR( )
HoursBetween
HOURSBETWEEN( , date )
If
IF( , trueValue, falseValue )
IsNull
Is Null
ISNULL( ,
replacement_value )
( IS NULL)
Least
LEAST( , expr, ... )
Left
LEFT( , #len )
Len
LEN( )
Log
LOG( )
Log10
LOG10( )
Lower
LOWER( )
LTrim
LTRIM( )
MatchesRegEx
MATCHESREGEX( , 'regex')
MetersToMiles
METERSTOMILES( )
Returns an integer representing the #of days
between 2 dates
Given an angle in radians, returns the corresponding
angle in degrees
Returns a real representing the # of miles between
2 zipcodes
Returns a real representing the # of miles between
2 Latitude/Longitude coordinate pairs.
Returns a integer representing the # of meters
between 2 MGRS coordinates (in same GZD).
Returns a real representing the #of miles between a
zipcode and a constant zip code
Returns a real representing the # of miles between
a variable and a constant Latitude/Longitude
coordinate pair.
Returns a real representing the # of meters
between a MGRS coordinate and a constant MGRS
coordinate (in same GZD).
Returns the exponential value of the given real
expression
Returns the largest integer less than or equal to the
given numeric expression
Returns the largest value in a list of 2 or more values
Returns an integer that represents the hour part of
a specified datetime
Returns an integer representing the # of hours
between 2 dates
Tests an expression result, returns one value if TRUE
and another value if FALSE
Tests if an expression result is null, returns the
result if it is not null, otherwise a replacement value
Tests if an expression result is null, evaluates to
Boolean
Returns the smallest value in a list of 2 or more
values
Returns the left part of a string the specified
number of characters in length
Returns the number of characters of the given
string, excluding trailing blanks
Returns the natural logarithm of the given real
expression
Returns the base-10 logarithm of the given real
expression
Returns a character expression after converting
uppercase character data to lowercase
Returns a character expression after removing
leading blanks
Tests if an expression result matches a regular
expression. (See TRANSFORM for additional info.)
Returns the real numbers of miles equivalent to the
specified number of meters.
Rev. 7/14
73
Rapid Insight
®
Veera™ - User Manual
Minute
MINUTE( )
MinutesBetween
MINUTESBETWEEN( , date )
Month
MONTH( )
MonthOfYear
MONTHOFYEAR( )
MonthsBetween
MONTHSBETWEEN( , date )
MonthsBetween
Now
MONTHSBETWEEN( , date, 1
)
NOW()
Returns an integer that represents the hour part of
a specified datetime
Returns an integer representing the # of minutes
between 2 dates
Returns an integer that represents the month part
of a specified date (1-12)
Returns a string that represents the month part of a
specified date (January, February, etc.)
Returns an integer representing the # of months
between 2 dates
Returns an integer representing the absolute # of
months between 2 dates.
Returns the current date/time
NullIf
NULLIF( , expr )
Returns a null if two expression are equivalent
Num
NUM( )
PadLeft
PADLEFT( , #len, ' ' )
PadRight
PADRIGHT( , #len, ' ' )
PI
PI()
Returns numeric data converted from character
data
Returns a string padded on the left with specified
character to the specified length
Returns a string padded on the right with specified
character to the specified length
Returns the constant value of PI (3.14…)
Power
POWER( , #pow )
Quarter
QUARTER( )
Radians
RADIANS( )
Random
RANDOM()
Replace
REPLACE( , 'find', 'new' )
RemoveLeft
REMOVELEFT( , #cnt )
RemoveRight
REMOVERIGHT( , #cnt )
Reverse
REVERSE( )
Right
RIGHT( , #len )
Round
ROUND( )
RTrim
RTRIM( )
Second
SECOND( )
SecondsBetween
SECONDSBETWEEN( , date )
Sign
SIGN( )
Sin
SIN( )
Space
SPACE( )
Returns a character string after truncating all
trailing blanks
Returns an integer that represents the second part
of a specified datetime
Returns an integer representing the # of seconds
between 2 dates
Returns the positive (+1), zero (0), or negative (-1)
sign of the given expression
Returns the trigonometric sine of the given angle (in
radians) in an approximate numeric (real)
expression
Returns a string of repeated spaces
Square
SQUARE( )
Returns the square of a given expression
Returns the value of the given expression to the
specified power
Returns an integer representing the 'Quarter'
specified date falls between
Returns radians when a numeric expression, in
degrees, is entered
Returns a random number between 0.0 and 1.0
Replaces all occurrences of the first string
expression with the second string expression
Removes specified number of characters from left
end of string expression
Removes specified number of characters from right
end of string expression
Returns the reverse of a character expression
Returns the right part of a string the specified
number of characters in length
Round value to the nearest integer value
Rev. 7/14
74
Rapid Insight
®
Veera™ - User Manual
Sqrt
SQRT( )
Returns the square root of the given expression
Str
STR( )
Stuff
STUFF( , #start, #len, 'new' )
SubField
SUBFIELD( , #fieldNum )
SubField
SUBFIELD( ,#fieldNum, ',' )
SubString
SUBSTRING( , #start )
SubString
SUBSTRING( , #start, #len )
Tan
TAN( )
Returns the character data converted from numeric
data
Deletes a specified length of characters and inserts
another set of characters at a specified starting
point
Returns the Nth 'sub-field' from a string where the
fields are delimited by commas
Returns the Nth 'sub-field' from a string where the
fields are delimited by the specified delimiter
(default is comma)
Returns part of a string beginning at the specified
start position to the end of the string
Returns part of a string beginning at the specified
start position and continuing for the specified
length
Returns the tangent of the input expression
Today
TODAY()
Returns the current date
Upper
UPPER( )
Week
WEEK( )
Weekday
WEEKDAY( )
Returns a character expression with lowercase
character data converted to uppercase
Returns an integer expression representing the
week that the specified date falls in (1-53)
Returns 'Weekday' or 'Weekend'
WorkdaysBetween
Year
WORKDAYSBETWEEN( ,
date )
YEAR( )
YearsBetween
YEARSBETWEEN( , date )
YearsBetween
YEARSBETWEEN( , date, 1 )
ZipCode
ZIPCODE( )
Returns an integer representing the # of workdays
between 2 dates
Returns an integer that represents the year part of a
specified date
Returns an integer representing the # of years
between 2 dates
Returns an integer representing the absolute # of
years between 2 dates.
Returns a 5 character zipcode converted from string
or numeric data. Illegal values are output as text
Rev. 7/14
75
Rapid Insight
®
Veera™ - User Manual
Function Operators
Because functions have such a high priority they almost always require their parameters be in
parentheses to achieve the expected/correct result.
"ABS [A]" is the same as "ABS ([A])", but "ABS [A]*[B]" is not "ABS ( [A]*[B] )", but is "ABS([A])*[B]"
PRECEDENCE
SYMBOL
TYPE OF OPERATION
ASSOCIATIVELY
1
()
Expression
Left to right
Scalar Functions
Left to right
2
3
- ~ !
Unary
Right to left
4
* / % **
Multiplicative
Left to right
5
+ -
Additive
Left to right
6
<< >>
Bitwise shift
Left to right
7
< > <= >=
Relational
Left to right
8
= == <> != IS
Equality
Left to right
9
&
Bitwise-AND
Left to right
10
^
Bitwise-exclusive-OR
Left to right
11
|
Bitwise-OR (inclusive)
Left to right
12
BETWEEN
Logical-BETWEEN
Left to right
13
IN
Logical-IN
Left to right
14
LIKE
Logical-LIKE
Left to right
15
&& AND
Logical-AND
Left to right
16
|| OR
Logical-OR
Left to right
17
??
Null-Coalescing
Left to right
18
?:
Inline-If/Then
Left to right
19
,
List
Left to right
Rev. 7/14
76
Rapid Insight
®
Veera™ - User Manual
Date and Time Format Specifiers
Many functions require or allow certain formatting options to be specified.
SPECIFIER
DESCRIPTION
EXAMPLE
"d"
The day of the month, from 1 through 31.
6/1/2009 1:45:30 PM -> 1
"dd"
The day of the month, from 01 through 31.
6/1/2009 1:45:30 PM -> 01
"ddd"
The abbreviated name of the day of the week.
6/15/2009 1:45:30 PM -> Mon (en-US)
"dddd"
The full name of the day of the week.
6/15/2009 1:45:30 PM -> Monday (enUS)
"f"
The tenths of a second in a date and time value.
6/15/2009 13:45:30.617 -> 6
"ff"
The hundredths of a second in a date and time
value.
6/15/2009 13:45:30.617 -> 61
"fff"
The milliseconds in a date and time value.
6/15/2009 13:45:30.617 -> 617
"ffff"
The ten thousandths of a second in a date and
time value.
6/15/2009 13:45:30.6175 -> 6175
"fffff"
The hundred thousandths of a second in a date
and time value.
6/15/2009 13:45:30.61754 -> 61754
"ffffff"
The millionths of a second in a date and time
value.
6/15/2009 13:45:30.617542 -> 617542
"fffffff"
The ten millionths of a second in a date and time
value.
6/15/2009 13:45:30.6175425 -> 6175425
"F"
If non-zero, the tenths of a second in a date and
time value.
6/15/2009 13:45:30.617 -> 6
"FF"
If non-zero, the hundredths of a second in a date
and time value.
6/15/2009 13:45:30.617 -> 61
"FFF"
If non-zero, the milliseconds in a date and time
value.
6/15/2009 13:45:30.617 -> 617
"FFFF"
If non-zero, the ten thousandths of a second in a
date and time value.
6/1/2009 13:45:30.5275 -> 5275
"FFFFF"
If non-zero, the hundred thousandths of a second
in a date and time value.
6/15/2009 13:45:30.61754 -> 61754
"FFFFFF"
If non-zero, the millionths of a second in a date
and time value.
6/15/2009 13:45:30.617542 -> 617542
"FFFFFFF"
If non-zero, the ten millionths of a second in a
date and time value.
6/15/2009 13:45:30.6175425 -> 6175425
"g", "gg"
The period or era.
6/15/2009 1:45:30 PM -> A.D.
"h"
The hour, using a 12-hour clock from 1 to 12.
6/15/2009 1:45:30 AM -> 1
"hh"
The hour, using a 12-hour clock from 01 to 12.
6/15/2009 1:45:30 AM -> 01
"H"
The hour, using a 24-hour clock from 0 to 23.
6/15/2009 1:45:30 AM -> 1
"HH"
The hour, using a 24-hour clock from 00 to 23.
6/15/2009 1:45:30 AM -> 01
"K"
Time zone information.
6/15/2009 1:45:30 AM -07:00 --> -07:00
"m"
The minute, from 0 through 59.
6/15/2009 1:09:30 AM -> 9
Rev. 7/14
77
Rapid Insight
®
Veera™ - User Manual
"mm"
The minute, from 00 through 59.
6/15/2009 1:09:30 AM -> 09
"M"
The month, from 1 through 12.
6/15/2009 1:45:30 PM -> 6
"MM"
The month, from 01 through 12.
6/15/2009 1:45:30 PM -> 06
"MMM"
The abbreviated name of the month.
6/15/2009 1:45:30 PM -> Jun (en-US)
"MMMM"
The full name of the month.
6/15/2009 1:45:30 PM -> June (en-US)
"s"
The second, from 0 through 59.
6/15/2009 1:45:09 PM -> 9
"ss"
The second, from 00 through 59.
6/15/2009 1:45:09 PM -> 09
"t"
The first character of the AM/PM designator.
6/15/2009 1:45:30 PM -> P (en-US)
"tt"
The AM/PM designator.
6/15/2009 1:45:30 PM -> PM (en-US)
"y"
The year, from 0 to 99.
1/1/0001 12:00:00 AM -> 1
"yy"
The year, from 00 to 99.
1/1/0001 12:00:00 AM -> 01
"yyy"
The year, with a minimum of three digits.
1/1/0001 12:00:00 AM -> 001
"yyyy"
The year as a four-digit number.
1/1/0001 12:00:00 AM -> 0001
"yyyyy"
The year as a five-digit number.
1/1/0001 12:00:00 AM -> 00001
"z"
Hours offset from UTC, with no leading zeros.
6/15/2009 1:45:30 PM -07:00 -> -7
"zz"
Hours offset from UTC, with a leading zero for a
single-digit value.
6/15/2009 1:45:30 PM -07:00 -> -07
"zzz"
Hours and minutes offset from UTC.
6/15/2009 1:45:30 PM -07:00 -> -07:00
":"
The time separator.
6/15/2009 1:45:30 PM -> : (en-US)
"/"
The date separator.
6/15/2009 1:45:30 PM -> / (en-US)
Rev. 7/14
78
Rapid Insight
®
Veera™ - User Manual
Special Parameters
This section documents unique parameters that do not fit neatly into other categories yet expand the
user’s abilities and contribute to the utility of the program.
SYMBOL
TYPE
BEHAVIOR
DESCRIPTION
When an asterisk is used as a formula parameter,
it acts as a wildcard.
*
Parameter
Wildcard
COMBINE INPUTS Table Pattern Example:
Enrollment Data*.*
Selects all files, regardless of type, that start with
the characters ”Enrollment Data”.
When the function is used as a formula
parameter, it acts as a wildcard with features
beyond those of an asterisk.
Regex:
Functional
Parameter
Wildcard
COMBINE INPUTS Table Pattern Example:
Regex:CX..\.xls.*\.*$
Selects all worksheets from all Excel (.xls) files that
start with the characters ”CX” followed by exactly
two characters.
[_]
Parameter
Lag
When an underscore in square brackets is used as
a formula parameter, it applies the value of the
previous record. Typically used in conjunction with
the ISNULL function to avoid problems with the
first record in the dataset.
TRANSFORM Multi-variable Example:
IF( [_] IS NULL, 100, [_] + 1 )
Creates an incrementing series in the new column
starting at 100.
Contact Us
For any issues/questions about Rapid Insight® Veera, please send an email to RI Support at
[email protected]
Rev. 7/14