1
Notat
mvd, 19 November 2009
PX-Map2 User Manual
2
Table of Contents
1
PX-MAP2 - INTRODUCTION ................................................................................................................... 5
1.1
1.2
1.3
2
LAUNCHING PX-MAP2............................................................................................................................... 8
2.1
2.2
2.3
3
WHAT PX-MAP2 IS AND WHAT IT IS NOT .................................................................................................. 5
HISTORY ................................................................................................................................................... 5
WHY USING PX-MAP2.............................................................................................................................. 5
AS A STANDALONE PROGRAM ................................................................................................................... 8
FROM PC-AXIS ......................................................................................................................................... 8
FROM EXCEL ............................................................................................................................................ 8
MAKING MAPS............................................................................................................................................. 9
3.1
GENERAL .................................................................................................................................................. 9
3.2
COLOUR PICKER........................................................................................................................................ 9
3.3
CHOROPLETH MAPS ................................................................................................................................ 10
3.4
SYMBOL MAPS ........................................................................................................................................ 11
3.5
STATISTICS ............................................................................................................................................. 13
3.6
CONFIGURATION ..................................................................................................................................... 13
3.6.1 Of choropleth map............................................................................................................................. 13
3.6.2 Of symbol map................................................................................................................................... 16
3.7
HELP ....................................................................................................................................................... 16
4
FUNCTIONALITIES IN PX-MAP2........................................................................................................... 17
4.1
4.2
4.3
5
TIPS &TRICKS............................................................................................................................................ 19
5.1
5.2
5.3
6
ZOOM IN, ZOOM OUT AND PAN ................................................................................................................ 17
COPYING AN SVG PICTURE TO WORD, POWERPOINT ETC....................................................................... 18
PRINT FUNCTIONALITY ........................................................................................................................... 18
AVOIDING WARNING MESSAGE IN MICROSOFT INTERNET EXPLORER .................................................... 19
SYMBOL MAP OR CHOROPLETH MAP – WHEN THE ONE AND WHEN THE OTHER?...................................... 20
USEFUL LINKS......................................................................................................................................... 21
SUPER USER’S GUIDANCE ..................................................................................................................... 21
6.1
SYSTEM REQUIREMENTS FOR PX-MAP2................................................................................................. 21
6.2
SYSTEM REQUIREMENTS FOR THE CLIENT (LOCAL PC) .......................................................................... 22
6.2.1 Different browsers ............................................................................................................................. 22
6.2.2 Microsoft Internet Explorer............................................................................................................... 22
6.2.3 Mozilla Firefox 2.0+ ......................................................................................................................... 22
6.3
NO INSTALLATION OF PX-MAP2 REQUIRED ............................................................................................ 22
6.4
ADAPTATIONS FOR WEB SERVER ............................................................................................................ 22
6.5
ADAPTATIONS FOR PX-WEB .................................................................................................................. 23
6.6
ADAPTATIONS FOR PC-AXIS................................................................................................................... 23
6.7
ADAPTATION OF CONFIG.XML FILE ......................................................................................................... 24
6.7.1 General.............................................................................................................................................. 24
6.7.2 Setting primary, secondary and default languages............................................................................ 24
6.7.3 Setting default classification type ...................................................................................................... 24
6.7.4 Setting minimum, default and maximum number of divisions (classifications) ................................. 24
6.8
ADAPTATION OF LANGUAGE.XML FILE ................................................................................................... 25
6.8.1 General.............................................................................................................................................. 25
6.8.2 How to delete an existing language: ................................................................................................. 25
6.8.3 How to add a new language: ............................................................................................................. 25
6.9
CHANGING THE LAYOUT OF PX-MAP2 ................................................................................................... 27
6.10
INSTALLING AND CONFIGURING THE EXCEL-MACRO .............................................................................. 28
7
STATISTICAL DATA REQUIREMENTS ............................................................................................... 30
7.1
7.2
PC-AXIS FILE FORMAT (.PX ) .................................................................................................................. 30
TEXT FORMAT - CHARACTER SEPARATED (.TXT, .CSV, … ) .................................................................... 31
3
7.3
8
BASIC MAP DATA REQUIREMENTS .................................................................................................... 33
8.1
8.2
8.3
9
EXCEL FORMAT....................................................................................................................................... 31
PREPARING SVG MAPS ........................................................................................................................... 33
SHAPE FILE REQUIREMENTS .................................................................................................................... 34
RUNNING THE PROGRAMS ( TRANSFORMATION FROM SHAPE TO SVG ) .................................................. 35
KNOWN BUGS ............................................................................................................................................ 38
9.1
9.2
GENERAL ................................................................................................................................................ 38
PX-MAP2 ............................................................................................................................................... 38
10
ACKNOWLEDGEMENTS..................................................................................................................... 38
11
DOWNLOADS AND CONTACTS......................................................................................................... 39
Table of Figures
Figure
Figure
Figure
Figure
Figure
Figure
Figure
Figure
Figure
Figure
Figure
Figure
Figure
Figure
Figure
Figure
Figure
Figure
Figure
Figure
Figure
Figure
Figure
Figure
Figure
Figure
Figure
Figure
Figure
Figure
Figure
Figure
Figure
Figure
Figure
1 Chorpleth map illustrating the figures in the grey-dotted column in Figure 2.......................... 6
2 Regional statistics for detached houses in Norway. Counties.................................................... 6
3 Symbol map with bars illustrating the figures in red- and blue-marked columns in Figure 2.. 7
4 PX-Map2 as a standalone program ............................................................................................ 8
5 File Open.................................................................................................................................... 8
6 Colour picker ............................................................................................................................. 9
7 Example of a default map made from a PC-Axis file .............................................................. 10
8 Dynamic viewing of variables ................................................................................................. 11
9 Symbol map with circles.......................................................................................................... 12
10 Symbol map with pies............................................................................................................ 12
11 Statistics - example ............................................................................................................... 13
12 Configuration of choropleth map........................................................................................... 13
13 Type of map ........................................................................................................................... 14
14 Highlight method ................................................................................................................... 14
15 Highlight colour ..................................................................................................................... 14
16 Show No Data and No Data colour........................................................................................ 14
17 Divisions ................................................................................................................................ 14
18 Classification type.................................................................................................................. 15
19 Colour scale type.................................................................................................................... 15
20 One-scale colour bar .............................................................................................................. 15
21 Two-scale colour bar.............................................................................................................. 15
22 Start values for the different classes ...................................................................................... 15
23 Configuration of symbol map ................................................................................................ 16
24 Extending Help text ............................................................................................................... 17
25 Functionalities in Adobe SVG Reader................................................................................... 18
26 Preview of print functionality in IE (Norwegian version) ..................................................... 19
27 Internet Alternatives............................................................................................................... 20
28 Ex. of a classification (phenomena) that sums up to a total (100 per cent) shown in pies..... 21
29 Ex. of a time series classification shown in bar charts........................................................... 21
30 Catalogue structure required for PX-Map2............................................................................ 22
31 PX-Map2 (named PX-MapWeb2) in the PX-Web structure ................................................. 23
32 PX-Map2 button in the PC-Axis menu .................................................................................. 24
33 CSS files and their relation to the user interface.................................................................... 27
34 Section from CSS file ............................................................................................................ 27
35 Excel – message box “Could not find path to PX-Map2” ..................................................... 28
4
Figure
Figure
Figure
Figure
Figure
Figure
Figure
Figure
Figure
Figure
Figure
Figure
Figure
Figure
Figure
Figure
Figure
Figure
Figure
Figure
36 Excel - Toolbar for PX-Map ................................................................................................. 28
37 Checking the CountryCode in Excel. 47 is Norwegian ........................................................ 29
38 Example of Dialog.ini file...................................................................................................... 29
39 Example of a semicolon separated text file valid for PX-Map2 ............................................ 31
40 Excel – dialog box asking for the basic map ......................................................................... 32
41 Excel – dialog box requiring the data range .......................................................................... 32
42 Excel – dialog box requiring the row number of column titles.............................................. 33
43 Excel – example of error message ......................................................................................... 33
44 Dataflow for transforming shape files to SVG file ................................................................ 35
45 Running ogis2svg.exe from the Command prompt - syntax................................................ 35
46 Running ogis2svg.exe from the Command prompt - example ............................................. 36
47 Dialogs when running ogis2svg.exe ...................................................................................... 36
48 Dialog-entry for Transform.exe ............................................................................................. 37
49 Dialog-entry for Transform.exe - example ............................................................................ 37
50 Saving the temp.svg ............................................................................................................... 38
51 PX-Map homepage ................................................................................................................ 39
52 Temp.svg - example............................................................................................................... 40
53 Example of a ready-to-use svg-file ........................................................................................ 41
54 Example from a Language.xml file........................................................................................ 42
55 Example of a config.xml file.................................................................................................. 44
Table of Appendices
APPENDIX A
- TEMP.SVG ........................................................................................................................... 40
APPENDIX B
- <FILENAME>.SVG............................................................................................................. 41
APPENDIX C
- LANGUAGE.XML............................................................................................................... 42
APPENDIX D
- CONFIG.XML...................................................................................................................... 43
5
1 PX-Map2 - introduction
1.1 What PX-Map2 is and what it is not
PX-Map2 is a tool for presenting statistical data.
PX-Map2 is not a tool for analysing statistical data.
By using PX-Map2 “analyses” happens in the user’s brain while viewing maps and other graphics.
1.2 History
In recent years Statistics Norway, in line with the majority of National Statistical Institutes, has
increased the use of thematic maps and other graphic means in different ways of disseminating
statistics. The demand for thematic maps was increasing, and Statistics Norway decided to develop inhouse systems for production of thematic maps when no off-the-shelf products were considered
satisfactory due to price/performance, complexity of user-interface and interfaces with statistical
data/statistical databases
PX-Map is one of the contributions to the PC-Axis Family from Statistics Norway. The former versions
of PX-Map were developed in 2 different developing environments. PX-Map 1.x – the Windows
version - was developed in Visual Basic, and PX-iMap - the Web version - was developed in ASP.
When further developments were demanded, Statistics Norway decided to freeze the existing PX-Map
modules and start from scratch, developing source code that easily could be utilized for both Windows
environment and Web environment. The choice of development technology and tools were .Net, C# and
Java Scripts (js). Another important change was replacing ESRI shape file format for basic map data
with the format Scalable Vector Graphic (SVG).
PX-Map2, as the previous versions of PX-Map, supports PC-Axis file format as well as character
separated text files for the statistical input data.
1.3 Why using PX-Map2
PX-Map2 gives an instant and visualized overview of your statistical data. The thematic maps, the data
distribution view and bar charts are easy, and not least efficient, ways to communicate a message to
people. It is intuitive reading a thematic map compared to “reading a table of figures” see Figure 1,
Figure 2 and Figure 3.
6
Figure 1 Chorpleth map illustrating the figures in the grey-dotted column in Figure 2
Figure 2 Regional statistics for detached houses in Norway. Counties.
7
Figure 3 Symbol map with bars illustrating the figures in red- and blue-marked columns in Figure 2
PX-Map2 provides functionalities that give several possibilities to visualize subsets of your dataset in
different ways. Some of them are:
several variables in one dataset
symbol maps with pies
symbol maps with charts
symbol maps with circles in different colours for negative and positive figures
tool tips in symbol maps
choropleth maps with 2 colour scales round a user defined threshold value
scrolling a variable produces “fake” animation
pointing to a region in the map highlights the corresponding bar in the Data Distribution
View and opposite: the corresponding region is highlighted when pointing to a bar in the
Data Distribution View
end user settings of colours are stored in Cookies
8
2 Launching PX-Map2
Make sure that your system is set up ready to run PX-Map2 – see Chapter 6.
2.1 As a standalone program
Look up PxMap2.exe in the Catalogue “PxMap2” in your Windows explorer.
Double-click on PxMap2.exe.
You get the following picture on your screen:
Figure 4 PX-Map2 as a standalone program
Point to File and then Open … (see Figure 5)
Figure 5 File Open...
An Open Dialog Box appears and shows the same directories and files as in Figure 30 . Go to the
pxdata catalogue. Select the file containing the Statistical data you want to visualize in PX-Map2. This
file has to be a PC-Axis file (.px) or a character separated text-file – see Chapter 7 for details of
statistical data requirements.
Opening the file results in a choropleth map on your screen. The map’s default attributes (colour,
language, type of classification etc) are based on the settings in the Configuration file (config.xml) of
PX-Map2. These settings can be changed – see Chapter 6.7 for adaptation of the Config.xml file.
2.2 From PC-Axis
Launch PX-Map by pressing the
button in PC-Axis. In advance make sure that your PC-Axis
installation is set up ready to run PX-Map2, for details see Chapter 6.6.
IMPORTANT - the MAP keyword is required in the PC-Axis files, and its value has to be the name of
the SVG file representing the basic map. Ex. if your PC-Axis file contains municipality data, the SVG
file has to contain the coordinates for the relevant municipalities. See chapter 8 for more information
about map requirements.
2.3 From Excel
To launch PX-Map2 from an excel spreadsheet requires a macro installed in advance. See chapter 6.10
for details.
9
After installing the macro the button
is visible on the standard toolbar. When clicking the button
some dialog boxes are displayed before PX-Map2 is launched.
3 Making maps
3.1 General
To decide what kind of map (choropleth or symbol) that best suits your data see chapter 5.2 for
information.
The default map type is choropleth (can be changed in the Config.xml file see Chapter 6.7).
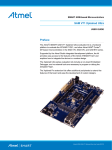
The colour picker in PX-Map2 is a simplified version of the original colour picker made by Kevin
Hughes – see chapter 5.3 for link to the original colour picker.
3.2 Colour picker
The colour picker works in the same way for choropleth and symbol maps.
Colour
Info.
Area
Colour
Wheel
Selected
Colour
in the
middle
Colour
Wheel
Toggle
RGB
Scrollbars
Figure 6 Colour picker
“The most noticeable thing about the Color Picker is the color wheel. You can click on the
rainbow-ish area of the wheel to select a color, or click and drag the color wheel arm to
choose a color. Your selected color will appear in the center. The color wheel toggle initially
looks like a minus sign at the bottom left corner of the color wheel. Click it to hide the outside
"rainbow" part of the color wheel, and click the toggle again to show it. At top is the color
10
information area. Your selected color will appear as RGB values, hexadecimal (Web) values,
and CMYK values. You can select, copy, and paste these values as needed into other
applications.”
“The saturation and brightness scrollbars allow you to change the saturation and brightness
(aka value) of the selected color. You can drag the scrollbar widgets or click anywhere within
the scrollbars to change color. In the same manner, you can select colors by using the red,
green, and blue (RGB) scrollbars”
Another way of selecting colour:
”Click within the sliders and the color wheel near a gray tick mark to snap to that value. The
color wheel has tick marks every 30 degrees. The saturation and brightness sliders have quarter
and third marks and marks at 10, 20, 80, and 90 percent. The RGB sliders have marks at 50
percent and every 20 percent which snap to Web safe colors.”
The quoted text is copied from http://www.kevcom.com/colorpicker/.
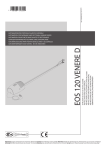
3.3 Choropleth maps
Figure 7 Example of a default map made from a PC-Axis file
11
Figure 8 Dynamic viewing of variables
Pointing in the map highlights the actual polygon (region - ex. country, county, municipality, ..) and the
corresponding bar in the data distribution view (bar chart). In the example in Figure 8 the mouse
pointer has been moved over Brazil.
When scrolling the drop-down-lists the map, the bar chart and the legend change dynamically.
3.4 Symbol maps
PX-Map2 provides 3 types of symbol maps - circles, pies and bar charts. See chapter 5.2 for
recommendations for use of the different symbol types.
12
Figure 9 Symbol map with circles
Figure 10 Symbol map with pies
13
3.5 Statistics
Figure 11 Statistics - example
The statistic figures change dynamically when scrolling the drop-down-lists.
3.6 Configuration
3.6.1
Of choropleth map
A
B
C
D
E
F
G
H
Figure 12 Configuration of choropleth map
A - Type of map
14
Figure 13 Type of map
Be sure to have selected relevant type of map before manipulating the settings
B – High light method
Figure 14 Highlight method
The highlight method tells how the selected polygon (region) in the choropleth map should be coloured,
either filling the polygon with the highlight colour or only outline the polygon with the highlight colour.
C – High light colour
Figure 15 Highlight colour
The highlight colour can be changed by selecting the desired value in the colour picker (see chapter 3.2)
and click the Highlightcolor field.
D – Show No data
Figure 16 Show No Data and No Data colour
The Show No Data box must be ticked if polygons (regions) without values should be shown. These
polygons will then be shown in the colour selected in the No Data colour field, see chapter 3.2 for
selection of colours.
Untick the Show No Data box if polygons without data not should be shown.
E – Divisions, classification type and colour scale type
Figure 17 Divisions
Could be a number between 2 and 9
15
Figure 18 Classification type
PX-Map2 provides 2 statistical classification types – i.e. quantile classification and equal intervals. In
addition it is possible to set limit value for each class (userdefined).
Figure 19 Colour scale type
When Colorscale is selected a one-scale colour bar is displayed (see Figure 20). This colour bar can be
modified by clicking the first and/or last colour with the selected colour. The colours between are
generated automatically.
When Tresholdscale is selected a two-scale colour bar is displayed ( see Figure 21)
F – Colour bar
Figure 20 One-scale colour bar
Figure 21 Two-scale colour bar
G – Start values
Figure 22 Start values for the different classes
The start values are automated generated for equal intervals and quantile intervals. You can set your
own start values if you choose Userdefined classification type.
H – Set colours to default values
Click the button to set colours to default values.
16
3.6.2
Of symbol map
A
C
B
D
E
Figure 23 Configuration of symbol map
A – Type of map - symbol.
B – Symbol coverage percent. This percentage is the total area of all symbols in proportion to the total
area of the map polygons.
C
– Circle symbol color. The end user can choose different colours for circles representing negative
and positive figures.
D – Symbol colors.
Clear out colorpalette – Reset the colours.
These colours are for other symbols than circles.
The colour palette can be customized by the user. One can keep and modify a working set of colors.
Click once on an empty (or filled) square to fill that space with the selected color. These colours are
stored in a cookie on the computer.
E
– Set colors to default values. The default values are set, but can be modified in the Config.xml file.
It is the item id = “Colorpalette” that “holds” the default values which are defined by RGB values.
3.7
Help
The text in the Help pane is all written in the Language.xml (see chapter 6.8).
There is an own section in the Language.xml for the help text, see below:
<Section>
<Description>Help-section</Description>
<Phrase id="HelpSVGGeneral">
17
<Translation lang="en"> Press the right mousebutton for General SVG-functionality </Translation>
<Translation lang="nb-NO"> Press høyre museknapp for generell SVG-funksjonalitet </Translation>
<Translation lang="nn-NO"> Press høyre museknapp for generell SVG-funksjonalitet </Translation>
</Phrase>
<Phrase id="HelpSVGZoomIn">
<Translation lang="en">Zoom In - Press the Ctrl-key while clicking the left mouse-button and dragging the mouse-pointer to area of interest </Translation>
<Translation lang="nb-NO">Zoome inn - hold CTRL-knappen inne mens venstre museknapp holdes nede og dra musepeker til ønsket område </Translation>
<Translation lang="nn-NO">Zoome inn - hold CTRL-knappen inne mens venstre museknapp holdes nede og dra musepeker til ønsket område</Translation>
</Phrase>
<Phrase id="HelpSVGZoomOut">
<Translation lang="en">Zoom Out - Press the Ctrl-key and the Shift-key at the same time and click the left mouse-button </Translation>
<Translation lang="nb-NO">Zoome ut - hold CTRL-knappen og Shift-knsppen inne samtidig og klikk venstre museknapp </Translation>
<Translation lang="nn-NO">Zoome ut - hold CTRL-knappen og Shift-knsppen inne samtidig og klikk venstre museknapp </Translation>
</Phrase>
<Phrase id="HelpSVGPan">
<Translation lang="en">Pan - Press the Alt-key and the left mouse-button while dragging the mouse-pointer </Translation>
<Translation lang="nb-NO">Panorere - hold Alt-knappen inne og venstre muse-knapp mens musepeker flyttes </Translation>
<Translation lang="nn-NO">Panorere - hold Alt-knappen inne og venstre muse-knapp mens musepeker flyttes </Translation>
</Phrase>
<Phrase id="HelpSVGIdentityInMap">
<Translation lang="en">Identify a region in the map - mouseover a polygon shows the name of the selected region in the Region-field</Translation>
<Translation lang="nb-NO">Identifiser en region i kartet - pek med musa i kartet og regionens navn vises i regionsfeltet </Translation>
<Translation lang="nn-NO">Identifiser en region i kartet - pek med musa i kartet og regionens navn vises i regionsfeltet </Translation>
</Phrase>
<Phrase id="HelpSVGIdentityInHistogram">
<Translation lang="en">Identify a region by pointing in the Histogram </Translation>
<Translation lang="nb-NO">Identifiser en region i kartet ved å peke i datafordelingen </Translation>
<Translation lang="nn-NO">Identifiser en region i kartet ved å peke i datafordelingen </Translation>
</Phrase>
<Phrase id="HelpSVGColourPicker">
<Translation lang="en">Change colours: Point and move in the colour-wheel - the selected colour is shown in the middle of the wheel. To use this colour - just
point and click in the field you want to change colour</Translation>
<Translation lang="nb-NO">Forandre farger: Pek og roter i fargehjulet. Den valgte fargen vises i midten. For å benytte denne fargen, pek og klikk i det feltet du
ønsker å endre farge. </Translation>
<Translation lang="nn-NO">Endre farger: Pek og roter i fargehjulet. Den valgte fargen vises i midten. For å benytte denne fargen, pek og klikk i det feltet du
ønsker å endre farge.</Translation>
</Phrase>
</Section>
More informative text can be added within any of the Phrase paragraphs. Example, see Figure 24.
<Phrase id="HelpSVGGeneral">
<Translation lang="en"> Press the right mousebutton for General SVG-functionality. Here you can write anything you want, but it is a good idea if it has something to do with
the use of the Norwegian map module PX-Map2. Good Luck </Translation>
</Phrase>
Figure 24 Extending Help text
4 Functionalities in PX-Map2
4.1 Zoom in, zoom out and pan
It is possible to zoom in, zoom out and pan in all SVGs in PX-Map2. The map picture and the data
distribution view are separated SVGs.
The way to zoom and pan depends on the SVG functionality supported by your browser. Using Adobe
Reader in Microsoft Internet Explorer the SVG functionalities are viewed and can be selected by rightclicking in the SVG. Examples, see Figure 25.
18
Figure 25 Functionalities in Adobe SVG Reader
4.2 Copying an SVG picture to Word, Powerpoint etc.
Select Copy SVG see Figure 25.
Open a document in Word, Powerpoint or similar.
Select Edit and Paste special and picture.
4.3 Print functionality
The PX-Map2 preview and print functionalities make use of the corresponding functionalities in the
current browser.
When using Microsoft Internet Explorer (IE) , the direction of the print-out must be set to landscape to
get all the screen content printed.
Use of Microsoft Internet Explorer (IE) and the preview functionality is shown in the example below.
19
Figure 26 Preview of print functionality in IE (Norwegian version)
5 Tips &Tricks
5.1 Avoiding Warning message in Microsoft Internet Explorer
Depending on the security level on your computer, a warning message can be shown when running
SVG applications in Microsoft Internet Explorer (IE).
This message seems very annoying, and to avoid the message it is possible to change the security level:
In the IE menu select:
Tools - Internet Options – Advanced
Tick off "Allow active content to run in files on My Computer” (see Figure 27)
BE AWARE that this permission may cause opening of a security hole in IE, especially if the computer
is directly connected to Internet.
20
Figure 27 Internet Alternatives
5.2
Symbol map or choropleth map – when the one and when the other?
A rule of thumb is to choose choropleth maps for relative numbers (ex. percentages, per thousand
inhabitants) and symbol maps for absolute numbers (i.e. exact figures for the variables).
For symbol maps not all symbols are suited for all kind of data.
Pies are suitable for classifications that make a total (100 per cent of a phenomena - ex. gender
(male and female)).
Pies are NOT suitable for time series.
Bar charts are suitable for time series, but can be used for other purposes as well.
21
Figure 28 Ex. of a classification (phenomena) that sums up to a total (100 per cent) shown in pies
Figure 29 Ex. of a time series classification shown in bar charts
5.3 Useful links
http://www.w3.org/Graphics/SVG/
- this site provides all kind of SVG-related information.
http://www.kevcom.com/colorpicker/
- the homepage of the colour picker used in PX-Map2.
http://www.pc-axis.scb.se/
- this is the homepage for PC-Axis (also including links to other
PX-modules )
6 Super User’s Guidance
6.1 System Requirements for PX-Map2
Microsoft .NET Framework Version 2.0 must be installed on the machine dedicated for PX-Map2.
The machine can be a local PC or a Web Server.
The need for a separate installation or not of Microsoft .NET Framework Version 2.0 depends on your
Operation System (OS). For example: the framework is embedded in Windows XP.
The Framework is free of charge and can be downloaded from http://www.microsoft.com/downloads.
22
6.2 System Requirements for the Client (local PC)
6.2.1 Different browsers
PX-Map2 supports two different browsers, Microsoft Internet Explorer and Mozilla Firefox. To run
PX-Map2 properly the program needs to know the current browser.
The default browser can be set in the configuration file, see Chapter 6.7
6.2.2
Microsoft Internet Explorer
Microsoft Internet Explorer (IE) 6.0 +
Adobe SVG Reader
Microsoft IE does not have native SVG support thus Adobe SVG Reader must be installed on the
Client.
Adobe SVG Reader is free of charge and can be downloaded from
http://www.adobe.com/svg/viewer/install
6.2.3 Mozilla Firefox 2.0+
Firefox 2.0+ has native SVG-support i.e. no SVG-plugin is required.
6.3
No installation of PX-Map2 required
Unpack the zip-file and run the program pxmap2.exe stored in the main directory named PxMap2.
PX-Map2 to requires the directory structure illustrated in Figure 30 to run properly.
Figure 30 Catalogue structure required for PX-Map2
PxMap2.exe and PxMapLib2.dll has to be stored in the main directory.
6.4 Adaptations for Web server
The bin catalogue and the files NoSvgSupport,htm, PxMapWeb.aspx, PxMapWeb.aspx.cs,
PxMapWebStart.aspx PxMapWebStart.aspx.cs are only used by the WEB solution.
.NET 2.0 Framework must be installed on the web server
Unpack the PX-Map2 zip-file to a catalogue (physical) on the web server
23
Map the virtual catalogue on IIS (Internet Information server) to the physical catalogue
(PxMap2)
6.5 Adaptations for PX-Web
For download and information about PX-Web -
- go to http://www.pc-axis.scb.se/ .
Do the adaptations as 6.4 and place the folder under PX-Web.
Figure 31 PX-Map2 (named PX-MapWeb2) in the PX-Web structure
Create a folder for temporary files under PxMapWeb2, called for instance pxtemp. Give write
permission to this folder.
In Global1.asp in PX-Web dialog/includes make the change
mapversion=2
Outputmap="../PxMapWeb2/pxtemp"
PX-Map starts with PxMapWeb.aspx.
6.6 Adaptations for PC-Axis
The .ini file pcax2000.ini must be adapted if PX-Map2 should be launched from PC-Axis.
The pcax2000.ini is located in the WINDOWS catalogue on your local disc.
Open the .ini file in a text editor (ex. Notepad) and change the [PXMAP] part to:
Pgm=<program path>
Pathtxt=<temp directory path>
Example from the pcax2000.ini file in Statistics Norway:
24
…
[PXMAP]
Pgm=C:\Programfiles\PxMap2\PXMap2.exe
Pathtxt=C:\temp
…
Figure 32 PX-Map2 button in the PC-Axis menu
6.7 Adaptation of Config.xml file
6.7.1 General
The Config.xml file contains all default attributes for the controls in PX-Map2. These attributes are
among others language, colours, classification type, Number of classifications, font types and font sizes.
If an end-user changes colours when running PX-Map2 this will NOT affect the config.xml file. This
kind of change is stored in a cookie on the client.
For editing XML-files it is recommended to use an XML-editor (ex. XMLSpy), but a traditional text
editor like Notepad can be used as well.
An example of a Config.xml file is shown in Appendix D.
The config.xml is more or less self-describing, thus only some specific attributes are explained in this
document – for more details see Chapter 11.
6.7.2
Setting primary, secondary and default languages
<Item id="LanguagePrimary">en</Item>
<Item id="LanguageSecondary">nb-NO</Item>
<Item id="LanguageDefault">en</Item>
For the time being it is only the default language (<Item id="LanguageDefault">XX</Item>) that is in use. XX can
be language code for any language.
Check that the language code in the config.xml file is consistent with the language code in the
language.xml file.
6.7.3 Setting default classification type
<Item id="ClassificationTypeDefault">XX</Item>
This setting is reserved for future use.
6.7.4
Setting minimum, default and maximum number of divisions (classifications)
<Item id="DivisionsMinimum">N</Item>
<Item id="DivisionsDefault">N</Item>
<Item id="DivisionsMaximum">N</Item>
These settings are reserved for future use.
25
6.8 Adaptation of Language.xml file
6.8.1 General
PX-Map2 supports unlimited number of languages. Adding a new language or updating existing
language in PX-Map2 is done by editing the language.xml file. This file is located in the Language
catalogue, see Figure 30.
For editing XML-files it is recommended to use an XML-editor (ex. XMLSpy), but a traditional text
editor like Notepad can be used.
As default the Language.xml file consists of English (“en”) and the two Norwegian official languages
(“nb-NO” and “nn-NO”), see Appendix C.
The language.xml file is built up of different sections. The only sections to be added/changed or deleted
are the Translation sections (ex. <Translation lang="nb-NO">Kart</Translation>).
IMPORTANT - do NOT delete the English Translations while this is the default language of PX-Map2.
6.8.2 How to delete an existing language:
For all Translation sections: delete all existing Translation sections for language(s) of no interest.
Example – deletion of the Norwegian languages:
- <Phrase id="Map">
<Translation lang="en">Map</Translation>
<Translation lang="nb-NO">Kart</Translation>
<Translation lang="nn-NO">Kart</Translation>
</Phrase>
After deletion:
- <Phrase id="Map">
<Translation lang="en">Map</Translation>
</Phrase>
6.8.3 How to add a new language:
For all Translation sections: copy and paste an existing Translation section.
Change “xx” in the lang=”xx” to your language code (ISO certified language codes are recommended)
and translate the text between the brackets > and < to your language.
Example – adding a new language (copy and paste):
- <Phrase id="Map">
<Translation lang="en">Map</Translation>
</Phrase>
After copy and paste:
- <Phrase id="Map">
<Translation lang="en">Map</Translation>
<Translation lang="en">Map</Translation>
</Phrase>
Adaptation to German for the phrase Map:
- <Phrase id="Map">
<Translation lang="en">Map</Translation>
<Translation lang="de">Karte</Translation>
26
</Phrase>
If the new language is desired as the default language for PX-Map2, the Config.xml file must be
updated, see Chapter 6.7.
27
6.9 Changing the layout of PX-Map2
Important: Edit the files with care! Tip: make copies of the files in advance.
It is possible to change the size and placement of the different modules in PX-Map2 layout. Both screen
and print layout may be changed. This is done by CSS, Cascading Style Sheets, and provides
possibilities for describing presentations. By altering values in layout.css and / or layout_print.css (both
files placed in the css folder under your PX-Map2 installation) the screen and / or print layout will be
changed.
Figure 33 shows examples of elements that can be modified, and their relation to the layout.css file.
Figure 33 CSS files and their relation to the user interface
The files layout.css and layout_print.css include comments to help finding the elements that are
adaptable.
The values possible to modify are written in brackets below the unique identity marker for each
different object in the user interface. For example, resizing the map is done by first finding the identity
#map, and then setting the desired values for the width and height attributes.
#map
{
position: absolute;
left: 1px;
top: 1px;
width: 600px;
height: 600px;
}
The values are
given in number of
pixels.
Figure 34 Section from CSS file
Some experience in CSS is recommended before doing any modifications. For more information about
CSS see http://www.w3.org/Style/CSS/.
28
6.10 Installing and configuring the Excel-macro
To run PX-Map2 from Excel it is required to install an Excel macro in advance. The macro is Install
PX-Map Excel.xlb and it looks up Registry for the path where PX-Map2 is stored on your computer.
The Registry is updated by PX-Map2 itself. That means PX-Map2 has to be launched at least once
before the xlb-macro can be activated. Unless the xlb-macro shows the message box in Figure 35.
Figure 35 Excel – message box “Could not find path to PX-Map2”
To install the macro double-click the file Install PX-Map Excel.xlb in the macro folder on your
PX-Map2 installation. The macro will be added to your Excel installation, and the file dialog.ini is
copied to your user catalogue, typical c:\Document and Settings\<yourname>\.
The macro creates a new toolbar called PX-MapExcel with the button
in Excel – see Figure 36.
Figure 36 Excel - Toolbar for PX-Map
As default two languages, Norwegian [47] and English [1] are supported in the system. The language
elements are defined in the file Dialog.ini mentioned above. It is possible to add other languages by
editing the dialog.ini file in a text editor (ex. Notepad). Copy and paste all elements under the English
language code [1], and translate to the language desired.
To find the language code for your Excel installation, do as follow:
Launch Excel
Press Alt + F11 (opens the Visual Basic environment)
Press Ctrl + g (opens the Immedialte window)
Write ?Application.International(xlCountryCode)
Press ENTER
Excel will answer with a number which is the language code you have to use in the dialog.ini file.
29
Figure 37 Checking the CountryCode in Excel. 47 is Norwegian
[1]
MenuText = PX-Map from Excel
DescText = Shows data in PX-Map
Folder1 = Choose the folder containing PX-MapExcel.xla
Folder2 = Check or choose your folder for Excel Addins
ToolTipText = PX-Map
Finished1 = The installation is finished.
Finished2 = You will find a new button at the right end of the Standard Toolbar,
Finished3 = and an option called 'PX-Map from Excel' in the 'Insert' menu, below the option 'Diagram'.
OpenSheet = You must have an open (and visible) worksheet containing data.
…
…
…
UF2lbl19 = (yellow typeface)
UF2chk1 = Let the macro add leading zero
UF2cmdOK = Continue
UF2cmdCancel = Cancel
[47]
MenuText = PX-Map kart
DescText = Viser data i PX-Map
Folder1 = Oppgi mappenavn, der filen PX-MapExcel.xla finnes
Folder2 = Kontroller, eventuelt oppgi din mappe for Excel-tillegg:
ToolTipText = PX-Map
Finished1 = Verktøy for visning av Exceltabell i PX-Map er installert.
Finished2 = Du skal finne en ny knapp lengst til høyre på Standardverktøylinja,
Finished3 = og et valg som heter 'PX-Map kart' på 'Sett inn'-menyen, nedenfor valget 'Diagram'.
OpenSheet = Du må ha et åpent (og synlig) regneark med data.
…
…
…
UF2lbl19 = (gul skrift)
UF2chk1 = La makroen legge til innledende 0
UF2cmdOK = Fortsett
UF2cmdCancel = Avbryt
Figure 38 Example of Dialog.ini file
30
7 Statistical data Requirements
7.1 PC-Axis file format (.px )
“The file format consists of optional and mandatory keywords: The mandatory keywords are illustrated
by this example:
MATRIX="BE001";
SUBJECT-CODE="BE";
SUBJECT-AREA="Population";
TITLE="Population by region, time, marital status and sex.";
STUB="region";
HEADING="time","marital status","sex";
VALUES("region")="Sweden","Stockholm","Örebro";
VALUES("time")="1990-12-31";
VALUES("marital status")="unmarried","married","total";
VALUES("sex")="men","women";
CONTENTS="Population";
UNITS="numbers of persons";
DECIMALS=0;
DATA=
2155484 1842207 1710484 1713821 4244017 4346613
167965 162184 110463 111697 316041 358411
28909 26791 23822 23982 58352 62592
The first records of the file contain metadata and consist of a key word followed by text within
quotation marks and a semicolon. Longer texts are divided into several records (except for value text or
variable names which must in one line when in parenteses after a keyword). Texts are delimited with
quotation marks which means that a text itself cannot contain a quotation mark.
If the keyword CHARSET is missing it means that all texts are in DOS text format, so that the same
files can be used both in the DOS and the Windows version of PC-AXIS. In the Windows version the
texts are translated into Windows format when read. When a file is saved in PC-AXIS file format it is
always saved in DOS text format in versions prior to 2000.
Starting with version 2000 the files can be either in DOS or Windows texts. If they are in Windows
texts this information is added: CHARSET=”ANSI”;
The keywords can be either mandatory, i.e. the file cannot be read in PC-AXIS if the key word is
missing, or optional, e.g. footnotes for tables.
Starting with version 2005 it is possible to have more than one language in a px file. The second
language is repeated for all necessary keywords. CONTENTS=”Population”;,
CONTENTS[sv]=”Befolkning”; etc. Which languages are available are given in the keyword
LANGUAGES.”
The text quoted is the introduction to the entire documentation of PC-Axis file format and can be found
at:
http://www.pc-axis.scb.se/TechDoc.asp
When a PC-Axis file is used as a basis for making maps in PX-Map, the keyword MAP is required. The
MAP keyword is used as a link to the basic map. The value is the name of the svg file that holds the
maps coordinates.
31
Example:
MAP("region")="Norway_municipality.svg";
Name of the svg file (the extension is optional)
7.2 Text format - character separated (.txt, .csv, … )
While PC-Axis files includes both data and metadata the text files valid for PX-Map2 include only data
in addition to the name of the basic map (the svg file) and headings for the different columns.
Figure 39 shows an example of a valid text file.
Norway_Municipality.svg
Mun_nr;Pop_density, number/km2; Pop 0-14 years per cent;Pop 15-64 years per cent;Pop 65 years and more per cent;Total Population;Area included lakes, km2
0101; 41,38; 18,4; 62,8; 18,8;26523;641
0104; 416,54; 17,6; 65,8; 16,6;26242;63
0105; 115,78; 18,0; 65,2; 16,8;47122;407
0106; 232,47; 18,1; 64,7; 17,2;67415;290
0111; 39,62; 18,2; 66,3; 15,5;3487;88
0118; 4,54; 18,9; 61,3; 19,8;1458;321
0119; 7,97; 17,5; 61,7; 20,8;3290;413
…
…
Figure 39 Example of a semicolon separated text file valid for PX-Map2
The first row refers to the SVG map “holding” the geographic data. The second row contains the header
names of the different columns with statistical data. All rows from the 3rd to the end are statistical
figures. The first column must always refer to the regions defined in your map. The regions could be
municipalities, counties or other geographical divisions.
7.3
Excel format
The spreadsheet must contain at least two columns with data. The first column has to include the
regions, and the following column(s) the statistical variable(s). The first row should contain the header
text of the region and the different variables. The following rows must contain the statistical figures.
When clicking the button
the macro opens a dialog box asking for a basic map from your PXMap2 installation see Figure 40.
32
Figure 40 Excel – dialog box asking for the basic map
After the map is chosen a new dialog box appears requiring the figures to be visualized in PX-Map.
Mark the area
containing the
actual data
Figure 41 Excel – dialog box requiring the data range
After the data range is marked, the macro highlights a row as a proposal for column titles – see Figure
42.
33
Figure 42 Excel – dialog box requiring the row number of column titles
If the proposed row is not the right one, then type the right row number.
The macro performs several checks of the parameters and data. If there are error(s) then error messages
are displayed – see Figure 43 for example of an error message.
Figure 43 Excel – example of error message
When no error, then PX-Map2 is launched, and a choropleth map is made immediately.
8 Basic Map data Requirements
8.1 Preparing SVG maps
PX-Map2 requires a valid SVG file as format for the basic map data. Due to the fact that a lot of users
have their map data stored in ESRI shape format Statistics Norway provides a routine for converting
shape files to valid SVG files.
34
8.2 Shape file requirements
To be able to make symbol maps in PX-Map2 the basic map data requires attributes for a label-point (xand y- coordinates) for each polygon (region). If this is lacking, PX-Map2 can not create symbol maps.
In addition to the coordinates, PX-Map2 needs the area attribute for each polygon. The area attribute is
used for calculating the total size of all symbols in the final map so the symbols will have an
appropriate size in proportion to map.
IMPORTANT – it is required that the x-coordinate attribute and the y-coordinate attribute MUST have
the names x_coord and y_coord respectively. Similarly the area attribute MUST have the name area.
Hint - you can find suitable scripts on http://arcscripts.esri.com/ that help calculating x_coord,
y_coord and area. Statistics Norway has used addxycoo.ave to generate the x_coord and y_coord and
Xtools to calculate area.
The program MapViewSVG (http://www.mapviewsvg.com ) is an extension for ArcGIS
8.x/9.x or ArcView GIS 3.x by ESRI. It provides the possibility to convert maps from ArcView
GIS / ArcGIS into SVG format.
The transformation routine provided by Statistics Norway includes 2 programs. The first one ogis2svg.exe (which uses the shp2pgsql.exe) - can be downloaded for free on
http://www.carto.net/papers/svg/utils/shp2svg/ . This program converts a shape file to an SVG file. The
second program - transform.exe - is made by Statistics Norway. Transform.exe adds some
functionality (defined in the style sheet svg2svg.xsl) to the final SVG file. These functionalities are
essential for PX-Map2 to work properly.
35
<filename>.svg
transform.exe
temp.svg
ogis2svg.exe
Valid SVG file for use in PX-Map2
svg2svg.xsl
Style sheet
Temporary SVG file without events
handling (mouse-over, mouse-out, etc)
shp2pgsql.exe
shape
ESRI shape-file
Figure 44 Dataflow for transforming shape files to SVG file
8.3 Running the programs ( transformation from shape to SVG )
ogis2svg.exe
The program ogis2svg.exe must be run from the command prompt on your computer.
IMPORTANT 1
- be sure that shp2pgsql.exe is stored in the same directory as ogis2svg.exe
Ogis2svg.exe is dependent of shp2pgsql.exe to run properly.
To see the syntax: Write the program-name + ENTER-key:
Figure 45 Running ogis2svg.exe from the Command prompt - syntax
The syntax is, as the example above shows:
>ogis2svg.exe --input yourinputShapeFile --output youroutput.svg --roundval 0.1 [--scale 25000]
[--inputunits m] [outputunits mm] [--referenceframe]
The mandatory parameters (without brackets) are the only used for PX-Map2:
36
>ogis2svg.exe --input yourinputShapeFile --output youroutput.svg --roundval 0.1
Figure 46 Running ogis2svg.exe from the Command prompt - example
In the example above yourinputShapeFile = Europe.shp and youroutput.svg = temp.svg
Click the ENTER-key and the program requests which attributes to be included in the SVG file.
IMPORTANT 2
- include ONLY the 4 attributes area, x_coord, y_coord and the attribute
that should be the unique SVG-ID (i.e. the attribute that is the link to your
statistical data. In the example below this attribute is iso_code)
Figure 47 Dialogs when running ogis2svg.exe
Transform.exe
Start the program transform.exe in Windows-environment (i.e. double-click in Windows
Explorer). the below screen-picture is shown.
37
Figure 48 Dialog-entry for Transform.exe
The Transformation parameters, the add-key and delete-key are not utilized for the time being.
The source file must be your temp.svg file. Select it by writing the filename and path in the field
or find it by using the Browse-button.
The Transformation file must be svg2svg.xsl. Select it by writing the filename and path in the
field or find it by using the Browse-button
Before starting the transformation your dialog-box should look like this:
Figure 49 Dialog-entry for Transform.exe - example
Press the Transform-button (a dialog-box, Save to file, appears)
Write the name of your output-file in the dialog-box
38
Figure 50 Saving the temp.svg
The transformation starts immediately after the save-key (“Lagre” in Norwegian) is pressed.
In the example above the output SVG file is named "europe", and the filename extension is automatic
set to .svg.
9 Known bugs
9.1 General
When using Microsoft Internet Explorer (IE) and Adobe SVG Reader, sometimes the spacebar or the
ENTER-key has to be pushed for some SVG controls to be activated. This problem is due to security in
IE and not to PX-Map2. To avoid this see Chapter 5.1.
9.2 PX-Map2
The PX-file needs both keywords STUB and HEADING for PX-Map2 to run properly.
Error in Config.xml when checking Registry for default browser.
Character separated files (ex. sdv-files) with blank cells (“no data”) are not read correctly by
PX-Map2.
10 Acknowledgements
Thanks to Kevin Hughes for his Color Picker.
39
11 Downloads and contacts
PX-Map2 and Transform exe (ShapeToSVG20061215.zip) can be downloaded from
www.ssb.no/pxmap .
Figure 51 PX-Map homepage
40
Appendix A
-
temp.svg
<?xml version="1.0" encoding="UTF-8"?>
<!DOCTYPE svg PUBLIC "-//W3C//DTD SVG 1.1//EN" "http://www.w3.org/Graphics/SVG/1.1/DTD/svg11.dtd" [
<!ATTLIST svg
xmlns:attrib CDATA #IMPLIED
>
<!ATTLIST path
attrib:area CDATA #IMPLIED
attrib:x_coord CDATA #IMPLIED
attrib:y_coord CDATA #IMPLIED
>
]>
<svg width="100%" height="100%" viewBox="-2935135.8 -11594886.7 9401027.9 7667897.5" xmlns="http://www.w3.org/2000/svg"
xmlns:xlink="http://www.w3.org/1999/xlink" xmlns:attrib="http://www.carto.net/attrib/">
<g id="temp" fill="none" stroke="black" stroke-width="4700.5" stroke-linecap="round" stroke-linejoin="round">
<path id="temp_AL" attrib:area="4.804e+010" attrib:x_coord="2242885.90079" attrib:y_coord="5026111.20700"
d="M2152532.9 -5135204l27259.4 -102382.8l68599.8 21256.9l25714.6 76784.5l59132.1 154889.6l0 7347.3l-72276.7 124068.5l-29651.9
38604.4l-68570.2 -123580.6l-10207.1 -196987.8z" />
<path id="temp_AD" attrib:area="461605662" attrib:x_coord="181618.14641" attrib:y_coord="5239118.28458"
d="M198297.4 -5247924.1l-3706.5 17611.7l-27798.7 -2514l-1853.3 -12579.9l33358.5 -2517.8z" />
…..
…..
<path id="temp_AT" attrib:area="1.800e+011" attrib:x_coord="1484451.46051" attrib:y_coord="6052656.03535"
d="M1352870.7 -5924559.6l-122314.1 18977.2l-66717 -8127.9l0 -2711.3l-87102.7 -29877.2l-9266.2 0l-2223.9 -9800.6l-5189 22910.3l3706.6 -43807.1l75414.7 19310.8l20954.2 5358l35211.6 -27414.2l94515.5 -5493.1l131580.7 0l33358.4 -16500.9l-12972.7 88544.1l96368.8 -92281.9l59682.4 34568.8l70045.1 -59911.3l177991.4 24774.4l62930.9 126161.2l-44477.9 55232.9l-11119.5 11004.1l46331.2 109278.1l-14826.2 13563.6l-111194.8 31116.5l-111194.8 31006.3l-44477.9 -8077.9l-172352.2 -64894.2z" />
</g>
</svg>
Figure 52 Temp.svg - example
The lines within the curly bracket should be identical for all temp.SVG files that are input to the
program transform.exe.
41
Appendix B
-
<filename>.svg
Example - europe.svg.
<?xml version="1.0" encoding="utf-8"?>
<?xml-stylesheet type="text/css" href="css/map.css"?>
<!DOCTYPE svg PUBLIC "-//W3C//DTD SVG 1.1//EN" "http://www.w3.org/Graphics/SVG/1.1/DTD/svg11.dtd" [
<!ATTLIST svg xmlns:attrib CDATA #IMPLIED >
<!ATTLIST path attrib:area CDATA #IMPLIED attrib:x_coord CDATA #IMPLIED attrib:y_coord CDATA #IMPLIED >
]>
<svg width="100%" height="100%" viewBox="-2935135.8 -11594886.7 9401027.9 7667897.5" preserveAspectRatio="xMidYMid meet"
zoomAndPan="magnify" onload="init( evt );" xmlns="http://www.w3.org/2000/svg" xmlns:xlink="http://www.w3.org/1999/xlink"
xmlns:attrib="http://www.carto.net/attrib/">
<metadata id="version">1.0</metadata>
<!--**** There are a lot of identifiers that start with a number. According to the XML-standard this is not allowed. The workaround is using a
textprefix-->
<metadata id="idprefix">ID_</metadata>
<metadata id="timeprefix">TIME_</metadata>
<script type="text/ecmascript" xlink:href="js/map.js"><!-- // empty // --></script>
<script type="text/ecmascript">
var map;
function init( evt ){
map = new Map( evt.target.ownerDocument );
if ( parent.registerMap ){
var type = parent.registerMap( map );
map.setType( type );
}
}
function mouseover( region_id ){
if ( map ){
map.onmouseover( region_id );
}
}
function mouseout( region_id ){
if ( map ){
map.onmouseout( region_id );
}
}
//
</script>
<!--**** The map title ***********************************-->
<title>TITLE</title>
<!--**** The map description **************************-->
<desc>DESCRIPTION</desc>
<g id="regions" stroke="black" stroke-width="4700.5" stroke-linecap="round" stroke-linejoin="round" fill="none">
<path id="ID_AD" attrib:area="461605662" attrib:x_coord="181618.14641" attrib:y_coord="5239118.28458"
onmouseover="mouseover('AD')" onmouseout="mouseout('AD')" d="M198297.4 -5247924.1l-3706.5 17611.7l-27798.7 -2514l-1853.3 12579.9l33358.5 -2517.8z" />
<path id="ID_AL" attrib:area="4.804e+010" attrib:x_coord="2242885.90079" attrib:y_coord="5026111.20700"
onmouseover="mouseover('AL')" onmouseout="mouseout('AL')" d="M2152532.9 -5135204l27259.4 -102382.8l68599.8 21256.9l25714.6
76784.5l59132.1 154889.6l0 7347.3l-72276.7 124068.5l-29651.9 38604.4l-68570.2 -123580.6l-10207.1 -196987.8z" />
…
…
…
Figure 53 Example of a ready-to-use svg-file
42
Appendix C
-
Language.xml
Example – some parts of language.xml.
<?xml version="1.0" encoding="UTF-8" ?>
- <Language version="1.0" xmlns:xsi="http://www.w3.org/2001/XMLSchema-instance" xsi:noNamespaceSchemaLocation="language.xsd">
- <Section>
<Description>Application phrases</Description>
- <Phrase id="Version">
<Translation lang="en">Version</Translation>
<Translation lang="nb-NO">Versjon</Translation>
<Translation lang="nn-NO">Versjon</Translation>
</Phrase>
</Section>
- <Section>
<Description>Statistics phrases</Description>
- <Phrase id="Statistics">
<Translation lang="en">Statistics</Translation>
<Translation lang="nb-NO">Statistikk</Translation>
<Translation lang="nn-NO">Statistikk</Translation>
</Phrase>
… continues
…
…
- <Phrase id="HelpSVGIdentityInMap">
<Translation lang="en">Identify a region in the map - mouseover a polygon shows the name of the selected region in the Regionfield</Translation>
<Translation lang="nb-NO">Identifiser en region i kartet - pek med musa i kartet og regionens navn vises i regionsfeltet</Translation>
<Translation lang="nn-NO">Identifiser en region i kartet - pek med musa i kartet og regionens navn vises i regionsfeltet</Translation>
</Phrase>
… continues
…
…
- <Phrase id="AlertWaitMessage">
<Translation lang="en">This might take a few seconds.</Translation>
<Translation lang="nb-NO">Dette kan ta flere sekunder.</Translation>
<Translation lang="nn-NO">Dette kan ta fleire sekund.</Translation>
</Phrase>
- <Phrase id="AlertAreaAttribMissing">
<Translation lang="en">Area attributes are missing. Symbols can not be created.</Translation>
<Translation lang="nb-NO">Areal attributter mangler i kart-svg. Symbol-kart kan ikke genereres.</Translation>
<Translation lang="nn-NO">Areal attributter manglar i kart-svg. Symbol-kart kan ikkje lagas.</Translation>
</Phrase>
</Section>
</Language>
Figure 54 Example from a Language.xml file
43
Appendix D
-
Config.xml
Example – config.xml adapted for Statistics Norway.
<?xml version="1.0" encoding="UTF-8" ?>
- <Config version="1.0" xmlns:xsi="http://www.w3.org/2001/XMLSchema-instance" xsi:noNamespaceSchemaLocation="config.xsd">
<Item id="LanguagePrimary">en</Item>
<Item id="LanguageSecondary">nb-NO</Item>
<Item id="LanguageDefault">en</Item>
<Item id="EmbedMapWidth">500</Item>
<Item id="EmbedMapHeight">600</Item>
<Item id="EmbedPieWidth">350</Item>
<Item id="EmbedPieHeight">500</Item>
<Item id="EmbedHistogramWidth">450</Item>
<Item id="EmbedHistogramHeight">300</Item>
<Item id="EmbedColorscaleWidth">400</Item>
<Item id="EmbedColorscaleHeight">210</Item>
<Item id="EmbedThresholdscaleWidth">400</Item>
<Item id="EmbedThresholdscaleHeight">450</Item>
<Item id="EmbedSingleColorWidth">400</Item>
<Item id="EmbedSingleColorHeight">100</Item>
<Item id="ClassificationTypeDefault">quantile</Item>
<Item id="DivisionsMinimum">3</Item>
<Item id="DivisionsDefault">5</Item>
<Item id="DivisionsMaximum">9</Item>
- <!-- Encodings: ASCII, ANSI, UTF7, UTF8, UNICODE or BIGENDIANUNICODE
-->
- <!-- The input-encoding.
-->
<Item id="DataFileEncoding">ANSI</Item>
- <!-- The output-encoding.
-->
<Item id="HtmlTemplateFileEncoding">UTF8</Item>
- <!-- Set to "SystemDefault" if default system web-browser should be used, or specify browser (e.g. "C:\Programfiles\Internet
Explorer\IEXPLORE.EXE").
-->
<Item id="DefaultWebBrowserPath">SystemDefault</Item>
<Item id="ColorScaleStart">rgb(255,240,224)</Item>
<Item id="ColorScaleEnd">rgb(153,0,0)</Item>
<Item id="ColorThresholdScaleNegativeStart">rgb(153,0,0)</Item>
<Item id="ColorThresholdScaleNegativeEnd">rgb(255,240,224)</Item>
<Item id="ColorThresholdScalePositiveStart">rgb(224,240,255)</Item>
<Item id="ColorThresholdScalePositiveEnd">rgb(0,102,102)</Item>
<Item id="ColorHighlight">rgb(255,237,77)</Item>
<Item id="ColorBlank">rgb(250,250,250)</Item>
<Item id="ThresholdValue">0</Item>
<Item id="ColorScaleStartR">255</Item>
<Item id="ColorScaleStartG">240</Item>
<Item id="ColorScaleStartB">224</Item>
<Item id="ColorScaleEndR">153</Item>
<Item id="ColorScaleEndG">0</Item>
<Item id="ColorScaleEndB">0</Item>
<Item id="ColorThresholdScaleNegativeStartR">153</Item>
<Item id="ColorThresholdScaleNegativeStartG">0</Item>
<Item id="ColorThresholdScaleNegativeStartB">0</Item>
<Item id="ColorThresholdScaleNegativeEndR">255</Item>
<Item id="ColorThresholdScaleNegativeEndG">240</Item>
<Item id="ColorThresholdScaleNegativeEndB">224</Item>
<Item id="ColorThresholdScalePositiveStartR">224</Item>
<Item id="ColorThresholdScalePositiveStartG">240</Item>
<Item id="ColorThresholdScalePositiveStartB">255</Item>
<Item id="ColorThresholdScalePositiveEndR">0</Item>
<Item id="ColorThresholdScalePositiveEndG">102</Item>
<Item id="ColorThresholdScalePositiveEndB">102</Item>
<Item id="ColorHighlightR">0</Item>
<Item id="ColorHighlightG">0</Item>
<Item id="ColorHighlightB">0</Item>
<Item id="ColorBlankR">255</Item>
<Item id="ColorBlankG">255</Item>
<Item id="ColorBlankB">255</Item>
<Item id="ColorSymbolText">rgb( 0, 0, 0 )</Item>
44
<Item id="ColorCircleSymbol">rgb( 40, 56, 84 )</Item>
<Item id="ColorCircleSymbolNegative">rgb( 255, 0, 0 )</Item>
<Item id="ColorSymbolStroke">rgb( 40, 56, 84 )</Item>
<Item id="ColorPalette">'rgb( 40, 56, 84 )', 'rgb( 0, 102, 102 )', 'rgb( 255, 153, 51 )', 'rgb( 153, 0, 0 )', 'rgb( 53, 72, 107 )', 'rgb( 51, 133, 133 )',
'rgb( 255, 173, 92 )', 'rgb( 173, 51, 51 )', 'rgb( 65, 90, 135 )', 'rgb( 76, 148, 148 )', 'rgb( 255, 184, 112 )', 'rgb( 184, 76, 76 )', 'rgb( 79, 109, 163 )',
'rgb( 102, 163, 163 )', 'rgb( 255, 194, 133 )', 'rgb( 194, 102, 102 )', 'rgb( 108, 134, 182 )', 'rgb( 153, 194, 194 )', 'rgb( 255, 214, 173 )', 'rgb( 214,
153, 153 )', 'rgb( 158, 177, 212 )', 'rgb( 191, 217, 217 )', 'rgb( 255, 229, 204 )', 'rgb( 229, 191, 191 )', 'rgb( 200, 216, 234 )', 'rgb( 217, 232, 232
)', 'rgb( 255, 240, 224 )', 'rgb( 240, 217, 217 )', 'rgb( 50, 56, 84 )', 'rgb( 20, 102, 102 )', 'rgb( 255, 153, 71 )', 'rgb( 153, 0, 20 )', 'rgb( 63, 72, 107
)', 'rgb( 71, 133, 133 )', 'rgb( 255, 173, 112 )', 'rgb( 173, 51, 71 )', 'rgb( 85, 90, 135 )', 'rgb( 96, 148, 148 )', 'rgb( 255, 184, 132 )', 'rgb( 184, 76,
96 )', 'rgb( 99, 109, 163 )', 'rgb( 122, 163, 163 )', 'rgb( 255, 194, 153 )', 'rgb( 194, 102, 122 )', 'rgb( 128, 134, 182 )', 'rgb( 173, 194, 194 )', 'rgb(
255, 214, 193 )', 'rgb( 214, 153, 173 )', 'rgb( 178, 177, 212 )', 'rgb( 211, 217, 217 )', 'rgb( 255, 229, 224 )', 'rgb( 229, 191, 211 )', 'rgb( 220, 216,
234 )', 'rgb( 237, 232, 232 )', 'rgb( 255, 240, 244 )', 'rgb( 240, 217, 237 )', 'rgb( 40, 76, 84 )', 'rgb( 0, 122, 102 )', 'rgb( 205, 153, 51 )', 'rgb( 153,
0, 0 )', 'rgb( 53, 92, 107 )', 'rgb( 51, 153, 133 )', 'rgb( 205, 173, 92 )', 'rgb( 173, 51, 51 )', 'rgb( 65, 110, 135 )', 'rgb( 76, 168, 148 )', 'rgb( 205,
184, 112 )', 'rgb( 184, 76, 76 )', 'rgb( 79, 129, 163 )', 'rgb( 102, 183, 163 )', 'rgb( 205, 194, 133 )', 'rgb( 194, 102, 102 )', 'rgb( 108, 154, 182 )',
'rgb( 153, 214, 194 )', 'rgb( 205, 214, 173 )', 'rgb( 214, 153, 153 )', 'rgb( 158, 197, 212 )', 'rgb( 191, 237, 217 )', 'rgb( 205, 229, 204 )', 'rgb( 229,
191, 191 )', 'rgb( 200, 236, 234 )', 'rgb( 217, 252, 232 )', 'rgb( 205, 240, 224 )', 'rgb( 240, 217, 217 )', 'rgb( 50, 56, 84 )', 'rgb( 20, 102, 102 )',
'rgb( 205, 153, 71 )', 'rgb( 133, 0, 20 )', 'rgb( 63, 72, 107 )', 'rgb( 71, 133, 133 )', 'rgb( 205, 173, 112 )', 'rgb( 153, 51, 71 )', 'rgb( 85, 90, 135 )',
'rgb( 96, 148, 148 )', 'rgb( 205, 184, 132 )', 'rgb( 164, 76, 96 )', 'rgb( 99, 109, 163 )', 'rgb( 122, 163, 163 )', 'rgb( 205, 194, 153 )', 'rgb( 174, 102,
122 )', 'rgb( 128, 134, 182 )', 'rgb( 173, 194, 194 )', 'rgb( 205, 214, 193 )', 'rgb( 194, 153, 173 )', 'rgb( 178, 177, 212 )', 'rgb( 211, 217, 217 )',
'rgb( 205, 229, 224 )', 'rgb( 209, 191, 211 )', 'rgb( 220, 216, 234 )', 'rgb( 237, 232, 232 )', 'rgb( 205, 240, 244 )', 'rgb( 220, 217, 237 )'</Item>
<Item id="OutlineStrokeWidthFactor">5</Item>
<Item id="SymbolCoveragePercentage">10</Item>
<Item id="SymbolFillOpacity">0.9</Item>
<Item id="SymbolStrokeOpacity">1</Item>
<Item id="SymbolToolTipFillColor">rgb( 102, 163, 163 )</Item>
<Item id="SymbolToolTipFillOpacity">0.7</Item>
<Item id="SymbolToolTipStrokeColor">rgb( 53, 72, 107 )</Item>
<Item id="SymbolToolTipStrokeOpacity">0.7</Item>
<Item id="SymbolToolTipTextColor">rgb( 255, 255, 255 )</Item>
<Item id="SymbolToolTipTextOpacity">1</Item>
<Item id="SymbolToolTipTextAnchor">start</Item>
<Item id="SymbolToolTipTextFont">Courier</Item>
<Item id="SymbolToolTipTextFontSize">10</Item>
<Item id="SymbolKeyRectangleX">0</Item>
<Item id="SymbolKeyRectangleY">-20</Item>
<Item id="SymbolKeyRectangleWidth">10</Item>
<Item id="SymbolKeyRectangleHeight">10</Item>
<Item id="SymbolKeyRectangleRX">0.5</Item>
<Item id="SymbolKeyRectangleRY">0.5</Item>
<Item id="SymbolKeyRectangleOpacity">1</Item>
<Item id="SymbolKeyTextFont">Arial</Item>
<Item id="SymbolKeyTextFontSize">12</Item>
<Item id="SymbolKeyTextColor">rgb( 0, 0, 0 )</Item>
<Item id="SymbolKeyTextOpacity">1</Item>
<Item id="SymbolKeyTextX">15</Item>
<Item id="SymbolKeyTextY">-10</Item>
<Item id="SymbolKeyTextAnchor">start</Item>
<Item id="Font">arial</Item>
<Item id="TextSize">20</Item>
<Item id="NumOfSymbolDetailWaitLimit">1500</Item>
</Config>
Figure 55 Example of a config.xml file