1
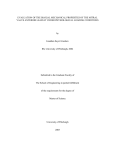
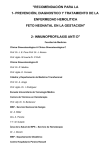
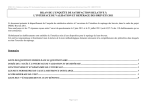
BMC Bioinformatics
BioMed Central
Open Access
Software
Statistical Viewer: a tool to upload and integrate linkage and
association data as plots displayed within the Ensembl genome
browser
Judith E Stenger*1,2, Hong Xu1,2, Carol Haynes1,2, Elizabeth R Hauser1,2,
Margaret Pericak-Vance1,2, Pascal J Goldschmidt-Clermont2 and
Jeffery M Vance1,2
Address: 1The Duke Center for Human Genetics, Duke University Medical Center, Durham, North Carolina 27710, USA and 2Department of
Medicine, Duke University Medical Center, Durham, NC 27710, USA
Email: Judith E Stenger* - [email protected]; Hong Xu - [email protected]; Carol Haynes - [email protected];
Elizabeth R Hauser - [email protected]; Margaret Pericak-Vance - [email protected]; Pascal J GoldschmidtClermont - [email protected]; Jeffery M Vance - [email protected]
* Corresponding author
Published: 12 April 2005
BMC Bioinformatics 2005, 6:95
doi:10.1186/1471-2105-6-95
Received: 15 December 2004
Accepted: 12 April 2005
This article is available from: http://www.biomedcentral.com/1471-2105/6/95
© 2005 Stenger et al; licensee BioMed Central Ltd.
This is an Open Access article distributed under the terms of the Creative Commons Attribution License (http://creativecommons.org/licenses/by/2.0),
which permits unrestricted use, distribution, and reproduction in any medium, provided the original work is properly cited.
Abstract
Background: To facilitate efficient selection and the prioritization of candidate complex disease susceptibility genes for
association analysis, increasingly comprehensive annotation tools are essential to integrate, visualize and analyze vast
quantities of disparate data generated by genomic screens, public human genome sequence annotation and ancillary
biological databases. We have developed a plug-in package for Ensembl called "Statistical Viewer" that facilitates the
analysis of genomic features and annotation in the regions of interest defined by linkage analysis.
Results: Statistical Viewer is an add-on package to the open-source Ensembl Genome Browser and Annotation System
that displays disease study-specific linkage and/or association data as 2 dimensional plots in new panels in the context of
Ensembl's Contig View and Cyto View pages. An enhanced upload server facilitates the upload of statistical data, as well
as additional feature annotation to be displayed in DAS tracts, in the form of Excel Files. The Statistical View panel, drawn
directly under the ideogram, illustrates lod score values for markers from a study of interest that are plotted against their
position in base pairs. A module called "Get Map" easily converts the genetic locations of markers to genomic
coordinates. The graph is placed under the corresponding ideogram features a synchronized vertical sliding selection box
that is seamlessly integrated into Ensembl's Contig- and Cyto- View pages to choose the region to be displayed in
Ensembl's "Overview" and "Detailed View" panels. To resolve Association and Fine mapping data plots, a "Detailed
Statistic View" plot corresponding to the "Detailed View" may be displayed underneath.
Conclusion: Features mapping to regions of linkage are accentuated when Statistic View is used in conjunction with the
Distributed Annotation System (DAS) to display supplemental laboratory information such as differentially expressed
disease genes in private data tracks. Statistic View is a novel and powerful visual feature that enhances Ensembl's utility
as valuable resource for integrative genomic-based approaches to the identification of candidate disease susceptibility
genes. At present there are no other tools that provide for the visualization of 2-dimensional plots of quantitative data
scores against genomic coordinates in the context of a primary public genome annotation browser.
Page 1 of 14
(page number not for citation purposes)
BMC Bioinformatics 2005, 6:95
Background
The search for genes contributing to complex human
diseases
The availability of the complete DNA sequence of the
human genome, along with advances in gene expression,
proteomics, metabolomics technology and bioinformatics databases, presents new opportunities for integrative
approaches to identify candidate susceptibility genes for
complex human diseases. Complex diseases, which
include such diverse illnesses as Alzheimer disease, Parkinson disease, cardiovascular disease and asthma,
account for the majority of chronic illnesses that plague
our society today. These non-Mendelian diseases are
attributable to inherited polymorphisms in perhaps several risk-associated or modifier genes that are triggered by
exposure to environmental agent(s). Because of the multitude of factors ultimately contributing to the disease
phenotype and the numerous confounding variables presented in studying human diseases, isolating the genetic
components that confer an underlying predisposition to a
complex disease is an inherently daunting undertaking.
The importance of data integration
Thus, to improve the odds of successfully identifying complex disease susceptibility genes, several diverse
approaches, each of which must capitalize on cutting-edge
technical, informatics and analysis, should be exploited.
The integration of disparate biological, statistical and clinical databases, both public and private, into wholegenome annotation are of paramount importance to comprehend and efficiently interpret the vast quantities of
DNA sequence data, gene expression data, proteomics
and other "-omics" data. As genotyping is a costly
endeavor, ever-more effective computational tools are
needed to readily access, organize and comprehend the
massive quantities of data generated to identify and prioritize candidate genes for genotyping. Only when a disease
causing genetic mutation is confirmed can the underlying
molecular mechanisms of complex diseases be unraveled
so that tests, prevention, new knowledge-based therapeutic approaches can eventually be devised.
Great strides have been made towards the federation of
bioinformatics databases as a result of concerted efforts
over the last few years by leading bioinformaticians to
develop controlled vocabularies [1,2], common platforms
and tools for integration [3]. As a result, despite the exponential growth of bioinformatics data, the number of
individual web-based resources that genetic researchers
have to navigate has been substantially reduced from a
multitude of disparate web sites on single chromosomes
and individual physical and genetic maps to essentially
three major on-line resources that facilitate access, analysis and retrieval of data from the recently completed
human genome.
http://www.biomedcentral.com/1471-2105/6/95
The visual presentation of the immense quantities of
incongruent data types, however, presents challenges in
itself. Effective integrated informatics tools must be capable of representing essential data of ever increasing complexity in a format that is both comprehensive and easily
synthesized by the human brain [4]. Towards this end,
three well-annotated web-based public genome browsers
with improved interfaces have been developed and are
continually evolving. These are: 1) the NCBI Entrez map
viewer [5,6], 2) the EMBL-EBI / Sanger Institute collaborative Ensembl project [7,8], and 3) the University of California at Santa Cruz's Golden Path Genome Browser
[9,10]. All are easily queried and capable of visually presenting overviews of the large regions of the genome while
allowing the user to zoom in on an area of interest revealing detailed information on the numerous features
mapped within. Each of these has become invaluable
tools in the arsenal of genetic researchers.
Genomic convergence
We and others have embraced a multi-faceted integrated
approach to identify and prioritize candidate genes for
complex human diseases that we call "genomic convergence" [11]. This approach combines the list of genes
obtained two or more distinctly different methods (e.g.
gene expression and linkage analysis) to obtain a list of
top candidate genes. Theoretically, including genes identified by other independent, yet biologically relevant,
lines of evidence could increase the sensitivity of the
approach as well as the specificity when the genes identified by several approaches are giving higher priority.
Rationale
To increase the efficiency and accuracy of the identification and prioritization of candidate genes for genotyping,
we needed to facilitate the identification and extraction of
genomic features of interest that are within linkage
regions as well as fully exploit the public databases and
the human genome assembly and annotation projects. A
strategy relying on the assignment somewhat arbitrary
"fitness" thresholds to reduce the number of candidate
genes for follow-up analysis poses the risk of excluding
the causative gene from the list of candidates if the thresholds are too stringent. For this reason a tool capable of displaying quantitative and positional data within a single
integrated browser view that would facilitate the synthesis
and interpretation of disparate data types is superior to
the more simplistic approach using the intersection of sets
of genes so that the thresholds are set empirically.
Customizing Ensembl to incorporate two-dimensional
linkage and association data plots
For reasons discussed later in this paper, we opted to use
a local implementation of Ensembl as the basis of our
internal bioinformatics infrastructure. To fully meet our
Page 2 of 14
(page number not for citation purposes)
BMC Bioinformatics 2005, 6:95
needs for integrating linkage and association data we
developed software to customize Ensembl as an analytical
tool for genomic convergence approaches to identify
potential disease-susceptibility genes for follow-up analysis. For this purpose we have developed software modules
that add functionality to the Ensembl genome annotation
systems so that the browser will display quantitative data
points plotted against chromosome position (e.g. statistical results, from genomic screens, fine mapping and association studies and expression levels), which are
seamlessly integrated into the Contig View and Cyto View
web pages. The new panels fully support the functionality
of the Ensembl system so genome regions corresponding
selected by the user within the Statistic View will be displayed in the Overview and Detailed View panels and
additional information on the statistical data-points may
be displayed in pop-up views with hyper-links to individual feature information pages. The Statistical Viewer package includes software to facilitate the upload, query,
storage, integration, display, analysis, and retrieval of private quantitative data into a public open-source genome
browser so that all public annotation, DAS sources and
links can be fully exploited.
We have created a software package called "Statistical
View" that includes an enhanced upload server that facilitates the upload, query, storage, integration, display,
analysis, and retrieval of private quantitative data into a
public genome browser to help geneticists make connection between the disease phenotype and the genetic features that are associated with risk on a genomic scale.
From there an understanding of the molecular basis of
disease can lead to testing, prevention, and perhaps ultimately, to pharmaceutical or alternative means of intervention so that the hopes of translational medicine
promised by the completion of the human genome
sequencing project will eventually be realized.
Implementation
Mapping genetic marker locations as genomic positions in
the human genome assembly
Linkage data is traditionally visually displayed as a graph
in which Lod scores are plotted along the ordinate against
the genetic location of the markers that were used in the
genetic screen and the subsequent analysis. The length of
the abscissa represents the length of the chromosome in
centimorgans (cM), a function of the recombination frequency between two loci. Recombination frequency is
influenced by factors such as regional genetic content and
gender so that one can only make a rough approximation
between in the average number of base pairs that are in a
single centimorgan map unit. Therefore, to incorporate a
visual representation of statistical results into the Ensembl
genome browser in a meaningful way, it is imperative that
the abscissa be expressed in base pairs so that the position
http://www.biomedcentral.com/1471-2105/6/95
of markers along the abscissa correctly align with, and
strictly correspond to, the horizontal illustration of the
ideogram that is displayed immediately above the linkage
study graph in the Ensembl ContigView. Towards this end
we have developed a tool "GetMap" that uses linear interpolation relative to deCODE Genetics' published map
[12] to approximate the physical chromosomal coordinates denoted in bps of markers that were a) not mapped
by the deCODE group and b) we have insufficient information for successful ePCR. The algorithm first uses a
binary search (the "divide-and-conquer" paradigm) to
find and extract known marker coordinates from a database when available. Otherwise the linear interpolation
algorithm is activated, using the closest markers flanking
markers with known coordinates to approximate the position as accurately as possible. The algorithm is based on
that described in by Kong et al. [12].
To convert the map units from centimorgans into their
chromosome sequence coordinates in base pairs, it is necessary to map the markers used as probes to the physical
sequence of the human genome. The most recent version
of the human genome assembly (currently NCBI build
35) can be downloaded from the UCSC genome site [10]
and the most recent version of the Ensembl annotation
system [8].
The first step in converting the genetic location of a
marker into its position in base pairs is the creation of a
database of unique reliable and valid markers (typically
microsatellites) based on the NCBI UniSTS database
[13,14], an integrated non-redundant database of markers
(sequence tagged sites, STSs [15]), as a starting point.
UniSTS integrates mapping information gathered from
various resources primary sources, and is the source of
marker probe sequence information. The markers, their
aliases, sequences and available locations on genetic maps
are retrieved via the NCBI ftp server [16]. Once the most
recent version of the human genome assembly and
UniSTS has been uploaded onto our local servers we remap the positions of STSs by using e-PCR [17-19], or
BLAT [20] as a next resort. In a preprocessing step, markers
that may have erroneous map positions and/or show
inconsistent ordering when compared to other maps are
flagged, removed from our verified database and saved
elsewhere for reference. The confirmed genomic position
and other information, including its genetic location(s), is
then used to populate the statistical results table in the
database illustrated Figure 3. Then, to facilitate the interconversion of map locations from pre-existing genetic
maps and analysis into the human genome nucleotide
position, we have developed a web-based tool called "Get
Map" for uploading a file containing marker locations, as
well as their position as provided by the user. This tool
also exists in a stand-alone version for processing batch
Page 3 of 14
(page number not for citation purposes)
BMC Bioinformatics 2005, 6:95
http://www.biomedcentral.com/1471-2105/6/95
Figurestructures
Table
3
for the linkage object and the user access database
Table structures for the linkage object and the user access database. Part A of the figure shows that the study field
serves as the key relating the User Data to the Linkage Data. Also shown are examples (part B) of three data records that
define plot coordinates along with other attributes. User databases are created to allow restricted access for uploading data.
files and is described in the Get Map documentation file
provided as supplementary material.
Software for viewing statistical data as 2-dimensional plots
within the context of Ensembl
The drawing program consists of four basic Bioperl modules that build on the Ensembl open source software and
genome annotation system to display a linkage plot of statistical results, that are easily uploaded by laboratory personnel using the upload server we devised, in the context
of the annotated human genome sequence. These modules add an additional display panel, "Statistic View" that
appears automatically when the Contig View (see Figure
1) and the Detailed View in CytoView (see Figure 2) pages
are opened. However, if no statistical data for any studies
has been uploaded into the mySQL db for a chromosome
of interest no plots are drawn, but a compressed panel
appears displaying text indicating that "there is no statistical data pertaining to any study available for this chromosome" (not shown). Like other Ensembl panels, to save
space, this panel can be compressed when not needed.
Once the data is uploaded into a local Distributed Annotation System (DAS) [21] server, researchers can use a
pull-down menu to select the plot for a particular study of
interest that is then drawn in a panel placed between ideogram of the chromosome and the Overview in both Cyto
View and Contig View.
Description of BioPerl modules for embedding "Statistic
View" panels in Ensembl
Using the Perl programming language we developed
BioPerl modules (reviewed by Stajich et al. [22] that draw
a linkage (or other) plot using the data uploaded in the
DAS server for the particular study, which the researcher
must provides the name of as a required field. The data
flow for the Statistic View module is illustrated in figure 4.
The source code is provided as supplemental material. The
four basic BioPerl modules are: 1) Bio::EnsEMBL::Linkage.pm, 2) Bio::EnsEMBL::DBSQL::LinkageAdaptor.pm,
3) Bio::EnsEMBL::GlyphSet::lodplot.pm and 4) WebUserConfig::chrplot.pm
and
Bio::EnsEMBL::GlyphSet::FineLODplot provides for a detailed statistical plot,
Page 4 of 14
(page number not for citation purposes)
BMC Bioinformatics 2005, 6:95
http://www.biomedcentral.com/1471-2105/6/95
FigureView
Contig
1 featuring Statistic View
Contig View featuring Statistic View. Shown is a screen shot depicting a local implementation of Ensembl's contig view
page hosted by the Duke Center for Human Genetics, captured using SnagIt 7.0. The figure illustrates the appearance of the
Statistic View panel and some of its features in the context of Contig View. It also demonstrates how the selection of a peak
can enable the researcher to easily see where linkage data and other features such as potentially unstable tri-nucleotide repeats
and gene expression data converge to suggest priority gene for association and sequence analysis.
Page 5 of 14
(page number not for citation purposes)
BMC Bioinformatics 2005, 6:95
http://www.biomedcentral.com/1471-2105/6/95
Figure
Cyto
View
2 featuring Statistic View
Cyto View featuring Statistic View. A screen shot of private data hosted at primer.duhs.duke.edu illustrating the integration of Statistic View in the Ensembl CytoView page.
Page 6 of 14
(page number not for citation purposes)
BMC Bioinformatics 2005, 6:95
http://www.biomedcentral.com/1471-2105/6/95
User Request
(Contig View or Cyto View)
User
fail
authentication
STOP
succeed
Linkage Adaptor
Retrieve linkage object from database
LOD score plot
Draw Statistic View Panel
Contig- or Cyto- View
Figure
Flow
chart
4 illustrating the flow of data in Statistic View
Flow chart illustrating the flow of data in Statistic
View. A security feature is built in so that the process aborts
if the user is not authenticated.
described below, that is drawn beneath the Detailed View
panel in Ensembl's Cyto- and Contig- View pages. The
source code for each of these is provided as rich text files
(see Additional file 1 through 5, respectively). Also documentation and executables are provided within a compressed archive file (Additional file 6).
Briefly, the Linkage.pm module features a constructor to
create the linkage object, essentially a table that encapsulates the record for a single linkage point, allowing for
linkage data to be added populating the database. The
database table, Linkage_Table, contains up to eleven
fields shown in figure 3A. This information can be viewed
in the Ensembl Contig- and Cyto- View browser pages
within a pop-up box when moving the cursor over
("mousing-over") the point in the plot as shown in
figure1 below the Detailed View)
The GlyphSet::lodplot.pm module is next implemented.
This module contains all the information for drawing the
graph of the statistical data. This module served as the
basis for the FineLODplot.pm that displays a graph of statistical data below the Detail View Panel that corresponds
to the same range (from the slice of the chromosome
selected when the user slides the red box in either the ideogram or the Statistic View panel) of the Detailed View
Panel. The WebUserConfig::chrplot.pm module is then
added to configure the lod plot so that it is displayed in
the Statistic View panel in CytoView and ContigView.
The LinkageAdaptor object module, LinkageAdaptor.pm,
provides the functionality for accessing linkage data from
the DAS database. Linkage adaptor creates a "slice" object,
corresponding to the sliding red box that the view uses to
select a region. The slice object defines the region from
which linkage data will be retrieved and returns the
records from the linkage objects that are mapped to the
chromosome between the coordinates within the boundary of the red box that are displayed in the detailed view
below. Finally the plot image was scored into the Ensembl
Contig View and Cyto View by modifying the Contig- and
Cyto- view code so that the linkage plot is displayed into
the Ensembl Contig View.
Figure 1 is a screen shot of the Ensembl Contig View web
browser running off of our local server that illustrates the
Statistic View panel with a plot comparing lod and hetlod
scores against their corresponding genomic location. Figure 2 similarly illustrates the incorporation of Statistic
View into Ensembl's CytoView. Note how the graph in
Figure 1 features data points interconnected by dotted
lines while that in Figure 2 shows solid lines. The database
table provides a field called link_type that allows a statistical analyst to specify the display to quickly allow one
type of analysis, such as single point, from another, such
as multi-point, when a convention is adhered to.
Although Statistic View is an invaluable tool for surveying
chromosomes for interesting genomic features in linkage
peaks derived from a genomic screen, it is of limited use
in fine mapping and association studies due to insufficient resolution at the chromosomal level to see the
desired features as the density of markers increases. Thus,
recognizing the utility of having the ability to display
detailed information in a region selected for detailed association studies, we have developed code (provided within
Additional file 5) to plot and display association data in a
separate panel, below the Detailed View in Contig- and
Page 7 of 14
(page number not for citation purposes)
BMC Bioinformatics 2005, 6:95
Cyto- View. Essentially, this panel, that we refer to as
"Detailed Statistic View" is an enlargement of a region
selected from either "Statistic View" or the Overview panel
that will directly corresponds with the Detailed View outlined in red (See figures 1 and 2).
Results
Here we describe the functionality of a program package
called "Statistical Viewer" that was written for the purpose
of integrating statistical genetic data with human genome
sequence annotation. The name "Statistical Viewer" refers
to the name of the software package while "Statistic View"
refers to the display panel that is labeled in Ensembl's
"Contig View and Cyto View" pages.
Usage
The first step in adding statistical data to Ensembl is formatting the data for upload. As the abscissa must correspond to genomic coordinates for integration into the
human genome assembly, the position of the linkage
point (for the microsatellite or other marker) needs to be
defined by the name of chromosome, and chromosome
start and end position in base pairs.
Simplified data entry via an improved web-based upload
service
To facilitate the upload of statistical data as well as other
types of private data, we developed a customized upload
server that allows members of a group with permissions to
upload their own data Users may add new data to be
plotted into "Statistical View" or data for annotation as
DAS tracts. Our improved DAS upload server allows users
to append data into previously instantiated data tracks.
The web-based interface is also user-friendly so that formatting difficulties and failures and errors that typically
ensue when cutting and pasting tab-delimited text into
the Ensembl web form, are avoided.
Upload file format requirements
The data must be in the form of a simple two-dimensional
table containing attributes (columns) and tuples (rows).
The upload serves accepts either tab-delimited text files or
MS excel spreadsheet files as input using a browse feature
to specify the directory. When using an Excel file, the top
worksheet page must contain all the data to be uploaded
and be devoid of any merged fields. We have designed the
upload server to require a minimum of eight essential
fields that serve as column headings in a table, although
additional attributes such as the name of the researcher or
technician entering the data, the method, or date are permitted and encouraged.
These eight required fields (attributes) are:
http://www.biomedcentral.com/1471-2105/6/95
1. Study: The term defines the data set and is the title of the
study. The field is a string of characters giving the name of
a disease, project or a sub-study. One study can have data
across multiple chromosomes or in several analysis
groups. Data from multiple studies can be combined into
a single spreadsheet if the records are listed sequentially in
tuples (rows).
2. Analysis: This field enables representation of data subcategories from stratification within a study. The character
string can be different statistical analysis methods, or the
different populations, etc. Again, several data categories
can be included into the same spreadsheet. The fields will
be used to provide the key or legend for the points plotted
on the Statistic View graph. The units should be included
in parenthesis.
3. Link_point: This field is typically the name of the marker
for linkage study. The value will be represented as a data
point on the Statistic View graph that will display the
name of the marker in a pop-up window when the point
is "moused-over".
4. Score: The statistical score for the Link_point. The units
may be indicated here as well the score for inclusion in
pop-up windows.
5. Chr_name: All human chromosome names (1 through
22 as well as X, Y) are acceptable character values.
6. Chr_start: The chromosome start location of the
Link_point in base pairs.
7. Chr_end: The chromosome end location of the
Link_point also in base pairs. This position may be identical to the chr_start value in the case of a SNP.
8. Link_type: This attribute specifies the type of line used
for connecting the Link_points in the plot: for example,
"dot" denotes a "dotted line (- - - - -)" that we use as a convention two-point analysis. "Line" is "solid line (____) "
and typically indicates a multi-point analysis. By placing
the term "point" in this field, Statistical View will draw a
scatter plot without lines. If a value is not supplied for this
field a solid line, the default, will connect the link points.
Viewing integrated statical data in Ensembl
The StatisticalView panel depicts a graph plotting the linkage, or association, statistics along the ordinate and the
length of the chromosome, in megabases (Mbs), along
the abscissa. The length of the abscissa diametrically corresponds to the length of the ideogram that is illustrated
directly above. The program generates this panel, which is
capable of displaying two-dimensional graphs plotting
data for pertaining to a study of interest. Refreshing the
Page 8 of 14
(page number not for citation purposes)
BMC Bioinformatics 2005, 6:95
page following selection of another study or analysis
method can bring up different plots. This plot is seamlessly integrated into the Cyto View and the Contig View
pages. Like other panels in these web pages, the Statistic
View panel features a selection box, a movable red rectangle with adjustable width, to highlight the boundaries of
a region of interest in the linkage plot. The boundaries of
the region selected in Statistic View directly correspond to
the selection box in the ideogram and the physical map
position that is denoted in bps in the Detailed View. The
selection box also correctly corresponds with the enlarged
box that is dynamically drawn in the overview. As with the
corresponding selection box in Ensembl's other display
panels in Contig- and Cyto- View, the width of the selection box in Statistic View can be altered with a mouse, or
a similar input devise, to select either a larger or a narrower region of interest to dynamically alter the other display panels. Likewise, changing bp coordinates in the
Detailed View, or altering the size or location of any of the
sliding selection boxes in the other panels, has the appropriate effect on the selection box in the Statistic View
panel.
Discussion
Following the much-anticipated first release of the draft
sequence of the human genome by the international consortium [23] and the Celera Corporation [24] in February
2001, human geneticists were eager to apply this resource
data to use to map and identify disease susceptibility
genes. Even in its incomplete and unverified state, the
data represented a tremendously powerful resource to
help resolve the inconsistencies that confounded the use
of independently derived genetic and radiation hybrid
maps. Because of the computational complexity of dealing with large and incomplete human pedigrees [25], the
production of these maps was a significant accomplishment. The deCODE Corporation immediately incorporated the draft sequence data in constructing a new
meiotic map [12] that represented a significant improvement over the Marshfield [26] and Genethon maps [27].
It was also immediately obvious that a tremendous
amount of work remains to translate this data into knowledge that will eventually improve the overall health of the
public and that the processes of analyzing and interpreting this data presents many challenges in itself.
In spite of the exponential growth of biomedical data, the
task of mining data is less daunting than it was just a few
years ago. Via the World Wide Web (WWW) geneticists
have at their disposal three distinct, high-quality, wellannotated genome repositories that provide free access to
the most recent genome assemblies for humans as well as
an increasing, diverse assortment of model organisms.
Each of these public genome browsers, NCBI, UCSC and
EBI/Sanger's Ensembl, employ their own annotation
http://www.biomedcentral.com/1471-2105/6/95
pipeline but should contain the same nucleotide
sequence from the latest, or at least the second most
recent, release of the NCBI assembly. As is the case with
the NCBI and UCSC genome browsers, the public
Ensembl site contains genomic sequences and a plethora
of useful features extending well beyond known and predicted genes, microsatellite markers, and SNPs that are
linked to their corresponding records hosted at their
respective primary sources (see [28] for a review of current
molecular biology databases).
We have chosen Ensembl as the system to underlie Statistic View for several reasons: 1) the horizontal presentation
of the genome annotation makes it amenable to
displaying a linkage map, 2) Ensembl has stably incorporated DAS for displaying customized data from sources
outside of the Ensembl annotation pipeline mapped to
the genome as tracts for several years, 3) the developers
have intended from the start that the project would be
open source and thus have taken great care in documenting its source code, and 4) Ensembl's EnsMart genome
data retrieval tool is a very sophisticated and flexible data
mining tool containing extensive filters and several good
output options. Thus for the purpose of integrating linkage data, as well as other types of internal data, we believe
Ensembl currently provides the best architecture to serve
as the basis of an data integration infrastructure for use by
a genetics laboratory in an academic setting.
A local implementation of the Ensembl genome annotation databases and software system is ideal for integrating
third party annotation features with public human
genome sequence annotation and serves as the foundation of our bioinformatics infrastructure to assist in the
identification and prioritization of candidate genes in disease fine mapping and association studies. The DAS system has enabled us to display the location of markers used
in a particular study as features in tracks displayed in Contig- and Cyto-View. Additionally we have mapped other
features such as the location of differentially expressed
genes from experiments using both microarray [29] and
SAGE technology [11]. These studies employed Statistic
View and illustrate the utility of having such a tool for rapidly identifying and visualizing genomic features that are
in regions of linkage.
We have found that the benefits of locally maintaining a
mirror of the public human genome sequence along with
the Ensembl genome browser software and a DAS server
exceed the costs. It was far more costly to maintain individual databases with different formats across different
projects. This integrated system allows users to manually
curate genomic, computationally derived, statistical,
genetic, and experimental (e.g. gene expression) results
Page 9 of 14
(page number not for citation purposes)
BMC Bioinformatics 2005, 6:95
for many projects. Additionally, sensitive data can be
password protected.
Although the ability to map the location of microsatellite
or SNP markers used in genomic screens and genotyping
into DAS tracts in the Ensembl overview has proved to be
very useful in genomic convergence or integrative
genomic strategies thus far, Statistic View will continue to
enable us to efficiently screen regions of the genome for
additional features that may be indicative of a gene warranting further investigation. Towards this end, we are
conducting research to identifier better predictors of successful outcome. We have mapped to the genome
sequence DNA motifs that we predict are "at-risk" for
genome instability such as full length, highly identical,
closely spaced inverted repeats such as Alu pairs [30,31]
and long simple tandem repeats (Stenger, unpublished)
in coding sequences (see detailed view in Figures 1 and 2).
Displaying these features in DAS tracts in conjunction
with linkage data has enabled us to hone in on a potential
candidate gene even when the function of gene is
unknown. Although the number of genes of unknown
function is dwindling with better recognition of pseudogenes, they still represent a large enough portion of
genome that it is prudent to not exclude from follow-up
sequencing and association studies. However, genes of
unknown function frequently are overlooked since such
genes are excluded from strategies based on biological
plausibility and may not be represented on microarrays.
In addition, we are in the process of mapping trans-acting
transcription factors to the genome. Aberrantly expressed
genes may not map to linkage regions, but it is likely that
co-expressed genes are regulated by a common cis-acting
regulatory element. The identification of proteins that
may bind to these regulatory motifs may further inform
our search for candidate genes in regions displayed in Statistic View. We have also been using in silico subtractive
hybridization methods to identify genes expressed
uniquely in tissues that exhibit pathology in the diseases
that are under investigation (e.g. a DAS tract displaying
the location of genes specific to the substantia nigra may
help identify candidate genes for Parkinson Disease) and
have mapped these to the genome as DAS tracks.
It is worthwhile to mention that the upload of data into
the DAS database using Ensembl's upload server can be
problematic. The upload server provided on the public
server had a number of shortcomings: 1) it is often difficult to properly format the data as text so that the desired
output is generated, 2) a full email address is required for
the user ID at login, and 3) each login results in data put
into a separate track so that individual records could not
easily be added to an existing data track. To overcome this,
the user who initialized the track was required to delete
http://www.biomedcentral.com/1471-2105/6/95
the original data file and append the new data to a file and
reload the entire data set. These limitations detracted from
the usefulness of our private Ensembl-DAS system
because data entry became a bottleneck in the analysis
project with bioinformaticians serving as gatekeepers. We
extended the capabilities of the upload server so that
researchers with appropriate permissions could easily add
individual records to the DAS database without having to
delete and recreate a new data set and its resulting tract
displayed in the detailed view panel. By improving the
data upload procedure, laboratory personnel who generate data can enter and maintain their data with minimal
training.
To facilitate the upload of data, we developed a utility that
thus far represents significant improvements over the
upload server provided with the Ensembl package. Our
tool works well for uploading data with base pair coordinates that is to be displayed in tracks in Contig- and CytoView's Detailed View panel. We have found that to have
data entry proceed at the same rate as data generation, it is
best to provide laboratory researchers with the tools to
add their own annotation when high throughput genotyping methods are being used, although some labs may
prefer to have a gatekeeper to manually curate data at the
time of entry to ensure that data integrity is preserved. Recognizing the need to minimize errors, which are inevitably propagated, and faced with limited human resources
to enter and curate data we in the process of developing
greater functionality to our upload server by automating
conversion to the proper physical location so that potential mapping errors are avoided. This software is provided
in its current level of development as Additional files 7
and 8and their respective user manuals are provided in
Additional files 9 and 10.
Conclusion
We have developed software to enhance the Ensembl
open source software package as a private laboratory bioinformatics infrastructure to assist in the identification of
candidate complex human disease susceptibility genes.
We have improved the upload server thereby empowering
laboratory personnel to add project specific data to the
local DAS database for display in the context of the
human genome using the Ensembl genome browser's
contig view. By creating an additional panel in Ensembl's
Contig View and Cyto View, called Statistic View, we are
able to display statistical results from gene mapping
experiments in the context of human genome sequence
annotation. Statistic View displays a plot of linkage and
association statistics directly above the Overview. Statistic
View is fully and seamlessly integrated into the Ensembl
genome browser. The user can navigate the chromosome
by mousing-over a selection box outlined in red that
directly corresponds to the one drawn by the Ensembl
Page 10 of 14
(page number not for citation purposes)
BMC Bioinformatics 2005, 6:95
http://www.biomedcentral.com/1471-2105/6/95
software in the ideogram of the chromosome. This capability facilitates the selection of regions of the chromosome in linkage disequilibrium for easily visualization of
features mapped therein that are displayed in data tracts
below in the Overview. This capability allows rapid
screening of regions of interest to a particular study to
identify genes that deserve further screening.
NCBI – National Center for Biotechnology Information
Availability and requirements
STS – sequence tagged sites (markers)
The source code is provided as supplementary material for
this publication and will also be available from the Duke
Center for Human Genetics public web pages [32] as well
as through the public Ensembl site [8].
Setting up a local implementation of Ensembl
To use this software the Ensembl Genome Browser Software Annotation System must be installed and running
locally. The Statistical View package runs on version 26.1,
which can be accessed through the Download Ensembl
Wiki web URL [33]. Genome files and other database files
can be access through the Ensembl ftp server [34].
Ensembl requires a server with a UNIX or Linux type of
operating system (e.g. OS X, SGI's IRIX and Sun's Solaris).
All software and the full complement of mySQL genome
sequences and databases currently occupies 150 gigabytes
of storage space and requires just as much swap space, but
may not be needed depending on your requirements as
specified in the installation pdf file [35].
SAGE – Serial Analysis of Gene Expression
SNP – single nucleotide polymorphism
SQL – structured query language
Authors' contributions
J E S – scientific director of CHG bioinformatics core,
headed bioinformatics database integration project,
contributed to concept, implementation ideas, helped
formulate requirements and provided suggestions for
improvements. Secured funding for hardware.
H X – senior
implementation.
programmer
responsible
for
C H – member of database integration and post-processing groups, contributed to concept, and implementation
ideas. Helped design database tables, helped formulate
requirements
and
provided
suggestions
for
improvements.
E R H – Principal Investigator for CEGS bioinformatics
Component, headed post-processing project, contributed
to concept, implementation ideas and requirements
We maintain a current local implementation of the
Ensembl open source software system, including the
human genome sequence assembly and related databases
running on a SunFire 12 K reference server in conjunction
with a separate server, a Sun Blade 2000 acting as an annotation server to store and overlay public genome data with
private laboratory data for integration using the Distributed Annotation System.
M P-V – Director of CHG, provided funding, human
resources and the impetus for the project
List of abbreviations
Additional material
P J G-C – Chairman of the Duke Department of Medicine,
provided funding and supported project development.
J M V – senior author, provided cause for action, contributed ideas and requirements and funding
BLAT – BLAST-Like Alignment Tool
cM – centimorgan, a single map unit
db – database
Additional File 1
The source code for Bio::EnsEMBL::DBSQL::LinkageAdaptor
Click here for file
[http://www.biomedcentral.com/content/supplementary/14712105-6-95-S1.rtf]
DAS – Distributed Annotation System
Additional File 2
DNA – deoxyribonucleic acid
EMBLI – European Molecular Biology Laboratory
The source code for Bio::EnsEMBL::Linkage
Click here for file
[http://www.biomedcentral.com/content/supplementary/14712105-6-95-S2.rtf]
EBI – European Bioinformatics Institute
Mb – megabase, one million base pairs
Page 11 of 14
(page number not for citation purposes)
BMC Bioinformatics 2005, 6:95
http://www.biomedcentral.com/1471-2105/6/95
Additional File 3
Additional File 7
The source code for Bio::EnsEMBL::GlyphSet::LodPlot
Click here for file
[http://www.biomedcentral.com/content/supplementary/14712105-6-95-S3.rtf]
The source code for the CHG enhanced upload service for integrating local
data as features for display in the Ensembl genome browser as DAS tracks
Click here for file
[http://www.biomedcentral.com/content/supplementary/14712105-6-95-S7.rtf]
Additional File 4
The source code for WebUserConfig::chrplot BioPerl module
Click here for file
[http://www.biomedcentral.com/content/supplementary/14712105-6-95-S4.rtf]
Additional File 5
The source code for Bio::EnsEMBL::GlyphSet::FineLODplot BioPerl
module
Click here for file
[http://www.biomedcentral.com/content/supplementary/14712105-6-95-S5.rtf]
Additional File 6
The executable BioPerl modules and documentation can be decompressed
with either the GNU (Free Software Foundation) unzip command [36]
in UNIX or the WinZip Windows archive utility (WinZip Computing,
Inc.) [37] in an MS Windows OS. Please see the respective web sites that
are referenced for additional details on acquiring and using these compression utilities, as well as the UNIX man pages for the tar command: i.
Readme A text file the provides a description of modules and the path to
the code in the Ensembl Server Root directory ii. Support.pm (Format:
Perl Module) Modified source code for the ContigView::Support package
that includes the Duke Center for Human Genetics extension to add the
LOD score plot panel iii. Chrplot.pm (Format: Perl Module) The
WebUserConfig::chrplot BioPerl module iv. Contigview (Format: text
file) Modified source code for the configuration based version of the
Ensembl Contig view package including the necessary additions to incorporate the LOD score or other statistical data plot v. Cytoview (Format:
text file) Source code for the Ensembl Cyto view package including the
modifications to incorporate the LOD score plot vi. DBAdaptor.pm (Format: Perl Module) The modified source code for the
Bio::EnsEMBL::DBSQL::DBAdaptor module that includes the Duke
Center for Human Genetics extension to add the LOD score plot panel
into the genome browser vii. Linkage.sql (Format: Structured Query Language) This file specifies the table structure for the linkage object viii.
Linkage.pm (Format: Perl Module) Bio::EnsEMBL::Linkage Ensembl
BioPerl module ix. LinkageAdaptor.pm (Format: Perl Module)
Bio::EnsEMBL::DBSQL::LinkageAdaptor BioPerl module This Module
includes the POD documentation – the main documents preceding the
code x. Linkageview (Format: BioPerl package) This file provides the
package to display the chromosome linkage plot and the information for
each linkage point xi. Linkageview.pm (Format: Perl Module) The
EnsEMBL::Web::UserConfig::linkageview module xii. Lodplot.pm (Format: Perl Module) The Bio::EnsEMBL::GlyphSet::LodPlot module xiii.
HTML.pm (Format: Perl Module) This file is the modified source code for
the ContigView::HTML package that includes the Duke Center for
Human Genetics extension to add the LOD score plot panel
Click here for file
[http://www.biomedcentral.com/content/supplementary/14712105-6-95-S6.gz]
Additional File 8
The source code for the CHG enhanced upload service for integrating linkage or other statistical data for display in plots (graphs) as a panel within
the Ensembl genome browser Contig- and Cyto- View pages.
Click here for file
[http://www.biomedcentral.com/content/supplementary/14712105-6-95-S8.rtf]
Additional File 9
User manual for uploading Linkage or other statistical data to be plotted
in a display panel called "Statistic View" within the Contig- and Cytoview genome Browser pages of a local implementation of Ensembl.
Click here for file
[http://www.biomedcentral.com/content/supplementary/14712105-6-95-S9.doc]
Additional File 10
The manual for using the Duke CHG enhanced upload server web interface to import data into MySQL database so that the features can be displayed as DAS-tracks showing annotation for experimental data within
the context of the genome sequence assembly on a local implementation of
Ensembl.
Click here for file
[http://www.biomedcentral.com/content/supplementary/14712105-6-95-S10.doc]
Additional File 11
Manual for using the Get Map tool for the interconversion of genomic and
genetic positions for markers. The algorithm is also described.
Click here for file
[http://www.biomedcentral.com/content/supplementary/14712105-6-95-S11.doc]
Acknowledgements
We are grateful to Jason Stajich for pioneering this endeavor at the DCHG.
We are indebted to the Ensembl team, especially Tony Cox at Sanger for
providing guidance in setting up our local DAS server and Ewan Birney for
his provocative discussions, encouragement, and willingness to make Statistic View available through the public site. We would like to thank Richard
Cornwell for assistance in developing some of the code. We also acknowledge CHG fellows, students and technicians of the CHG for their helpful
suggestions. Also, none of this would have been possible if not for dedicated
researchers of the International Genome Consortium who collectively
accomplished the remarkable feat of sequencing the human genome in its
entirety, as well as those who tirelessly worked to continuously improve
public access to biological databases. This work was supported in part by
the Alzheimer's Association grant "Identification of Novel Age-at-Onset
Genes on Chromosome 10 in Alzheimer Disease" as well as the following
NIH grants: NHLBI grant P01 HL73042-01 (P.J.G.-C., E.R.H., H.X. M.P.-V.,
J.E.S., J.M.V), NINDS grants R01 AG021547 (M.P.-V), P01 NS26630-15
(M.P.-V), R01 NS36768-07 (M.P.-V), NIA grant R01AG19757-01, P50
NS39764-04 and its supplement P50 NS39764-04S1 (J.M.V.), NIEHS
Page 12 of 14
(page number not for citation purposes)
BMC Bioinformatics 2005, 6:95
http://www.biomedcentral.com/1471-2105/6/95
ES11375 (H.X.) J.E.S. is also supported in partby NIEHS K-22 grant
ES00372.
References
1.
2.
3.
4.
5.
6.
7.
8.
9.
10.
11.
12.
13.
14.
15.
16.
17.
18.
19.
20.
21.
22.
23.
Ashburner M, Ball CA, Blake JA, Botstein D, Butler H, Cherry JM,
Davis AP, Dolinski K, Dwight SS, Eppig JT, Harris MA, Hill DP, IsselTarver L, Kasarskis A, Lewis S, Matese JC, Richardson JE, Ringwald M,
Rubin GM, Sherlock G: Geneontology: tool for the unification of
biology. The Gene Ontology Consortium. Nat Genet 2000,
25:25-29.
Stein LD: Integrating biological databases. Nat Rev Genet 2003,
4:337-345.
Hubbard T: Biological information: making it accessible and
integrated (and trying to make sense of it). Bioinformatics 2002,
18(Suppl 2):S140.
Heumann K, Harris C, Mewes HW: A top-down approach to
whole genome visualization. Proc Int Conf Intell Syst Mol Biol 1996,
4:98-108.
Tatusova TA, Karsch-Mizrachi I, Ostell JA: Complete genomes in
WWW Entrez: data representation and analysis. Bioinformatics 1999, 15:536-543.
NCBI Map Viewer [http://www.ncbi.nlm.nih.gov/mapview/]
Hubbard T, Barker D, Birney E, Cameron G, Chen Y, Clark L, Cox T,
Cuff J, Curwen V, Down T, Durbin R, Eyras E, Gilbert J, Hammond M,
Huminiecki L, Kasprzyk A, Lehvaslaiho H, Lijnzaad P, Melsopp C,
Mongin E, Pettett R, Pocock M, Potter S, Rust A, Schmidt E, Searle S,
Slater G, Smith J, Spooner W, Stabenau A, Stalker J, Stupka E, UretaVidal A, Vastrik I, Clamp M: The Ensembl genome database
project. Nucleic Acids Res 2002, 30:38-41.
Project Ensembl Genome Browser [http://www.ensembl.org.]
Kent WJ, Sugnet CW, Furey TS, Roskin KM, Pringle TH, Zahler AM,
Haussler D: The human genome browser at UCSC. Genome Res
2002, 12:996-1006.
UCSC Genome Bioinformatics [http://genome.cse.ucsc.edu/]
Hauser MA, Li YJ, Takeuchi S, Walters R, Noureddine M, Maready M,
Darden T, Hulette C, Martin E, Hauser E, Xu H, Schmechel D, Stenger
JE, Dietrich F, Vance J: Genomic convergence: identifying candidate genes for Parkinson's disease by combining serial analysis of gene expression and genetic linkage. Hum Mol Genet
2003, 12:671-677.
Kong A, Gudbjartsson DF, Sainz J, Jonsdottir GM, Gudjonsson SA,
Richardsson B, Sigurdardottir S, Barnard J, Hallbeck B, Masson G, Shlien A, Palsson ST, Frigge ML, Thorgeirsson TE, Gulcher JR, Stefansson
K: A high-resolution recombination map of the human
genome. Nat Genet 2002, 31:241-247.
UniSTS integrated makers and maps
[http://
www.ncbi.nlm.nih.gov/entrez/query.fcgi?db=unists]
Schuler GD: Pieces of the puzzle: expressed sequence tags
and the catalog of human genes. J Mol Med 1997, 75:694-698.
Olson M, Hood L, Cantor C, Botstein D: A common language for
physical mapping of the human genome. Science 1989,
245:1434-5.
NCBI UniSTS ftp site
[ftp://ftp.ncbi.nlm.nih.gov/repository/
UniSTS/]
Schuler GD: Sequence mapping by electronic PCR. Genome Res
1997, 7:541-50.
Rotmistrovsky K, Jang W, Schuler GD: A web server for performing electronic PCR. Nucleic Acids Res 2004:W108-12.
NCBI e-PCR [http://www.ncbi.nlm.nih.gov/genome/sts/epcr.cgi]
Kent WJ: BLAT – the BLAST-like alignment tool. Genome Res
2002, 12:656-664.
Dowell RD, Jokerst RM, Day A, Eddy SR, Stein L: The distributed
annotation system. BMC Bioinformatics 2001, 2:7.
Stajich JE, Block D, Boulez K, Brenner SE, Chervitz SA, Dagdigian C,
Fuellen G, Gilbert JG, Korf I, Lapp H, Lehvaslaiho H, Matsalla C, Mungall CJ, Osborne BI, Pocock MR, Schattner P, Senger M, Stein LD,
Stupka E, Wilkinson MD, Birney E: The Bioperl toolkit: Perl modules for the life sciences. Genome Res 2002, 12:1611-1618.
McPherson JD, Marra M, Hillier L, Waterston RH, Chinwalla A, Wallis
J, Sekhon M, Wylie K, Mardis ER, Wilson RK, Fulton R, Kucaba TA,
Wagner-McPherson C, Barbazuk WB, Gregory SG, Humphray SJ,
French L, Evans RS, Bethel G, Whittaker A, Holden JL, McCann OT,
Dunham A, Soderlund C, Scott CE, Bentley DR, Schuler G, Chen HC,
Jang W, Green ED, Idol JR, Maduro VV, Montgomery KT, Lee E, Miller
A, Emerling S, Kucherlapati , Gibbs R, Scherer S, Gorrell JH, Soder-
24.
25.
26.
27.
28.
29.
30.
gren E, Clerc-Blankenburg K, Tabor P, Naylor S, Garcia D, De Jong
PJ, Catanese JJ, Nowak N, Osoegawa K, Qin S, Rowen L, Madan A,
Dors M, Hood L, Trask B, Friedman C, Massa H, Cheung VG, Kirsch
IR, Reid T, Yonescu R, Weissenbach J, Bruls T, Heilig R, Branscomb
E, Olsen A, Doggett N, Cheng JF, Hawkins T, Myers RM, Shang J, Ramirez L, Schmutz J, Velasquez O, Dixon K, Stone NE, Cox DR, Haussler
D, Kent WJ, Furey T, Rogic S, Kennedy S, Jones S, Rosenthal A, Wen
G, Schilhabel M, Gloeckner G, Nyakatura G, Siebert R, Schlegelberger
B, Korenberg J, Chen XN, Fujiyama A, Hattori M, Toyoda A, Yada T,
Park HS, Sakaki Y, Shimizu N, Asakawa S, Kawasaki K, Sasaki T, Shintani A, Shimizu A, Shibuya K, Kudoh J, Minoshima S, Ramser J, Seranski
P, Hoff C, Poustka A, Reinhardt R, Lehrach H: A physical map of
the human genome. Nature 2001, 409:934-941.
Venter JC, Adams MD, Myers EW, Li PW, Mural RJ, Sutton GG, Smith
HO, Yandell M, Evans CA, Holt RA, Gocayne JD, Amanatides P,
Ballew RM, Huson DH, Wortman JR, Zhang Q, Kodira CD, Zheng
XH, Chen L, Skupski M, Subramanian G, Thomas PD, Zhang J, Gabor
Miklos GL, Nelson C, Broder S, Clark AG, Nadeau J, McKusick VA,
Zinder N, Levine AJ, Roberts RJ, Simon M, Slayman C, Hunkapiller M,
Bolanos R, Delcher A, Dew I, Fasulo D, Flanigan M, Florea L, Halpern
A, Hannenhalli S, Kravitz S, Levy S, Mobarry C, Reinert K, Remington
K, Abu-Threideh J, Beasley E, Biddick K, Bonazzi V, Brandon R, Cargill
M, Chandramouliswaran I, Charlab R, Chaturvedi K, Deng Z, Di FV,
Dunn P, Eilbeck K, Evangelista C, Gabrielian AE, Gan W, Ge W, Gong
F, Gu Z, Guan P, Heiman TJ, Higgins ME, Ji RR, Ke Z, Ketchum KA,
Lai Z, Lei Y, Li Z, Li J, Liang Y, Lin X, Lu F, Merkulov GV, Milshina N,
Moore HM, Naik AK, Narayan VA, Neelam B, Nusskern D, Rusch
DB, Salzberg S, Shao W, Shue B, Sun J, Wang Z, Wang A, Wang X,
Wang J, Wei M, Wides R, Xiao C, Yan C, Yao A, Ye J, Zhan M, Zhang
W, Zhang H, Zhao Q, Zheng L, Zhong F, Zhong W, Zhu S, Zhao S,
Gilbert D, Baumhueter S, Spier G, Carter C, Cravchik A, Woodage
T, Ali F, An H, Awe A, Baldwin D, Baden H, Barnstead M, Barrow I,
Beeson K, Busam D, Carver A, Center A, Cheng ML, Curry L, Danaher S, Davenport L, Desilets R, Dietz S, Dodson K, Doup L, Ferriera
S, Garg N, Gluecksmann A, Hart B, Haynes J, Haynes C, Heiner C,
Hladun S, Hostin D, Houck J, Howland T, Ibegwam C, Johnson J,
Kalush F, Kline L, Koduru S, Love A, Mann F, May D, McCawley S,
McIntosh T, McMullen I, Moy M, Moy L, Murphy B, Nelson K, Pfannkoch C, Pratts E, Puri V, Qureshi H, Reardon M, Rodriguez R, Rogers
YH, Romblad D, Ruhfel B, Scott R, Sitter C, Smallwood M, Stewart E,
Strong R, Suh E, Thomas R, Tint NN, Tse S, Vech C, Wang G, Wetter
J, Williams S, Williams M, Windsor S, Winn-Deen E, Wolfe K, Zaveri
J, Zaveri K, Abril JF, Guigo R, Campbell MJ, Sjolander KV, Karlak B,
Kejariwal A, Mi H, Lazareva B, Hatton T, Narechania A, Diemer ,
Muruganujan A, Guo N, Sato S, Bafna V, Istrail S, Lippert R, Schwartz
R, Walenz B, Yooseph S, Allen D, Basu A, Baxendale J, Blick L, Caminha M, Carnes-Stine J, Caulk P, Chiang YH, Coyne M, Dahlke C, Mays
A, Dombroski M, Donnelly M, Ely D, Esparham S, Fosler C, Gire H,
Glanowski S, Glasser K, Glodek A, Gorokhov M, Graham K, Gropman B, Harris M, Heil J, Henderson S, Hoover J, Jennings D, Jordan C,
Jordan J, Kasha J, Kagan L, Kraft C, Levitsky A, Lewis M, Liu X, Lopez
J, Ma D, Majoros W, McDaniel J, Murphy S, Newman M, Nguyen T,
Nguyen N, Nodell M: The sequence of the human genome. Science 2001, 291:1304-1351.
Lander ES, Green P: Construction of multi-locus genetic linkage maps in humans. Proc Natl Acad Sci USA 1987, 84:2363-2367.
Marshfield Medical Center Genetics [http://research.marshfield
clinic.org/genetics/]
Dib C, Faure S, Fizames C, Samson D, Drouot N, Vignal A, Millasseau
P, Marc S, Hazan J, Seboun E, Lathrop M, Gyapay G, Morissette J,
Weissenbach J: A comprehensive genetic map of the human
genome based on 5,264 microsatellites. Nature 1996,
380:152-4.
Galperin MY: The molecular biology database collection: 2005
update. Nucleic Acids Res 2005:D5-24.
Li YJ, Oliveira SA, Xu P, Martin ER, Stenger JE, Hulette C, Scherzer
CR, Hauser MA, Scott WK, Small GW, Nance MA, Watts RL, Hubble
JP, Koller WC, Pahwa R, Stern MB, Hiner BC, Jankovic J, Goetz CG,
Mastaglia F, Middleton LT, Roses AD, Saunders AM, Welsh-Bohmer
KA, Schmechel DE, Gullans SR, Haines JL, Gilbert JR, Vance JM, Pericak-Vance MA: Glutathione S-transferase omega-1 modifies
age-at-onset of Alzheimer disease and Parkinson disease.
Hum Mol Genet 2004, 13:573.
Lobachev KS, Stenger JE, Kozyreva OG, Jurka J, Gordenin DA, Resnick MA: Inverted Alu repeats unstable in yeast are excluded
from the human genome. EMBO J 2000, 19:3822-3830.
Page 13 of 14
(page number not for citation purposes)
BMC Bioinformatics 2005, 6:95
31.
32.
33.
34.
35.
36.
37.
http://www.biomedcentral.com/1471-2105/6/95
Stenger JE, Lobachev KS, Gordenin D, Darden TA, Jurka J, Resnick
MA: Biased distribution of inverted and direct Alus in the
human genome: implications for insertion, exclusion, and
genome stability. Genome Res 2001, 11:12-27.
Duke Center for Human Genetics Software Repository
[http://wwwchg.duhs.duke.edu/software/index.html]
Download Ensembl Wiki web URL [http://www.ensembl.org/
Docs/wiki/html/EnsemblDocs/DownloadEnsembl.html]
Ensembl Anonymous FTP site [ftp://ftp.ensembl.org/pub/]
Ensembl installation instructions pdf file
[http://
www.ensembl.org/Docs/linked_docs/EnsemblInstall_29.pdf]
GZIP [http://www.gzip.org/]
WinZip Windows Archive Utility [http://www.winzip.com/]
Publish with Bio Med Central and every
scientist can read your work free of charge
"BioMed Central will be the most significant development for
disseminating the results of biomedical researc h in our lifetime."
Sir Paul Nurse, Cancer Research UK
Your research papers will be:
available free of charge to the entire biomedical community
peer reviewed and published immediately upon acceptance
cited in PubMed and archived on PubMed Central
yours — you keep the copyright
BioMedcentral
Submit your manuscript here:
http://www.biomedcentral.com/info/publishing_adv.asp
Page 14 of 14
(page number not for citation purposes)