1
ORTEC
®
Global Value 7
Productivity Add-On for GammaVision®
on Microsoft® Windows® 7/8.1 and XP® Professional
Software Version 7
User Manual
Printed in U.S.A.
ORTEC Part No. 931019
Manual Revision C
0314
Advanced Measurement Technology, Inc.
a/k/a/ ORTEC®, a subsidiary of AMETEK®, Inc.
WARRANTY
ORTEC* DISCLAIMS ALL WARRANTIES OF ANY KIND, EITHER EXPRESSED OR
IMPLIED, INCLUDING, BUT NOT LIMITED TO, THE IMPLIED WARRANTIES OF
MERCHANTABILITY AND FITNESS FOR A PARTICULAR PURPOSE, NOT EXPRESSLY
SET FORTH HEREIN. IN NO EVENT WILL ORTEC BE LIABLE FOR INDIRECT,
INCIDENTAL, SPECIAL, OR CONSEQUENTIAL DAMAGES, INCLUDING LOST PROFITS
OR LOST SAVINGS, EVEN IF ORTEC HAS BEEN ADVISED OF THE POSSIBILITY OF
SUCH DAMAGES RESULTING FROM THE USE OF THESE DATA.
Copyright © 2014, Advanced Measurement Technology, Inc. All rights reserved.
®
*ORTEC is a registered trademark of Advanced Measurement Technology, Inc. All other trademarks used
herein are the property of their respective owners.
NOTICE OF PROPRIETARY PROPERTY — This document and the information contained in it are the
proprietary property of AMETEK Inc., ORTEC Business Unit. It may not be copied or used in any manner nor
may any of the information in or upon it be used for any purpose without the express written consent of an
authorized agent of AMETEK Inc., ORTEC Business Unit.
Page 2 of 30
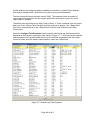
TABLE OF CONTENT
1
2
3
4
INTRODUCTION.................................................................................................................................. 6
GETTING STARTED ........................................................................................................................... 6
2.1
Installation ............................................................................................................................... 8
2.2
Initial GammaVision Configuration.......................................................................................... 9
2.2.1
B30Winds.ini File Configuration ............................................................................... 9
2.2.2
Sample Definition Files (SDF) Configuration ......................................................... 10
2.2.3
Acquisition Settings Configuration ......................................................................... 12
2.2.4
File Settings ........................................................................................................... 12
2.3
Microsoft Word and Excel Configuration............................................................................... 12
PROCESS OVERVIEW ..................................................................................................................... 13
3.1
GammaVision Process Overview ......................................................................................... 13
3.2
Global Value Process Overview ........................................................................................... 15
3.3
Global Value Interface Overview .......................................................................................... 18
ROUTINE GLOBAL VALUE OPERATIONS ..................................................................................... 20
4.1
Sample and QA Measurements ............................................................................................ 20
4.2
Analysis Data Review ........................................................................................................... 21
4.3
Quality Assurance Data Review ........................................................................................... 22
4.4
Add/Edit Users and Permissions .......................................................................................... 22
4.5
Change User Password ........................................................................................................ 22
4.6
Resetting the “Job Running” Flags ....................................................................................... 22
4.7
Repairing a Database Connection ........................................................................................ 22
4.8
Create Geometry Source Certificate from a Master Source Certificate ................................ 22
4.9
Add Detector to the Global Value Configuration ................................................................... 23
4.10
System Backup ..................................................................................................................... 24
4.11
Validating Critical Configuration Files ................................................................................... 24
4.12
Accessing Analysis Results for Custom Data Integration ..................................................... 24
4.13
Database Archive ................................................................................................................. 25
4.14
Changing the Analysis Engine for Measurements ................................................................ 25
4.15
Configuring Automation Jobs ................................................................................................ 26
4.16
Changing the QA Source ...................................................................................................... 29
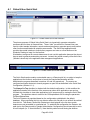
APPENDIX A – CONFIGURATION AND DATA MANAGEMENT PROGRAMS ........................................ A1
A.1
Global Value Quick Start ..................................................................................................... A2
A.2
Sample Administration ......................................................................................................... A9
A.3
Sample Publisher ............................................................................................................... A51
A.4
QA Administation ............................................................................................................... A58
A.5
QA Publisher ...................................................................................................................... A76
A.6
GVQASummary ................................................................................................................. A82
A.7
Analysis Log ...................................................................................................................... A83
A.8
GVDetectorMonitor ............................................................................................................ A85
A.9
Database Utility .................................................................................................................. A86
A.10
File Backup ........................................................................................................................ A87
A.11
File Compare ..................................................................................................................... A89
A.12
GVDataExport .................................................................................................................... A90
A.13
EFT Convert ...................................................................................................................... A91
Page 3 of 30
APPENDIX B – AUTOMATION JOB PROGRAM REFERENCE ............................................................... B1
B.1
GVSetUser & GVQASetUser ............................................................................................... B2
B.2
GVClearData ....................................................................................................................... B3
B.3
GVRecallSpectrum .............................................................................................................. B3
B.4
GVDeadTimeCheck ............................................................................................................. B4
B.5
GVTimerControl ................................................................................................................... B5
B.6
GVSampleData .................................................................................................................... B6
B.7
GVSampleDataPlus ........................................................................................................... B13
B.8
GVSampleDataSC ............................................................................................................. B27
B.9
GVSDFData ....................................................................................................................... B54
B.10
GVSetSDFParameter ........................................................................................................ B55
B.11
GVAskConfirm ................................................................................................................... B55
B.12
GVGetConfiguration........................................................................................................... B56
B.13
GV_GetRType ................................................................................................................... B57
B.14
GV_GetSiteUnit ................................................................................................................. B58
B.15
GV_GetBatch ..................................................................................................................... B58
B.16
GV_GetComment .............................................................................................................. B59
B.17
GV_GetGDTPressure ........................................................................................................ B59
B.18
GV_GetSamplePump ........................................................................................................ B60
B.19
GV_GetRWP ..................................................................................................................... B60
B.20
GV_GetRadMon ................................................................................................................ B61
B.21
GV_GetCustomData .......................................................................................................... B61
B.22
GV_GetRptData ................................................................................................................. B63
B.23
GVIncrementCounter ......................................................................................................... B64
B.24
GV_Custom_Rpt ................................................................................................................ B64
B.25
Print_Rpt ............................................................................................................................ B65
B.26
GrossGamma .................................................................................................................... B66
B.27
GVQAPeaks ...................................................................................................................... B66
B.28
GVQABackground ............................................................................................................. B67
B.29
GVQACheckStatus ............................................................................................................ B67
B.30
UfoToPbc ........................................................................................................................... B68
B.31
GVTemplateMaster ............................................................................................................ B69
B.32
GVCopyFile ....................................................................................................................... B70
B.33
GVOpenFile ....................................................................................................................... B71
B.34
GV_ResetInputs ................................................................................................................ B71
B.35
GVSpectrumMux ............................................................................................................... B71
B.36
GVGammaProductsChangeSample .................................................................................. B76
APPENDIX C – SUMMARY OF GLOBAL VALUE PROGRAMS ............................................................... C1
APPENDIX D – FIELD SIZE LIMITATIONS ................................................................................................ D1
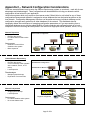
APPENDIX E – NETWORK CONFIGURATION CONSIDERATIONS ........................................................ E1
Page 4 of 30
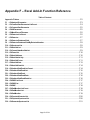
APPENDIX F – EXCEL ADD-IN FUNCTION REFERENCE ........................................................................F1
Appendix F Notes...............................................................................................................................F2
F1 - GVAnalysisParameter ..............................................................................................................F3
F2 - GVCustomDataParameterListCount.........................................................................................F4
F3 - GVCustomDataParameter ........................................................................................................F5
F4 - GVINIParameter .......................................................................................................................F5
F5 - GVMostRecentFilename...........................................................................................................F6
F6 - GVDetectorListCount ................................................................................................................F6
F7 - GVDetector ...............................................................................................................................F7
F8 - GVDetectorDatabasePath ........................................................................................................F7
F9 - GVDetectorDatabasePathByDetectorNumber ..........................................................................F8
F10 - GVSpectrumList........................................................................................................................F8
F11 - GVNuclideList ...........................................................................................................................F9
F12 - GVConsolidateNuclideList ........................................................................................................F9
F13 - GVParseList............................................................................................................................F10
F14 - GVNuclideName .....................................................................................................................F10
F15 - GVNuclideActivity ...................................................................................................................F11
F16 - GVNuclideFactor ....................................................................................................................F11
F17 - GVNuclideData .......................................................................................................................F13
F18 - GVNuclideDataList .................................................................................................................F14
F19 - GVUnidentifiedPeakListCount ................................................................................................F14
F20 - GVUnidentifiedPeakList ..........................................................................................................F15
F21 - GVUnidentifiedPeak ...............................................................................................................F15
F22 - GVUnidentifiedPeakData ........................................................................................................F16
F23 - GVUnidentifiedPeakDataList ..................................................................................................F16
F24 - GVRWPListCount ...................................................................................................................F17
F25 - GVRWPList.............................................................................................................................F17
F26 - GVRWP ..................................................................................................................................F18
F27 - GVRadMonitorListCount .........................................................................................................F18
F28 - GVRadMonitorList ..................................................................................................................F19
F29 - GVRadMonitor ........................................................................................................................F19
F30 - GVPopulateDetectorList .........................................................................................................F20
F31 - GVPopulateSpectrumList .......................................................................................................F20
F32 - GVGenerateSpectrumList.......................................................................................................F21
Page 5 of 30
1 INTRODUCTION
Global Value is a productivity add-on for GammaVision which is designed to transform the
standard gamma spectroscopy system into a state-of-the-art production environment with
automated measurement processes, custom reporting, quality assurance, and data management.
GammaVision’s built-in Job commands enable many basic tasks to be automated, but production
laboratories often require additional functionality to streamline processes and generate custom
reports. This functionality is provided by Global Value through a set of modules that are normally
run within the JOB process similar to standard JOB commands. In some cases, the Global Value
modules replace standard JOB commands and in others new functionality is added. For instance,
the analyst may be prompted for the sample description, decay date, and sample weight
individually using the standard GammaVision interface or by using one of Global Value’s
interfaces, which combines several inputs and the ability to calculate various parameters or
customize the interface. Global Value also provides modules to prompt for a User Login and
additional sample information unrelated to the analysis process which can be automatically
displayed on custom reports. Once the automation sequences are established using JOB files (or
Job Configuration Files and Job Templates) they are easily launched using Global Value’s Quick
Start program which provides a simple interface for navigating automation routines and active
processes.
After an analysis is performed using GammaVision’s analysis engines, key analysis parameters
are stored in the Global Value databases, and custom reports are automatically generated as text
or PDF files, displayed in Microsoft Word, or sent to the default printer. These reports are based
on simple text templates that are easily modified by system administrators. The Sample
Administration module provides the interface for performing electronic reviews and data
modifications in a secure environment complete with user names displayed on the final reports.
Some applications require data transfer to other systems or custom calculations which are beyond
the capability of the standard custom reports. Global Value features an Excel Add-In which
provides virtually unlimited capability for handling applications for customers familiar with
developing Microsoft Excel spreadsheets or Visual Basic for Applications (VBA) programs.
ORTEC also offers additional services to generate turnkey calculations and applications.
Global Value’s Quality Assurance (QA) module is intended to replace GammaVision’s built-in
functionality with a more comprehensive QA solution. Similar to the sample analysis processes
described above, Global Value’s enhanced QA module is completely automated using
GammaVision’s Job process. It includes custom reports, electronic data review, and embedded
user names. Unlike the standard GammaVision QA, Global Value’s QA data and charts are also
accessible from remote computers.
2 GETTING STARTED
Global Value simplifies routine gamma spectroscopy tasks – from spectrum acquisition and
analysis to custom reporting, data review, and report archival – in an automated and structured
manner to minimize the potential for error and enhance productivity. The default configuration and
automation routines are very flexible and are intended to meet a wide variety of applications.
Review Section 3 Process Overview which describes the primary functionality and objectives of
GammaVision and Global Value and how they work together to optimize counting lab processes.
Page 6 of 30
The primary differences in specific site installations will primarily be the reporting formats, custom
calculations, default data inputs, and electronic publishing routines.
The following steps describe the overall installation and operation process:
1)
If upgrading from a previous version ensure that the current configuration files have been
backed up prior to continuing.
2)
When configuring computers intended for spectrum acquisition and analysis automation
processes perform the following:
a. Ensure that GammaVision and CONNECTIONS are installed and operational.
b. Configure GammaVision in accordance with Section 2.2 to ensure proper
handshaking with Global Value.
3)
Install Global Value per Section 2.1 Installation.
IMPORTANT NOTE!
If upgrading from a previous version of Global Value or restoring databases
from a previous version the following MUST be performed:
4)
A.
After ensuring that no counting operations are in progress, open the
Sample Administration program and synchronize all databases. This
process will automatically update the database structure for compatibility
with the features available in this version of Global Value. Note that this
process can take several minutes with large databases, and the process
must be allowed to complete once it started to ensure that the structure is
fully updated.
B.
Open the QA Administration program with a connection to each QA
database. The database structure for this version of Global Value will
automatically be updated when the program opens.
Modify the default configuration as described in Section 3.3 and Section 4 to establish the
appropriate automation processes, as well as security, custom reporting, data integration,
Quality Control, and System Maintenance requirements. When installing Global Value as an
upgrade, the Global Configuration Files and Job Templates provided with the new installation
should be compared to the existing files to ensure that new functionality in the automation Job
programs is properly configured with the correct parameters. Generally, the best approach is
to start with the new Default Configuration Files and apply changes necessary to duplicate the
site specific requirements previously implemented. If desired, the system can be reconfigured
using one of the default data entry interfaces similar to a new installation rather than duplicate
the legacy automation routines as the new interfaces offer more functionality and options than
the previous versions.
Page 7 of 30
2.1
5)
Open the Quick Start program and verify operation by running the automation Jobs and
accessing any shortcuts established on the custom menu system.
6)
Review and optionally Publish analysis results from the Sample and QA Administration
programs, search for results using the Analysis Log, and monitor Detector and QA status by
running the applicable utility programs from the Quick Start menus.
Installation
NOTES
1) Installation normally requires a User account with Administrative
rights. In Windows 7 the option to “Run as Administrator” can be used
for the installation process if necessary.
2) Refer Section 2 for additional configuration steps to complete after the
program installation.
Start the installation by running the self-extracting installation program (i.e.
GlobalValueInstallation7.0.0.exe). This file is available from the installation disk and may be
stored on a network server or other location depending on the specific site configuration.
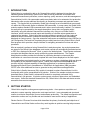
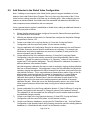
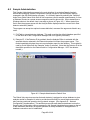
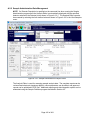
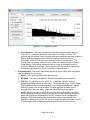
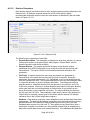
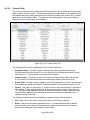
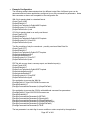
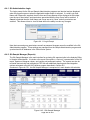
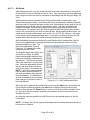
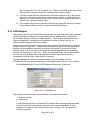
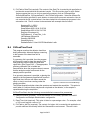
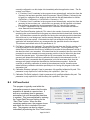
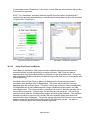
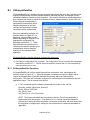
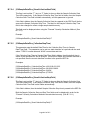
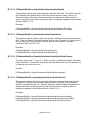
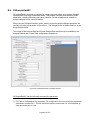
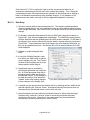
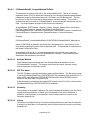
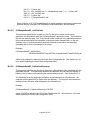
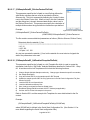
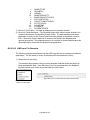
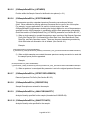
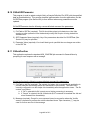
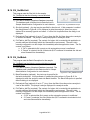
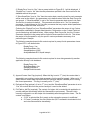
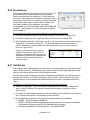
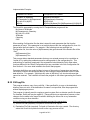
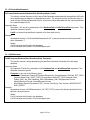
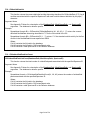
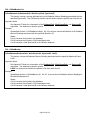
The dialog shown in Figure 2.1.1 will be displayed during the installation process to allow
different components to be installed.
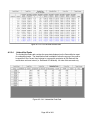
The “Program Files” option will install all of
the required programs for Global Value to
perform its intended functions.
Additional Program Files may optionally be
installed for Publishing Sample and QA data
(See Sections A.3 and A.5) and automating
system backup (See Section A.10) if the
default programs are desired. These options
should not be checked when Site Specific
Publisher or Backup processes have been
implemented.
Figure 2.1.1 Installation Component
Options
The “Default Configuration Support Files” should normally be installed with a new installation
to establish standard counting operations. This option provides a set of standard automation
routines for QA and Sample measurements using the three main data entry programs
offered with Global Value. Several routines are configured for use with a detector
configured as ID = 1 in GammaVision, and “DEMO” routines are available to demonstrate
Page 8 of 30
the processes using example spectra when no physical detector is configured on the
computer.
This option should not be selected when installing Global Value on subsequent computers
at a common site because the appropriate configuration is expected to be copied from a
previously established system or backup location, and additional configuration files (such as
Global Configuration Files) can result in unexpected behavior when running automation
processes from Quick Start.
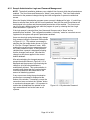
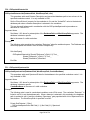
The Default Configuration Support Files are also
located on the installation disk.
2.2
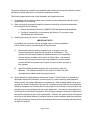
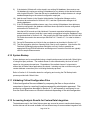
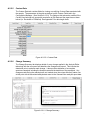
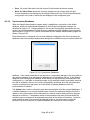
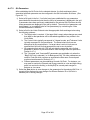
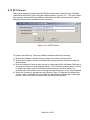
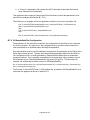
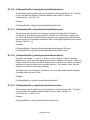
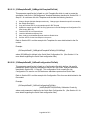
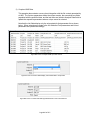
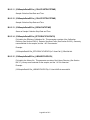
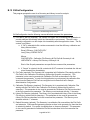
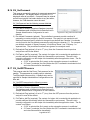
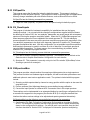
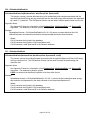
If the message shown in Figure 2.1.2 is
displayed after the installation has completed,
then select the “This program installed correctly”
option.
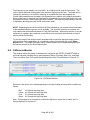
Initial GammaVision Configuration
Figure 2.1.2 Program Compatibility
Assistant
This section is only required when configuring computers intended for spectrum acquisition and
analysis automation processes. Computers configured for remote data access (i.e. data review,
configuration, etc., but not spectrum analysis) are not required to have GammaVision installed.
However, some operations on remote computers will still attempt to locate GammaVision as
part of the integrated validation process. To avoid error messages displayed if GammaVision is
not found a text file can be created with the name GV32.exe and stored anywhere on the local
computer. This file can then be selected if prompted by the Sample Administration program.
Prior to setting configuration parameters using Global Value, a few parameters must be
established in GammaVision to ensure that these programs interface properly. This requires
particular parameters to be set in the B30Winds.ini file (Global Analysis parameters), SDF files
(sample specific analysis parameters), Acquisition Settings for each detector, and File Settings
as described in the subsections that follow.
2.2.1
B30Winds.ini File Configuration
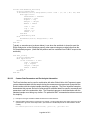
The B30Winds.ini file contains analysis settings that are used for every analysis performed in
GammaVision. This file is located in the GammaVision installation directory (C:\Program
Files\GammaVision or C:\Program Files (x86)\GammaVision) and can be modified using any
text editor such as Notepad. The GammaVision User Manual has details related to these
analysis settings, but a few parameters are discussed here due to the integration
requirements with Global Value.
Page 9 of 30
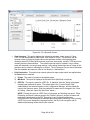
1) Item #19: (Save UFO File Flag must be set to “T”) – If this parameter is set to “F”, then
the .UFO file is deleted immediately after the analysis is completed. As described in
Section 3, Global Value loads some of the analysis information from this file, so it must be
available after the analysis is completed. The Peak Background Correction (PBC) files
and Analysis Results display in GammaVision and GVPlots also rely on information from
this file.
2) Item #27: (Print discarded peak table must be set to “T”) – This parameter ensures
that all unidentified peaks in Global Value are reported. The Discarded Peak table is the
list of peaks that are associated with a particular nuclide during the initial peak
identification but removed from consideration after the nuclide has been rejected for failing
a specified test (e.g., the Fraction Limit or Key Line test). These peaks are normally
reported in the Unidentified Peak list in Global Value, but the information is only available
if this flag is set to “T” (true).
3) Item #38: (Second MDA type, T=Calculate) – This parameter determines if MDA2 is
calculated and which calculation method is used. Normally, this method is set to Method 2
(Critical Level) and “T” (true). This MDA value provides additional sorting options for the
nuclide activity table on custom reports which can be useful for data evaluation when
using the Directed Fit option in the analysis settings. (See the custom report parameters
“|_NUC_<|” and “|_NUC_>|” in Section A.2.3.5.)
4) Item #42: (Print MDA in Nuclide Summary Flag should be set to “T”) – This parameter
determines if the MDA value will be displayed in the Nuclide Summary in addition to
nuclide activity. Note that MDA values may be optionally suppressed based on nuclide
flags set in the analysis library.
5) Item #58: (Regional Decimal Settings must be set to “T”) – This parameter determines
if the decimal separator from the Regional Settings in Control Panel will be used to report
numbers on the report, or if the decimal will be used for reporting numbers regardless of
the Regional Settings. As described in Section 3, Global Value parses some information
directly from the analysis report in addition to loading data from the UFO file and
spectrum, so the values on the report have to be interpreted as numeric based on the
operating system settings or an error will be generated.
2.2.2
Sample Definition Files (SDF) Configuration
The SDF files contain sample specific analysis settings which are applied to the analysis.
With the exception of the Sample Description and a few parameters specified in the
B30Winds.ini file, the SDF files can specify every analysis parameter required for an analysis
in GammaVision. These parameters may also be modified when automation Jobs are
executed based on analyst input/selection or parameters specified in the Job. All of the SDF
parameters are discussed in the GammaVision manual; however further discussion is
provided here to ensure compatibility with Global Value and discuss different options for initial
configuration and system maintenance.
Page 10 of 30
NOTE: The only parameter critical in setting up Global Value is on the Report tab as
specified in items 1 and 2 below. All other parameters may be set based on user preference
and the specific applications employed.
1) At a minimum, the following Reporting Options on the Report tab MUST be selected:
LIBRARY PEAK LIST and NUCLIDE ABUNDANCE. It is recommended that ALL
reporting options are checked. If the UNKNOWN PEAKS option is not selected, these
peaks will not be available in Global Value.
2) Global Value uses the ASCII text report generated by the GammaVision analysis engine
as one source of information. It parses this report and extracts the relevant information for
storage in the database and retains a copy of the full detailed report (minus signature
blocks) so it is available for review within the Global Value system. For this to occur,
Global Value and GammaVision must be configured such that GammaVision stores the
report files in a directory where Global Value knows to look for them. In GammaVision,
the path is set in the analysis options (SDF file) on the Report tab. The Output option
must be set to “File” along with the Global Value Analysis Report Path for the respective
detector. The path is normally set as part of the automation process using the
GVSetSDFParameter program (Section B.10) or using the standard GammaVision Job
command SET_SETTING along with a dynamically generated configuration parameter
generated by the Quick Start program. (See Section 3.3 which describes the typical
automation processes.)
3) The “Internal” option should be set for the LIBRARY and CALIBRATION parameters on
the Sample tab and the PEAK BACKGROUND CORRECTION parameter (if used) on the
Corrections tab.
By setting the Library, Calibration, and PBC file fields to “Internal”, these parameters can
be set by commands in the Job process either by prompting the user to choose a file or
by specifying the file without user input. If “Internal” is not selected, then the file specified
in the SDF file is always used for analysis regardless of any change implemented in Job
files or GammaVision’s menu selections.
Using the “Internal” option for the calibration file also allows the Energy, FHWM, and
Efficiency calibrations to be loaded from separate files. For example, the Energy/FWHM
calibration may be frequently updated (i.e. as part of a daily calibration routine) while the
efficiency calibration is loaded from files that are updated less frequently.
4) The appropriate DECAY CORRECTION options on the Decay tab should be set for each
type of sample. Generally, this requires a dedicated SDF file for decay during collection in
which all decay options are applied and for background counts and other types of samples
where no decay corrections are applied. When using Global Value’s Sample Data
modules (GVSampleData, GVSampleDataPlus, and GVSampleDataSC), the default dates
in the data entry prompts can be set to the current date/time, the current date only, or a
specified date/time. The default date/time in the SDF files are not important because
these fields are automatically updated, but the option to apply the decay corrections must
be specified in advance. (Note that the decay correction options can be modified using
Page 11 of 30
the SET_SETTING GammaVision Job command, but this method may not be suitable for
all of the automation process available with Global Value.
5) None of the options on the Isotopes tab are necessary when using Global Value. These
parameters are easily calculated with the Global Value custom report summaries using
Adjustment Factor tables with more formatting flexibility than offered on the standard
GammaVision report.
2.2.3
Acquisition Settings Configuration
1) Spectrum names are usually created dynamically from configuration parameters
generated by the Quick Start program, so the options in the Start/Save/Report section
are not used with Global Value.
2) The Group Acquisitions section should normally be set to “Current MCB”.
3) All items in the Ask on Start Options section should be unchecked to avoid conflicts with
data entry prompts specified in the Global Value automation processes.
2.2.4
File Settings
On the GENERAL tab accessed from the menu “File\Settings” set the following items:
1) Save File Format = Integer SPC
2) All items in the Ask on Save Options section should be unchecked.
2.3
Microsoft Word and Excel Configuration
(Note that these instructions are for 2007 – 2013 versions and may differ for other versions.)
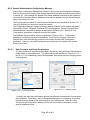
The default paragraph properties in Microsoft Word may need to be adjusted to ensure that the
report displays properly as follows:
1)
Open Paragraph Properties from the Ribbon and set the following parameters:
a. In Spacing section, set Before and After to 0 pts.
b. Line Spacing = Single
2)
Select “Save As Default” at the bottom of the Paragraph Properties dialog.
3)
Select the option “All Documents based on the Normal.dotm template?” then select OK.
Security may need to be adjusted in Microsoft Excel to allow the macros to run automatically.
This is most easily accomplished by adding a trusted location as follows:
1)
Open the “Trust Center” (File\Options, then Trust Center on the left panel)
2)
Open “Trust Center Settings” from button on the lower right of the Trust Center dialog.
3)
Select “Trusted Locations” on the left panel of the Trust Center Settings dialog.
4)
Select the Add New Location button.
5)
Browse to the root directory where Global Value Excel files are located (typically
C:\User). Ensure that the “Subfolders of this location are also trusted” checkbox is
checked.
6)
Select OK at each of the Trust Center and Excel Options dialogs to back out to the main
Excel interface.
Page 12 of 30
3 PROCESS OVERVIEW
Global Value is an add-on product to GammaVision so it is important to understand a few details
about GammaVision to help clarify how these products work together to improve data management
and productivity.
In the simplest of terms, GammaVision’s core purpose is to acquire and analyze high resolution
spectra while Global Value manages the data and automation processes. These functions are
described in more detail in the remainder of this section.
3.1
GammaVision Process Overview
GammaVision provides the functions necessary for hardware control, calibration, library and
analysis configuration, and automation to support its primary objective of spectrum analysis.
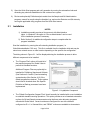
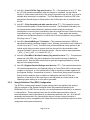
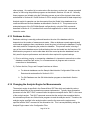
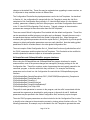
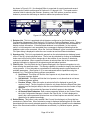
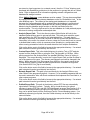
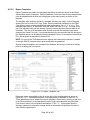
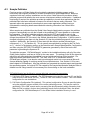
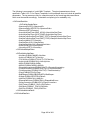
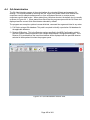
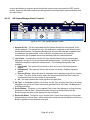
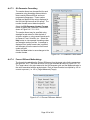
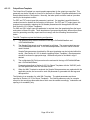
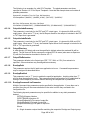
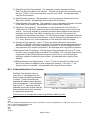
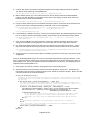
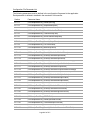
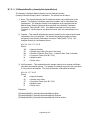
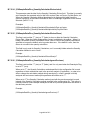
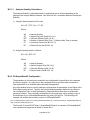
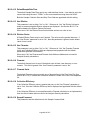
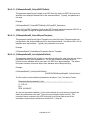
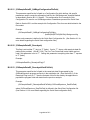
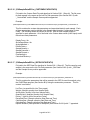
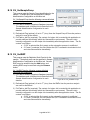
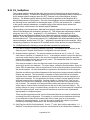
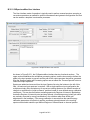
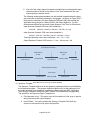
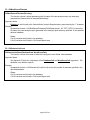
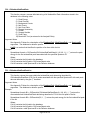
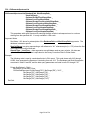
The main inputs and outputs of this analysis process are shown Figure 3.1.1 followed by a brief
explanation of each parameter. Refer to the GammaVision User Manual for additional detail
regarding spectrum analysis and the functions required to establish these input parameters.
D
E
C
B
A
F
Figure 3.1.1 GammaVision Process Overview
A)
The Spectrum is the acquisition data received from an instrument. It contains the channel by
channel histogram, hardware and acquisition settings, and several other analysis parameters.
GammaVision may acquire the data directly from a detector or load a previously saved spectrum
file for analysis.
B)
The Analysis Settings includes all of the peak-search parameters, decay correction options,
reporting options, nuclide corrections, and other analysis parameters. These parameters are
managed in the B30Winds.ini file for global parameters used by all analyses and the Sample
Definition Files (SDF) files which contain parameter settings for specific analysis types. The
parameters set in the SDF file can also be overridden by menu or Job commands as applicable.
Page 13 of 30
C) The Calibration establishes the channel/energy relationship (energy calibration), expected peak
shapes at different energies (FWHM calibration), and the detector efficiency at specified energies
(efficiency calibration). The calibration process is has been simplified using the automation
wizard built into GammaVision. Simply load a calibration spectrum, library with appropriate
energies, and an efficiency table containing the source assay information to generate all three
calibrations.
D) The Library associates specific energy peaks with appropriate nuclides such that each nuclide
has a signature for identification. The library also contains information such as nuclide half-life,
peak abundance, and various peak and nuclide flags used for activity calculations and reporting
options.
E)
The Peak Background Correction (PBC) file is structured similar to a nuclide library. Instead of
peak abundances, it contains peak count rates which can be subtracted from a sample count to
eliminate the contribution to peaks from background or a blank. Various other corrections, such
as Attenuation or Geometry, can also be applied based on the analysis settings, but PBC is
mentioned here because Global Value normally manages the generation of these files as
described in Section 3.2.
F)
The following output files files are created by the analysis engine:
Spectrum (.An1): This file contains all of the original spectrum data plus the analysis settings
and calibration data used for analysis.
Analysis Report (RPT): This file is an ASCII text report that displays most of the information
available in the UFO file in a readable form. The format depends on the reporting options and
engine used for the analysis as described in the GammaVision manual.
Unformatted Output file (UFO): This file contains the analysis results, including peak and
nuclide information, in a binary format, and is used to create PBC files and display analysis
results in GammaVision and GVPlots.
GammaVision automation is accomplished using simple text files called “Jobs” with commands that
allow users to automate many of the menu functions and run external programs. These Jobs provide
a structured process for consistent and reliable analysis results by limiting the decisions required by
the analyst at the time of measurement. For example, most analysis parameters can be preconfigured for a particular measurement by an administrator such that the analyst only has to enter
information that changes with each sample like the sample size, collection time, etc.. When using
Global Value the automation Jobs are dynamically created by the Quick Start program as described
in Section A.1 to simplify and optimize automation far beyond the GammaVision basics.
Page 14 of 30
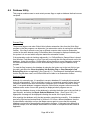
3.2
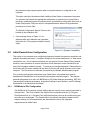
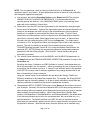
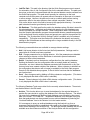
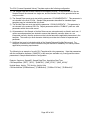
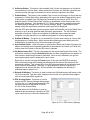
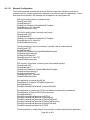
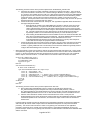
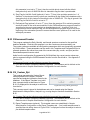
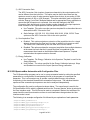
Global Value Process Overview
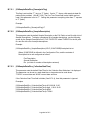
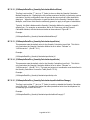
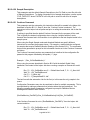
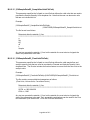
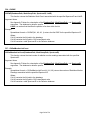
Global Value extends GammaVision automation and spectrum analysis with tools to efficiently
capture sample and analysis data, as well as manage the results in a secure electronic
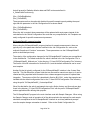
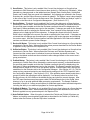
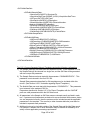
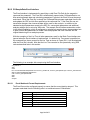
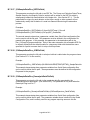
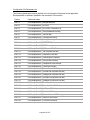
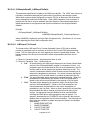
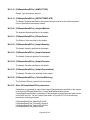
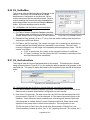
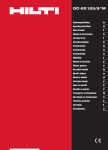
environment. An outline of this process is shown in Figure 3.2.1.
F
A1
A7
G
A4
A3
A5
E
A6
A2
D
C
H
A2
C1
B
B1
Figure 3.2.1 Global Value Process Overview
Page 15 of 30
Global Value stores analysis results and QA data in protected databases that are intended for
access only through the program interfaces. Global Value keeps track of any changes applied to
data in the databases for audit trail capability, but it also provides the ability to export data to a
non-secure environment for additional processing.
A)
Global Value uses the Job process in GammaVision to automate sample measurements. This
process is initiated from the Quick Start program which dynamically creates Job from Job
Templates and Configuration Files as described in Section A.1. Global Value provides several
programs that are run within Jobs to collect and store sample information, load analysis results
into databases, generate reports, etc.. These programs are described in Appendix B, and are
shown in the Figure 3.2.1 process as “AX”, where X is a numeric value.
A1)
Analysis Data programs are used to modify or set the analysis parameters used for
analysis such as the decay time, sample size, calibration, library, and many other
parameters.
A2)
Non-Analysis Data programs are used to modify or set parameters that are not used in
the analysis process such as the current user name, sample comments, and other
information related to the sample. These programs are also used to set or update
database flags and generate/print analysis reports.
A3)
The GVGetRptData program retrieves analysis information for samples from the
Spectrum, Analysis Report, and UFO file, and stores a copy of the analysis report in the
analysis database.
A4)
The GVQABackground program retrieves analysis information for background QA
measurements from the Spectrum, Analysis Report, and UFO file, and stores a copy of
the analysis report in the QA database. This program also generates the Background QA
report based on settings established in the QA Administration program, and optionally
renders it in various formats.
A5)
The GVQAPeaks program retrieves analysis information for QA source measurements
from the Spectrum, Analysis Report, and UFO file, and stores a copy of the analysis
report in the QA database. This program also generates the QA report based on settings
established in the QA Administration program, and optionally renders it in various
formats.
A6)
Non-Analysis QA programs are used to set the current user for QA measurements or
check the detector QA status when measuring samples.
A7)
The UfoToPBC program dynamically creates a background correction file based on the
analysis results. This program is normally used in conjunction with the Background QA
measurements, but can also be used to create background correction files associated
with Blank measurements.
Page 16 of 30
B)
The Sample Administration program contains the Configuration Editor where Detector
parameters, Adjustment Factors, Report Templates, and other configuration parameters are
managed, as well as the Analysis Editor for electronic data review. (See Section A.2).
B1)
C)
The GVPublishSample program is executed when Publishing samples from the Analysis
Editor to generate data files in PDF, Text, XML, or CSV formats and run custom programs
for additional processing of this data. The GVPublishSample program can also be run
through automation jobs. (See Section A.3)
The QA Administration program contains QA charts, a Lab Notebook, QA Limits, and reporting
options, as well as the QA Sample Manager for electronic data review. QA data can also be
exported to Excel for additional evaluation with preformatted statistics and charts. (See Section
A.4).
C1)
The GVPublishQA program is executed when Publishing samples from the QA Sample
manager to generate data files in PDF, Text, XML, or CSV formats and run custom
programs for additional processing of this data. The GVPublishQA program can also be
run through automation jobs. (See Section A.5)
D) The GVDataExport program is used to copy analysis records from the secure Global Value
databases, which store analysis data from a single detector, to a non-secured Access database
that can store results from multiple detectors. (See Section A.12)
E)
The GVDatabaseUtility program can repair corrupted databases and reset automation Job flags
when the Quick Start program or GammaVision is terminated abnormally. (See Section A.9).
F)
The EFTConverter program creates geometry specific efficiency tables (source certificates) from
a Master Source certificate file to quickly generate new tables based on the quantity or fraction of
source material used in each geometry. (See Section A.13)
G) The GVSpectrumMux program enables spectrum summing capability with several options,
including changing the conversion gain and calibration parameters. (See Section B.35)
H) The Excel Add-In provides the functions to retrieve any of the sample data stored in the Global
Value databases as well as various configuration parameters such as nuclide adjustment factors
and detector file paths. These functions can be used to populate worksheet cells similar to the
standard Excel functions, like AVERAGE or SUM, allowing complex post-analysis calculations to
be automated. These functions can also be used in VBA code to allow fully automated
processing scripts, similar to those used for the Analysis Log. (See Appendix F)
Page 17 of 30
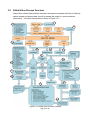
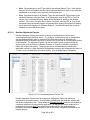
3.3
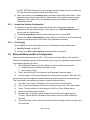
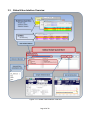
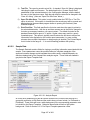
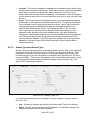
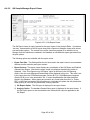
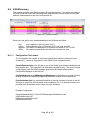
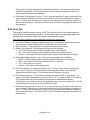
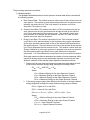
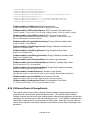
Global Value Interface Overview
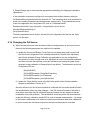
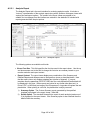
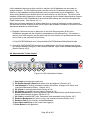
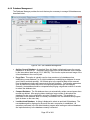
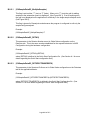
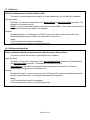
Figure 3.3.1 Global Value Interface Overview
Page 18 of 30
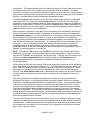
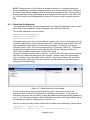
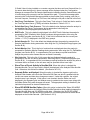
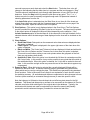
As shown in Figure 3.3.1, the Quick Start program is the main launch pad for Global Value
automation jobs and support applications on measurement computers. It provides links to the
Sample and QA Administration programs, configurable menu links to other programs or files,
and dynamically creates and runs automation Jobs for sample measurements for the selected
detector. Note that remote computers typically do not run the automation Jobs for sample
measurements, so the other support applications are normally run directly from Window’s
shortcuts.
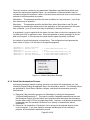
The measurement process for samples and QA is very simple. Simply select the detector from
the drop down list, open the applicable folder in the Automation Groups section, and then click
on the desired Automation Job. The Quick Start program creates the automation Job and then
runs it in GammaVision where the user is prompted for additional information or action as
required.
The process of creating automation Jobs is based on merging Job Templates (which define the
process) with Configuration Files (which contain the value of parameters to use in the process)
as described in Sections A.1 and B.31. A typical sample measurement Job Template would
follow a process similar to the following:
Set detetctor, Stop, clear etc….(Standard Gamma Vision commands).
Check Quality Assurance (QA) Status (Optional).
Prompt for User Login (Optional).
Copy a Sample Default File (SDF) template to a detector specific file in the TEMP directory.
Change various default parameters within the TEMP SDF.
Prompt for Sample data using GVSampleData, GVSampleDataPlus, or GVSampleDataSC
programs and load the updated TEMP SDF file into GammaVision.
7. Clear temporary data associated with any previously canceled measurements from the
Database so this data doesn’t get associated with the current sample.
8. Load the Energy, FWHM, and Efficiency Calibrations, as well as the Library.
9. Prompt for Optional Non-Analysis Input data such as Radiation Work Permits, Radiation
Monitor Readings, Comments, etc..
10. Load the Peak Background Correction File.
11. Wait until the acquisition has completed, then Save the Spectrum and Analyze.
12. Update the Daily, Monthly, and Annual counter registers in the Global Value detector
database.
13. Load the spectrum analysis results from the text report, spectrum, and UFO file to the Global
Value Database
14. Create the Custom Report Summary based on the specified Report Template.
15. Optionally print the report or save to one of the supported formats.
16. Open a predefined Excel workbook to automate further calculations or reports based on the
current analysis results.
17. Run the Sample Publisher program to generate additional reports in the supported formats
and run custom programs.
1.
2.
3.
4.
5.
6.
Page 19 of 30
The Default Configuration Files contain several Job Templates that can be used for routine
measurement processes or as a starting point for configuring automation processes tailored to a
specific application. These files can be found in the C:\User\GVCR\Job Templates directory.
The Default Global Configuration Files contain the predefined parameters that are used with the
default Job Templates. These files can be found in the C:\User\GVCR\Configuration Files
directory. Changes to Global parameter settings should be made in the file 0_SiteSpecific.cfg to
override the standard settings with those desired for a specific site configuration.
Additional configuration parameters are provided in each Job Configuration file that is selected
from the Quick Start interface to initiate the automation process. Any of the global configuration
parameters can be overridden by setting them in the Job Configuration files.
The best way to fully understand how automation jobs are rendered by merging Job Templates
and Configuration files is to run an automation routine from Quick Start. After the Job is started,
then compare the Job content (X_Run.job or X_RunReanalysis.job in the C:\User\GVCR
directory) to the Job Template content and replacing the parameters in the Job Template with
those defined in the GVQuickStart.cfg or GVQuickStartReanalysis.cfg files in the C:\User\GVCR
directory. These configuration files contain the content from the Job Configuration File, Quick
Start program, and Global Configuration Files as described in Section A.1.
4 ROUTINE GLOBAL VALUE OPERATIONS
4.1
Sample and QA Measurements
Instrument checks and sample measurements are performed from the Global Value Quick Start
program by selecting the applicable Detector, Automation Group, and Automation Job. The
automation Job is created and run in GammaVision as described in Section 3.3 and Appendix
A.1, and an item is added to the Active Jobs list on the Quick Start window.
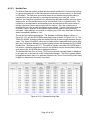
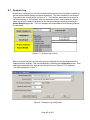
Quality Control and Instrument Background measurements are typically performed at a fixed
interval – often daily for instrument performance and as infrequently as weekly or monthly for
background measurements depending on site requirements. The process used for Quality
Control checks can include an automatic energy calibration or gain stabilization with AS FOUND
and AS LEFT measurements, or no adjustments at all based on the required protocol.
Background measurements include spectrum analysis, which can be used for detection limit
verifications, and optionally create background correction files automatically. If any QA
parameter is outside of the acceptance limits then some of the fields on the Quick Start program
will be color coded in yellow (out of tolerance) or red (out of control) as applicable. Example
processes for each of these options are available in the Default Configuration Files which can
be optionally installed or accessed from the installation disk.
Page 20 of 30
Sample measurements typically follow the process described in Section 3.3 using
GVSampleData, GVSampleDataPlus, or GVSampleDataSC, as well as other programs, to
collect sample and analysis information. Spectrum reanalysis follows the same process except
that a spectrum is chosen for reanalysis at the start of the automation process rather than
acquiring data from an instrument.
Example measurement processes using each of the main data entry interfaces are provided in
the Default Configuration Files which can be optionally installed or accessed from the
installation disk. The choice of interface for most applications can be summarized as follows:
4.2
GVSampleData: This interface is useful for very basic sample data inputs or custom
interfaces developed in Excel. These processes typically require multiple user prompts to
capture all of the necessary parameters for a measurement, but also can be configured
such that the analyst enters as little data as possible and cannot change key analysis
parameters defined for the process chosen. See Section B.6 for additional information.
GVSampleDataPlus: This interface extends the data input capabilities to include
calculations for sample volume based on flow rate and collection time, or conversion of
measured sample units to different analysis units based on correction factors (i.e. Wet vs
Dry weight ratios). This program can perform many of the basic calculations that in early
versions of Global Value would have required the Excel interface in a more streamlined
manner. See Section B.7 for additional information.
GVSampleDataSC: This interface can be used with Sample Changers or individual sample
measurements. It uses the concept of Analysis Methods, which define the default
parameters for various types of sample measurements, and allows setting all of the required
analysis parameters, including sample volume calculations similar to GVSampleDataPlus
and custom data fields, in one interface. The custom data fields can be used to capture
manual input data or sample information that was previously loaded into an information
management systems to minimize data entry errors. For typical measurement processes,
this interface is typically chosen as the default. See Section B.8 for additional information.
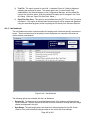
Analysis Data Review
Analysis data for samples measurements is reviewed from the Sample Administration program
which is accessed from the Samples button on the Quick Start program or directly from
Window’s shortcuts (for remote access computers). This program provides the ability to review
and modify analysis reports with tracking capability (if authorized based on the user security
settings). Reports can also be published for automated integration with document control and
other data storage systems. See Section A.2.2 for additional information related to data review
and Section A.3 for information related to the publishing options.
Page 21 of 30
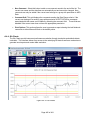
4.3
Quality Assurance Data Review
QA data is reviewed from the QA Administration program which is accessed from the QA button
or menus configured on the Quick Start program, or directly from Window’s shortcuts (for
remote access computers). This program provides data trends, electronic review and
publishing of the QA reports, capturing comments in the Lab Notebook, adjusting the QA
parameters and limits, and database management functions. See Section A.4 for additional
information related to data review and Section A.5 for information related to the publishing
options.
4.4
Add/Edit Users and Permissions
1) Add/Edit Users and Permissions as described in Section A.2.3.1.
2) Synchronize all Global Value databases as described in Section A.2.3.9.
4.5
Change User Password
1) Users can change their own password as described in Section A.2.1.
2) If a user forgets their password, then it can be reset as described in Section A.2.3.1, and
then changed per Section A.2.1.
4.6
Resetting the “Job Running” Flags
If GammaVision is terminated abnormally after an automation Job is started by the Quick Start
program, then flags in the database that specify when Jobs are active may not get reset. This
condition will be evidenced by a message that indicates that a Job is currently in process for a
detector that is not actually running a Job. This condition can be corrected using the Database
Utility as described in Section A.9.
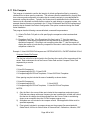
4.7
Repairing a Database Connection
Under rare circumstances a database connection may be abnormally terminated while data is
being written to the database. If this occurs the Global Value applications may not be able to
restore a connection and a series of errors will be displayed when attempting to run the
application. This condition can be corrected by running the Database Utility program as
described in Section A.9.
4.8
Create Geometry Source Certificate from a Master Source Certificate
When sources are prepared from a common master supply (i.e. a liquid vial), the source
certificates for the individual geometries are easily generated after creating a source certificate
for the master source in GammaVision. This processes is accomplished using the
GVEFTConvert program as described in Section A.13.
Page 22 of 30
4.9
Add Detector to the Global Value Configuration
Note: If adding a new computer to the Global Value system to support installation of a new
detector, then install Global Value (Program Files only), then copy the content of the C:\User
folder from an existing computer to the new one as a starting point. After configuring the new
detector as described below, then folders and files associated with detectors controlled from
other computers can be deleted from the new computer.
Once a gamma detector system is established in Global Value, adding an additional detector is
a relatively easy task as follows:
1)
Ensure that the detector has been configured for use with GammaVision as specified in
the GammaVision User Manual.
2)
With the new detector window active in GammaVision configure the Acquisition Settings
as specified in Section 2.2.3.
3)
Create a new folder in the root Job directory (C:\User\Job\ if using the Default
Configuration) with the name DetX (where X is the detector number).
4)
Copy the applicable Job Configuration files from an existing detector to the new Detector
Job folder, and make detector specific modifications as necessary. For example, the
Window size and position parameters may need to be modified (if used), and the QA
source information may be different.
5)
Create calibration files in the calibration directory (C:\User\Cal\ if using the Default
Configuration) using the same naming convention as existing calibration files for other
detectors. Typically, the naming convention is X_Geometry_Y where X is the detector
number and Y is the position designator. The only difference in calibration file names for
different detectors is the detector number.
Note that temporary calibration files may be used for testing by copying existing calibration
files from a different detector. If this approach is used, then the calibration files should be
copied by opening the calibration file within GammaVision and then saving each file to the
new detector file name. This is required because GammaVision retains a copy of the file
path internally, and copying these files outside of GammaVision (i.e. using Windows
Explorer) will result in unexpected results. The most notable issue when copying
calibration files outside of GammaVision is that the calibration file path shown on the
analysis report will be the same as the analysis spectrum path instead of the actual
calibration file path. When this occurs, the default geometry option in any of the Global
Value program interfaces will be blank when running the re-analysis automation
processes.
6)
Create a calibration file in the Energy calibration director (C:\User\Cal\Energy\ if using the
Default Configuration) with the name X_Energy.clb (where X is the detector number).
This calibration file can be copied from an existing file used for another detector without
any additional changes required.
7)
Create a new folder in the root Spectrum directory (C:\User\SPC\ if using the Default
Configuration) with the name DetX (where X is the detector number).
8)
Create a new Detector database by copying the file “GlobalValue1.md_” from the Default
Configuration to the desired location using a naming convention similar to existing detector
databases (i.e. GlobalValueX.mdb, where X is the Detector number).
Page 23 of 30
9)
If the detector QA data will not be stored in an existing QA database, then create a new
QA database by copying an existing QA database for any detector to the desired location
with a logical file name. Note that QA can be established for multiple detectors in a single
database depending on the network configuration employed.
10)
Add the new Detector in the Sample Administration Configuration Manager on the
Detectors tab as described in Section A.2.3.2, and then Synchronize changes to all
existing databases.
11)
If the QA Database established was a copy of an existing QA database, then delete any
detectors configured in the database other than those required for the new configuration
as described in Section A.4.6.
Note that all QA records and Lab Notebook Comments associated with detectors to be
deleted must be removed, and this is most easily accomplished using the Database Purge
process described in Section A.4.8. After purging the QA Data records, the QA Limits and
QA Points also need to be removed per Sections A.4.7.2 and A.4.7.1 in order to delete a
detector.
12)
Set up QA Parameters and Limits for the new detector as described in Section A.4.7.
13)
Test the automation jobs from Opening Quick Start to verify operation. Note that the QA
Peak and QA Background processes should be run first in order to establish an
appropriate Energy/FWHM calibration and Background Correction file which are typically
used for sample measurements.
4.10 System Backup
System backups can be accomplished using a simple batch process included with Global Value
or using third party software. The method chosen is often determined by the level of local IT
support or site personnel experience. Regardless of the method chosen it is important to
ensure that all Global Value applications are closed – including any that could be running with
remote database connections prior to initiating the backup process.
Refer to Section A.10 for details related to configuring and running the File Backup batch
process provided with Global Value.
4.11 Validating Critical Configuration Files
Critical configuration files are validated by comparing the files on the production
computers to those in a read-only location managed by administrative personnel. This
process is configured as described in Section A.11, and normally is configured to run
from the Quick Start menus or Window’s shortcuts depending on the site configuration.
4.12 Accessing Analysis Results for Custom Data Integration
The databases used in the Global Value system are secured to prevent unauthorized changes,
but the data can still be made available in a few different ways to accommodate integration with
Page 24 of 30
other systems. One method is to create various file structures, such as text, comma-separated
values, or XML using the publisher programs as described in Sections A.3 and A.5. Normally,
these programs are initiated using the Publishing process as part of the electronic data review
as described in Sections A.2.2 and Sections A.4.2 for analysis results and QA data respectively.
Analysis results for samples can also be exported from the Global Value databases to an
unsecured Microsoft Access database as described in Section A.12. This process can be
automated as part of the GVPublishSample configuration by using the RUN commands
described in Section A.3.1, launched from custom site applications, or used in the manual
interactive mode.
4.13 Database Archive
Database archiving is normally performed based on the size of the database which is
dependent on the number of measurements made. When a database exceeds approximately
one hundred megabytes then consideration should be given to Archiving the database, Purging
older data, and then Compacting the production database. This process results in having a
copy of the current database as an Archived backup that can be loaded into the Sample or QA
Administration programs to review older data while the current production databases remain
fairly small to improve performance and reduce the time required for system backups.
1) Prior to archiving, purging, or compacting a database it is important to ensure that no other
database connections are active (i.e. no measurements in progress and no remote
connections to the database).
2) Perform Archive, Purge, and Compact functions as follows:
a. For detector databases use the Sample Administration Configuration Editor on the
Detectors tab as described in Section A.2.3.2.
b. For QA Databases use the QA Administration program as described in Section
A.4.8.
4.14 Changing the Analysis Engine for Measurements
The analysis engine is specified in the GammaVision SDF files which are loaded by various
processes depending on the automation processes implemented. Typically these automation
processes use the WAIT “ENG” command after the spectrum analysis where “ENG” is the name
of the analysis engine. This WAIT command ensures that the analysis has completed before
the automation process runs Global Value programs to read the analysis results. Therefore, the
analysis engine specified in the analysis options must be the same as the engine name
specified with the WAIT command in the automation Job. This is accomplished by setting the
Analysis Engine name in the Configuration Files.
Page 25 of 30
When using the default configuration files, the analysis engine name is specified in the global
configuration file “3_GammaVisionFunctions.cfg” which can be found in the directory
“C:\user\GVCR\Configuration Files\”. The parameter name is |AnalysisEngine|, and this
parameter is used in conjunction with the |Analyze| parameter as follows: (Review Section A.1
for details related to Job Templates and Configuration parameters.)
|AnalysisEngine|= Env32
|Analyze|= Analyze|CrLF|Wait |AnalysisEngine|
This parameter is set globally because the same analysis engine is typically used for all
measurements within a particular site configuration. However, if a different analysis engine is
desired for specific measurements, then the |AnalysisEngine| parameter can be set in the Job
Configuration file to override the global setting. It is critical to ensure that the analysis engine
specified in the automation process matches the name used in the analysis options under all
circumstances.
Note: If the analysis engine must be changed globally, then it may be desirable to copy the
|AnalysisEngine| parameter to the file 0_SiteSpecific.cfg so that site specific changes to global
configuration parameters are more easily identified.
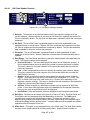
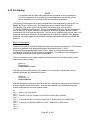
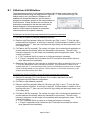
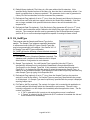
4.15 Configuring Automation Jobs
Several automation processes for sample and QA measurements are available in the Default
Configuration Files to accommodate most standard processes. These processes are grouped
by the sample data interface program (GVSampleData, GVSampleDataPlus, and
GVSampleDataSC) and QA.
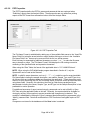
As described in Section A.1, Job files are created and run from the Quick Start program by
combining Job Configuration files with Job Templates. The Job Templates define the
automation process and are stored in the directory “C:\User\GVCR\Job Templates”. Each of the
default Job Templates use a prefix that defines the interface type followed by a description of
the process. For example, GVSampleData_Acquisition.jtp is used for measurements
associated with data acquisition when using the GVSampleData program interface, whereas
GVSampleData_Reanalysis.jtp is used for spectrum reanalysis processes. Other Job Template
files will use the GVSampleDataPlus, GVSampleDataSC, QABkgd, or QAPeak prefixes.
Within the Job Templates various piped parameters are used as placeholders for the actual
code that gets rendered in the final Job file. These parameters must be defined in the
configuration files for this process to work correctly. All of the parameters specified in the
default Job Templates have been validated at the factory so these are known good starting
points for initial system configuration. If the process must be modified, then a copy should be
made with an appropriate naming convention (i.e. use the site name as a prefix) to avoid
Page 26 of 30
changes to the default files. These files may be replaced when upgrading to newer versions, so
it is important to keep modified versions in different files.
The Configuration Files define the piped parameters used in the Job Templates. As described
in Section A.1, the configuration file merged with the Job Template to create the Job file is
comprised of Job Configuration files (normally in C:\User\Job\DetX where X is the detector
number), parameters created by the Quick Start program, and Global Configuration files located
in the “C:\User\GVCR\Configuration Files” directory. Typically, changes to the automation
processes are managed in these files rather than the Job Templates.
There are several Global Configuration Files installed with the default configuration. These files
can be opened and modified using any text editor such as Notepad. Normally there are only a
few parameters that are modified within the Global Configuration files. When changes are
necessary the applicable parameters should be copied the file 0_SiteSpecific.cfg so that specific
changes to global configuration parameters are more easily identified. Note that setting global
parameters in this file overrides those in the other global configuration files.
The most complex Global Configuration file is 4_GlobalValueFunctions.cfg which defines all of
the “RUN” parameters used throughout the Job Templates. This file should not be modified to
avoid the potential for adverse impact on all automation processes.
GVSampleData and GVSampleDataPlus program interfaces
When using the GVSampleData and GVSampleDataPlus program interfaces for sample
measurements, most of the process changes are managed by changing settings in the Job
Configuration files. These files contain a series of parameters that are logically named for the
command, program, or function with which they are linked. For example, the following
parameters can be found in a Job Configuration file used with the GVSampleData program
interface:
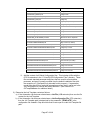
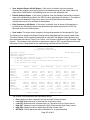
|GVGetSampleData_SampleDescription|=FILE: |CONFIGDIR|DescriptionsList_Examples.txt
|GVGetSampleData_DecayDate|=Now
|GVGetSampleData_Quantity|=1
|GVGetSampleData_QuantityUnits|=ml
|GVGetSampleData_QuantityUnitsEnabled|=F
|GVGetSampleData_LiveTime|=1000
The prefix for each parameter is common to the program, and the suffix is associated with the
command line arguments as described for each program in Appendix A and B. Additional
parameters may be specified in the Global Configuration files, and rarely require changes.
The main “RUN” program parameters are often included in the Job Configuration Files in order
to simplify minor changes to the automation process by turning various functions off or on. The
following parameters, for example, may be included in the Job Template to generate the code
Page 27 of 30
that will prompt for Radiation Monitor data and RWP entries as defined in
4_GlobalValueFunctions.cfg.
|Run_GVGetRadMonitor|
|Run_GVGetRWP|
These prompts can then be optionally disabled for specific sample types by adding the equal
sign after the parameter in the Job Configuration file as shown below.
|Run_GVGetRadMonitor|=
|Run_GVGetRWP|=
When the Job is created, these parameters will be replaced with empty space instead of the
code defined in the Global Configuration files such that very comprehensive Job Templates are
easily configured for specific measurement processes.
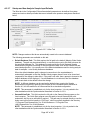
GVSampleDataSC program interface
When using the GVSampleDataSC program interface for sample measurements, there are
typically only a few parameters that are modified in the Job Configuration file, such as the
methods file path and “Continue” commands. These parameters use the GVSampleDataSC
prefix as described previously.
The majority of the configuration changes for the GVSampleDataSC interface are accomplished
in the methods file. The default methods file, which is defined in the Job Configuration File, is
“GVSampleDataSC_Methods.csv” in the directory “C:\User\GVCR\Configuration Files” directory.
The format of this file is described in Section B.8.2.4, and the default methods file can be used
as a template.
Another file that is typically configured for the GVSampleDataSC interface is the Custom Data
Input file. This file defines the custom fields that can be used for manual user input, or it can be
created and fully populated with information from a data management system for optimal data
integration. The structure of this file is described in Section B.8.2.24.1, and a few examples are
installed with the default configuration files in the “C:\User\GVCR\Configuration Files” directory
using the prefix “GVSampleDataSC_CustomInputData”.
Other files that define the activity and sample size units, dilution factors, and flow units are also
found in the directory “C:\User\GVCR\Configuration Files” with the prefix “GVSampleDataSC”
and an applicable suffix defining their purpose.
The GVSampleDataSC program is the main interface used with Sample Changers. When using
the Sample Changer mode of operation all of the data required to be captured for each sample
should be accomplished in the GVSampleDataSC interface to avoid any additional prompts
once the sample changer automation is started. Refer to the Global Configuration file
Page 28 of 30
9_SampleChanger.cfg to ensure that the appropriate methodology for changing the sample is
implemented.
A few automation routines are configured to sum spectra from multiple detectors using the
GVSpectrumMux program described in Section B.35. This operational array must be defined in
terms of the number of detectors and an appropriate system prefix. These parameters can be
found in the applicable Job Configuration file, such as “GVSampleDataSC
Examples\Acquisition\ Array Acquisition – Single Sample.cfg” as follows:
|NumberOfDetectorsInArray|=2
|ArraySystemPrefix|=1
The same parameters can be found in several QA Job Configuration files that use the “Array”
prefix in the file name.
4.16 Changing the QA Source
A) When the new QA source uses the same nuclide mix and geometry as the current source
then only the following parameters are required to be updated:
1) Update the Source Identification, Decay Date (source assay date), and live time in all
QA Check Job Configuration Files, including standard QA, QA with Gain Adjustment,
and QA with Automatic Energy Calibration (as applicable for the site configuration).
Note that the live time will only need to be adjusted if the count time has been extended
over time to ensure that sufficient counts are included in the most limiting peak for the
automatic energy calibration in GammaVision to be reliable. The parameters in the Job
Configuration File are :
|QASOURCEID|
|GVSetSDFParameter_DecayDateTimeValue|
|GVSetSDFParameter_LiveTimeValue|
|GVSetSDFParameter_ActivityUnitsValue|
2) Update the Target Activity values in the QA Limits section of the QA Administration
program as described in Section A.4.7.
Since the efficiency for the QA source should be unaffected the QA results should fall within
the specified limits without any other changes. If the QA results fall outside of the limits or
show a bias, then there may be sufficient inaccuracy between the two sources to warrant
recalibration for the QA geometry. This recalibration should only affect QA measurements
as the QA efficiency calibration should NOT be used for sample measurements. If a change
in QA results is determined to be related to instrument performance rather than a difference
in source content then the impact on previous analysis results should be evaluated.
Page 29 of 30
B) If the new QA source uses the same nuclide mix as the current source but a different
geometry, then update the QA efficiency calibration in addition to the parameters specified
in Step A.
C) If the new QA source uses a different nuclide mix then the QA Configuration will need to be
reconfigured with a representative analysis library (set in the Job Configuration files),
calibration, and QA Points similar to an initial system configuration. Typically, a change of
this type also warrants purging data from the previous source from the database and
starting fresh with the new points and parameters.
Page 30 of 30
Appendix A – Configuration and Data Management
Programs
Table of Content
A.1
A.2
A.3
A.4
A.5
A.6
A.7
A.8
A.9
A.10
A.11
A.12
A.13
Global Value Quick Start ................................................................................................................ A2
Sample Administration ................................................................................................................... A9
Sample Publisher .......................................................................................................................... A51
QA Administation .......................................................................................................................... A58
QA Publisher ................................................................................................................................. A76
GVQASummary ............................................................................................................................. A82
Analysis Log .................................................................................................................................. A83
GVDetectorMonitor ....................................................................................................................... A85
Database Utility ............................................................................................................................. A86
File Backup .................................................................................................................................... A87
File Compare ................................................................................................................................. A89
GVDataExport ................................................................................................................................ A90
EFT Convert ................................................................................................................................... A91
Page A1 of A91
A.1
Global Value Quick Start
Figure A.1.1 Global Value Quick Start Interface
The primary purpose of Global Value Quick Start is to dynamically generate automation
processes and run them in GammaVision. These “Jobs” (as referred in GammaVision) are
used to collect sample information, acquire and analyze spectra, generate reports, and perform
other functions associated with sample measurements. The Quick Start application also
provides the central interface to launch other programs and runs as a fixed toolbar on the
Window’s Desktop to keep it in the forefront.
Workstations configured for remote data access do not use this application because they do not
have a need to generate automation processes. Instead, they would normally utilize direct links
(Window’s shortcuts) to the applicable data management applications.
Figure A.1.2 Global Value Quick Start Header
The Quick Start header contains customizable menus, a Detector pick list, an option to keep the
application at the forefront, and buttons to launch the Sample Administration and QA
Administration programs described in sections A.2 and A.4 respectively. The menus are
configured as simple shortcuts to launch programs or open files as described in the Quick Start
Configuration (Section A.1.1).
The Always On Top checkbox is checked with the default configuration. In this condition the
application remains at the forefront of the screen even when other applications are running.
Uncheck this checkbox to view other applications in full screen mode or overlap the Quick Start
program. The checkbox status is stored in the GVSampleAdmin.INI file using the parameter
GVMenuWindowState.
The list of Detectors is populated based on the configuration established in the default
database. When populating this list, any detector whose Job file path is not valid will be omitted
from this list. This allows a limited list of detectors to be displayed in the list when certain
detectors are not accessible in a particular lab. To establish this configuration the Detector Job
path (set on the Detectors tab in Sample Administration Configuration) should normally be set to
a local Job path (i.e. C:\User\Job\Det1\). Note that this path must exist during the detector
Page A2 of A91
configuration. The workstation that should not display this detector in Quick Start must not have
the associated Job folder, so it should be moved to another location or deleted. To simplify
configuration changes in the future the folders can simply be moved to an “Out of Service” folder
during normal operation to limit the detector list as desired, and then moved back to the required
location if necessary when detector configuration changes are needed.
The default database path is specified on the Misc tab in Sample Administration Configuration
(See Section A.2.3.7) If the current default database path is not valid, then the user will be
prompted to set the default database when the Quick Start program is started and this path will
be set as the current default. Normally, this would be a database that is locally accessible, but it
could be any database on the local network. Note that the default database must be a Detector
database for sample data – not a QA database.
When a detector is selected from the pick list all of the folders within the detector Job directory
specified in the Sample Administration Configuration on the Detectors tab will be displayed in
the Automation Groups list. Any files with the JOB or CFG extension in the main Job directory
will be displayed in the Automation Jobs list. Clicking on the subfolders in the Automation
Groups expands that folder to show additional subfolders and updates the Automation Jobs list
with JOB and CFG files within that subfolder. An expanded folder can be collapsed by doubleclicking on it. This mini-Windows Explorer style interface allows automation routines to be
logically grouped in multiple subfolders such that the user can drill down to the appropriate
predefined automation process to accomplish a specific task (such as counting specific types of
samples, re-analyzing spectra, or running QA).
NOTE: Files with the JOB extension are Job Files that can be run by GammaVision without
modification, or they may contain parameter codes that are translated at run time in the same
way that Job Templates are merged with Configuration Files. Files with the CFG extension are
referred to as Job Configuration Files which specify a path to a Job Template and set
variable parameter values to merge with the template as described in Section B.31 for
GVTemplateMaster.
Single-clicking an item in the Automation Jobs list will dynamically create and run an automation
Job in GammaVision as described in Section A.1.2. Once GammaVision has been started, the
Active Jobs list is updated to show the Detector name and Job that is currently active. When
that instance of GammaVision is closed the respective item will be removed from the Active
Jobs list. If the Show Remote Jobs option is selected then any detectors in the pick list that are
currently running automation Jobs from a different computer are also displayed in the Active
Jobs list.
When the Active Jobs list is updated the program also checks the most recent Peak and
Background QA results. If any parameters failed outside the tolerance limits for the selected
detector then the Detector and Automation Jobs fields will turn yellow. If any parameters failed
outside the control limits then the Detector and Automation Jobs fields will turn red. In either
condition a message will also be displayed in the status bar indicating which type of QA failed.
This check is also applied when the detector selection is changed so the user is immediately
notified of the QA status. This indication is intended solely as a warning to the user. The Quick
Start program will not prevent the user from counting samples under this condition, however, the
GVQACheckStatus program (Section B.29) can be configured to prevent counting samples as
part of the automation routine if desired.
The Quick Start program will allow one automation Job to run for creating new Sample records
(acquisition or load spectrum processes) and for updating existing Sample records (reanalysis)
simultaneously. A message indicating that an Acquisition or Reanalysis Job is already running
will be displayed in the status bar if an Automation Job is selected from the list while the same
type of Job is currently running.
Page A3 of A91
NOTE: If GammaVision or Quick Start is terminated abnormally (i.e. by ending the process
using Task Manager or an abrupt computer shutdown such as loss of power), then a flag set in
the Global Value detector database will still indicate that an automation Job is running, and the
message described above will be displayed even though no Jobs are shown in the Active Jobs
list. In this condition the GVDatabaseUtility (Section A.9) must be used to manually clear the
flag.
A.1.1 Quick Start Configuration
The GlobalValueQuickStart.INI contains parameters to configure the application menus as well
as the width of the Automation Groups, Automation Jobs, and Active Jobs lists.
The list width parameters are shown below.
|MaxAutomationGroupsWidth|=0
|MaxAutomationJobsWidth|=0
|MaxActiveJobsWidth|=0
These parameters can be set to a static width for a custom view, or zero to automatically set the
list width to approximately one third of the screen width. When setting manual widths, the value
must be specified in twips which is 15 times the pixel settings. For example, if the screen
resolution is set to 1024 x 768, then the screen width is 15,360 twips (1024 x 15). The window
border and frame alignment also requires approximately 490 twips leaving a maximum of
14,870 twips available to split between the three list controls.
Normally, the default automatic width is sufficient. However, when very large monitors with high
resolution are installed the spacing may not be optimal. In these cases, the manual settings
may be desired to reduce the width of the list controls. Note that the Sample, QA, and Close
buttons also align to right side of the Active Jobs list, so their position is also affected when
changing the list width settings.
Figure A.1.3 Global Value Quick Start Header
Another situation where manual width settings are useful is when there are only a few
automation Jobs in the main Job folder and no subfolders are necessary. In this case, the
Automation Groups list can be hidden by setting the |MaxAutomationGroupsWidth| parameter to
one (1). The other lists can either be left at the defaults or manually set to approximately half of
the available twip width for a display similar to Figure A.1.3.
Menus are configured using a series of Main Menu and Menu Item parameters as shown below.
|MainMenu|=1 | Global Value Apps
|MenuItem|=1 | Analysis Log | C:\User\GVCR\AnalysisLog.xls
Page A4 of A91
The menu structure contains two key parameters (MainMenus and MenuItems) which must
contain the required pipe-separated inputs. Any combination of these parameters may be
included as long as the maximum number of top level menus and menu items is not exceeded,
and each is listed sequentially by number.
|MainMenu| - This parameter specifies the Index and Name of a top level menu. Up to 5 top
level menus may be specified.
|MenuItem| - This parameter specifies the Main Menu Index, Menu Name, and File path
(including any command line arguments) for the application or file to be open when this menu
item is selected. Up to 20 menu items may be specified for each top level menu.
A single dash (-) may be specified for the name of a menu item to insert a line separator in the
list rather than a file or application name. When the separator is used a parameter for the file
path is still required. In this case any text (other than the space character) is sufficient.
An example of a valid configuration is shown below. This configuration would generate the
menu shown in Figure A.1.4 with links to the specified programs.
|MainMenu|=1
|MenuItem|=1
|MenuItem|=1
|MenuItem|=1
|MenuItem|=1
|MenuItem|=1
|
|
|
|
|
|
Global Value Apps
Analysis Log
Database Utility
Detector Monitor
Spectrum Multiplexer
|
|
|
|
|
C:\User\GVCR\AnalysisLog.xls
N/A
C:\User\GVCR\GVDatabaseUtility.exe
C:\User\GVCR\GVDetectorMonitor.exe
C:\User\GVCR\GVSpectrumMux.exe
Figure A.1.4 Global Value Menu Example
A.1.2 Quick Start Automation Process
Automation processes (sample counting, spectrum re-analysis, QA measurement, etc.) are
initiated by Single-Clicking the applicable item in the Automation Jobs list. The following actions
are performed by Quick Start to validate, configure, and launch the automation process in
GammaVision.
1) Determine if the automation process is for Reanalysis by looking for the parameter
“|GVQuickStartReanalysis|=T”. This code is normally a standard parameter that also sets
the Reanalysis Flag for all of the Global Value programs called throughout the automation
process when using CFG files to initiate the process. However, it can also be located within
commented lines of a standard JOB file that is run directly in GammaVision without
modification.
2) Determine if an Acquisition or Reanalysis Job is running for the selected detector on the
current computer. If yes, then display a message indicating that a Job is already in
progress, and terminate the automation process.
Page A5 of A91
3) Determine if an Acquisition or Reanalysis Job is running for the selected detector on a
different computer. If yes, then display a message indicating that a Job is already in
progress along with the computer name that is running it, and terminate the automation
process. See Note at the end of Section A.1 regarding manually resetting the Job Running
flags in the event of abnormal termination of GammaVision or Global Value.
4) Create a Configuration file in the same directory as Quick Start (C:\User\GVCR) as follows:
a) Determine the file name based on the reanalysis flag described in Step #1.
i. For reanalysis the file name will be GVQuickStartReanalysis.cfg.
ii. If not reanalysis the file name will be GVQuickStart.cfg.
b) Create the file content consisting of the Job Configuration file content, Dynamically
generated parameters, and Global Configuration file content as follows:
i. If the item selected from the Automation Jobs list is a CFG file then add the Job
Configuration file content to the configuration file. If the item selected was a JOB
file, then nothing is added to the configuration file at this step.
ii. Add dynamically generated data parameters shown in the table below to the
configuration file as follows:
All Detector data is read from the selected detector database. See
Section A.2.3.2 Sample Administration Configuration Detectors tab.
Day, Month, and Year Spectrum Counter values are read from the
detector database. These values are updated during the automation
process using the GVIncrementCounter program. (See Section B.23)
Buffered values (X-digits) are padded on the left with zeros, but will
expand in length if the counter exceeds the maximum X-digit value.
Date and Time parameters are based on the date and time that the
automation process is initiated.
The Job Counter is stored in a text file named DetX.dat where X is the
detector number. The counter in this file is reset each day, and gets
incremented when the automation process starts. This counter value
may not be the same as the Daily Counter stored in the database
because the database counter does not get updated if the automation
process is canceled in GammaVision before the GVIncrementCounter
program is called (which is immediately before the analysis data is loaded
into the Global Value database). (See Section B.23)
Parameter/Example
Definition
|GLOBALVALUEDIR|=C:\User\GVCR\
Quick Start application directory
|DETNO|=1
Detector Number
|DETDESC|=Detector #1
Detector Description
|DETDBPATH|=C:\User\GlobalValue1.mdb
Sample Database Path
|DETQADBPATH|=C:\User\GlobalValueQA.mdb
QA Database Path
|DETJOBNAME|= Sample Count
Automation Job name
|DETJOBDIR|=C:\User\Job\Det1\
Automation Job Directory
|DETRPTDIR|=C:\User\SPC\Det1\
Detector Analysis Report Directory
|DETCRPTDIR|=C:\User\
Detector Custom Report Directory
|DETNETDIR|=c:\User\
Detector Network Directory
|DETPUBDIR|=C:\User\Publish\
Detector Publish Directory
|DETSPECTRUMPREFIX|=1_
Detector File Prefix
|STARTDATE|=2013-May-23
Date formatted as YYYY-MMM-DD
Page A6 of A91
Parameter/Example
Definition
|STARTDATE_YEAR|=2013
4-digit year
|STARTDATE_MONTH|=05
2-digit month
|STARTDATE_MONTHSP|=May
3-character month abbreviation
|STARTDATE_DAY|=23
2-digit day
|STARTDAYOFYEAR|=143
Day of year (no buffer)
|STARTDAYOFYEARBUFFERED|=143
3-digit Day of year
|STARTTIME|=15:59:01
Start Time with colon separator
|STARTTIME_HOUR|=15
2-digit Start Time Hour
|STARTTIME_MIN|=59
2-digit Start Time Minute
|STARTTIME_SEC|=01
2-digit Start Time Second
|STARTTIME_FILEFORMAT|=155901
Start Time with no separator
|DETJOBCOUNTER|=2
Job Counter from DAT file
|DAYSPECTRUMCOUNTER|=65
Day Counter (no buffer)
|DAYSPECTRUMCOUNTERBUFFERED2|=65
2-digit Day Counter
|DAYSPECTRUMCOUNTERBUFFERED3|=065
3-digit Day Counter
|MONTHSPECTRUMCOUNTER|=117
Month Counter (no buffer)
|MONTHSPECTRUMCOUNTERBUFFERED2|=117
2-digit Month Counter
|MONTHSPECTRUMCOUNTERBUFFERED3|=117
3-digit Month Counter
|MONTHSPECTRUMCOUNTERBUFFERED4|=0117
4-digit Month Counter
|YEARSPECTRUMCOUNTER|=159
Year Counter (no buffer)
|YEARSPECTRUMCOUNTERBUFFERED3|=159
2-digit Year Counter
|YEARSPECTRUMCOUNTERBUFFERED4|=0159
3-digit Year Counter
|YEARSPECTRUMCOUNTERBUFFERED5|=00159
4-digit Year Counter
|YEARSPECTRUMCOUNTERBUFFERED6|=000159
5-digit Year Counter
iii. Add the content of all Global Configuration files. This includes all files with the
CFG file extension in the “C:\User\GVCR\Configuration Files\” directory. These
files contain standard parameter definitions that are used for all automation
processes, and aren’t normally modified from the default installation files (with
the exception of 0_SiteSpecific.cfg intended for this purpose). If a parameter
needs to be altered for a particular automation process, then it can be set in the
Job Configuration to override the default definition. (See Section B.31
GVTemplateMaster for additional detail.)
5) Determine the Job Template content as follows:
a) If the Automation Job that was selected was a Job File (JOB extension) then use the file
content for the Job Template.
b) If the Automation Job that was selected was a Job Configuration File (CFG extension)
then the Job Template path is determined by the parameter “|TEMPLATE|” in the
configuration file created in Step #4 which must be set equal to a valid Job Template file
path.
Page A7 of A91
6) Create a Job File to run in GammaVision as follows:
a) Determine the file name based on the reanalysis flag described in Step #1 (where X
below is the detector number):
i. For reanalysis the file name will be X_RunReanalysis.job.
ii. If not reanalysis the file name will be X_Run.job.
b) Merge the Job Template and Configuration File content using the process described for
GVTemplateMaster in Section B.31 to create the final Job file.
7) Start a new instance of GammaVision and run the Job file as follows:
a) Determine if a detector will be controlled in the automation process by searching the Job
file content for the keywords “SET_DETECTOR” and “SETDETECTOR” (neither of
which are case sensitive).
i. If a detector will be controlled, then set the GammaVision “LastIndex” registry
parameter to the appropriate list ID if a match can be established in the MCB
Configuration file. If a match cannot be established, then clear this registry entry.
This change overrides detector window settings that could result in opening
multiple detector windows (or an incorrect one) when GammaVision opens.
ii. If no detectors are expected to be controlled, then the “-B” command line
parameter will be passed to GammaVision when it is started to ensure that
GammaVision starts with a Buffer window active.
b) Determine the available screen space available between the Quick Start program and
the Windows Taskbar and set the corresponding top, left, width, and height coordinates.
c) Start GammaVision and pass command line parameters for the Buffer (if applicable),
Zoom coordinates, and the path to the Job file created in Step #6. Note that the
GammaVision window size can be dynamically adjusted afterwards in the Job file using
the “Zoom” command if desired. At this point GammaVision is in control of the
automation process by running the specified Job file.
8) Set a flag in the detector database indicating that a Job is active for either Reanalysis or
non-Reanalysis (presumed Acquisition) processing. (This is the flag checked in Step #2
previously.)
9) Update the Active Jobs list using the Detector name and the Automation Job name that
initiated the process. If the automation process was for reanalysis, then an exclamation
point (“!”) is also appended to the entry.
10) To check the status of a particular Job simply select that Job in the Active Job list to set the
focus to the associated instance of GammaVision. Note that if the GammaVision window is
minimized then the icon in the Windows taskbar gets the focus but the application window
will still be minimized.
11) When the automation Job completes and GammaVision is closed the Active Jobs list will
automatically update to reflect the currently running Jobs. This is possible because Quick
Start keeps track of the particular instance of GammaVision that is running each Job.
Note: If GammaVision was terminated abnormally (i.e. using Task Manager) then
Quick Start will lose track of that particular instance of GammaVision. Under this
condition Task Manager must be used to shut down the Quick Start program in
order to reset the Active Jobs list. Otherwise, the program will not allow a new Job
for that detector to be started as it appears that a local Job is still running. Although
this is rare after a system is properly setup, it is still possible in unforeseen
circumstances. This condition would also require the use of the GVDatabaseUtility
described in Section A.9 to reset the applicable Job Running flag(s).
Page A8 of A91
A.2
Sample Administration
This Sample Administration program is the main interface for reviewing Sample Analysis
Results and managing System Configuration settings (except for QA Limit/Report settings
managed in the QA Administration program). It is normally started by selecting the “Samples”
button from Global Value Quick Start on lab computers used for sample measurements, or from
a Windows Shortcut on remote access computers used for data review. When started from a
Windows shortcut, the default view is normally as shown in Figure A.2.1. When started from
Quick Start the program opens with the Analysis Editor displayed and the current Quick Start
detector selected by default.
The program can accept two optional comma-delimited, command line arguments listed in any
order.
1) Full Path to a target detector database: This path overrides the default database specified
on the Misc tab in the Configuration Manager and is not typically necessary.
2) Detector ID: If the Detector ID is provided, then the Analysis Editor is activated with the
specified detector selected in the Detector dropdown list when the program opens. This
mode immediately displays the most recent analysis report for that detector. This method is
used by Quick Start when the “Samples” button is selected. (Note that the Detector ID is the
description specified on the Detectors tab in Configuration Manager – NOT the detector
number.)
Figure A.2.1 Sample Administration Default View
The Global Value structure requires that each detector is assigned a unique database to store
analysis results for Samples in order to provide broad flexibility for remote data access while
also ensuring continued operation during network outages. (See Appendix E – Network
Configuration Considerations) This architecture requires each detector database to store the
Security and Configuration settings managed by the Sample Administration program so that all
of the information necessary for system operation is always available to the application if a
database connection can be established.
Page A9 of A91
This Sample Administration program must connect to a Global Value database structured to
store analysis data for samples - not a QA database. The default database path is set on the
Misc tab of the Configuration Manager (Section A.2.3.7) and typically points to one of the
production detector databases. If the default database path is not valid then the user will be
prompted to select a valid database.
Once a connection is established to a production database, the Sample Administration program
can determine the location of all other databases in the Global Value network from tables that
are managed on the Detectors tab of the Configuration Manager (Section A.2.3.2). When the
Analysis Editor is activated and detectors are selected from that interface, a dynamic connection
is established to the applicable detector database in order to display and update analysis
records.
Changes applied to Security or Configuration parameters from the Sample Administration
program are initially only applied to the default database that was connected on startup. They
are not applied to the detector databases that are dynamically connected when reviewing data
in the Analysis Editor.
After all Security and Configuration changes are applied, they must be pushed to all of the other
production databases using the Synchronization function (Section A.2.3.9) so that all databases
in the Global Value system contain the current configuration settings. In order to avoid
discrepancies between the databases, configuration changes (including security changes)
should only be made when all of the databases in the Global Value network are accessible. If
an error is indicated in the Synchronization process, then corrective action should be taken to
avoid Synchronizing FROM any databases that are not currently up to date. Otherwise, the
changes would be rolled back to settings stored in the out of date database.
NOTE: It should also be clear with this process that concurrent Security and
Configuration changes from different locations may result in unexpected results because
one user may be pushing updates to the other’s database while changes are in progress.
Additionally, if analysis measurements are in progress when configuration changes are
made then changes may or may not be reflected in the final results based on the timing
of the database updates. For this reason, changes to Security and Configuration
parameters which must be synchronized to the other databases should be made from a
single location when active measurements are not in progress.
Navigation controls on the program header provide the following links and information:
7
9
8
1
2
3
4
5
6
Figure A.2.2 Sample Administration Header
1)
2)
3)
4)
5)
6)
Password Editor for users to manage their system password. (Section A.2.1)
User Login to change the current user.
Security Editor to manage Users and User Group Permissions (Section A.2.3.1)
Analysis Editor for analysis data review, editing, and approval. (Section A.2.2)
Configuration Manager to manage various configuration settings. (Section A.2.3)
Synchronize Databases to push Security and Configuration changes from the default
database to the other databases. (Section A.2.3.9)
7) Database Path for the currently selected detector in the Analysis Editor.
8) User Name and Group for the current user logged in.
9) Close Button to exit application.
Page A10 of A91
A.2.1 Sample Administration Login and Password Management
NOTE: The default installation database uses a default User Account which has all permissions
enabled. The User Name and Password is “Admin” (case sensitive). This User Name should
be deleted or the password changed during the initial configuration to prevent unauthorized
access.
When the Sample Administration program opens a prompt is displayed for login. If a valid User
Name is selected from the list with the correct password, then the User and Group Names will
be displayed in the toolbar and the associated permissions will be enabled. The current user
can log out and a different user login while the program is open by selecting the User Login
button as shown in Figure A.2.2.
If the login prompt is canceled then User Name and Group are set to “None” and no
permissions are enabled. This configuration enables a “read-only” mode for users that are not
registered in the system with specific permissions enabled.
Users can also login and simultaneously change
their password using the Password Editor shown
in Figure A.2.1.1. This window is accessed by
selecting the first toolbar button shown in Figure
A.2.2 or the “Change Password” menu. After
entering the current and new passwords select
the “Save Password” button. If the inputs are
validated then a prompt is displayed indicating
that the changes were saved. Note that this
change has only been applied in the current
default database.
After acknowledging the changed password
prompt the window shown in Figure A.2.1.2 is
displayed and the process of synchronizing the
change to all of the other databases is
automatically initiated. This synchronization is
normally much faster than the synchronization
function initiated from the toolbar due to the
amount of data being updated.
If any errors occur during the synchronization
process then a message is displayed at the
bottom of the window. If necessary, correct the
connection issue and select the “Update” button
to synchronize changes again. It is important to
ensure that all databases are updated or the
login credentials will not be the same on all
systems.
Figure A.2.1.1 Password Change
Figure A.2.1.2 Synchronize Password
Page A11 of A91
A.2.2 Sample Administration Data Management
NOTE: If a Detector Description is specified on the command line when running the Sample
Administration program then the Analysis Editor is automatically displayed with the specified
detector selected in the Detector list as shown in Figure A.2.2.1. The Analysis Editor can also
be accessed by selecting the forth toolbar button as shown in Figure A.2.2 or the View\Samples
menu.
Figure A.2.2.1 Sample Administration Analysis Editor
The Analysis Editor is used for managing sample analysis data. The complete reports can be
reviewed and electronic signatures applied, various parameters can be edited, and approved
reports can be published to PDF files. Additional reporting and data integration options can be
automated using the Sample Publisher program described in Section A.3.
Page A12 of A91
As shown in Figure A.2.2.1, the Analysis Editor is comprised of a main header and several
tabbed sections which are discussed in Sections A.2.1 through A.2.6. The header section
contains fields for selecting the Detector, Spectrum, and Filter options, as well as various
buttons to process the data using an electronic edit/review process as follows:
1
2
12
3
4
5
6
7
8
9
10
11
Figure A.2.3 Analysis Editor Header
1) Detector List: This list is populated with all detectors configured on the Detectors tab in
Configuration Management. (See Section A.2.3.2) and an “Archived Database” option. When a
detector is selected from the list the program will connect to the specified detector database to
display analysis information. If the associated database is not available (i.e. the network,
server, or local computer is not accessible) then a message is displayed indicating that the
database could not be connected. When the “Archived Database” option is selected a standard
File Open dialog is displayed to allow the user to select an archived Detector database.
2) Spectrum List: This list is populated with spectra from the selected detector database based
on the “Filter By” criteria specified below. The list can be refreshed by clicking on the Refresh
button next to this field to reflect changes due to the addition of new records or data being
reviewed or published. When a spectrum filename is selected from this list the associated
analysis information is displayed in the signature grid and tabbed sections.
3) Filter By List: This field filters the list of spectra displayed in the Spectrum dropdown to only
those meeting the specified criteria. This filtering capability is intended to simplify the electronic
review process. It is not intended as a mechanism for searching sample results based on all
available parameters. (See Section A.7) for more advanced search capabilities using the
Analysis Log.) The following filtering options are available:
a. Unreviewed: This option will limit the list of spectra to only those that do not have a
Reviewer signature applied.
b. UnPublished: This option will limit the list of spectra to only those that do not have a
Publisher signature applied.
c. Previous X Days: When this option is selected a field is displayed to specify the
number of days. The list of spectra is limited to only those where the Report Date (also
referred to as the Analysis date) is after the current date/time minus the number of days
specified.
d. All: This option will populate the Spectrum list with all spectra in the database.
e. All Custom Data Parameters: Each custom parameter defined on the Custom Fields
tab in the Configuration Manager is listed in the Filter By list. A field is displayed to
specify the custom parameter criteria when one of these options are selected, and the
spectrum list is updated accordingly.
4) Delete Button: This button is only enabled if the Current User belongs to a Group that has
permission to Delete Data. When selected a prompt is displayed indicating that all of the data
associated with the currently selected spectrum will be permanently deleted from the database.
None of the files stored outside of the database are affected (i.e. published reports, spectra,
etc.)
Page A13 of A91
5) Save Button: This button is only enabled if the Current User belongs to a Group that has
permission to Edit Data and the record has not been locked (i.e. Reviewed or Published). When
selected any changes made on the tabbed sections (Sample Data, Nuclide Data, Unidentified
Peaks, and Custom Data) are saved in the database. Any changes are reflected in the Change
Summary tab, and the Report Summary content is updated. The Editors’ name is also changed
to the name of the Current User as the data owner if the “Separate Editor and Analyst” option is
selected on the Misc tab in Configuration Management. (See Section A.2.3.7)
6) Review Button: This button is only enabled if the Current User belongs to a Group that has
permission to Review Data. When selected the custom report summary is refreshed based on
the specified report template such that the Reviewer name and date will be displayed on the
final report (if these parameters are used on the template). If changes are made on the Sample
tabbed sections prior to selecting the Review button, then a prompt will be displayed to save
changes prior to applying the Review signature. If changes are saved at this point, then the
Editor name is changed to the current user similar to selecting the Save button. If changes are
not saved then all changes are discarded prior to applying the review signature and refreshing
the custom report. After the Review signature has been applied all of the fields on the tabbed
sections are locked to prevent further changes.
7) Review All Button: This button is only enabled if the Current User belongs to a Group that has
permission to Review Data. When selected the review process described for the Review Button
is applied to every spectrum in the Spectrum List.
8) UnReview Button: This button is only enabled if the Current User belongs to a Group that has
permission to Review Data. When selected the Reviewer and Publisher signatures are
removed and the custom report is refreshed to remove the same signatures and dates. The
fields on the tabbed sections are also unlocked to allow changes based on the current user’s
group permissions.
9) Publish Button: This button is only enabled if the Current User belongs to a Group that has
permission to Publish Data. When selected the custom report summary is refreshed based on
the specified report template such that the Publisher name and date will be displayed on the
final report (if these parameters are used on the template). The Report Summary and Report
Details are then saved to a PDF file in the detector specific “Publish Report Path” directory as
established on the Detectors tab in the Configuration Manager. (See Section A.2.3.2) The file
name and any password protection are determined by settings on the “PDF Properties” tab in
the Configuration Manager. (See Section A.2.3.6) If the publisher name already exists then a
prompt to publish the report again will be displayed. If not already locked as a result of the
Review process, all of the fields on the tabbed sections are locked to prevent changes. After
the PDF report has been saved a program called GVPublishSample.exe in the Global Value
directory is run to provide additional data processing requirements. The Sample Publisher
described in Section A.3 offers several options for published report content and data integration
including the ability to run additional programs for custom applications.
10) Publish All Button: This button is only enabled if the Current User belongs to a Group that has
permission to Publish Data. When selected the publishing process described for the Publish
Button is applied to every spectrum/report in the Spectrum List.
11) Auto Publish Option: When this option is selected the Publish and Publish All buttons are
hidden, and reports are automatically published as described for the Publish (or Publish All)
buttons when the Review (or Review All) button is selected.
Page A14 of A91
A.2.2.1
Analysis Report
The Analysis Report tab is the main interface for reviewing analysis results. It includes a
“text only” representation of the analysis report along with a Spectrum Histogram viewer with
various print and export options. The content in the report viewer may appear to be
editable, but no changes from this interface are retained in the database or included with
reports generated from the print options.
Figure A.2.2.1.1 Analysis Report
The following options are available on this tab:
Viewer Font Size: This field specifies the font size used in the report viewer. Use the up
and down arrows next to the field to change the font size as necessary based on your
monitor resolution and report content.
Report Content: The report viewer displays any combination of the Summary and
Detailed Reports and allows access to the spectrum viewer as described below. Note
that the report viewer only displays standard text (similar to Notepad). If a report
template uses the parameter |SPCPICTURE| then the code #SpectrumPlaceholder# will
be displayed in this view. When reports are printed to any format other than text (i.e.
Printer, PDF, or MS Word) an image of the full spectrum in Log scale will replace the text
placeholder. When printing to a text file, the placeholder is simply removed.
1)
Summary Option: The Custom Summary report generated by the specified
template is displayed in the report viewer. Note that
2)
Details Option: The standard GammaVision report for each analysis (maximum of
2) is displayed in the report viewer. If the Summary option is also checked then the
details follow the summary.
Page A15 of A91
Figure A.2.2.1.2 Spectrum Viewer
3)
View Spectrum: This option displays the interactive spectrum viewer shown in
Figure A.2.2.1.2 with data plotted as a Bar Chart, Line Graph, or Points. The
spectrum can be zoomed in and out using the buttons above the spectrum window or
through keyboard shortcuts where F5/F6 and Up/Down arrow keys zoom
horizontally, and the F7/F8 keys zoom vertically similar to GammaVision. The
vertical scale can also be viewed in Log or Linear scale with automatic or manual
range settings. After setting the desired view an image of the spectrum can be
saved to a Bitmap file or printed. The full spectrum file can also be extracted from
the database and saved to a file for use directly in GammaVision.
Print Destination: This section has several options for report output which are applied
when the Print button is selected.
1)
Printer: The report is printed on the default printer.
2)
MS Word: The report is displayed in Microsoft Word (MS Word is required).
3)
PDF File: The report is saved to a PDF file. A standard “Save As” dialog is
displayed indicating the path and file name. The default path is the “Custom Report
Path” established for the selected detector in the Configuration Manager, and the
default file name is the Spectrum name. Both the path and file name can be
changed in the “Save As” dialog. (Also see “Open File After Save” below.)
NOTE: Printing the report to a PDF file is not the same as Publishing the report.
When Publishing, the report is always saved to the “Publish” directory, and the file
name and protection is determined by the PDF Properties in the Configuration
Manager. GVPublishSample is also launched for additional processing when
publishing. When printing a PDF file you can change the name and location, the file
is not encrypted, and no additional processing occurs after the file is saved.
Page A16 of A91
A.2.2.2
4)
Text File: The report is saved to a text file. A standard “Save As” dialog is displayed
indicating the path and file name. The default path is the “Custom Report Path”
established for the selected detector in the Configuration Manager, and the default
file name is the Spectrum name. Both the path and file name can be changed in the
“Save As” dialog. (Also see “Open File After Save” below.)
5)
Open File After Save: This option is only enabled when the PDF File or Text File
option is selected. If this option is checked then the saved report will be opened and
displayed using the associated program similar to opening the file directly from
Windows Explorer.
6)
Print Font Size: This field specifies the font size used when the report is printed to
the selected destination. Use the up and down arrows next to the field to change the
font size as necessary based on your report content. The default font size for the
standard GammaVision report is 11 points. Higher values may result in a poorly
formatted report. This option is typically used to reduce the font size to allow more
information to be displayed on the custom report summaries (i.e. more nuclide
columns when multiple calculations or data grouping is desired). The Printed Report
font is limited to the range 8 – 11 to avoid formatting problems with printing.
Sample Data
The Sample Data tab contains fields for viewing or modifying information associated with the
sample. Some parameters cannot be modified without a complete reanalysis of the
spectrum because changes could invalidate the nuclide results, unidentified peaks, etc.
which are determined by the GammaVision analysis engine. These fields are shaded in
grey below the Report Template field.
Figure A.2.2.2.1 Analysis Report
All of the other parameters on this tab can be modified if the Current User belongs to a
group with permission to Edit Data and the results have not been locked (i.e. Reviewed or
Published). These fields will have a white background if the corresponding parameter code
is included on the Report Template. Otherwise these fields will have a light yellow
background. Refer to Section A.2.3.5 for Report Template parameter codes.
Page A17 of A91
The shading of various fields based on whether or not that parameter will be displayed on
the custom report summary is only for convenience to avoid confusion that may result with
some data displayed on this tab that is not displayed on the report summary. Data may still
be entered in fields that are not displayed on the currently selected report to allow the data
to be used with the Excel Add-In functions, other report templates, or used for filtering or
sorting criteria using the Sample Log.
The following parameters may be modified on this tab with changes saved to the database
when the Save button in the Analysis Header is selected: (Refer to Appendix D for field size
limitations.)
Description: Edit the Sample Description text in this field as applicable. Changes to
this field are applied to the Sample Description displayed on the custom report
summary, but not to the standard GammaVision detailed reports. If the description is
distinctly different than originally specified during the analysis, then the description
should be updated using a Reanalysis Job similar to the process followed for changing
a calibration or library file.
Comments: Add or modify comments related to the sample in this field as applicable.
Report Template: All report templates that are saved in the database can be selected
from the list. For older systems that stored report templates as text files (.cus
extension), the search button next to this field may be selected to browse to the
specified template file. This older method affords no protection against unauthorized
changes to the report templates so it is generally preferable to convert older template
files to the newer format stored in the database, and select the appropriate template
from the list.
Site Unit: The Site Unit may be selected from the list which is populated based on the
list established on the Misc tab in the Configuration Manager. Alternatively, ad hoc text
may be entered in this field as the data entry is not limited to those items in the list.
Sample Type: The Sample Type may be selected from the list which is populated
based on the list established on the Sample Types tab in the Configuration Manager. If
an item from the list is selected then the R-Type field is automatically set to the
corresponding parameter. Alternatively, ad hoc text may be entered in this field as the
data entry is not limited to those items in the list. If text is entered that does not match
any of the Sample Types in the list then the R-Type field will be cleared automatically.
R-Type: This field is automatically set when a Sample Type is selected from the list
established on the Sample Type tab in the Configuration Manager. The default R-Type
(Record Type or Document Control code) can be changed if desired.
Sampler ID: Edit the Sampler ID text in this field as applicable.
GDT Pressure: Edit the Gas Decay Tank Pressure in this field as applicable.
RWPs: The RWP (Radiation Work Permit) consists of a prefix and suffix which are
concatenated together with a hyphen in between. The default prefix (usually the 4-digit
year) is specified on the Misc tab in the Configuration Manager. Both the prefix and
suffix fields can be changed by editing directly in these fields. After entering the prefix
and suffix, the RWP is added to the list by selecting the Add button in this section. To
remove an RWP, select the item in the list and then select the Remove button in this
section or press the Delete key.
Radiation Monitor Readings: The Radiation Monitor may be selected from the list
established on the Misc tab in the Configuration Manager. Alternatively, ad hoc text
may be entered in this field as the data entry is not limited to those items in the list.
After selecting or entering a Radiation Monitor ID (or description) and an associated
numeric reading the pair is added to the list by selecting the Add button in this section.
To remove a Radiation Monitor Reading, select the item in the list and then select the
Remove button in this section or press the Delete key.
Page A18 of A91
A.2.2.3
Nuclide Data
The Nuclide Data tab contains nuclide data that can be modified if the Current User belongs
to a group with permission to Edit Data and the results have not been locked (i.e. Reviewed
or Published). The Analysis # and Nuclide Name are not editable except when adding a
new Nuclide to the grid manually by selecting the last empty row in the grid. In this
condition, the Analysis # is determined by selecting the applicable analysis geometry from a
displayed list, and the Nuclide Name can be selected from a list or a typed manually. The
nuclide list is recommended to avoid spelling errors and ensure that the nuclide names in
Nuclide Adjustment Factors match those used for analysis. Once the nuclide name is
specified the rest of the nuclide data fields must be entered. Typically, the nuclide data can
be found in various locations of the standard GammaVision report or will be manually
calculated. When adding a new nuclide or modifying any of the other data fields the Edited
status automatically updates to “Yes”.
This tab has two optional grid displays. The Standard nuclide data display is shown in
Figure A.2.2.3.1 and the ISO NORM nuclide data display is shown in Figure A.2.2.3.2. The
“Show ISO NORM” checkbox under the Nuclide Data tab is used to toggle between the two
views. The “Show ISO NORM” option can be hidden with the applicable setting on the Misc
tab in the Configuration Manager to prevent toggling between the Standard and ISO NORM
Nuclide Data. (See Section A.2.3.7) This option is typically used when ISO NORM data is
not used for a particular application; however, the checkbox may be checked before hiding it
such that only the ISO NORM data is displayed if desired.
The Standard Nuclide Time of Count (TOC) field can also be optionally hidden or displayed
by an option set on the Misc tab in the Configuration Manager. This field is typically hidden
for applications where there is no particular interest in the Time of Count activity when decay
is applied or when decay correction is not used.
Figure A.2.2.3.1 Standard Nuclide Data
Page A19 of A91
Figure A.2.2.3.2 ISO NORM Nuclide Data
A.2.2.4
Unidentified Peaks
The Unidentified Peaks tab contains the same data displayed on the GammaVision report
for unidentified peaks. The Identification field is editable to allow the source of the peak to
be specified if the Current User belongs to a group with permission to Edit Data and the
results have not been locked (i.e. Reviewed or Published). All other fields are read-only.
Figure A.2.2.4.1 Unidentified Peak Data
Page A20 of A91
A.2.2.5
Custom Data
The Custom Data tab contains fields for viewing or modifying Custom Data associated with
the sample. The parameters in the grid are defined on the Custom Fields tab in the
Configuration Manager. (See Section A.2.3.8) The fields on this tab can be modified if the
Current User belongs to a group with permission to Edit Data and the report has not been
locked (i.e. Reviewed or Published). See Appendix D for data length limits.
Figure A.2.2.5.1 Custom Data
A.2.2.6
Change Summary
The Change Summary tab displays details of every change applied in the Analysis Editor
tabs along with the user name and date/time the changes were saved. This includes the
data/value prior to and after each change. It also provides indication of a complete
spectrum reanalysis including the Analyst name and the date/time of the reanalysis. Any
changes made during the reanalysis are not tracked since the review effectively starts over
at this point with all associated analysis data reset to the GammaVision analysis report data.
Figure A.2.2.6.1 Change Summary
Page A21 of A91
A.2.3 Sample Administration Configuration Manager
Global Value Configuration Management consists of the Security and Configuration Manager
modules which are accessed from the Sample Administration toolbar and menus as described
in Section A.2. After changes are applied to the default database connected to the application
on startup all of the other detector databases must then be updated using the Synchronization
Option (See Section A.2.3.9).
The Security module consists of User Names and Permissions as described in Section A.2.3.1.
“Security” permission is required to access this module.
The Configuration Manager consists of Detector settings, Sample Types, Nuclide Adjustment
Factor tables, Report Templates, Published PDF report properties, Custom Field definitions,
and Miscellaneous operational settings as described in Sections A.2.3.2 through A.2.3.8.
“Configuration” permission is required to access this module.
The Database Synchronization function is described in Section A.2.3.9. “Configuration”
permission is required to synchronize databases. Since Security changes also must be
synchronized, users with Security permission should also normally have Configuration
permission. However, users with Configuration permission are not required to be granted
Security permission.
A.2.3.1
User Accounts and Group Permissions
The Security Editor is accessed as described in Section A.2 from the Sample Administration
toolbar button or associated menu. This editor has two tabs as shown in Figures A.2.3.1.1
and A.2.3.1.2 for establishing Groups with applicable permissions and then assigning Users
to those groups.
Figure A.2.3.1.2 Security Users
Figure A.2.3.1.1 Security Groups
To simplify the setup and maintenance process, permissions are assigned to Groups rather
than individuals. This makes it easy to change permissions for an entire group in one step
instead of having to change the same setting for every affected user. There are a few
Security Groups configured by default, but they can be modified as necessary to meet
specific installation needs.
Page A22 of A91
When Adding or Editing Security Groups, the PERMISSIONS field is enabled to allow
selection of appropriate options as follows:
Configuration: Allows access to all Configuration parameters described in Sections
A.2.3.2 through A.2.3.9.
Security: Allows access to User Accounts and Group Permissions described in
Section A.2.3.1.
Add Data: Allows users to login for sample counting or QA and set the analyst name
for display on reports when the Login prompt is configured in Job files. Users who do
not have this permission set will not be able to add data to the database, so they will not
be allowed to progress past the Login prompt. If the Login prompt is not employed in
Job files, this permission has no effect on operation with Jobs. This permission also
allows users to Add comments in the QA Administration Lab Notebook.
Edit Data: Allows analysis data to be modified in the Analysis Editor and if the sample
has not been locked (i.e. Review or Publish signature applied). If data is modified in the
Analysis Editor, then the current user’s name will be added to the “Editor” field, and the
“Edit Date” set to the current date/time. The Change Summary is also updated to
reflect any changes along with the Editor name and date/time. This permission also
allows users to edit their own comments in the QA Administration Lab Notebook.
Delete Data: Allows complete analysis records (all reports and data associated with a
spectrum) to be removed from the applicable Sample or QA database. The spectrum
and any other files saved outside of the Global Value database are not affected.
Review Data: Allows a Review Signature to be applied to (or removed from) Sample or
QA records stored in the database. This also locks (or unlocks) the data fields to
prevent or allow changes in the Analysis Editor as applicable.
Publish Data: Allows analysis reports to be published to the specified location. This
also locks (or unlocks) the data fields to prevent or allow changes if a Review signature
was not previously applied. Typically, this is the last step in an electronic review
process.
While in the edit mode, the buttons below the Security Group field change to Save/Cancel
as shown in Figure A.2.3.1.1. Select the Save button to save the changes or Cancel to
discard them. If changes are saved, then all other databases must be synchronized as
described in Section A.2.3.9. Note that at least one Security Group must always exist!
A report summarizing the Group Permissions can be printed or displayed in Microsoft Word
(if installed) by selecting the appropriate destination and the Print button.
User names and initial passwords are established along with the applicable Security Group
on the Users tab as shown in Figure A.2.3.1.2. Note that User Names currently assigned as
the Analyst, Editor, Reviewer, or Publisher for Sample or QA reports are not affected when
users are deleted or permissions are changed using the Security Editor. Any changes are
applied to future operations after all databases are synchronized, but no existing records are
affected. Similar to the Groups editor described above the buttons on the Users tab change
to Save/Cancel as shown in Figure A.2.3.1.2. Any changes must be synchronized to the
other databases as described in Section A.2.3.9. Note that this synchronization can be
performed after all changes have been saved – not after each individual change is saved.
When new users are established a default password can be set with the expectation that the
user will change and synchronize their own password as described in Section A.2.1.
A report summarizing the Users and associated Groups can be printed or displayed in
Microsoft Word (if installed) by selecting the appropriate sort order, destination, and then the
Print button.
Page A23 of A91
A.2.3.2
Detector Parameters
Each detector that will use Global Value to store analysis results must be configured on the
Detectors tab. All fields are required (except for the File Prefix which is highly
recommended) and some must be unique for each detector as identified by the blue fields
shown in Figure A.2.3.2.1.
Figure A.2.3.2.1 Detectors Tab
The following is an explanation of each field:
Detector Description: This description is displayed in drop down selectors on various
Global Value screens, such as the Quick Start program, Analysis Editor, and the
Sample Log which uses the Excel Add-In.
Detector Number: This number should be the same as the detector number
established when MCB Configuration is run during the initial instrument setup with
GammaVision. This value is critical for QA measurements and automation Job
processes.
File Prefix: If analysis reports from more than one detector are generated by
GammaVision in the same directory then the File Prefix is required. During the
automation Job process the program “GV_GetRptData” is run to load analysis results
from the GammaVision files. This program searches for the most recent analysis report
in a specified directory to get the necessary information. If each detector sends its
analysis reports to a separate directory then this process is very efficient, and a File
Prefix is not required. However, if several detectors send reports to the same directory
at the same time then it would be possible for Global Value to get results from the
wrong files unless a unique identifier is provided. The unique identifier that prevents
this mix up is the File Prefix. This parameter is also used in various utility programs in
Global Value to associate various types of files with a specific detector (for example
calibration files in the GVGetConfiguration program).
Database: Each detector requires a unique database to store analysis data associated
with samples. The path to that database is specified in this field and can be set using a
standard Windows File Open/Save dialog by selecting the button next to this field.
Database paths may be set to the local “C:\” drive when running Global Value from a
stand-alone computer, but should use a fully qualified network path (or mapped drive
path) when remote data access on a network is desired. If the databases and data files
Page A24 of A91
are stored on local computers (vs a network server), then the “C:\User” directory must
be shared with Read/Write permissions for the personnel or groups that will run Global
Value. Refer to Appendix E for information regarding network configurations and
database/file storage locations.
When Adding Detectors a new database must be created. This can be accomplished
by copying one of the existing detector databases or the file “GlobalValue1.md_” to the
new database name. The content of the starting point database is not important
because the Configuration data will be updated when the database is synchronized
from the current default (Master) database and any existing sample results can be
deleted using the database purge function on this tab (see below) after the
synchronization. The only requirement for the new database is a valid path and proper
structure for storing configuration and analysis data.
Analysis Report Path: This is the directory where Global Value will look for the
standard GammaVision report to get analysis data. This path must match the report
path specified in the SDF files used for the selected detector. This path should
normally be a directory on the local computer so that the system can operate without
interruption in the event of a network or server outage, but it can also be set to a server
or shared folder location, which is necessary when operating in a configuration that
allows running automation Jobs for the same detectors from multiple workstations.
Click on the button next to this field to browse to the appropriate directory. If a network
path is desired it can be typed directly into the field.
Custom Report Path: This is the default directory for printing Text or PDF analysis
reports from the Analysis Editor or using the Print_Rpt program in JOB files. When
printing reports from the Analysis Editor, the standard Windows “Save As” dialog is
displayed. The current directory is set to the Custom Report Path, and the file name is
set to the spectrum file name. The directory and filename can both be changed in the
dialog. When using the Print_Rpt program from JOB files, the report is saved in the
Custom Report Directory unless the path is specified as a command line argument.
(See Section B.25 Print_Rpt for more detail.)
Click on the button next to this field to browse to the appropriate directory. If a network
path is desired it can be typed directly into the field.
Network Report Path: This path is not used directly by the Analysis Editor or any
other Global Value programs by default. However, it is an available parameter that can
be used in automation Jobs, with Excel worksheets that implement the Excel Add-In, or
other custom programs.
Click on the button next to this field to browse to the appropriate directory. If a network
path is desired it can be typed directly into the field.
Publish Report Path: This path is the directory where PDF files are automatically
stored when “Publishing” reports. Typically, this is a local directory for optimal
efficiency in saving PDF files, and the GVPublishSample program (See Section A.3) is
used for additional processing including moving reports to a network location where
they can be pulled directly into the Document Control / Record Keeping system. If no
additional processing is required, then the Publish directory can be set directly to the
network location.
Click on the button next to this field to browse to the appropriate directory. If a network
path is desired it can be typed directly into the field.
Page A25 of A91
Job File Path: This path is the directory that the Quick Start program uses to search
for automation Jobs or Job Configuration files for the selected detector. The path must
be unique so that only Jobs associated with the selected detector can be executed from
the Quick Start program. This path should normally be a directory on the local
computer so that the system can operate without interruption in the event of a network
or server outage. However, the path can be set to a network path to allow running
automation Jobs for the same detectors from multiple computers if desired.
Click on the button next to this field to browse to the appropriate directory. If a network
path is desired it can be typed directly into the field.
QA Database: This field specifies the path to the database where QA data is stored for
the selected detector. Unlike data associated with samples, the QA databases may
contain information for multiple detectors. When configuration data is synchronized
from the Sample Administration program the associated detector parameters described
in this section and Security settings (users and groups) are copied to the specified QA
Database. The “Synchronize Security Settings” option is available only for backward
compatibility. This option must be checked to synchronize the detector and security
settings to the QA database as these settings are no longer available directly in the QA
Administration program.
The following command buttons are available to manage detector settings:
Add: Add a new detector to the list and set the field parameters. Settings must be
saved after all of fields have been populated.
Edit: Change parameters for an existing detector. All of the parameters are disabled
when selecting a detector until the Edit button is selected to prevent inadvertent
changes to these critical parameters.
Delete: Completely remove the detector configuration from the working database.
Deleting the detector from the configuration does not actually delete any analysis
information, nor does it delete the database associated with that detector or any files
that may have been created outside of the database. When a detector is deleted from
the configuration that detector will no longer be available in the Quick Start program,
Sample or QA Administration programs, or Excel Add-In functions after the databases
are synchronized.
Save: Save changes made by Adding or Editing a detector configuration. (This button
is only displayed after Add or Edit button is selected.)
Cancel: Discard changes in the Add or Edit detector configuration mode. (This button
is only displayed after Add or Edit button is selected.)
The following Database Tools are provided for the currently selected detector. These tools
are disabled when in the Edit mode.
Archive: This function allows you to save the database for the selected detector to
another file name similar to copying the database file in Windows Explorer. The default
file name for the database will be the original database name followed by the current
date in the format “YYYY-MM-DD”. The detector database is not changed in any way.
Note that analysis data can be accessed from an archived database by selecting the
“Archived Database” item in the Detector list in the header section.
If it is necessary to query an archived database using the Analysis Log, then a
temporary Detector should be established with a path to the respective database so
that it will be available to the Analysis Log. The archived detector database will also be
available as a direct Detector selection in the Analysis Editor with this configuration.
Page A26 of A91
A.2.3.3
Compact: This function compacts the database for the selected detector similar to the
process performed by Microsoft Access. Global Value uses an Access format database
which does not reclaim used space when data is deleted (i.e. the file size is not
automatically reduced when records are deleted). Normally there is very little space to
recover unless a large number of records have been removed (i.e. after using the Purge
function).
Purge: This function will delete all analysis records in the selected detector database
that are prior to date specified in the field below this button. The date can be selected
from a calendar control by selecting the drop down arrow. When Purge is selected a
confirmation dialog will be displayed indicating that all analysis data prior to the
specified date will be deleted. Select “Yes” to purge the data, or “No” to cancel.
This Purge function is normally used to clear old records when setting up a new
database or after Archiving a production database that is very large (hundreds of
megabytes). Administrative procedures are normally established to Archive databases
on at least an annual basis and Purge data older than some specified cutoff in the
current production database. Typically a year of two of data in the current production
database is sufficient for easy retrieval while keeping the system running without
unnecessary delays.
Sample Types and Record Types
Sample Types are simply descriptive categories of samples that are often tied to a specified
Document Control code (or Record Type / R-TYPE) for record keeping purposes. These
parameters are linked to allow the selection of a meaningful Sample Type and have the
sometimes cryptic R-Type set automatically in automation Jobs (See Section B.13) and in
the Analysis Editor. They can also be displayed on the Custom Report Summaries or used
as filter parameters when searching for specific samples using the Analysis Log. (See
Appendix D for field length limitations.)
Figure A.2.3.3.1 Sample Types Tab
The following command buttons are available to manage Sample/R-Types as shown in
Figure A.2.3.3.1:
Add: A prompt is displayed allowing the new Sample and R-Types to be entered.
Delete: Remove the selected item from the database. A confirmation dialog will be
displayed to help prevent inadvertent deletions.
Page A27 of A91
A.2.3.4
Save: Saves changes to the R-Type field for the selected Sample Type. Note that the
Sample Type is not editable after the Add function as this field is often a key parameter
established in automation Jobs and other configuration files.
Print: Generates a report of all Sample Types and associated R-Types based on the
selected Destination and Sort Order. If the Destination is set to the PDF or Text File
options, then a standard Windows dialog will be displayed to specify to the desired
location. If the “Open File After Save” option is checked, then the PDF or Text file will
be opened using the default program for opening these types of files similar to opening
one of these files directly from Windows Explorer. Note that Microsoft Word must be
installed to use the MS Word option.
Nuclide Adjustment Factors
Nuclide Adjustment Factors are used for a variety of calculations on custom report
summaries and using the Excel Add-In. For example, nuclide activity can be multiplied by
the specified adjustment factor to calculate Dose Equivalent Iodine or divided by the
adjustment factor to determine a fraction of a limit such as Derived Air Concentration fraction
for air samples. The adjustment factors can also be used to group nuclide activities by
various types, such as Natural vs Reactor Products or Fission vs Activation products or
Noble Gas vs Non-Gas activity. These groups can be accomplished by including the
applicable nuclides in a table named for the applicable category with an adjustment factor of
“1” which can be multiplied by the nuclide activity. (See example Report Templates).
Figure A.2.3.4.1 Nuclide Adjustment Factors Tab
Nuclide Adjustment Factors must be assigned to Adjustment Tables that define the
adjustment or correction factors. Several tables are defined in the database installed with
the default configuration files. These tables are EXAMPLES ONLY and are not intended as
a technical reference for any particular application. All adjustment factors employed in a
production environment MUST be verified to meet the specific site needs based on
procedural and regulatory requirements as well as the library configuration established for
sample analysis.
Page A28 of A91
ADJUSTMENT TABLES are managed using the buttons from this group in Figure A.2.3.4.1
as follows:
Add: A prompt is displayed to enter a new table name. Names should generally be
kept short as they will be used as special codes on the report templates. (See Section
A.2.3.5) Only alpha numeric characters may be used in the name with no spaces. The
new table name will be added to the list, but it is not saved to the database and cannot
be edited or nuclides added until it is saved.
Edit: A prompt is displayed to change the name of the selected table. This prompt is
also displayed by double-clicking on a table name. After changing a table name the
table list must be saved before changes can be made to the nuclide list for that table.
Delete: The selected table name will be appended with “_Delete” to indicate that this
table will be completely removed from the database when the table list is saved.
Restore: This option restores the table name after the Edit or Delete options are used if
the changes have not been saved.
ReList: The list of table names is refreshed from the database. Any changes to the
table list, such as adding new names or flagging tables to delete, that have not been
saved are discarded.
Save: The list of tables is saved to the database. Any tables with the “_Delete” flag
appended are permanently removed and table names that have been edited are
updated at this time.
NUCLIDE ADJUSTMENT FACTORS are managed using the buttons from this group in
Figure A.2.3.4.1 as follows: (Note that the list of Nuclide Adjustment Factors is associated
with the currently selected Adjustment Factor Table.)
Add: A prompt is displayed to enter a new nuclide and associated adjustment factor.
All existing nuclide names are listed in the drop down list for selection (with auto-search
enabled while typing) or a new nuclide name can be entered to add it to the list. Nuclide
names must match those specified in the sample analysis in order for the correction
factors to be applied correctly. The adjustment factor for the selected nuclide can be
entered in any format, but all adjustment factors are displayed in scientific notation with
five significant digits in the list. No changes are stored in the database until the list is
saved.
Edit: A prompt is displayed to change the name of the selected nuclide and value of the
adjustment factor. The edit mode is also enabled by double-clicking on an item in the
list. No changes are made in the database until the list is saved.
Delete: A dialog is displayed to confirm that the selected nuclide will be deleted from the
list. If YES is selected, then the nuclide name is set to “Deleted” and the adjustment
factor value is set to zero. No changes are made in the database until the list is saved.
Save: The list of adjustment factors for the selected table is saved to the database. Any
nuclides listed as “Deleted” are permanently removed, and all items added or changed in
the list are saved.
Print: A report is generated with all Nuclide Adjustment Factors associated with the
selected Adjustment Table and Detector to the specified Destination. If the Destination
is set to the PDF or Text File options, then a standard Windows dialog will be displayed
to specify to the desired location. If the “Open File After Save” option is checked, then
the PDF or Text file will be opened using the default program for opening these types of
files similar to opening one of these files directly from Windows Explorer. Note that
Microsoft Word must be installed to use the MS Word option.
Page A29 of A91
A.2.3.5
Report Templates
Report Templates are simple text templates that define the data and layout of the Global
Value custom report summaries. Special Parameter Codes are used to return analysis data
from the database and all other text is displayed on the report exactly as shown on the
template.
The template editor behaves similar to a standard Windows text editor, such as Notepad,
allowing the use of routine Cut, Copy, Paste, Delete commands available from the RightClick shortcut menu or using standard keyboard combinations (Ctrl + X, C, V, etc.). The
standard page width is 78 characters using the default font size of 11 cpi. The ruler at the
top of the template editor can be used as a guide to ensure that the maximum width is not
exceeded. The ruler is 80 characters wide and will scale with the template layout when
changing the Viewer Font size. If more characters per line are required, then the font size in
the rendered reports can be adjusted from the Analysis Editor or in automation Jobs with the
Print_Rpt program as described in Section B.25.
NOTE: Do not use the TAB character when aligning text because this character is treated
as a single SPACE character when report summaries are generated.
Several example templates are provided in the database which may be used as a starting
point for creating your own reports.
Figure A.2.3.5.1 Report Templates Tab
Parameter codes are available in the list to the right of the template editor as shown in
Figure A.2.3.5.1. A detailed description of each parameter is available in Table A.2.3.5.
These parameters can be added to the report template in Edit mode by clicking on the item
in the list and pasting it to the appropriate location in the report template using the RightClick shortcut menu or the keyboard combination “CTRL + V”. This process uses the
Windows clipboard for temporary storage similar to the standard Copy/Paste functions in
other Windows applications.
Page A30 of A91
The following command buttons are available to manage Report Templates:
Add: Edit mode is enabled with a blank report template name and layout. Enter a name
for the report and define the layout by adding standard text around the desired report
parameters. A simple method of creating a new report template is to copy the entire
content of an existing template, paste it into the empty template editor, and then modify it
as necessary for the new report content. The Add, Edit, and Delete buttons are replaced
with the Save and Cancel buttons when in the edit mode.
Edit: Edit mode is enabled to allow an existing report template name and layout to be
modified. The Add, Edit, and Delete buttons are replaced with the Save and Cancel
buttons when in the edit mode.
Delete: A dialog is displayed to confirm that the selected report template should be
deleted from the list. If YES is selected, then the template is permanently deleted.
Save: The template name and content are saved to the database. Note that neither the
template name nor the template content fields can be blank, and the template name
must be unique.
Page A31 of A91
CSV
CVR
TXT
PDF
XML
Table A.2.3.5.1 Report Template Parameter Codes
Report Code
Returned Data
|ACQ_DONE|
Acquistion Complete Time
Report Format = Regional Short Date and Time format = hh:mm:ss
XML/CSV Format = YYYY-MM-DD hh:mm:ss
X X X X X
|ACTRANGE|
Activity Range Factor (format = "0.00")
X X X X X
|ACTUDIV1|
|ACTUDIV2|
Activity Units Divisor from analysis settings for first (or only) and
second analysis (format = "0.0000E+00")
X X X X X
|ACTUMULT1|
|ACTUMULT2|
Activity Units Multiplier from analysis settings for first (or only) and
second analysis (format = "0.0000E+00")
X X X X X
|ANALYST|
Analyst Name
X X X X X
|AU|
Activity Units (i.e. Bq/ml)
X X X X X
|BATCH|
Batch ID
X X X X X
|CAL1|
|CAL2|
Calibration File Name for first (or only) and second analysis
X X X X X
|CAL1EFDate|
|CAL2EFDate|
Efficiency Calibration Date/Time for the First (or only) and second
Analysis
Report Format = Regional Short Date and Time format = hh:mm
XML/CSV Format = YYYY-MM-DD hh:mm:ss
X X X X X
|CAL1ENDate|
|CAL2ENDate|
Energy Calibration Date/Time for the First (or only) and second
Analysis
Report Format = Regional Short Date and Time format = hh:mm
XML/CSV Format = YYYY-MM-DD hh:mm:ss
X X X X X
|CHANGESUMMARY|
Full content of Change Summary (left aligned on report)
X X X X
|CI|
Confidence Interval (Sigma) from analysis settings (format = "0")
X X X X X
|COMMENT|
Comments field content (left aligned on report)
X X X X
|CSR|
Cs-134/137 Ratio (Format = "0.000")
Must be located on the report after the nuclide table.
X X X
|DEAD|
Dead Time (Format = “0.00”)
X X X X X
|DESC|
Sample Description
X X X X X
|DET|
Detector Description
X X X X X
|EDITDATE|
Most recent date when changes were applied in the Analysis Editor
Report Format = Regional Short Date and Time format = hh:mm
XML/CSV Format = YYYY-MM-DD hh:mm:ss
X X X X X
|EDITOR|
Most recent Editor Name
X X X X X
|EFF1|
|EFF2|
Efficiency Calibration Description for first (or only) and second
analysis
X X X X X
|ENG1|
|ENG2|
Analysis Engine used for first (or only) and second analysis
X X X X X
Page A32 of A91
Returned Data
|ENG1VER|
|ENG2VER|
Analysis Engine Version for first (or only) and second analysis
X X X X X
|GDT-P|
Gas Decay Tank Pressure (Format = "0.00")
X X X X X
|GDT-V|
Gas Decay Tank Volume (Format = "0.00")
X X X X X
|GRCTS|
Total Gross Counts in the first ROI, or the entire spectrum if no ROI
exists.
X X X X X
|GRCR|
Gross Counts divided by Live Time (Format = "0.00")
X X X X X
|IR|
I-131/133 Ratio (Format = “0.000”)
Must be located on the report after the nuclide table.
X X X
|LIB1|
|LIB2|
Library File Name for first (or only) and second analysis
X X X X X
|LIBMW|
Library Match Width from analysis settings (format = "0.00")
X X X X X
|LIVE|
Live Time (Format = “#0”)
X X X X X
|MAXHL|
Half-Lives Cutoff Limit (format = "0.00")
X X X X X
|NUCRAT_NUM_DIV_F|
X X X
Nuclide Ratio Calculation
NUCRAT=The parameter indicating that the nuclide ratio calculation
will be returned.
NUM =The Nuclide Name whose activity will be used as the
Numerator in the calculation.
DIV =The Nuclide Name whose activity will be used as the Divisor in
the ratio calculation.
F = Number format used in the display of the calculated value as
follows:
"S" indicates scientific notation followed by the number of digits
to follow the decimal place.
A number without the "S" specifies the number of digits to follow
the decimal place in a fixed number format.
CSV
Report Code
CVR
TXT
PDF
XML
Table A.2.3.5.1 Report Template Parameter Codes
Must be located on the report after the nuclide table.
The value returned is left aligned.
|PAGEBREAK|
Forces a new page at the current location.
X X X
|PAGES|
Total number of pages in report document.
A placeholder (#PAGES#) is displayed in the Analysis Editor report
viewer, and this parameter is replaced by the number of pages in
the report when printing to the Printer or MS Word, or saving the
report to PDF or Text formats. This placeholder is used because
the number of pages will change depending on the print option
(Summary, Details, or both).
X X X
|PBC1DATE|
|PBC2DATE|
Peak Background Correction DATE for the First (or only) and
second Analysis
Report Format = Regional Short Date and Time format = hh:mm
XML/CSV Format = YYYY-MM-DD hh:mm:ss
X X X X X
Page A33 of A91
CSV
CVR
TXT
PDF
XML
Table A.2.3.5.1 Report Template Parameter Codes
Report Code
Returned Data
|PBC1NAME|
|PBC2NAME|
Peak Background Correction Filename for the First (or only) and
second Analysis
X X X X X
|PBCMW|
PBC Match Width from analysis settings (format = "0.00")
X X X X X
|PKCUTOFF|
Peak Cutoff from analysis settings (format = "0.00")
X X X X X
|PUBLISHDATE|
Publish Date/Time
Report Format = Regional Short Date and Time format = hh:mm
XML/CSV Format = YYYY-MM-DD hh:mm:ss
X X X X X
|PUBLISHER|
Publisher Name
X X X X X
|RADMON|
Radiation Monitors and values. Each set separated by commas.
X X X X X
|RANDUNCERT|
Additional Random Uncertainty from analysis settings
(format = "0.00")
X X X X X
|REAL|
Real Time (Format = “#0”)
X X X X X
|REVIEWDATE|
Review Date/Time
Report Format = Regional Short Date and Time format = hh:mm
XML/CSV Format = YYYY-MM-DD hh:mm:ss
X X X X X
|REVIEWER|
Reviewer Name
X X X X X
|RSFCORR|
Random Summing Factor Correction (format = "0.00000E+00")
X X X X X
|RSFSLOPE|
Random Summing Factor Slope (value entered in analysis options)
(format = "0.00000E+00")
X X X X X
|RTYPE|
R-Type (Record Type)
X X X X X
|RWP|
RWPs separated by commas.
X X X X X
|SMP_ACQU|
Acquisition Start Date/Time
Report Format = Regional Short Date and Time format = hh:mm:ss
XML/CSV Format = YYYY-MM-DD hh:mm:ss
X X X X X
|SMP_ANAL|
Analysis Report Date/Time
Report Format = Regional Short Date and Time format = hh:mm
XML/CSV Format = YYYY-MM-DD hh:mm:ss
X X X X X
|SMP_STOP|
Sample Stop Date/Time
Report Format = Regional Short Date and Time format = hh:mm
XML/CSV Format = YYYY-MM-DD hh:mm:ss
X X X X X
|SMP_STRT|
Sample Start Date/Time
Report Format = Regional Short Date and Time format = hh:mm
XML/CSV Format = YYYY-MM-DD hh:mm:ss
X X X X X
|SMPLR|
Air Sampler Identification
X X X X X
|SPC|
Spectrum File Name
X X X X X
|SPCPATH|
Spectrum File Path
X X X X X
Page A34 of A91
CSV
CVR
TXT
PDF
XML
Table A.2.3.5.1 Report Template Parameter Codes
Report Code
Returned Data
|SPCPICTURE|
Image of Spectrum in Log mode.
A placeholder (#SPECTRUMPLACEHOLDER #) is displayed in the
Analysis Editor report viewer, and this parameter is replaced by the
spectrum image when printing to the Printer or MS Word, or saving
the report to PDF format.
Only one image per document is allowed. If more than one is
specified then only the first is rendered as an image.
X
|STYPE|
Sample Type
X X X X X
|SYSUNCERT|
Additional Systematic Error from analysis settings
(format = "0.00")
X X X X X
|TEXE|
Total Equivalent Xe-133 (Curies)
1) Requires an Adjustment Factor Table named "EQXE" and a "*"
or "/" to be used in the Nuclide Activity row (i.e. |*_EQXE_S2|)
2) Requires a valid GDT Volume and Pressure
3) Cannot precede the nuclide table.
4) Number format is "0.00E+00"
5) Calculation details:
TEXE = EQXE Conc * Tank Volume
where:
X X X
X
EQXE Conc = ∑(Ai * EQXEi) = EQXE column total
Tank Volume (cc) = K * (P1 * V1) / P2
P1 = GDT pressure (psig) + 14.7
P2 = 14.7 (atmospheric pressure)
V1 = GDT Volume (ft3)
K = Units Conversion = 2.83E-02
(12^3 in3/ft3) * (2.54^3 cm3/in3) / (1E+6 uCi/Ci)
|UDUN?|
User-Defined Uncertainty Name from analysis options
(where ? is replaced by 1 through 9)
X X X X X
|UDUV?|
User-Defined Uncertainty Value from analysis options
(where ? is replaced by 1 through 9) (format = "0.00")
X X X X X
|UNIDPK|
Simple Unidentified Peak List (Energy – Identification)
1) Peaks are taken from the first analysis report if dual analyses
were performed.
2) Table is left aligned based on the location of the |UNIDPK|
parameter.
3) Peak Energies within the table are right aligned.
4) Number format is "0.00"
X X X
Page A35 of A91
Report Code
Returned Data
|UNIDPK_|
Advanced Unidentified Peak List (Full Unidentified Peak Table)
1) Table includes: Background and Net Counts, Net Countrate,
Uncertainty, FWHM, Flags, and Identification in that order.
2) Number formats are the same as the Unidentified Peak table in
the Analysis Editor.
3) The Identification column is populated with the Identification
field value from the Analysis Editor if the field has been
populated (i.e. manually updated by the user). If this field is
blank then the entry from the Suspect Nuclide column is
displayed.
4) One or more optional parameters separated by the underscore
character can be included to filter the data shown in the table
using the following format:
CSV
CVR
TXT
PDF
XML
Table A.2.3.5.1 Report Template Parameter Codes
X X X
|UNIDPK_MINENERGY#_MAXENERGY#_MINBKGD#_MAXBKGD#_
MINNET#_MAXNET#_MININT#_MAXINT#_MINUNCERT#_MAXUNCERT#|
Where
“#” is replaced with the desired value for each parameter.
MINENERGY: returns records where peak energy > #.
MAXENERGY: returns records where peak energy < #.
MINBKGD: returns records where peak background > #.
MAXBKGD: returns records where peak background < #.
MINNET: returns records where net area > #.
MAXNET: returns records where net area < #.
MININT: returns records where net countrate (intensity) > #.
MAXINT: returns records where net countrate (intensity) < #.
MINUNCERT: returns records where % uncertainty > #.
MAXUNCERT: returns records where % uncertainty < #.
|UNIT|
Site Unit
X X X X X
|VOL|
Sample Quantity (Format = “0.000E+00”)
X X X X X
|VOLUNCERT|
Sample Quantity Uncertainty (format = "0.00")
X X X X X
|VU|
Sample Quantity Units
X X X X X
|CUSTOM!|
Any custom parameters established on the Custom Fields tab in
Sample Administration Configuration Editor can be displayed using
the Report Code specified for each parameter. These codes have
an exclamation point (!) at the end.
X X X X X
Page A36 of A91
|_ACT_S#|
Returned Data
Nuclide Table Parameters
Primary Nuclide Activity Column (normally decay corrected)
1) Must be on the same row as the |_NUC_| code
2) Value is right aligned.
3) See GV_GetRptData (Section B.22) for optional default values
assigned to nuclides that exceed the Half-life cutoff limit.
4) Format is determined by the last one or two characters where:
X X X
S - Indicates scientific notation. Fixed number format is
used if omitted.
# - Specifies the number of digits to follow the decimal place
in either scientific or fixed number formats.
|_ACTCT_ S#|
Time of Count Activity (not decay corrected)
1) Must be on the same row as the |_NUC_| code
2) Value is right aligned.
3) S# - See |_ACT_S#| format code.
X X X
|_DC_S#|
Decay Correction (DC)
1) Must be on the same row as the |_NUC_| code.
2) Value is right aligned.
3) S# - See |_ACT_S#| format code.
4) Calculated as DC = DTA x DDC x DDA
Where: (See GammaVision manual for calculations.)
DTA = Decay to Acquisition
DDC = Decay During Collection
DDA = Decay During Acquisition
NOTE: This is the overall decay correction. The Time of Count
activity generated in GammaVision has the DDC and DDA
corrections applied, so this value cannot be directly derived by the
difference between the Time of Count and Decayed activities.
X X X
|_EHL_S#|
Elapsed Half Lives (EHL)
1) Must be on the same row as the |_NUC_| code.
2) Value is right aligned.
3) S# - See |_ACT_S#| format code.
4) Calculated as EHL = Ln(DC)/Ln(2)
If too many half-lives have elapsed, then this calculation
may result in an error in the Ln(DC) function. If this occurs,
then the following calculation is used instead:
EHL = (Acquisition Start – Collection End) / Half-Life
X X X
Page A37 of A91
CSV
Report Code
CVR
TXT
PDF
XML
Table A.2.3.5.1 Report Template Parameter Codes
Report Code
Returned Data
|_F_|
Nuclide Summary Peak Flags (typically used with Standard Nuclide
Data)
E – Displayed if any of the nuclide information has been changed in
the Analysis Editor.
# – Displayed if the Bad Shape flag was displayed on the original
GammaVision report.
A – Displayed if the decayed activity is less than the MDA value.
B – Displayed if the decayed activity is less than the MDA2
(normally critical level) value.
X X X
When this field is used in the nuclide summary, the “E” flag that
previously followed the nuclide activity value is no longer displayed.
Otherwise, the table displays standard nuclide activity with the “E”
as in previous versions.
|_FF_|
Nuclide Summary Peak Flags Full List (typically used with ISO
NORM Nuclide Data)
< – Displayed if the Standard Nuclide activity is reported as <MDA.
E – Displayed if any of the nuclide information has been changed in
the Analysis Editor.
# – Displayed if the Bad Shape flag was displayed on the original
GammaVision report.
A – Displayed if the decayed activity is less than the MDA value.
B – Displayed if the decayed activity is less than the MDA2
(normally critical level) value.
C – Displayed if the ISO NORM Best decayed activity is less than
the Decision Threshold (Critical Level) value.
D – Displayed if the ISO NORM Best decayed activity is less than
the Detection Limit (MDA) value.
X X X
When this field is used in the nuclide summary, the “E” flag that
previously followed the nuclide activity value is no longer displayed.
Otherwise, the table displays standard nuclide activity with the “E”
as in previous versions.
|_HL_S#|
Half Life (days) (HL)
1) Must be on the same row as the |_NUC_| code.
2) Value is right aligned.
3) S# - See |_ACT_S#| format code.
X X X
|_ IDEC _S#|
ISO NORM Nuclide Activity Column (normally decay corrected)
1) Must be on the same row as the |_NUC_| code
2) Value is right aligned.
3) S# - See |_ACT_S#| format code.
4) If Decay Correction is enabled, then this value is decay
corrected unless the Half-Life Cutoff is exceeded. If the HalfLife Cutoff is exceeded, then this value is set to the Time of
Count value similar to the GammaVision report content.
X X X
Page A38 of A91
CSV
CVR
TXT
PDF
XML
Table A.2.3.5.1 Report Template Parameter Codes
Report Code
Returned Data
|_ ITOC _S#|
ISO NORM Time of Count Activity (not decay corrected)
1) Must be on the same row as the |_NUC_| code
2) Value is right aligned.
3) S# - See |_ACT_S#| format code.
X X X
|_ IUAC _S#|
ISO NORM Counting Uncertainty in Activity Units
1) Must be on the same row as the |_NUC_| code
2) Value is right aligned.
3) S# - See |_ACT_S#| format code.
4) If Decay Correction is enabled, then this value is decay
corrected unless the Half-Life Cutoff is exceeded. If the HalfLife Cutoff is exceeded, then this value is set to the Time of
Count value similar to the GammaVision report content.
X X X
|_ IUPC _S#|
ISO NORM Counting Uncertainty in Percent
1) Must be on the same row as the |_NUC_| code
2) Value is right aligned.
3) S# - See |_ACT_S#| format code.
X X X
|_ IUAT _S#|
ISO NORM Total Uncertainty in Activity Units
1) Must be on the same row as the |_NUC_| code
2) Value is right aligned.
3) S# - See |_ACT_S#| format code.
4) If Decay Correction is enabled, then this value is decay
corrected unless the Half-Life Cutoff is exceeded. If the HalfLife Cutoff is exceeded, then this value is set to the Time of
Count value similar to the GammaVision report content.
5) If Standard Nuclide Activity is reported as <MDA, then this
value is set to the ISO NORM Counting Uncertainty in Activity
Units.
X X X
|_ IUPT _S#|
ISO NORM Total Uncertainty in Percent
1) Must be on the same row as the |_NUC_| code
2) Value is right aligned.
3) S# - See |_ACT_S#| format code.
4) If Standard Nuclide Activity is reported as <MDA, then this
value is set to the ISO NORM Counting Uncertainty in Percent.
X X X
|_ IMIN _S#|
ISO NORM Minimum Activity as Reported by GammaVision
1) Must be on the same row as the |_NUC_| code
2) Value is right aligned.
3) S# - See |_ACT_S#| format code.
4) If Decay Correction is enabled, then this value is decay
corrected unless the Half-Life Cutoff is exceeded. If the HalfLife Cutoff is exceeded, then this value is set to the Time of
Count value similar to the GammaVision report content.
X X X
Page A39 of A91
CSV
CVR
TXT
PDF
XML
Table A.2.3.5.1 Report Template Parameter Codes
Report Code
Returned Data
|_ IMAX _S#|
ISO NORM Maximum Activity as Reported by GammaVision
1) Must be on the same row as the |_NUC_| code
2) Value is right aligned.
3) S# - See |_ACT_S#| format code.
4) If Decay Correction is enabled, then this value is decay
corrected unless the Half-Life Cutoff is exceeded. If the HalfLife Cutoff is exceeded, then this value is set to the Time of
Count value similar to the GammaVision report content.
X X X
|_ ICRL _S#|
ISO NORM Critical Level (Decision Threshold)
1) Must be on the same row as the |_NUC_| code
2) Value is right aligned.
3) S# - See |_ACT_S#| format code.
4) If Decay Correction is enabled, then this value is decay
corrected unless the Half-Life Cutoff is exceeded. If the HalfLife Cutoff is exceeded, then this value is set to the Time of
Count value similar to the GammaVision report content.
X X X
|_ IMDA _S#|
ISO NORM Minimum Detectable Activity (Detection Limit)
1) Must be on the same row as the |_NUC_| code
2) Value is right aligned.
3) S# - See |_ACT_S#| format code.
4) If Decay Correction is enabled, then this value is decay
corrected unless the Half-Life Cutoff is exceeded. If the HalfLife Cutoff is exceeded, then this value is set to the Time of
Count value similar to the GammaVision report content.
X X X
|_MDA_S#|
X X X
Standard Nuclide MDA
1) Must be on the same row as the |_NUC_| code.
2) Value is right aligned.
3) S# - See |_ACT_S#| format code.
4) If Decay Correction is enabled, then this value is decay
corrected unless the Half-Life Cutoff is exceeded. If the Half-Life
Cutoff is exceeded, then this value is set to the Time of Count
value.
X X X
Standard Nuclide MDA2 (Typically Critical Level)
|_MDA2_S#|
1)
2)
3)
4)
Must be on the same row as the |_NUC_| code.
Value is right aligned.
S# - See |_ACT_S#| format code.
If Decay Correction is enabled, then this value is decay
corrected unless the Half-Life Cutoff is exceeded. If the Half-Life
Cutoff is exceeded, then this value is set to the Time of Count
value.
Page A40 of A91
CSV
CVR
TXT
PDF
XML
Table A.2.3.5.1 Report Template Parameter Codes
Report Code
Returned Data
|A_NUC_?|
X X X
Indicates the start of the Nuclide table with the specified records.
1) Must be the first parameter on the nuclide table line.
2) The “A” flag is optional. If included all nuclides from the first
and second analysis will be included in the table. If omitted,
the last |EFF|, |CAL|, or |LIB| code found before the nuclide
table determines which analysis nuclides to display based on
the parameter suffix (i.e. 1st or 2nd analysis nuclides). This
feature may be used to display the results from each analysis
in separate nuclide tables.
3) The “?” flag can be set to R, M, <, >, or omitted to define which
nuclides are displayed in the table as follows:
R – Omits nuclides reported with the “<” symbol.
M – Omits nuclides reported without the “<” symbol.
< – Shows nuclides with activity less than or equal to the
MDA2 value.
> – Shows nuclides with activity greater than or equal to the
MDA2 value.
Omitted – Shows all nuclides. Nuclides without the “<” flag
are reported first.
4) Nuclide name is left aligned to the parameter position.
|_UNCT_S#|
|_UNCTAC_S#|
X X X
Standard Nuclide Uncertainty Reported
1) Data is based on the standard GammaVision report uncertainty
as set in the Analysis Options (i.e. % or Activity units for Total or
Counting Uncertainty). This value is set to the Total Uncertainty
if the Total option is selected.
2) Must be on the same row as the |_NUC_| code.
3) Value is right aligned.
4) S# - See |_ACT_S#| format code.
X X X
Standard Nuclide Counting Uncertainty in Activity Units
1)
2)
3)
4)
|_UNCTAT_S#|
Must be on the same row as the |_NUC_| code.
Value is right aligned.
S# - See |_ACT_S#| format code.
If Decay Correction is enabled, then this value is decay
corrected unless the Half-Life Cutoff is exceeded. If the Half-Life
Cutoff is exceeded, then this value is set to the Time of Count
value.
X X X
Standard Nuclide Total Uncertainty Activity Units
1) Must be on the same row as the |_NUC_| code.
2) Value is right aligned.
3) S# - See |_ACT_S#| format code.
4) If Decay Correction is enabled, then this value is decay
corrected unless the Half-Life Cutoff is exceeded. If the Half-Life
Cutoff is exceeded, then this value is set to the Time of Count
value.
5) If Standard Nuclide Activity is reported as <MDA, then this value
is set to the Standard Nuclide Counting Uncertainty.
Page A41 of A91
CSV
CVR
TXT
PDF
XML
Table A.2.3.5.1 Report Template Parameter Codes
Report Code
Returned Data
|?_XXX_S#|
Nuclide Adjustment Factor or Calculated Nuclide Value
1) The “?” flag can be set to as follows: *, /, *A, /A, *Mor omitted to
define the column content as follows:
“*” (asterisk) or “/” (backslash) – Value is calculated as
Standard Nuclide Activity times (*) or divided by (/)
Adjustment Factor. If Standard Nuclide Activity is <MDA,
then value is reported as "---".
“*A” or “/A” – Value is calculated as Standard Nuclide Activity
times (*) or divided by (/) Adjustment Factor. If Standard
Nuclide Activity is <MDA, then the MDA is used in the
calculation and the MDA result is included in the column total.
“*M” or “/M” – Value is calculated as Standard MDA times (*)
or divided by (/) Adjustment Factor.
“*M2” or “/M2” – Value is calculated as Standard MDA2 times
(*) or divided by (/) Adjustment Factor.
“*IB” or “/IB” – Value is calculated as ISO NORM Best
Activity times (*) or divided by (/) Adjustment Factor.
“*IMN” or “/IMN” – Value is calculated as ISO NORM
Minimum Activity times (*) or divided by (/) Adjustment Factor.
“*IMX” or “/IMX” – Value is calculated as ISO NORM
Maximum Activity times (*) or divided by (/) Adjustment
Factor.
“*IMD” or “/IMD” – Value is calculated as ISO NORM MDA
(Detection Limit) times (*) or divided by (/) Adjustment Factor.
“*ICL” or “/ICL” – Value is calculated as ISO NORM Critical
Level (Decision Threshold) times (*) or divided by (/)
Adjustment Factor.
2)
3)
4)
5)
Omitted – Adjustment Factor value is displayed without
calculations. Column total is not calculated.
“XXX” is the name of a valid Nuclide Adjustment Factor Table
as displayed in the Adjustment Factor Editor.
Must be on the same row as the |_NUC_| code.
Value is right aligned.
S# - See |_ACT_S#| format code.
Page A42 of A91
X X X
CSV
CVR
TXT
PDF
XML
Table A.2.3.5.1 Report Template Parameter Codes
Report Code
Returned Data
|TOTAL|
|TOTALI|
X X X
Nuclide Activity and Nuclide Adjusted column totals
1) |TOTAL| - Column Totals are displayed for all columns except
for MDA, MDA2, ISONORM MDA (Detection Limit), ISO NORM
Critical Level (Decision Threshold), Uncertainty, and Nuclide
Adjustment Factors displayed without calculations (i.e. no * or /
applied) for nuclides with activity greater than zero and not
reported as “<” MDA.
2) |TOTALI| - Calculates column totals similar to |TOTAL| except
that the ISO NORM columns (Activity, TOC Activity, Minimum,
Maximum, and any calculations based on these parameters)
include all nuclide data in the total even if the standard activity is
reported as “<” MDA.
3) Values in any column less than zero are not included in the
totals (i.e. when using the GammaVision Directed Fit option
which could generate negative activity.)
4) Totals are aligned and formatted based on parameter format
codes in the nuclide table.
5) Must be on a row after the |_NUC_| code (normally immediately
after the nuclide table).
|PUBNUCACT|
Nuclide Parameters for XML and CSV files
(Format = 0.0000E+00)
(See related parameters in the previous table for more detail.)
Standard Nuclide Activity (normally decay corrected)
CSV
CVR
TXT
PDF
XML
Table A.2.3.5.1 Report Template Parameter Codes
X X
|PUBNUCAU|
Activity Units
X X
|PUBNUCBADSHAPE|
TRUE or FALSE depending on Bad Shape Flag status
X X
|PUBNUCDC|
Decay Correction (See |_DC_S#| above for calculation.)
X X
|PUBNUCEDITED|
TRUE or FALSE depending on Edit status
X X
|PUBNUCEHL|
Elapsed Half Lives (See |_EHL_S#| above for calculation.)
X X
|PUBNUCFLAG|
Returns “<” if activity reported as “<” MDA value, otherwise blank.
X X
|PUBNUCHL|
Half-Life (days)
X X
|PUBNUCMDA|
Standard Nuclide MDA
X X
|PUBNUCMDA2|
Standard Nuclide MDA2
X X
|PUBNUCNAME|
Nuclide Name
X X
|PUBNUCTOCACT|
Standard Nuclide Time of Count Activity (not decay corrected)
X X
|PUBNUCUNCT|
Standard Nuclide Reported Uncertainty
Data is based on the standard GammaVision report uncertainty
as set in the Analysis Options (i.e. % or Activity units for Total or
Counting Uncertainty).
X X
|PUBNUCUNCTAC|
Standard Nuclide Counting Uncertainty in Activity Units
X X
|PUBNUCUNCTAT|
Standard Nuclide Total Uncertainty in Activity Units
X X
|PUBNUCIDEC|
ISO NORM Best Activity (normally decay corrected)
X X
Page A43 of A91
Report Code
Returned Data
|PUBNUCITOC|
ISO NORM Best Time of Count (not decay corrected)
X X
|PUBNUCIUAC|
ISO NORM Counting Uncertainty in Activity Units
X X
|PUBNUCIUPC|
ISO NORM Counting Uncertainty in Percent
X X
|PUBNUCIUAT|
ISO NORM Total Uncertainty in Activity Units
X X
|PUBNUCIUPT|
ISO NORM Total Uncertainty in Percent
X X
|PUBNUCIMIN|
ISO NORM Minimum Activity
X X
|PUBNUCIMAX|
ISO NORM Maximum Activity
X X
|PUBNUCICRL|
ISO NORM Critical Level (Decision Threshold)
X X
|PUBNUCIMDA|
ISO NORM Minimum Detectable Activity (Detection Limit)
X X
|PUBNUC_TBL|
Nuclide Adjustment Factor value from table named “TBL”.
X X
|PUBNUC_*TBL|
|PUBNUC_/TBL|
Calculated as Standard Nuclide Activity times (*) or divided by (/)
Adjustment Factor value from table named “TBL”. If Standard
Nuclide Activity is <MDA, then value is reported as zero.
X X
|PUBNUC_*ATBL|
|PUBNUC_/ATBL|
Calculated as Standard Nuclide Activity times (*) or divided by (/)
Adjustment Factor value from table named “TBL”. If Standard
Nuclide Activity is <MDA, then the MDA is used in the
calculation.
X X
|PUBNUC_*MTBL|
|PUBNUC_/MTBL|
Calculated as Standard Nuclide MDA times (*) or divided by (/)
Adjustment Factor value from table named “TBL”.
X X
|PUBNUC_*M2TBL|
|PUBNUC_/M2TBL|
Calculated as Standard Nuclide MDA2 times (*) or divided by (/)
Adjustment Factor value from table named “TBL”.
X X
|PUBNUC_*IBTBL|
|PUBNUC_/IBTBL|
Calculated as ISO NORM Best Activity times (*) or divided by (/)
Adjustment Factor value from table named “TBL”.
X X
|PUBNUC_*IMNTBL|
|PUBNUC_/IMNTBL|
Calculated as ISO NORM Minimum Activity times (*) or divided
by (/) Adjustment Factor value from table named “TBL”.
X X
|PUBNUC_*IMXTBL|
|PUBNUC_/IMXTBL|
Calculated as ISO NORM Maximum Activity times (*) or divided
by (/) Adjustment Factor value from table named “TBL”.
X X
|PUBNUC_*IMDTBL|
|PUBNUC_/IMDTBL|
Calculated as ISO NORM MDA (Detection Limit) times (*) or
divided by (/) Adjustment Factor value from table named “TBL”.
X X
|PUBNUC_*ICLTBL|
|PUBNUC_/ICLTBL|
Calculated as ISO NORM Critical Level (Decision Threshold)
times (*) or divided by (/) Adjustment Factor value from table
named “TBL”.
X X
|QAANALYST|
QA Header Parameters for All File Types
Analyst Name
X X X X
|QADESC|
Sample Description
X X X X
|QADETNO|
Detector Number
X X X X
|QAPAGES|
Total number of pages in report document.
X X
Page A44 of A91
CSV
CVR
TXT
PDF
XML
Table A.2.3.5.1 Report Template Parameter Codes
Report Code
Returned Data
|QAPUBLISHDATE|
Publish Date/Time
Format = YYYY-MM-DD hh:mm:ss for all file types
X X X X
|QAPUBLISHER|
Publisher Name
X X X X
|QAREVIEWDATE|
Review Date/Time
Format = YYYY-MM-DD hh:mm:ss for all file types
X X X X
|QAREVIEWER|
Reviewer Name
X X X X
|QASMP_ACQU|
Acquisition Start Date/Time
Format = YYYY-MM-DD hh:mm:ss for all file types
X X X X
|QASPC|
Spectrum File Name
X X X X
|QATYPE|
QA Type (either QAPeak or QABackground)
X X X X
|QAPUBHIGHCTRL|
QA Data Parameters for XML and CSV files
QA Parameter High Control Value
X X
|QAPUBHIGHTOL|
QA Parameter High Tolerance Value
X X
|QAPUBLOWCTRL|
QA Parameter Low Control Value
X X
|QAPUBLOWTOL|
QA Parameter Low Tolerance Value
X X
|QAPUBPARAMETER|
QA Parameter Name (i.e. Energy, FWHM, etc.)
X X
|QAPUBPOINT|
QA Point Name (i.e. QA-122, QA-1408, etc.)
X X
|QAPUBRESULT|
Result as displayed on QA report (i.e. PASS, Low OOT, etc.)
X X
|QAPUBTARGET|
QA Parameter Target Value
X X
|QAPUBVALUE|
QA Parameter Measured Value
X X
Page A45 of A91
CSV
CVR
TXT
PDF
XML
Table A.2.3.5.1 Report Template Parameter Codes
A.2.3.6
PDF Properties
The PDF Properties define the PDF file names and passwords that are employed when
“Publishing” reports from the Analysis Editor. These properties are not used when printing
reports to the PDF format from automation Jobs or from the Analysis Editor.
Figure A.2.3.6.1 PDF Properties Tab
The File Name Format is established by adding any of the available field names to the “Used File
Name Fields” list using the arrow buttons or simply double-clicking on an item in the “Available
File Name Fields” list. Items may be removed from the list in a similar manner.
Each field may be separated by additional characters, such as “-“ or “_” to make the file name
easy to decode or parse. The ‘File Name Format” field displays the file naming convention
consisting of the specified fields and separation characters.
When using the “Date” fields, the format of the applicable date is “YYYY-MM-DD hhmm”.
NOTE: When using the GVPublishSample program described in Section A.3, only the
SpectrumID can be used as the filename.
NOTE: Invalid file name characters, such as (\ / : * ? ” < > |), could be used in several available
File Name fields including the sample description, user names, Sample Type, and RType since
all of these fields are treated as simple text throughout the application. These characters would
result in an error preventing the PDF file from being saved, so caution should be exercised when
using these fields. Generally, this should not be issue for fields that are predefined by an
administrator including the names, Sample Type, and RType, but the Sample Description is less
predictable in routine operation.
For additional assurance of report content integrity, passwords can be set to Modify or Open
PDF files using the applicable fields on this tab. Generally, the reports should be available for
viewing by anyone, but encryption to prevent unauthorized changes may be desired. This
condition is established by leaving the “Open” password blank and specifying a password in the
“Modify” password field. Note that modifications to PDF files that are encrypted require a PDF
editor.
Changes are not stored in the database until the Save button is selected.
Page A46 of A91
A.2.3.7
Startup and Non-Analysis Sample Input Defaults
The Misc tab in the Configuration Editor allows default parameters to be defined for system
startup and various data input fields that are not related to the spectrum analysis as described
below.
Figure A.2.3.7.1 Misc Tab
NOTE: Changes made on this tab are automatically saved to the current database!
The following parameters are available on this tab:
Default Database Path: This field requires the full path to the default (Master) Global Value
database. The path can be entered directly, or use the button next to this field to browse for
the specified database file. This database is used read by the Quick Start and Sample
Administration programs on startup to load configuration data, such as the Detector list and
associated properties. It is normally one of the detector databases used for storing analysis
data for samples - not a Quality Assurance database.
When the default database path is changed a connection to the new database is
automatically attempted so that the Sample Admin program doesn't have to be closed and
reopened for the change to take effect. If the path is not valid, then a prompt to browse to the
default database will be displayed. If a valid database is not selected, then the database
path reverts back to the default before the change.
NOTE: A different database can be used as the default when opening the Sample
Administration program by specifying the full path on the command line as described in
Section A.2, but this method is not recommended for a standard configuration.
NOTE: This parameter is established only for the local computer. It is not pushed to the
other databases with the Synchronization described in Section A.2.3.9.
GammaVision Path: This field requires the full path to the GammaVision program on the
local computer. The Quick Start program uses this path to launch GammaVision with
automation Job files so a valid path is required. The path may be entered directly or use the
button next to this field to browse to “GV32.exe”, which is normally installed in the directory
“C:\Program Files\GammaVision” for 32-bit Windows or “C:\Program Files
(x86)\GammaVision” for 64-bit Windows.
NOTE: This parameter is established only for the local computer. It is not pushed to the
other databases with the Synchronization described in Section A.2.3.9.
Page A47 of A91
If Global Value is being installed on a remote computer that does not have GammaVision (i.e.
for remote data sharing only), then a message will be displayed when the Configuration
Manager is accessed from the Sample Administration indicating that the GammaVision path
is invalid along with a prompt to set the GammaVision path. To avoid this message when
accessing the Configuration Manager establish a place holder file by creating a text file on
the local computer, renaming it to GV32.exe, then setting the full path to that file in this field.
Gas Decay Tank Volume: This is the Gas Decay Tank volume in Cubic feet that is used for
the Total Equivalent Xenon (|TEXE|) calculation described in Table A.2.3.5.1.
Default Gas Decay Tank Pressure: This is the default value displayed when the analyst is
prompted for Gas Decay Tank pressure during automation Jobs using the
GV_GetGDTPressure program (see Section B.17).
RWP Prefix: This is the default text displayed in the RWP Prefix field when the analyst is
prompted for RWP (Radiation Work Permit) numbers during automation Jobs using the
GV_GetRWP program (see Section B.19). If this field is left blank then the current year
(format = “YYYY”) is displayed in the RWP entry prompt.
Default Sampler ID: This is the default text displayed when the analyst is prompted for a
Sampler Identification during automation Jobs using the GV_GetSamplePump program (see
Section B.18).
Default Monitor List: This is the list of monitors that are displayed when the analyst is
prompted for Radiation Monitor Readings during automation Jobs using the GV_GetRadMon
program (see Section B.20). A comprehensive list is not always required because the
analyst may enter monitor names that are not listed if necessary.
Site Units List: This is the list of Unit names that are displayed when the analyst is
prompted for the Site Unit during automation Jobs using the GV_GetSiteUnit program (see
Section B.14). A comprehensive list is not always required because the analyst may enter a
unit name that is not listed, or the unit name may be specified without user input.
Show Time of Count Activity in Nuclide Grid: When this option is checked the
Standard Nuclide Time of Count activity field will be displayed in the Analysis Editor Nuclide
Grid. Otherwise, this field will be hidden. (See Section A.2.2.3)
Separate Editor and Analyst: When this option is checked the signature grid on the
Analysis Editor header will include the Editor and Edit Date row which is updated with the
current user name and date when changes are saved. Under this condition, the original
Analyst name is not changed. If this option is not checked, then the Editor row is not
displayed in the Signature grid, and Analyst name is updated to the current user (along with
the hidden Editor field) when changes are saved. The appropriate setting is dictated by the
individual site protocol for electronic data review.
Show ISO NORM Nuclide Option: When this option is checked the “Show ISO NORM”
checkbox is displayed on the Analysis Editor Nuclide Data tab to allow toggling between the
Standard Nuclide data and ISO NORM nuclide data. Otherwise, the “Show ISO NORM”
checkbox is hidden, and the last setting (checked or not checked) determines which data is
displayed on the Nuclide Data tab. (See Section A.2.2.3)
Page A48 of A91
A.2.3.8
Custom Fields
The Custom Fields tab in the Configuration Editor allows end-users to define custom parameter
fields to meet a variety of needs. The data associated with custom fields can be specified using
the standard data entry prompt associated with GVGetCustomData (See Section B.21), custom
applications, or the Analysis Editor. This data can also be displayed on the custom reports or
loaded into Excel using the Add-In functionality.
Figure A.2.3.8.1 Custom Fields Tab
The following fields must be established for each Custom Parameter:
Parameter Name: This field is used to reference the custom parameter when using
GVGetCustomData (See Section B.21) or the Excel Add-In GVAnalysisParameter function
(See Section F1). The parameter name cannot have spaces.
Interface Label: This field is used for the field labels in the Analysis Editor (See Section
A.2.2.5) and the GVGetCustomData manual data input interface (See Section B.21).
Report Code: This field is used to display custom data parameters on Report Templates and
are automatically added to the Report Template parameter list described in Section A.2.3.5.
Locked: This Option is either set to “X” to lock the field in the Analysis Editor or left blank to
allow editing. Typing anything other than an empty space in the “Locked” field will set it to
“X”. This option locks fields that should only be set or modified through the applicable data
entry interfaces implemented in automation Jobs where calculations, dependencies, or
validation rules are imposed.
The following command buttons are available to manage Custom Field parameters:
Add: Adds a row to the bottom of the grid to allow a new field to be defined.
Delete: Removes the currently selected field row. Any data associated with a deleted
parameter will be removed from all databases so caution should be exercised, such as
archiving the databases, before deleting custom fields.
Page A49 of A91
A.2.3.9
Save: All custom field data in the grid is saved if valid entries have been entered.
Move Up / Move Down: Moves the currently selected row up or down within the grid.
Custom parameters are displayed in the Analysis Editor and in the GVGetCustomData data
entry prompt in the order in which they are displayed in the configuration grid.
Synchronizing Databases
When the Sample Administration program starts, it establishes a connection to the default
database, which acts as the Master database for Security and Configuration changes, as
described in Section A.2. Changes applied to Security and Configuration parameters are only
saved in this default database until the others are updated using the Database Synchronization
option shown in Figure A.2.3.9.1 which is accessed from the Sample Administration program as
shown in Figure A.2.2.
Each detector that is configured in the current database is displayed in the list to represent the
database used to store sample analysis data along with an additional entry for the associated QA
Figure A.2.3.9.1 Synchronize Databases
database. If the Default Database on the Misc tab in Configuration Manager is the same path as
any detector database, then that detector database item is omitted from the list. If any detector
database is the same physical database as the default, but has a different path specified in the
configuration (i.e. local path vs shared drive path vs fully qualified network name path), then that
item will be included in the list, but it will be automatically unchecked when the synchronization
process runs based on a flag that is set in the default (or Master) database when the
synchronization is initiated.
The Update button must be selected to start the synchronization all of the selected databases. If
a detector database is not currently available then uncheck the associated detector before the
update or the synchronization will be delayed by the network timeout setting while the program
attempts a connection. If a database cannot be accessed then that item will automatically be
unchecked and a message will be displayed temporarily at the bottom of the dialog. Corrective
action should be taken to ensure that all database remain in synchronization to avoid the
potential of synchronizing from an outdated database and losing more recent changes.
Page A50 of A91
A.3
Sample Publisher
Previous versions of Global Value did not include the standard publishing program as this
functionality was originally intended for custom development for special applications. Based on
experience with many custom installations over the years, Global Value now provides a default
publisher program that satisfies the most common requirements without customization. If additional
functionality is required, the publisher provides the capability to launch other applications after the
published files have been rendered to common file structures that are easily processed. This
approach allows site personnel to develop their own custom applications without having to
understand the underlying details associated with extracting information from Global Value
databases.
When samples are published from the Global Value Sample Administration program, the publisher
program is automatically run with the full path to the published PDF report passed as a command
line parameter. The default publisher program requires this PDF report path to use only the
Spectrum ID as the file name. This file naming convention is used by default, but it is possible to
change the published PDF file name in the Sample Administration Configuration. If the file name is
changed to anything other than only the Spectrum ID, then the publisher program will not behave as
expected. Additionally, the Spectrum ID must start with the detector number followed by an
underscore (i.e. “1_” for Detector #1). This is normally accomplished by configuring the File Prefix
as “X_” where X is the detector number on the Detectors tab in Sample Administration Configuration,
and then using the |DETSPECTRUMPREFIX| parameter generated by Quick Start as the first
parameter in generating the Spectrum ID.
The publisher program, “GVPublishSample”, resides in the installation directory with all of the other
Global Value programs, and has an INI file by the same name. The settings in the INI file determine
which files are generated when the publisher runs and which applications will be launched. File
types that can be generated include PDF, Text, XML, and CSV. In combination with the
GVDataExport program, it can also be used to push analysis results into a non-secured Microsoft
Access database capable of receiving results from multiple detectors. See Section A.12 for more
detail related to GVDataExport. After the publisher has generated the required reports and launched
the specified programs, the original PDF file created by the Sample Administration Analysis Editor is
deleted to avoid a large number of unnecessary files accumulating on the local workstation.
GVPublishSample has the following comma-delimited command line parameters:
1) Full Path to PDF Report (required): The PDF file name must match the spectrum ID, and the file
prefix must be in the format “DETNO_” where DETNO is the detector number. This is the default
configuration for new installations.
2) Full Path to Configuration File (optional): This optional configuration file may be specified when
using the publisher program outside of the routine publishing process. This may be useful for
generating CSV or XML reports and/or processing the data dynamically within automation Jobs.
When this file is omitted, such as when publishing results from the Analysis Editor, the default
configuration file “GVPublishSample.ini” in the Global Value installation directory is used.
Page A51 of A91
A.3.1 Configuration File Content
The Configuration file consists of a series of parameters that are used for generating various file
types and running applications. These parameters are enclosed in pipe characters (“|”) similar to
those used with the Quick Start and GVSampleDataSC programs. Each configuration file can be
configured to generate multiple output files and process them with different applications
automatically if desired.
Two types of parameters are used to generate files and run applications. The file generation
parameters use the prefix “Output” and those used for running applications use the prefix “RunApp”.
All of the “Output” parameters must be listed before the associated “RunApp” parameters.
In addition to the prefix each parameter has a property name followed by a unique character
identifier. This unique identifier is a single character that is used to group the Output and RunApp
properties as well as link the Output file to the RunApp parameters. This identifier can be any
alphanumeric character, thereby providing up to thirty six (36) different Output and RunApp
scenarios in the same file.
The following shows the complete list of Output and RunApp parameters which are discussed in
more detail in the remainder of this section.
|OutputTypeX|=
|OutputEnabledX|=
|OutputCoverTemplateX|=
|OutputIncludeSummaryX|=
|OutputIncludeDetailsX|=
|OutputDirectoryX|=
|OutputFileExtensionX|=
|RunAppPathX|=
|RunAppEnabledX|=
|RunAppCommandLineParameterX|=
Where:
X = Single character unique identifier (0-9, A-Z not case sensitive)
OutputType
The OutputType can be set to PDF, TXT, XML, or CSV.
When set to XML or CSV, an appropriate XML or CSV template must be specified for the
OutputCoverTemplate parameter. The IncludeSummary and IncludeDetails parameters are
ignored for these Output Types.
When set to PDF or TXT, the report content is based on the OutputCoverTemplate,
OutputIncludeSummary, and OutputIncludeDetails parameters – any of which can be omitted.
PDF reports will use the same security rules (passwords) as established in Sample
Administration Configuration on the PDF Properties tab.
Multiple reports can be generated with different content by using the unique character identifier
“X” as shown in Section A.3.1.
OutputEnabled
This parameter is set to “T” (true) to enable the specified report output. Anything other than “T”
will disable the report output. This parameter allows output configurations to be established for
Page A52 of A91
testing or other temporary conditions without removing the complete set of parameters from the
file.
OutputCoverTemplate
The OutputCoverTemplate is a report template appropriate for the output type specified. This
parameter can be the full path to a text file or the name of a Report Template established in the
Sample Administration Configuration. Normally, the latter option would be used as it provides
security for the template content.
For PDF and TXT output types this parameter is optional. If a template is specified then it is
processed in the same way as the Summary Reports in Sample Administration Configuration
and is used as the first section of the report.
For XML and CSV output types this parameter is required since the template defines the layout
and content of these file types. These templates are processed different than those used for
summary reports and must comply with the formatting rules described below. Note that these
templates cannot be used as standard analysis report summaries displayed in the Analysis
Editor.
See Section A.2.3.5 for report template parameters for use with Text, PDF, CSV, and XML files.
The XML Template requires the following configuration:
1)
The data set record must be enclosed in the tags <GVPublishDataSet> and
</GVPublishDataSet>.
2)
The Sample Data record must be enclosed in valid opening and closing tags. The
recommended tags are <GVPublishSampleData> and </GVPublishSampleData>, but other
names could be used if desired.
The Sample Data parameters described for standard report templates may be included
within this record with each parameter enclosed in appropriate opening and closing tags.
Attributes may also be included in tags if desired.
3)
The nuclide data record must be enclosed in the tags <GVPublishNuclideData> and
</GVPublishNuclideData>.
The report parameters in Table A.2.3.5.1 with the “PUBNUC” prefix are valid within the
nuclide record with each parameter enclosed in appropriate opening and closing tags.
4)
When the XML Template is rendered, the Sample Data parameters are replaced with the
applicable results and a record for each nuclide is generated with the tags and data
specified.
Page A53 of A91
The following is an example of a valid XML Template. The piped parameters are those
specified in Table A.2.3.5.1 for Report Templates, but this example does not include all possible
parameters. The tag names are only for example except for the record tags discussed above
which must be named accordingly. Indentation and spacing is for readability only.
<GVPublishDataSet>
<GVPublishSampleData>
<SpectrumID>|SPC|</SpectrumID>
<SpectrumPath>|SPCPATH|</SpectrumPath>
<Detector>|DET|</Detector>
<AcquisitionStartTime>|SMP_ACQU|</AcquisitionStartTime>
<AcquisitionStopTime>|ACQ_DONE|</AcquisitionStopTime>
<SampleCollectionStartTime>|SMP_STRT|</SampleCollectionStartTime>
<SampleCollectionStopTime>|SMP_STOP|</SampleCollectionStopTime>
<Analyst>|ANALYST|</Analyst>
<SampleSize>|VOL|</SampleSize>
<SampleSizeUnits>|VU|</SampleSizeUnits>
<ActivityUnits>|VU|</ActivityUnits>
<Geometry>|EFF1|</Geometry>
</GVPublishSampleData>
<GVPublishNuclideData>
<Nuclide>|PUBNUCNAME|</Nuclide>
<Activity>|PUBNUCACT|</Activity>
<TOCActivity>|PUBNUCTOCACT|</TOCActivity>
<ActivityUnits>|PUBNUCAU|</ActivityUnits>
<MDA>|PUBNUCMDA|</MDA>
<MDA2>|PUBNUCMDA2|</MDA2>
<ReportedUncertainty>|PUBNUCUNCT|</ReportedUncertainty>
<CountUncertainty>|PUBNUCUNCTAC|</CountUncertainty>
<TotalUncertainty>|PUBNUCUNCTAT|</TotalUncertainty>
<Flag>|PUBNUCFLAG|</Flag>
<BadShape>|PUBNUCBADSHAPE|</BadShape>
<Edited>|PUBNUCEDITED|</Edited>
<HalfLife>|PUBNUCHL|</HalfLife>
<ElapsedHalfLives>|PUBNUCEHL|</ElapsedHalfLives>
<DecayCorrection>|PUBNUCDC|</DecayCorrection>
<DACFactor>|PUBNUC_DAC|</DACFactor>
<DACMult>|PUBNUC_*DAC|</DACMult>
<DACDiv>|PUBNUC_/DAC|</DACDiv>
</GVPublishNuclideData>
</GVPublishDataSet>
Page A54 of A91
The CSV (Comma-Separated Values) Template requires the following configuration:
1) The Sample Data and Nuclide Data have two separate records. In the rendered CSV file the
Sample Data will be returned in a single row, and the Nuclide Data will be generated with one
row per nuclide.
2) The Sample Data record must start with the parameter “CSVSAMPLEDATA:”. This parameter is
not returned in the final CSV file. Sample Data parameters described for standard report
templates may be included within this record.
3) The Nuclide Data row must start with the parameter “CSVNUCLIDEDATA:”. This parameter is
not returned in the rendered CSV file. Report parameters with the “PUBNUC” prefix are valid
parameters within the nuclide record.
4) All parameters in the Sample or Nuclide Data rows are returned exactly as listed in each row. If
quotes around parameters are desired to ensure that data with commas, dates, etc. are
interpreted correctly, then the quotes must be included around the applicable parameters in the
template. The comma (or other character delimiter) must also be included to separate each
parameter.
5) Additional text may be included outside of the Sample Data and Nuclide Data record. For
example, a header row or other information may be desired for readability or to satisfy custom
application processing requirements.
The following is an example of a valid CSV Template with a few parameters. Note that parameters
with the exclamation character (“SAMPID!” in this case) are available only if configured as custom
parameters in Sample Administration Configuration.
Detector, Spectrum, SampleID, Sample Date/Time, Acquisition Start Time
CSVSampleData: "|DET|", "|SPC|", "|SAMPID!|", "|SMP_STOP|", "|SMP_ACQU|"
Nuclide Name, Activity, TOC Activity, Activity Units
CSVNuclideData:"|PUBNucName|", "|PUBNucAct|", "|PUBNucTOCAct|", "|PUBNucAU|"
Page A55 of A91
OutputIncludeSummary
This parameter is used only for the PDF and TXT output types. It is ignored for XML and CSV
output types. When set to “T” (true), the Summary Report stored for the sample is included after
the coversheet in the PDF or TXT report that is generated.
OutputIncludeDetails
This parameter is used only for the PDF and TXT output types. It is ignored for XML and CSV
output types. When set to “T” (true), the Detailed Report stored for the sample is included as the
last section of the PDF or TXT report that is generated.
OutputDirectory
A valid directory (file folder) path must be specified to indicate where the rendered file will be
stored. The file name will be the same as the original PDF file name (which is also the Spectrum
ID).
OutputFileExtension
This parameter defaults to the Output type (PDF, TXT, XML, or CSV) if no extension is specified.
Other extensions may be assigned as necessary. For example, a text file may be saved with the
DAT extension if desired.
RunAppPath
This parameter requires the full path to an application to be run. Command line parameters may
also be assigned as described below.
RunAppEnabled
This parameter is set to “T” (true) to enable the specified application. Anything other than “T” will
not allow the application to run. This parameter allows configurations to be established for
testing or other temporary conditions without removing the complete set of parameters.
RunAppCommandLineParameter
Multiple Command Line parameters can be specified for the application. If more than one is
provided, then they will be comma-delimited in the order in which they are listed in the
configuration file.
The following dynamic parameters may be specified in addition to any static parameters desired:
|DETNO|=Detector Number
|SPECTRUMID|=Spectrum ID
|OutputFileNameX|=File name of output file.
|OutputFilePathX|=Full path of output file.
|OutputFileDirectoryX|=Directory of output file.
Where:
X = Single character unique identifier matching the respective RunApp and Output group.
Page A56 of A91
Example Configuration
The following example demonstrates how four different output files of different types can be
generated and two custom applications configured to run with command line parameters. Notes
and comments as shown are acceptable in the configuration file.
XML file for passing data in a standard format.
|OutputType1|=XML
|OutputEnabled1|=T
|OutputCoverTemplate1|=PublishXMLTemplate
|OutputDirectory1|=C:\User\XML
|OutputFileExtension1|=xml
CSV file for passing data in an easily read format.
|OutputType2|=CSV
|OutputEnabled2|=T
|OutputCoverTemplate2|=PublishCSVTemplate
|OutputDirectory2|=C:\User\CSV
|OutputFileExtension2|=csv
Text file consisting of only the coversheet – possibly used as a Meta Data file.
|OutputType3|=TXT
|OutputEnabled3|=T
|OutputCoverTemplate2|=PublishTXTTemplate
|OutputIncludeSummary3|=F
|OutputIncludeDetails3|=F
|OutputDirectory3|=C:\User\TXT
|OutputFileExtension3|=asc
PDF file with a cover sheet, summary report, and detailed report(s).
|OutputType4|=PDF
|OutputEnabled4|=T
|OutputCoverTemplate4|=PublishPDFTemplate
|OutputIncludeSummary4|=T
|OutputIncludeDetails4|=T
|OutputDirectory4|=C:\User\PDF
|OutputFileExtension4|=pdf
Run application to process the XML file.
|RunAppPath1|=C:\User\GVCR\XMLProcessor.exe
|RunAppEnabled1|=T
|RunAppCommandLineParameter1|=|OutputFilePath1|
Run application to process the CSV file with additional command line parameters.
|RunAppPath2|=C:\User\GVCR\CSVProcessor.exe
|RunAppEnabled2|=T
|RunAppCommandLineParameter2|=|DETNO|
|RunAppCommandLineParameter2|=|SpectrumID|
|RunAppCommandLineParameter2|=|OutputFileName2|
|RunAppCommandLineParameter2|=|OutputFileDirectory2|
|RunAppCommandLineParameter2|=|OutputFilePath2|
|RunAppCommandLineParameter2|=TRUE
The last parameter is a static flag for some condition or status required by the application.
Page A57 of A91
A.4
QA Administration
The QA Administration program is the main interface for reviewing QA data and managing QA
settings. It is normally started by selecting the “QA” button from Global Value Quick Start on lab
computers used for sample measurements, or from a Windows Shortcut on remote access
computers used for data review. When started from a Windows shortcut, the default view is normally
as shown in Figure A.4.1. When started from Quick Start the program opens with the QA Chart view
displayed and the current Quick Start detector selected by default.
The program can accept two optional comma-delimited, command line arguments listed in any order.
1) Full Path to a target QA database: This path is required to identify a production QA database for
the applicable detectors.
2) Detector ID/Number: This is the Detector number specified in the MCB Configuration which is
also the Detector Number specified in the Sample Administration Configuration Manager. If the
Detector ID is provided then the trend chart window will be displayed with the specified detector
selected in the dropdown list when the program opens.
Figure A.4.1 QA Administration Default View
Page A58 of A91
Unlike databases that store analysis results for samples, the QA databases can store data for
multiple detectors. The QA Reporting options are also set in the QA database and may be set
different in each database as these parameters are not synchronized across all databases. This
allows setting different report header options for each location in a multi-lab site. The security and
database configuration parameters, however, are managed from the Sample Administration program
and synchronized to the QA databases to ensure that these settings are consistent throughout the
Global Value system. (See Section A.2.3.1)
When using separate databases for different detectors (or groups of detectors) or when accessing
QA data from a remote computer, there are two options are available to establish a connection to the
appropriate database as outlined below.
1) Establish a Windows shortcut or Menu Item in the Quick Start program’s INI file to the
GVQAAdmin program with the full path to the database on the command line. For example, a
directory on a local computer may be shared with the such that the fully qualified network name
can be used on the command line as follows:
C:\User\GVCR\GVQAAdmin.exe \\ComputerName\GVCR\Databases\GlobalValueQA.mdb
2) Users with CONFIGURATION permissions as established in the Security settings may connect
to a different database using the “Load Archived Database” option under Database Management
(Section Section A.4.8).
QA Administration Toolbar Control
9
11
10
1
2
3
4
5
6
7
8
Figure A.4.2 QA Administration Header
1) User Login to change the current user.
2) QA Sample Manager (Reports) for data review and approval. (Section A.4.2)
3) Lab Notebook for entering comments related to QA failures, changes to QA Limits, and
Instrument Maintenance/History. (Section A.4.3)
4) QA Charts for reviewing data trends (Section A.4.4)
5) QA Options to establish reporting options (Section A.4.5)
6) Detector Parameters for removing detectors that were inadvertantly synchronized from the
Sample Administration program. (Section A.4.6)
7) QA Limits to establish QA Points, Parameters, and associated Limits (Section A.4.7)
8) Database Management for archive, purge, and compact functions (Section A.4.8)
9) Database Path for the currently connected database.
10) User Name and Group for the current user logged in.
11) Close Button to exit application.
Page A59 of A91
A.4.1 QA Administration Login
The Login prompt for the QA and Sample Administration programs are identical and are displayed
when the program opens or when the applicable toolbar button is selected. If a valid Login User
Name and Password is supplied, then the User and Group Names will be displayed in the toolbar
near the top of the window, and permissions associated with the User Group will be enabled. If
Cancel is selected then the User Name and Group are set to “None” and no permissions are
enabled. This allows visitors to view QA data without the ability to make any changes.
Figure A.4.1.1 Login Prompt
Note that users and group permissions as well as password changes cannot be modified in the QA
Administration program. These settings are managed from the Sample Administration program and
synchronized to all databases in the Global Value system.
A.4.2 QA Sample Manager (Reports)
The QA Sample Manager is the main interface for reviewing QA reports similar to the Analysis Editor
in Sample Administration. It includes a few report filter options, a “text only” representation of the QA
report, Spectrum Histogram viewer, and various print and export options. The reports can also be
reviewed electronically and published to PDF files with additional reporting and data integration
options automated using the QA Publisher program described in Section A.5.
As shown in Figure A.4.2.1, the QA Sample Manager is comprised of a main header with selection
Figure A.4.2.1 QA Sample Manager
Page A60 of A91
controls and buttons to progress reports through the review process and access the PDF security
module, a grid with QA measurements and the applicable reviewer/publisher names and dates, and
the report viewer.
A.4.2.1
QA Sample Manager Header Controls
11
1
4
2
5
6
7
12
8
9
3
10
Figure A.4.2.1.1 QA Sample Manager Header
1) Detector ID List: This list is populated with the Detector Number for each detector in the
current database. The detector list in the QA database is configured on the Detectors tab in
Sample Administration Configuration Management and each QA database is updated when
the databases are synchronized. When a detector is selected from the list the QA
measurement grid is updated with records associated with the selected detector.
2) List Criteria: In combination with the QA Type, this field filters the list of measurements
displayed in the grid to only those meeting the specified criteria. This filtering capability is
intended to simplify the electronic review process. The following filtering options are
available:
a. Unreviewed: This option will limit the list to those not having a Reviewer signature
applied.
b. UnPublished: This option will limit the list to those not having a Publisher signature
applied.
c. Previous X Days: When this option is selected a field is displayed to specify the number
of days. The list is limited to those where the QA measurement Date/Time is after the
current date/time minus the number of days specified.
d. All: This option disables the review signature and date filters.
3) QA Type: In combination with the List Criteria, the QA Type selection filters the list of reports
displayed in the grid to only those meeting the specified criteria: QA Peaks, QA Background,
or All Measurements.
4) Review Button: This button is only enabled if the Current User belongs to a Group that has
permission to Review Data. When selected the QA report is refreshed such that the
Reviewer name and date will be displayed on the final report.
5) Review All Button: This button is only enabled if the Current User belongs to a Group that
has permission to Review Data. When selected the review process described for the Review
Button is applied to every spectrum in the grid.
Page A61 of A91
6) UnReview Button: This button is only enabled if the Current User belongs to a Group that
has permission to Review Data. When selected the Reviewer and Publisher signatures are
removed and the QA report is refreshed to remove the same signatures and dates.
7) Publish Button: This button is only enabled if the Current User belongs to a Group that has
permission to Publish Data. When selected the QA report and detailed GammaVision report
(if this option is enabled in the QA Reporting Parameters) are saved to a PDF file in the
detector specific “Publish Report Path” directory as established on the Detectors tab in the
Configuration Manager. (See Section A.2.3.2) The file name and any password protection
are determined by settings on the “PDF Security Settings” dialog. If the publisher name
already exists then a prompt to publish the report again will be displayed.
After the PDF report has been saved a program called GVPublishQA.exe in the Global Value
directory is run to provide additional data processing requirements. The QA Publisher
described in Section A.5 offers several options for published report content and data
integration including the ability to run additional programs for custom applications.
8) Publish All Button: This button is only enabled if the Current User belongs to a Group that
has permission to Publish Data. When selected the publishing process described for the
Publish Button is applied to every QA measurement in the grid.
9) Auto Publish Option: When this option is selected the Publish and Publish All buttons are
hidden, and reports are automatically published as described for the Publish (or Publish All)
buttons when the Review (or Review All) button is selected.
10) QA Measurement Grid: This list is populated with QA results meeting the filter criteria. The
grid can be refreshed using the Refresh Grid button to reflect changes due to the addition of
new records or data being reviewed or published. When a row is selected in the grid the
associated analysis report is displayed in report viewer.
Right-click in the grid to display the Delete option (if the user has DELETE permission).
When selected a prompt will be displayed indicating that the selected QA sample will be
permanently deleted. This includes ALL of the QA data associated with the selected report
that is stored in the database. Generally, it is good practice to archive or backup the
database prior to deleting QA data. No files outside of the database are affected (i.e.
published reports, spectra, etc.)
11) Refresh Grid Button: This button is used to refresh the QA Measurement grid based on the
List Criteria and QA Type filters after changes to the records in the grid have been applied
such as review and publish signatures.
12) PDF Security Button: This button is used to
access the PDF Security Settings dialog shown
in Figure A.4.2.1.2 which allows setting the PDF
file name structure as discussed in Section
A.2.3.6 for the Analysis Editor.
Note that when the QA Publisher is used for
additional data processing or reporting, the PDF
report name can only be set to the SpectrumID.
Figure A.4.2.1.2 PDF Security Settings
Page A62 of A91
A.4.2.2
QA Sample Manager Report Viewer
Figure A.4.2.2.1 QA Report Viewer
The QA Report viewer is nearly identical to the report viewer in the Analysis Editor. It includes a
“text only” representation of the QA report along with a Spectrum Histogram viewer with various
print and export options. The content in the report viewer may appear to be editable, but no
changes from this interface are retained in the database or included with reports generated from
the print options.
The following options are available with the report viewer:
Viewer Font Size: This field specifies the font size used in the report viewer to accommodate
different monitor resolution and report content.
Report Content: The report viewer displays any combination of the QA Report and Detailed
GammaVision Report. Note that the report viewer only displays standard text (similar to
Notepad). If the “Print Spectrum on QA Report” option is selected in the QA Reporting
Opions, then the code #SpectrumPlaceholder# will be displayed in this view. This code is set
in the report when the GVQAPeaks program (Section B.27) or GVQABackground program
(Section B.28) is run in the automation Job. It cannot be added after the report has been
stored in the database. When reports are printed to any format other than text (i.e. Printer,
PDF, or MS Word) an image of the full spectrum in Log scale will replace the text placeholder.
When printing to a text file, the placeholder is simply removed.
1) QA Report Option: The QA report is displayed in the report viewer.
2) Analysis Option: The standard GammaVision report is displayed in the report viewer. If
the QA Report option is also checked then the GammaVision report is appended to the
QA Report.
Page A63 of A91
Figure A.4.2.2.2 Spectrum Viewer
View Spectrum: This option displays the interactive spectrum viewer shown in Figure
A.4.2.2.2 with data plotted as a Bar Chart, Line Graph, or Points. The spectrum can be
zoomed in and out using the buttons above the spectrum window or through keyboard
shortcuts where F5/F6 and Up/Down arrow keys zoom horizontally, and the F7/F8 keys zoom
vertically similar to GammaVision. The vertical scale can also be viewed in Log or Linear
scale with automatic or manual range settings. After setting the desired view an image of the
spectrum can be saved to a Bitmap file or printed. The full spectrum file can also be extracted
from the database and saved to a file for use directly in GammaVision.
Print Destination: This section has several options for report output which are applied when
the Print button is selected.
1)
Printer: The report is printed on the default printer.
2)
MS Word: The report is displayed in Microsoft Word (MS Word is required).
3)
PDF File: The report is saved to a PDF file. A standard “Save As” dialog is displayed
indicating the path and file name. The default path is the “Custom Report Path”
established for the selected detector in the Configuration Manager, and the default file
name is the Spectrum name. Both the path and file name can be changed in the “Save
As” dialog. (Also see “Open File After Save” below.)
NOTE: Printing the report to a PDF file is not the same as Publishing the report. When
Publishing, the report is always saved to the “Publish” directory, and the file name and
protection is determined by the PDF Properties in the Configuration Manager.
GVPublishQA is also launched for additional processing when publishing. When printing
a PDF file you can change the name and location, the file is not encrypted, and no
additional processing occurs after the file is saved.
Page A64 of A91
4)
Text File: The report is saved to a text file. A standard “Save As” dialog is displayed
indicating the path and file name. The default path is the “Custom Report Path”
established for the selected detector in the Configuration Manager, and the default file
name is the Spectrum name. Both the path and file name can be changed in the “Save
As” dialog. (Also see “Open File After Save” below.)
5)
Open File After Save: This option is only enabled when the PDF File or Text File option
is selected. If this option is checked then the saved report will be opened and displayed
using the associated program similar to opening the file directly from Windows Explorer.
A.4.3 Lab Notebook
The Lab Notebook provides a simple method for keeping track of detector specific comments or
issues. These comments may be anything from an explanation for anomalous QA results to
routine detector maintenance.
Figure A.4.2.1 Lab Notebook
The following options are available with the Lab Notebook:
Detector ID: The detector list is populated based on all of the detectors configured in the
current database. When a detector is selected all of the comments meeting the Date Range
criteria are displayed in the grid.
Date Range: The date range options are identical to those described for the QA Charts.
(Section A.4.4) with the default settings based on the current QA Chart settings.
Page A65 of A91
New Comment: Select this button to add a new comment record to the end of the list. The
current user name and the date/time are automatically set and cannot be changed. New
comments can only be added if the current user belongs to a group with permission to ADD
Data.
Comment Grid: This grid displays the comments meeting the Date Range criteria. If the
current user belongs to a security group with permission to EDIT DATA then comments
associated with their name can be edited by selecting the comment field. These fields are
disabled if the current user does not have the appropriate permission.
Print Options: This section allows the user to generate a report showing the Lab Notebook
comments to either Microsoft Word or the default printer.
A.4.4 QA Charts
The QA Charts provide instrument performance evaluation through trend plots and statistical data
evaluation. This interface allows easy access to the underlying QA data as well as a mechanism to
generate trend reports and custom data evaluation.
Figure A.4.4.1 QA Charts
Page A66 of A91
A.4.4.1
QA Chart Header Controls
6
1
2
7
3
4
5
9
8
Figure A.4.2.1.1 QA Sample Manager Header
1) Detector: The detector list is populated based on all of the detectors configured in the
current database. When a detector is selected, the QA Point list is updated and the first QA
Point is selected by default. The QA chart and table data is updated to reflect the current plot
parameter.
2) QA Point: The list of QA Points is populated based on each point established for the
selected detector in the QA Limits. When a QA Point is selected the Parameter list for that
QA Point is updated and the first parameter is selected by default. The QA chart and table
data is updated to reflect the current plot parameter.
3) Parameter: The list of Parameters is populated based on limits established for each
parameter in the QA Limits. When a Parameter is selected the QA chart and table data is
updated.
4) Date Range: The Date Range specifies the criteria for data displayed in the data table and
chart. The following options can be selected:
a. Previous X Days =: This is the default selection when the QA Charts are opened. A
field is displayed below the list to specify the number of previous day’s data to display.
This entry is stored on the local computer to be used as the default the next time QA
Charts are accessed.
b. Year: A field is displayed below the list to specify the calendar year of data to display.
This entry is stored on the local computer to be used as the default the next time this
Date Range is selected.
c. Quarter: A field is displayed below the list to specify the calendar quarter of data to
display. The quarter entry can be any valid Month/Year combination (i.e. 1/2005, Feb2005, or March 2005 may all be valid entries for 1st Quarter 2005 depending on the
Regional computer settings). This entry is stored on the local computer to be used as the
default the next time this Date Range is selected.
d. All Data: All data removes any date filters and loads up to a maximum of 4000 data
points. If more than 4000 data points exist in the database for the selected Parameter,
then only the most recent 4000 points will be displayed.
e. Use-Defined: Start and Stop date fields are displayed to set the specific data range.
5) Data View: QA Data can be viewed in the form of a Chart or a Table. The Slide Show and
Print Options are only displayed when the Chart option is selected. The Table option
provides easy access to the data behind the charts. This data can be used in other
applications by selecting the range of fields in the table, right-clicking in the selected region,
and selecting Copy from the shortcut menu. The table data can then be pasted into another
application such as Notepad, Excel, etc..
6) Slide Show: (This option is only displayed when in the Chart View.) The Slide Show feature
provides a very simple method for reviewing trend charts. Simply enter the number of
Page A67 of A91
seconds to pause on each chart and select the Start button. The button face color will
change to teal indicating that the slide show is in progress and the text changes to “Stop”.
The slide show will automatically cycle through each parameter of every QA Point for all
detectors. Select the Stop button to pause the slide show at any point. The “<” or “>”
buttons may also be used to manually navigate through each QA parameter instead of
selecting parameters from the list.
If the Auto Print option is selected when the Slide Show is run, then all of the charts are
printed (three charts per page) with the Comments page included as the cover page if the
“Include Comments” option is checked in the Print Options.
7) Print Options: (This option is only displayed when in the Chart View.) The Print Options
provide a method for generating QA charts in the form of a report. The report can be printed
to the default printer or displayed in Microsoft Word depending on the selection. If the
Include Comments option is checked then all of the comments in the Lab Notebook for the
selected detector within the date range of data displayed on the chart will be included on the
report.
8) Chart Options:
a. Show Data Points: Data points on the measured value data series are displayed when
this option is checked.
b. Chart Legend: The legend is displayed in the upper right corner of the chart when this
option is checked.
c. Black and White: The Control and Tolerance limits are displayed in black and white with
the Control line in Dashes and the Tolerance line in dots when this option is checked.
This mode is useful when printing to non-color printers where the grayscale of the limit
lines may not produce clear charts.
d. AutoScale Y-Axis: When this option is not checked the QA chart is centered around the
QA Control limits. In this condition it may not be possible to see points that fall outside of
the established limits. When this option is checked, the Y-Axis will be scaled to show all
data. In this condition a single outlier may cause the rest of the chart data to appear very
compressed.
9) Export to Excel: When this button is selected the currently displayed QA data will be
exported to Microsoft Excel. A statistics summary page is generated along with several
charts which can be used to evaluate the data. The statistics are generated using standard
Excel functions. Refer to Microsoft Excel’s Help for an explanation of each function used in
the statistics summary. All worksheets and charts are unprotected to allow changes to these
functions (either manually or automated through macros) to meet site specific needs.
Note that changes to QA data in the worksheets do not affect any data stored in the QA
database. This allows bad data points or outliers to be removed from the data set in Excel to
calculate new limits while retaining all of the original data in the database. Typically, the
workbooks with the data set used to recalculate limits should be saved (and possibly
protected to avoid inadvertent changes) if needed for review at a later time.
Page A68 of A91
A.4.5 QA Options
The QA Reporting Parameters and Options page allows customization of the QA report header and
footer fields along with options related to the report content.
Figure A.4.5.1 QA Reporting Parameters and Options
The following fields are available to establish the QA Report content:
Report Type: This selection determines which QA Type (Peak or Background) reporting options
are being displayed/edited.
Report Header Lines 1-3: These are the first three lines of the QA report which are horizontally
centered.
Custom Text Field 1-4: These fields provide four lines of custom text that immediately precede
the QA data table. All lines are horizontally aligned to the left. Typically, these fields are used as
operator aids to specify corrective actions in the event of a failed QA measurement.
Document Code: Text in this field is aligned to the right of the Spectrum file name. This field is
intended to display a Record Type or Document Control code as determined by the site record
keeping system, but may be used for other purposes.
Perform Signature: This text is displayed below the QA data table on the left side. If an
electronic signature is applied to the report (i.e. if a login is required by the QA Automation Job)
then the User Name is displayed immediately to the right of this text. If electronic signatures are
not used, then a signature field may be included using the underscore (“_”) after the label or the
field may be left blank.
Review Signature: This text is displayed below the QA data table on the right side. If QA
reports are reviewed in the QA Sample Manager then the User Name is displayed immediately
after this text. If electronic signatures are not used, then a signature field may be included using
the underscore (“_”) after the label or the field may be left blank.
Print Analysis Report when QA is run: If this option is checked, then the standard
GammaVision analysis report will be printed along with the Global Value QA report when
GVQAPeaks or GVQABackground are run in the automation Job.
Page A69 of A91
Save Analysis Report with QA Report: If this option is checked, then the standard
GammaVision analysis report will be saved in the database along with the Global Value QA
report when GVQAPeaks or GVQABackground are run in the automation Job.
Publish Analysis Report: If this option is checked, then the standard GammaVision analysis
report will be published (included in the PDF file) when publishing the QA report. This option is
unchecked and disabled if the previous option is not checked because the standard
GammaVision report is not available in the database.
Print Spectrum on QA Report: If this option is checked, then an image of the spectrum is
included on the QA report just below the data table when reports are printed to a PDF file,
Microsoft Word, or the default printer.
Save button: This button saves changes to the report parameters for the selected QA Type.
The following is an example QA Report showing the QA data table below the report header fields.
This table consists of all the defined parameters for each QA Point (Bkgd or Peak definition) and
their associated data values (Target, Low Control, Low Tolerance, Measured, High Tolerance, High
Control). The measured value reported for parameters ending in “Diff” are calculated as a Percent
Difference from the Target based on the methodology specified with the QA Limits.
My Nuclear Power Station
Chemistry Department
Daily Quality Control Check
Spectrum: 1_000130
Record Type: Q6-444
Acquired: 17-Feb-2005 07:46:49
Detector: DSpecJr
Place Instrument Out of Service if any of the following conditions occur:
1) Any parameter is Out of Control
2) The same parameter is Out of Tolerance twice consecutively
3) Any QA Peak is not found
---------------------------------------------------------------------------------------Target
L_Ctrl
L_Tol Measured
H_Tol
H_Ctrl
Results
---------------------------------------------------------------------------------------QA-122
Channel
244.00
243.00
243.50
243.87
244.50
245.00
PASS
Energy
122.00
121.50
121.75
122.11
122.25
122.50
PASS
FWHM
1.00
0.80
0.90
0.79
1.10
1.20
Low OOC
Activity
4.81E-2
4.40E-2
4.60E-2
4.99E-2
5.00E-2
5.20E-2
PASS
ActivityDiff
0.048
-7.500
-5.000
-3.977
5.000
7.500
PASS
---------------------------------------------------------------------------------------QA-1332
Channel
2665.00
2663.00
2664.00
2664.51
2666.00
2667.00
PASS
Energy
1332.50
1331.50
1332.00
1332.67
1333.00
1333.50
PASS
FWHM
2.00
1.00
1.50
1.92
2.50
3.00
PASS
Activity
9.94E-2
9.00E-2
9.50E-2
9.77E-2
1.05E-1
1.10E-1
PASS
ActivityDiff
0.099
-7.500
-5.000
1.728
5.000
7.500
PASS
---------------------------------------------------------------------------------------Analyst: Admin
Approval: Admin
The Results of each parameter are reported as follows:
Pass: Measured value is between the Low and High Tolerance values.
Low OOC: Measured value is lower than the Low Control value.
Low OOT: Measured value is between the Low Tolerance and Low Control values.
High OOT: Measured value is between the High Tolerance and High Control values.
High OOC: Measured value is higher than the High Control value.
NO DATA: The QA parameter was not identified (i.e. no peak identified)
Page A70 of A91
A.4.6 QA Detectors
Detector settings are established in the Sample Administration program and transferred to the
QA databases when synchronizing databases. The Detector editor in QA Administration is
provided only as a means to remove detectors that are no longer needed. For example, when
establishing multiple QA databases in a networked system a copy from one computer may be
used as the starting point on another computer and the original detectors will need to be
removed.
Note that detectors cannot be deleted when they have associated QA Reports/Data,
Comments, or QA Points/Limits established. Removing associated records may require
Purging the database as discussed in Database Management. (See Section A.4.8)
Figure A.4.6.1 QA Detectors
A.4.7 QA Limits
The QA Limits define which QA Points and associated parameters are reported for each
detector as well as the number format for each parameter and the methodology for calculating
the percent difference from a target value.
Figure A.4.7.1 QA Limits
Page A71 of A91
A.4.7.1
QA Points
When Background QA is run the overall spectrum count rate is determined by summing all
of the channel counts and dividing by the Live Time. This count rate or a percent difference
from a target count rate can then be monitored for the Background QA using the “Bkgd” QA
Point.
QAPeak measurements store data for all QA Points that match a nuclide name in the
GammaVision analysis results. Since these QA Points are intended to represent a specific
spectrum peak it is important that each nuclide in the GammaVision library used for the QA
measurement has only that peak of interest and no others. With this configuration the
nuclide in the library is also typically named for the peak energy rather than the actual
nuclide name. For example, the Y-88 1836 kev peak would be configured with a nuclide
name of QA-1836 with only the 1836 kev peak defined. Multiple peak nuclides like Eu-152
would require several nuclide names, such as QA-122, QA-778, QA-1408, etc., with each
having only the associated peak energy listed. If more than one peak is listed for the QA
analysis library then the data will not be accurately transferred to the database.
After establishing the necessary libraries for each Detector QA in GammaVision, the QA
Points can be established by selecting the Detector ID and editing the QA Point list by
selecting the Edit List button. The
Detector Nuclide Editor shown in
Figure A.4.7.2 is displayed to allow
configuring the QA Points.
The Available Points list displays all of
the QA Points (“Bkgd” or nuclide
names used as peak identifiers) that
have been previously established for
any detector. The Detector specified
QA Points are shown in the list on the
right. Select the appropriate list item,
and use the arrow buttons to add or
remove QA Points in the detector list.
NOTE: If a QA Point with associated
limits or data is removed then all of
the limits and data are also removed
from the database. It is advisable to
Archive the database prior to making
these changes to prevent the loss of
historical QA data.
Figure A.4.7.1.1 QA Points/Nuclide Editor
QA Points can be added to the Available Points list using the Add button, and existing QA
Points may be modified by selecting the Edit button or double-clicking on the list item.
Select an item and then the Delete button to remove a QA Point from the Available Points
list. QA Points that are currently assigned to any detector cannot be removed from the
Available Points list.
Any changes made are applied to the QA Points list for the selected detector in the QA
Limits editor.
NOTE: The “Bkgd” QA Point is required for Background QA measurements and should not
be removed or renamed.
Page A72 of A91
A.4.7.2
QA Parameters
After establishing the QA Points for the selected detector, the limits and target values
associated with each parameter can be configured in the QA Limits editor as follows: (See
Figure A.4.7.1)
1) Select a QA point in the list. If no limits have been established for any parameters
associated with the selected point then the full list of parameters is displayed in the grid.
If parameters have been previously established for the selected QA Point then the only
those parameters are displayed in the grid by default. The entire list of parameters can
be displayed (i.e. to establish limits for new parameters) by unchecking the “Hide
Unused Parameters” checkbox.
2) Select a field in the Limits Grid and enter the appropriate limits and target value using
the following guidance:
a. The target value is required. If the target field is empty when changes are saved
then data for that parameter will be discarded regardless of any entries in the
Limits fields.
b. The Control Limits typically correspond to 3-sigma bounds, and Tolerance Limits
typically correspond to 2-sigma bounds. The actual criteria for these are
determined by site requirements. If a target value is set but Limits are not
specified then all limits for that parameter are set to zero by default.
c. All parameters that end with “Diff” will calculate the measured value for that
parameter in terms of a percent difference from the target value as specified in
Section A.4.7.4
d. The “Countrate” and “CountrateDiff” parameters are applicable only when the
“Bkgd” QA Point is selected (i.e. for Background QA). All other parameters are
used for Peak QA which requires an associated nuclide name for each peak
monitored as discussed in Section A.4.7.1.
e. Different parameters may be established for each QA Point. For instance, you
may want to monitor the Channel and Energy centroid on a low and high energy
peak, but monitor the Activity (or ActivityDiff) for several peak energies in
between or vice versa.
3) Select the Save button to save changes to the parameters for the selected QA Point. A
prompt will be displayed to save changes if a different Detector ID or QA Point is
selected prior to saving changes.
Page A73 of A91
A.4.7.3
QA Parameter Formatting
The number format can be specified for each
parameter using formatting codes similar to
those used by Microsoft Excel and most
programming languages. These number
formats are applied to the values displayed in
the QA Limits grid as well as QA reports. The
number formats are not detector specific.
Select the Edit Parameter Number Formats
button to display the Parameter Format editor
shown in Figure A.4.7.3.1 6.2.12.
The number format may be specified using
standard format codes for fixed decimal or
scientific notation or using named formats such
as General, Fixed, Scientific, etc.. Select the
Help button to view example formatting codes
and example number formats. A message is
displayed if an invalid format code is entered,
and changes will not be saved until all format
codes are valid.
Select the Save button to save changes to the
number formats.
Figure A.4.7.3.1 Parameter Format Editor
A.4.7.4
Percent Different Methodology
The formula for calculating the Percent Difference from the target value for the parameters
that have the “DIFF” suffix can be set to one of four methods as shown in Figure A.4.7.4.1.
The Target value is the value entered in the QA Parameter grid, and the Measured value is
the value associated with the analysis data. Each of these formulas is multiplied by 100 to
convert to percent. (i.e. 100 x (Target-Measured)/Target)
Figure A.4.7.4.1 Percent Difference Method
Page A74 of A91
A.4.8 Database Management
The Database Manager provides the tools that may be necessary to manage QA databases as
described below.
Figure A.4.8.1 QA Database Management
Archive Current Database: A standard “Save As” dialog is displayed to save the current
database to an archive file. The default archive path is the current database name followed
by the international date format (YYYY-MM-DD). This function copies an exact image of the
current database to the new file path.
Purge Data: This option is typically used to clear records out of a database when
establishing a new database (i.e. for initial installation or establishing a database for a new
year if data is archived annually). All QA data prior to the specified date will be removed
from the database including any comments in the Lab Notebook. Configuration parameters
such as Detector file paths, QA Limits, and Reporting parameters are not changed.
Generally, the database should be compacted after purging a significant number of records
to reduce the database size.
Compact Database: The QA database does not automatically reclaim unused space when
records are deleted. After purging data or deleting a large number of data points the
database file size can be reduced by using the Compact function. This operation is
performed on the database which is currently connected to the QA Administration program
(path is shown on the menu bar).
Load Archived Database: A dialog is displayed to select an archived QA database. The
new database path is displayed in the menu bar and a connection is established. All
operations performed in the QA Administration program after loading an archived database
are implemented only in the database currently connected.
Page A75 of A91
A.5
QA Publisher
Previous versions of Global Value did not include the standard publishing program as this
functionality was originally intended for custom development for special applications. Based on
experience with many custom installations over the years, Global Value now provides a default
publisher program that satisfies the most common requirements without customization. If additional
functionality is required, the publisher provides the capability to launch other applications after the
published files have been rendered to common file structures that are easily processed. This
approach allows site personnel to develop their own custom applications without having to
understand the underlying details associated with extracting information from Global Value
databases.
When QA reports are published from the Global Value QA Administration program, the publisher
program is automatically run with the full path to the published PDF report passed as a command
line parameter. The default publisher program requires this PDF report path to use only the
Spectrum ID as the file name. This file naming convention is used by default, but it is possible to
change the published PDF file name in the QA Administration Configuration. If the file name is
changed to anything other than only the Spectrum ID, then the publisher program will not behave as
expected. Additionally, the Spectrum ID must start with the detector number followed by an
underscore (i.e. “1_” for Detector #1). This is normally accomplished by configuring the File Prefix
as “X_” where X is the detector number on the Detectors tab in Sample Administration Configuration,
and then using the |DETSPECTRUMPREFIX| parameter generated by Quick Start as the first
parameter in generating the Spectrum ID.
The publisher program, “GVPublishQA”, resides in the installation directory with all of the other
Global Value programs, and has an INI file by the same name. The settings in the INI file determine
which files are generated when the publisher runs and which applications will be launched. File
types that can be generated include PDF, Text, XML, and CSV. After the publisher has generated
the required reports and launched the specified programs, the original PDF file created by the QA
Administration program is deleted to avoid a large number of unnecessary files accumulating on the
local workstation.
GVPublishSampleQA has the following comma-delimited command line parameters:
1) Full Path to PDF Report (required): The PDF file name must match the spectrum ID, and the file
prefix must be in the format “DETNO_” where DETNO is the detector number. This is the default
configuration for new installations.
2) Full Path to Configuration File (optional): This optional configuration file may be specified when
using the publisher program outside of the routine publishing process. This may be useful for
generating CSV or XML reports and/or processing the data dynamically within automation Jobs.
When this file is omitted, such as when publishing results from the Analysis Editor, the default
configuration file “GVPublishSample.ini” in the Global Value installation directory is used.
Page A76 of A91
A.5.1 Configuration File Content
The Configuration file consists of a series of parameters that are used for generating various file
types and running applications. These parameters are enclosed in pipe characters (“|”) similar to
those used with the Quick Start and GVSampleDataSC programs. Each configuration file can be
configured to generate multiple output files and process them with different applications
automatically if desired.
Two types of parameters are used to generate files and run applications. The file generation
parameters use the prefix “Output” and those used for running applications use the prefix “RunApp”.
All of the “Output” parameters must be listed before the associated “RunApp” parameters.
In addition to the prefix each parameter has a property name followed by a unique character
identifier. This unique identifier is a single character that is used to group the Output and RunApp
properties as well as link the Output file to the RunApp parameters. This identifier can be any
alphanumeric character, thereby providing up to thirty six (36) different Output and RunApp
scenarios in the same file.
The following shows the complete list of Output and RunApp parameters which are discussed in
more detail in the remainder of this section.
|OutputTypeX|=
|OutputEnabledX|=
|OutputCoverTemplateX|=
|OutputIncludeSummaryX|=
|OutputIncludeDetailsX|=
|OutputDirectoryX|=
|OutputFileExtensionX|=
|RunAppPathX|=
|RunAppEnabledX|=
|RunAppCommandLineParameterX|=
Where:
X = Single character unique identifier (0-9, A-Z not case sensitive)
A.5.1.1
OutputType
The OutputType can be set to PDF, TXT, XML, or CSV.
When set to XML or CSV, an appropriate XML or CSV template must be specified for the
OutputCoverTemplate parameter. The IncludeSummary and IncludeDetails parameters are
ignored for these Output Types.
When set to PDF or TXT, the report content is based on the CoverTemplate, IncludeSummary,
and IncludeDetails parameters – any of which can be omitted. PDF reports will use the same
security rules (passwords) as established in QA Administration PDF Properties.
Multiple reports can be generated with different content by using the unique character identifier.
A.5.1.2
OutputEnabled
This parameter is set to “T” (true) to enable the specified report output. Anything other than “T”
will disable the report output. This parameter allows output configurations to be established for
testing or other temporary conditions without removing the complete set of parameters.
Page A77 of A91
A.5.1.3
OutputCoverTemplate
The OutputCoverTemplate is a report template appropriate for the output type specified. This
parameter can be the full path to a text file or the name of a Report Template established in the
Sample Administration Configuration. Normally, the latter option would be used as it provides
security for the template content.
For PDF and TXT output types this parameter is optional. If a template is specified then the
rendered content is used as the first section of the report. For PDF and TXT output types, this
template is processed by replacing the QA Header parameters with the applicable QA data.
See Section A.2.3.5 (Report Templates)
For XML and CSV output types this parameter is required since the template defines the layout
and content of these file types. These templates are processed significantly different than those
used for generating summary reports and must comply with the formatting rules described
below.
The XML Template requires the following configuration:
1)
The data set record must be enclosed in the tags <GVPublishDataSet> and
</GVPublishDataSet>.
2)
The Sample Data record must be enclosed in valid tags. The recommended tags are
<GVPublishSampleData> and </GVPublishSampleData>, but other names could be
used if desired.
Sample Data parameters described for QA report templates may be included within this
record. (See Section A.2.3.5 for details regarding Report Templates.) Each parameter
should be enclosed in appropriate tags. Attributes may also be included in tags if
desired.
3)
The nuclide data (QA Point) record must be enclosed in the tags <GVPublishQAData>
and </GVPublishQAData>.
Parameters described in Section A.2.3.5 for Report Templates with the “QAPUB” prefix
are valid parameters within the QA Data record.
4)
When the XML Template is rendered, the Sample Data parameters are replaced with the
applicable results, and a record for each QA parameter is generated with the tags and
data specified.
The following is an example of a valid XML Template. The piped parameters are those
specified in Section A.2.3.5 for Report Templates. The field tag names are only for example
except for the record tags discussed above which must be named accordingly. Indentation and
spacing is for readability only.
Page A78 of A91
<GVPublishDataSet>
<GVPublishSampleData>
<SpectrumID>|QASPC|</SpectrumID>
<AcquisitionStartTime>|QASMP_ACQU|</AcquisitionStartTime>
<QAType>|QATYPE|</QAType>
<Description>|QADESC|</Description>
<DetectorNumber>|QADETNO|</DetectorNumber>
<Analyst>|QAANALYST|</Analyst>
<Reviewer>|QAREVIEWER|</Reviewer>
<ReviewDate>|QAREVIEWDATE|</ReviewDate>
<Publisher>|QAPUBLISHER|</Publisher>
<PublishDate>|QAPUBLISHDATE|</PublishDate>
</GVPublishSampleData>
<GVPublishQAData>
<QAPoint>|PUBQAPOINT|</QAPoint>
<QAParameter>|PUBQAPARAMETER|</QAParameter>
<QATarget>|PUBQATARGET|</QATarget>
<QALowControl>|PUBQALOWCTRL|</QALowControl>
<QALowTolerance>|PUBQALOWTOL|</QALowTolerance>
<QAValue>|PUBQAVALUE|</QAValue>
<QAHighTolerance>|PUBQAHIGHTOL|</QAHighTolerance>
<QAHighControl>|PUBQAHIGHCTRL|</QAHighControl>
<QAResult>|PUBQARESULT|</QAResult>
</GVPublishQAData>
</GVPublishDataSet>
The CSV (Comma-Separated Values) Template requires the following configuration:
1) The Sample Data and QA Data have two separate records. In the rendered CSV file
the Sample Data will be returned in a single row, and the QA Data will be generated
with one row per QA parameter.
2) The Sample Data record must start with the parameter “CSVSAMPLEDATA:”. This
parameter is not returned in the final CSV file.
Sample Data parameters described for QA templates may be included within this
record. (See Section A.2.3.5 for details regarding Report Templates.)
3) The Nuclide Data row must start with the parameter “CSVQADATA:”. This parameter
is not returned in the rendered CSV file.
Parameters described in Section A.2.3.5 for Report Templates with the “QAPUB”
prefix are valid parameters within the QA Data record.
4) All parameters in the Sample or QA Data rows are returned exactly as listed in each
row. If quotes around parameters are desired to ensure that data with commas, dates,
etc. are interpreted correctly, then the quotes must be included around the applicable
parameters in the template. The comma (or other character delimiter) must also be
included to separate each parameter.
5) Additional text may be included outside of the Sample Data and Nuclide Data record.
For example, a header row or other information may be desired for readability or to
satisfy custom application processing requirements.
Page A79 of A91
The following is an example of a valid CSV Template. The piped parameters are those
specified in Section A.2.3.5 for Report Templates. Note that this example does not include all
possible parameters.
SpectrumID, Acquisition Time, QA Type, QA Description
CSVSampleData: "|QASPC|", "|QASMP_ACQU|", "|QATYPE|", "|QADESC|"
QA Point, QA Parameter, QA Value, QA Result
CSVQAData:"|PUBQAPOINT|", "|PUBQAPARAMETER|", "|PUBQAVALUE|", "|PUBQARESULT|"
A.5.1.4
OutputIncludeSummary
This parameter is used only for the PDF and TXT output types. It is ignored for XML and CSV
output types. When set to “T” (true), the QA Report stored for the sample is included in the PDF
or TXT report that is generated.
A.5.1.5
OutputIncludeDetails
This parameter is used only for the PDF and TXT output types. It is ignored for XML and CSV
output types. When set to “T” (true), the Detailed Report stored for the sample is included in the
PDF or TXT report that is generated.
A.5.1.6
OutputDirectory
A valid directory (or folder) path must be specified to indicate where the rendered file will be
stored. The file name will be the same as the original PDF file name (also same as Spectrum
ID) with the file extension described in Section A.5.1.7.
A.5.1.7
OutputFileExtension
This parameter defaults to the Output type (PDF, TXT, XML, or CSV) if no extension is
specified. Other extensions may be assigned as necessary.
A.5.1.8
RunAppPath
This parameter requires the full path to an application to be run. Command line parameters
may be assigned as described below.
A.5.1.9
RunAppEnabled
This parameter is set to “T” (true) to enable the specified application. Anything other than “T”
will not allow the application to run. This parameter allows configurations to be established for
testing or other temporary conditions without removing the complete set of parameters.
A.5.1.10
RunAppCommandLineParameter
Multiple Command Line parameters can be specified for the application. If more than one is
provided, then they will be comma-delimited in the order in which they are listed in the
configuration file.
The following dynamic parameters may be specified in addition to any static parameters
desired:
|DETNO|=Detector Number
|SPECTRUMID|=Spectrum ID
|OutputFileNameX|=File name of output file.
|OutputFilePathX|=Full path of output file.
|OutputFileDirectoryX|=Full path of output file.
Where:
X = Single character unique identifier matching the respective RunApp and Output group.
Page A80 of A91
A.5.1.11
Example Configuration
The following example demonstrates how four different output files of different types can be
generated and two custom applications configured to run with command line parameters. Notes
and comments as shown in this example are acceptable in the configuration file.
XML file for passing data in a standard format.
|OutputType1|=XML
|OutputEnabled1|=T
|OutputCoverTemplate1|=PublishQAXMLTemplate
|OutputDirectory1|=C:\User\XML
|OutputFileExtension1|=xml
CSV file for passing data in an easily read format.
|OutputType2|=CSV
|OutputEnabled2|=T
|OutputCoverTemplate2|=PublishQACSVTemplate
|OutputDirectory2|=C:\User\CSV
|OutputFileExtension2|=csv
Text file consisting of only the coversheet – possibly used as a Meta Data file.
|OutputType3|=TXT
|OutputEnabled3|=T
|OutputCoverTemplate2|=PublishQAMetaDataTemplate
|OutputIncludeSummary3|=F
|OutputIncludeDetails3|=F
|OutputDirectory3|=C:\User\TXT
|OutputFileExtension3|=asc
PDF file with a cover sheet, summary report, and detailed report(s).
|OutputType4|=PDF
|OutputEnabled4|=T
|OutputCoverTemplate4|= PublishQAMetaDataTemplate
|OutputIncludeSummary4|=T
|OutputIncludeDetails4|=T
|OutputDirectory4|=C:\User\PDF
|OutputFileExtension4|=pdf
Run application to process the XML file.
|RunAppPath1|=C:\User\GVCR\XMLProcessor.exe
|RunAppEnabled1|=T
|RunAppCommandLineParameter1|=|OutputFilePath1|
Run application to process the CSV file with additional command line parameters.
|RunAppPath2|=C:\User\GVCR\CSVProcessor.exe
|RunAppEnabled2|=T
|RunAppCommandLineParameter2|=|DETNO|
|RunAppCommandLineParameter2|=|SpectrumID|
|RunAppCommandLineParameter2|=|OutputFileName2|
|RunAppCommandLineParameter2|=|OutputFileDirectory2|
|RunAppCommandLineParameter2|=|OutputFilePath2|
|RunAppCommandLineParameter2|=TRUE
The last parameter is a static flag for some condition or status required by the application.
Page A81 of A91
A.6
GVQASummary
This program provides a QA Status summary for multiple detectors. The results are based on
the most recent QA Peaks and QA Background measurements and the maximum time span
between measurements as set in the configuration file.
Figure A.6.1 GVQASummary
Each row in the grid is color coded depending on the QA Status as follows:
Red:
Yellow:
Magenta:
White:
A.6.1.1
Any parameter is Out of Control (OOC)
Any parameter is Out of Tolerance (OOT) and none are OOC.
QA Peak or QA Background is Overdue, but neither is OOT or OOC.
All parameters passed and are within the required due date.
Configuration File Content
The Configuration file consists of the following parameters which are enclosed in pipe
characters (“|”) similar to those used in other Global Value configuration files.
|SampleDatabasePath| is the full path to one of the Global Value detector databases that
store sample data. This parameter is for backward compatibility only. The current version
of this program uses the default database specified in the Sample Administration
Configuration Manager on the Misc tab.
|QAPeakMaxHours| and |QABackgroundMaxHours| are the maximum number of hours
allowed between QA Peak and Background evaluations measurements respectively.
|DetectorNumberList| is a comma delimited list of detector numbers to include in the QA
Summary to restrict the list to a subset of the full detector list. If no detector numbers are
provided, then all detectors will be shown in the QA Summary.
Example Configuration:
|SampleDatabasePath|=C:\User\GVCR\Databases\GlobalValue1.mdb
|QAPeakMaxHours|=30
|QABackgroundMaxHours|=30
|DetectorNumberList|=
Page A82 of A91
A.7
Analysis Log
Global Value’s Analysis Log is an Excel workbook that employs the Excel Add-In functions to
provide advanced data filtering and report accessibility. The main worksheet in the Analysis
Log contains the controls shown in Figure A.7.1. This interface allows the user to select an
individual detector or “All Detectors” from the dropdrown selector, specify dates for various
fields, and query the detector database for the associated analysis results by selecting the
Update Sample Log button. The list of samples and related data will automatically populate
the worksheet.
Figure A.7.1 Analysis Log Controls
Before using the Analysis Log it must be properly configured with a valid database and the
appropriate fields enabled. This is accomplished by selecting the Configuration button. After
entering the password at the login prompt, the form shown in Figure A.7.2 is displayed.
(The default password is “pwd”.)
Figure A.7.2Analysis Log Configuration
Page A83 of A91
Set the database and workgroup paths to establish a connection to a Global Value database
that contains Sample results. (Note that this log will not query the QA database.)
The max records field has a maximum value of 2000. This parameter limits the number of
records that will be returned if the date ranges specified on the Analysis Log result in a very
large number of samples.
The default max report date can be either Today or None. If Today is selected, then the current
date is set in the “<Report Date” filter field when the workbook is opened. The “>Report Date”
filter field is automatically set to the “<Report Date” field minus the Default Previous Days
Criteria value.
Select the Configure Field Properties button to specify which fields and data formats will be
displayed on the Analysis Log using the form shown in Figure A.7.3. After querying the selected
detectors based on the specified date criteria use the AutoFilter dropdowns at the top of each
column to further refine the search criteria based on values set in these fields.
Figure A.7.3 Analysis Log Field Properties
Page A84 of A91
The Analysis Log can display over forty fields - all of which can be used as filter criteria. The
order in which the fields are displayed is the same as displayed in this form. The fields can be
changed by selecting a row and then selecting an available field from the dropdown list.
Custom field parameters are included in the dropdown list in addition to the default parameters.
When a field name is changed, the Field Label is automatically set to the Field Name, but it can
be changed to reflect a more meaningful label if desired. The remaining fields specify if the field
is displayed, data alignment and format, and column width.
NOTE: Depending on the version of Microsoft Excel installed on your system some functionality
of the standard Sample Logs may not be available. The AutoFilter features, for instance, are
only enabled with protected worksheets in Excel 2002 and later. With earlier versions, it may be
necessary to unprotect the worksheet or use VBA code to customize the workbook in order to
achieve similar functionality.
To view an image of the analysis report associated with a particular spectrum simply doubleclick anywhere on the applicable row, or select any cell on that row and click on the Show
Report button. The Report Summary and/or Detailed Reports will be displayed depending on
the options selected by the Show Report button.
A.8
GVDetectorMonitor
This program shows the status of each detector configured with ORTEC CONNECTIONS on
the local computer including the HV and Acquisition status; HV setting; Real, Live, and Dead
Time; Acquisition Start Time; and Estimated Acquisition Stop Time as shown in Figure A.8.1.
Figure A.8.1 GVDetectorMonitor
Each row in the grid is color coded depending on the High Voltage and acquisition condition as
follows:
Red:
Yellow:
Cyan:
Green:
HV Off and Acquiring data
HV Off and Not Acquiring data
HV On and Acquiring data
HV On and Not Acquiring data
Note: This program is not accurate for instruments that do not report the HV status, as it is
always displayed as if it was off.
Page A85 of A91
A.9
Database Utility
This program enables users to reset certain process flags or repair a database that has become
corrupted.
Figure A.9.1 GVDatabaseUtility
Process Flags
The process flags are set when Global Value initiates automation Jobs from the Quick Start
program so that the programs can determine if an automation routine is running from a different
location. If the flag is set and a user from a different computer tries to start an automation
routine for the same detector using GVQuickStart then a message is displayed indicating that
the system is in use and which computer started the automation routine.
If the automation routine is shutdown abnormally (i.e. GVQuickStart or GammaVision is closed
from Windows Task Manager or a Run-Time error occurred) then this flag will remain set in the
database. Under this condition, GVQuickStart will not be able to run an automation routine for
the associated detector system until the associated flag is reset using the Database Utility
program.
To reset the flag, browse to the database by selecting the button next to the text field (or type
the path), and select the Clear Acquisition Job Running Flag or Clear Reanalysis Job
Running Flag button as applicable. (See Figure A.9.1) A message will be displayed indicating
that the flag has been reset, and GVQuickStart will be able to run automation routines.
Database Repair
Although it is extremely rare, it is possible to corrupt a database if it is abruptly disconnected
during a write operation. This is most likely to occur in a networked operation where the local
computer is disconnected from the network or shutdown while a remote computer is writing
data. A corrupted database is apparent when the Global Value programs cannot access the
database and a series of errors will generally be displayed when programs are run.
To repair the database, browse to the database by selecting the button next to the text field (or
type the path), and select the Repair Selected Database button. (See Figure A.9.1) An
appropriate message will be displayed indicating the results of the repair process.
After repairing the database verify that last operation completed successfully. If the database
was being Synchronized as described in Section A.2.3.9 from a different database, then the
Synchronization should be run from the Master source again to ensure that this repaired
database received all of the applicable configuration changes. If data was being edited for a
particular sample, then that sample data should be reviewed for completeness and edited as
applicable.
Page A86 of A91
A.10 File Backup
NOTE
It is important that all Global Value applications are closed on the local computer,
no remote computers are connected to the local databases, and that the process
runs to completion to ensure that all files are backed up successfully.
The process of backing up and purging unneeded files is accomplished by running the “File
Backup and Purge” batch routine. An example process is installed with the Default
Configuration Files with a shortcut in the Global Value folder which links to the file
C:\User\GVCR\BackupAndPurge.bat. This file is a standard DOS batch file with commands to
copy all files from a source directory to the specified destination directory, and then delete
unnecessary files from specified directories. This file can be modified using any text editor, and
personnel experienced with batch file programming can extend the capability of the program.
Additional comments regarding specific batch scripting implemented can be found within the
batch file.
Batch File Description
The batch file requires the backup Destination path as a command line argument. The shortcut
provided for backups in the default configuration files uses the path “C:\UserGVNetworkFiles\SystemBackups\System1\User\” (which is created when the Default
Configuration Files option is selected during installation). This path should be changed to a
valid network location during the system configuration.
The source directory to be copied is specified within the batch file near the beginning of the
batch script as shown below:
@echo off
Set DestDir=%1
Set SourceDir="C:\User"
This path can be modified directly in the batch file or converted to read another commadelimited command line parameter as follows:
@echo off
Set DestDir=%1
Set SourceDir=%2
After the Destination and Source directories are set, a message is displayed in the command
window using the script shown below. Note that the message can be modified during the
system configuration to meet site specific needs.
cls
echo ***
echo ***
echo ***
echo ***
echo ***
echo ***
echo ***
echo ***
echo ***
pause
Backing Up %SourceDir% ...
ENSURE THAT ALL GLOBAL VALUE APPLICATIONS ARE CLOSED!!!
THIS WINDOW WILL CLOSE AUTOMATICALLY WHEN BACKUP IS COMPLETE!!!
CLOSING THIS WINDOW MANUALLY WILL TERMINATE THE BACKUP!!!
Page A87 of A91
The message is displayed until the Enter key is pressed on the keyboard, and then the files are
copied using the XCOPY command as shown below. The additional command line parameters
are described in the batch script comments.
xcopy %SourceDir% %DestDir% /e /v /y /k /h /c
After the source directory has been copied, then unnecessary files are deleted from a specified
directory (including all subdirectories) using the script shown below. This process frees up
valuable disk space and improves the efficiency of future system backups.
echo Deleting old spectra...
set SPCPath=C:\User\SPC\
for /f "tokens=*" %%G in ('dir /a:d /b "%SPCPath%"') do (
start C:\User\GVCR\GVDeleteFiles.exe %SPCPath%%%G, *.An1, 90
start C:\User\GVCR\GVDeleteFiles.exe %SPCPath%%%G, *.Spc, 0
start C:\User\GVCR\GVDeleteFiles.exe %SPCPath%%%G, *.Ufo, 90
start C:\User\GVCR\GVDeleteFiles.exe %SPCPath%%%G, *.rpt, 0
)
exit
Note that the SPCPath root directory is set as a static path within the batch file. This parameter
could easily be converted to a command line parameter similar to the Destination directory
described previously if necessary for added flexibility.
In the FOR loop the GVDeleteFiles progam is run with command line parameters as follows:
C:\User\GVCR\GVDeleteFiles.exe DIRECTORY, CRITERIA, MAXDAYS
Where:
DIRECTORY
CRITERIA
MAXDAYS
= folder from which files will be deleted.
= File criteria (use *.ext to delete all files with "ext" extension)
= Files older than the current date - MAXDAYS that meet the File Criteria
will be deleted.
Example to delete all Report files from the C:\User directory that are older than 30 days.
C:\User\GVCR\GVDeleteFiles.exe C:\User, *.Rpt, 30
A copy of the spectrum and report files are stored in the Global Value database, so it isn’t
necessary to retain any of these file types (.An1, .Spc, .Rpt) unless desired for quick reference
on the local computer outside of Global Value. The UFO files are used for displaying analysis
results within GammaVision and creating PBC files, so typically a local copy is retained for
sufficient time to allow all data reviews to be completed. Retaining any of these files locally is
strictly a matter of convenience to avoid having to restore a copy from the backup directory
when needed.
Page A88 of A91
A.11 File Compare
This program is intended to confirm the integrity of critical configuration files by comparing
reference files to those used in production. The reference files are established by copying files
from a known good configuration to location that is normally read-only to non-administrative
personnel running the system. Typically, the file structure is established for the files that are
common to all computers and those that are unique for each detector or computer system. An
example directory structure is provided in the “C:\User-GVNetworkFiles\GVFileCompareImage”
directory that is created if the Default Configuration Files option is selected during the Global
Value installation.
This program has the following comma-delimited, command line parameters:
1) Criteria File Path: Full path to a file specifying the comparison criteria as described
below.
2) Exceptions Only Flag: If the Exceptions Only flag is set to “T”, then the report is
simplified by showing any exceptions at the top followed by a summary of the other
directories compared. If this flag is set to anything other than “T”, then the report will
display the results of each directory compared in the order in which they are listed in the
comparison criteria file.
Example: C:\User\GVCR\GVFileCompare.exe CRITERIAFILEPATH, EXCEPTIONSONLYFLAG
Compare Criteria File Format
The first line in this file is the full path to the file where the results of the comparison will be
saved. Each subsequent line is the Source Folder Path and the Compare Folder Path
separated by a comma.
Example:
C:\User\GVCompare.txt
C:\CompareImage\GVCR, C:\User\GVCR
C:\CompareImage\GVCR\Job Templates, C:\User\GVCR\Job Templates
Extra spacing may be included for ease of readability as shown below.
C:\User\GVCompare.txt
C:\CompareImage\GVCR,
C:\User\GVCR
C:\CompareImage\GVCR\Job Templates, C:\User\GVCR\Job Templates
NOTES:
1)
Only the files in the source folder are included in the comparison and output report.
Files that may change with some frequency but are located within a folder with critical
files that do not change should be excluded from the Source Folder to avoid being
shown as an exception when the GVFileCompare program runs.
2)
Subfolders are not included in the compare criteria. Each applicable folder must be
specified separately.
3)
Files typically included in a compare image are the program files associated with
Global Value, INI files for Global Value or GammaVision, Calibrations, Libraries, SDF
Page A89 of A91
files, Configuration Files, Job Templates, etc.. Spectrum and Report files or Excel files
that frequently change are normally excluded from the compare image.
4)
If a Subject Matter Expert or Administrator intentionally changes a file on the working
system (i.e. changes to calibrations, libraries, analysis options, or configuration files
that may occur over time) then a copy of the new file should be copied to the relevant
location in the compare image directory.
5)
The compare image directory should normally be configured with read-only privileges
for non-administrative personnel to prevent unauthorized changes.
A.12 GVDataExport
This program exports all of the associated analysis data from a secured Global Value database
containing Sample information to an unsecured MS Access database that is structured to
accommodate analysis results from multiple detectors. Once the data is transferred to the
unsecured database it is accessible from applications outside of Global Value (i.e. for
automated data integration with other systems).
Analysis data may be exported using command line parameters described below or using the
interface shown in Figure A.12.1. When using the interactive mode, the analysis results from
samples may be transferred individually by selecting the Sample ID and then the “Export
Sample” button, or all of the samples in the selected detector database can be exported by
selecting the “Batch Export” menu item. When using the Batch mode, all results are deleted
from the receiving database before exporting the new data so this process may take
considerable time when there a large number of samples.
The target database to accept the exported analysis results is specified in the file
GVDataExport.INI which has one parameter for the database path as shown in this example.
[ExportDatabasePath]=C:\User\GVCR\Databases\GlobalValue_Export.mdb
Figure A.12.1 GVDataExport
This program has the following comma-delimited, command line parameters:
1) Detector Number
2) SpectrumID
If a valid Detector Number and SpectrumID is supplied then the sample data associated
with the SpectrumID is automatically exported to the unsecured database. If either
parameter is omitted or invalid, then the form shown in Figure A.12.1 is displayed for
interactive operation.
Page A90 of A91
A.13 EFT Convert
This program generates geometry specific Efficiency tables from a Master Source Certificate
(GammaVision Efficiency Table) using the interface shown in Figure A.13.1. This is an efficient
way to quickly generate efficiency tables for calibration when labs create sources for various
geometries from a known standard such as a liquid vial.
Figure A.13.1 GVEFTConvert
To create a new Efficiency Table from a Master certificate perform the following:
1) Browse to the Master Certificate File by clicking on the button next to this field.
2) Specify the full path for the New Certificate File by typing directly in this field or using the
browse button.
3) Enter an Adjustment Factor to scale the activity values specified in the Master Certificate to
the amount contained in the prepared geometry. This could be a quantity based on volume
or weight if the master source certificate contains activity per volume or weight, or a
fractional value if the master source certificate contains total activity for the source material.
4) Select the OK button to generate the new Efficiency Table. All Gammas Per Second and
Activity values in the Master file are multiplied by the Adjustment Factor when creating the
new file. None of the other information from the Master file is modified.
Page A91 of A91
Appendix B – Automation Job Program Reference
Table of Content
B.1
B.2
B.3
B.4
B.5
B.6
B.7
B.8
B.9
B.10
B.11
B.12
B.13
B.14
B.15
B.16
B.17
B.18
B.19
B.20
B.21
B.22
B.23
B.24
B.25
B.26
B.27
B.28
B.29
B.30
B.31
B.32
B.33
B.34
B.35
B.36
GVSetUser & GVQASetUser........................................................................................................... B2
GVClearData .................................................................................................................................... B3
GVRecallSpectrum .......................................................................................................................... B3
GVDeadTimeCheck ......................................................................................................................... B4
GVTimerControl .............................................................................................................................. B5
GVSampleData ................................................................................................................................ B6
GVSampleDataPlus ....................................................................................................................... B13
GVSampleDataSC ......................................................................................................................... B27
GVSDFData .................................................................................................................................... B54
GVSetSDFParameter..................................................................................................................... B55
GVAskConfirm............................................................................................................................... B55
GVGetConfiguration ..................................................................................................................... B56
GV_GetRType ................................................................................................................................ B57
GV_GetSiteUnit ............................................................................................................................. B58
GV_GetBatch ................................................................................................................................. B58
GV_GetComment .......................................................................................................................... B59
GV_GetGDTPressure .................................................................................................................... B59
GV_GetSamplePump .................................................................................................................... B60
GV_GetRWP................................................................................................................................... B60
GV_GetRadMon ............................................................................................................................. B61
GV_GetCustomData ...................................................................................................................... B61
GV_GetRptData ............................................................................................................................. B63
GVIncrementCounter .................................................................................................................... B64
GV_Custom_Rpt............................................................................................................................ B64
Print_Rpt ........................................................................................................................................ B65
GrossGamma................................................................................................................................. B66
GVQAPeaks ................................................................................................................................... B66
GVQABackground......................................................................................................................... B67
GVQACheckStatus ........................................................................................................................ B67
UfoToPbc ....................................................................................................................................... B68
GVTemplateMaster........................................................................................................................ B69
GVCopyFile .................................................................................................................................... B70
GVOpenFile.................................................................................................................................... B71
GV_ResetInputs ............................................................................................................................ B71
GVSpectrumMux ........................................................................................................................... B71
GVGammaProductsChangeSample ............................................................................................ B76
Page B1 of B77
B.1
GVSetUser & GVQASetUser
These programs prompt for a user name and password for Sample measurement and QA
automation processes using the dialog shown in Figure B.1.1. With a successful login, the
analyst name is set in the Detector (Samples) or QA
database for the specified detector, and this name is
assigned to subsequent analysis or QA measurements on
that instrument. If these functions are not called in the
automation processes then the last user name set for
Sample Analysis or QA measurements on each
detector will be used as the default for subsequent
Figure B.1.1 GVSetUser & GVQASetUser Prompt
measurements on the respective detector.
GVSetUser has the following comma-delimited command line parameters:
1) Full Path to a Detector (Samples) database (required)
2) Require Login Flag (optional): When the “Require Login Flag” is set to “T” (true) the login
prompt cannot be cancelled. A valid login is required. If this parameter is omitted or set to
anything other than “T”, then users can cancel the login dialog and the analyst name is set
to an empty string.
3) Full Path to Job File (required): The content of a helper Job is created by the application to
provide additional functionality within the GammaVision environment. The main Job is
normally configured to run this helper Job immediately after the application closes. The file
content is as follows:
a. If “OK” is selected the file is empty as no further processing is necessary.
b. If “Cancel” is selected, the file contains the QUIT command to terminate the Job and
close GammaVision immediately.
4) Reanalysis Flag (optional): (Not applicable for GVQASetUser) When the Reanalysis Flag is set to
“T” (true) the analyst name is set for Reanalysis processes. If this parameter is omitted or set to
anything other than “T”, then the analyst name is set for non-Reanalysis processes such as Sample
counts or loading spectra as a new analysis. Refer to Section A.1.2 for further information on Reanalysis processes run from Quick Start.
GVQASetUser has the following comma-delimited command line parameters:
1) Detector ID (required): This is the Detector ID (or number) specified in the MCB
Configuration and QA Detector configuration.
2) Full Path to a QA database (required)
3) Require Login Flag (optional): When the “Require Login Flag” is set to “T” (true) the login
prompt cannot be cancelled. A valid login is required. If this parameter is omitted or set to
anything other than “T”, then users can cancel the login dialog and the analyst name is set
to an empty string.
4) Full Path to Job File (required): The content of a helper Job is created by the application to
provide additional functionality within the GammaVision environment. The main Job is
normally configured to run this helper Job immediately after the application closes. The file
content is as follows:
a. If “OK” is selected the file is empty as no further processing is necessary.
b. If “Cancel” is selected the file contains the QUIT command to terminate the Job and
close GammaVision immediately.
Page B2 of B77
B.2
GVClearData
When automation processes are run to analyze samples for the first time (i.e. spectrum
collection) the “non-analysis” data is initially stored as temporary records. Non-analysis data
refers to any information that is not specifically passed to GammaVision, which includes most of
the editable fields in the Sample Administration Analysis Editor. These records are linked to the
Spectrum ID when the analysis has completed and results are transferred to Global Value. If
the automation process is interrupted before the analysis is competed, then these temporary
records could be inadvertently associated a subsequent analysis if different inputs were
required for that analysis.
The GV_ClearData program deletes all of these temporary records to ensure that only those
intended will be associated with the analysis results. It should normally be run in the automation
Job process prior to starting sample data input.
Note that temporary records are not used for reanalysis processes because all of the data has
already been linked to the analysis results; therefore, this function is unnecessary for reanalysis
process that use the GVRecallSpectrum program described in B.3.
GV_ClearData has the following comma-delimited command line parameters:
1) Full Path to a Detector (Samples) database (required)
B.3
GVRecallSpectrum
This program prompts the user to select a
Spectrum for reanalysis using the prompt
shown in Figure B.3.1. The Spectrum list
is populated with analysis records in the
specified database that have not been
electronically reviewed (locked) in the
Sample Administration Analysis Editor.
Spectra can be un-reviewed with the
appropriate permissions to allow
reanalysis when required.
Figure B.3.1 GVRecallSpectrum Prompt
When a Spectrum is selected from the list the Description, Analysis Date, and Spectrum File
path are also displayed for further validation that the correct spectrum has been selected.
When OK is selected the Reanalysis spectrum ID is stored in the database, commands are
written to a helper Job to recall the spectrum, and the reanalysis data file is written as described
below.
GVRecallSpectrum has the following comma-delimited command line parameters:
1) Full Path to a Detector (Samples) database (required)
2) Full Path to Job File (required): The content of a helper Job is created by the application to
provide additional functionality within the GammaVision environment. The main Job is
normally configured to run this helper Job immediately after the application closes. The file
content is as follows:
a. If “OK” is selected the file contains the RECALL command and the spectrum path. If the
spectrum file does not exist, then the spectrum stored in the database will be extracted
to the specified location. Note that samples stored in Global Value prior to Version 2.3
will not have spectra available in the database.
b. If “Cancel” is selected the file contains the QUIT command to terminate the Job and
close GammaVision immediately.
Page B3 of B77
3) Full Path to Data File (required): The content of the Data File is created by the application to
include data associated with the selected sample. This file provides input to other Global
Value programs that can run in the re-analysis processes, such as GVSampleData,
GVSampleDataPlus, GVSampleDataSC, and GVGetConfiguration. Note that different file
names should be specified for each detector to ensure that concurrent automation Jobs do
not overwrite the file content before it has been loaded into all subsequent programs in the
automation Job. The file content is demonstrated with example data as follows:
SpectrumID= 1_00001
Description=Unit Vent
SampleStart=2000-10-24 23:07:00
SampleStop=2000-10-24 23:07:00
Detector=Countroom #4
CalFileName=1_47mmFilter_1.clb
LibFileName=General.lib
Quantity=28910000
QuantityUnits=cc
DatabasePath=C:\User\GVCR\GlobalValue1.mdb
B.4
GVDeadTimeCheck
This program monitors the detector dead time
during automation Jobs and displays a warning
to the operator if the dead time limit is
exceeded.
If a geometry list is provided, then the program
will prompt the user to place the sample in the
next geometry position when the dead time
check fails. (See Figure B.4.2.) The appropriate
efficiency calibration file is loaded into
GammaVision when the program closes to ensure
that the analysis results are accurate for the
sample position specified.
If no geometry sequence is provided, or placing the
sample in the last geometry specified still results in
high dead time, the user can either cancel the
count or elect to continue counting under the
existing condition.
Figure B.4.1 GVDeadTimeCheck Prompt
Figure B.4.2 Dead Time Exceeded Message
The Restart Acquisition button clears the spectrum and restarts the acquisition. This option is
useful when it is obvious that a sample was not placed on the detector, or the sample is
repositioned during the acquisition.
GVDeadTimeCheck has the following comma-delimited command line parameters:
1) Detector Number (required): This is the Detector ID (or number) specified in the MCB
Configuration and Sample Administration configuration.
2) Dead Time Limit (required): This value is listed as a percentage value. For example, a limit
of 10% would require a value of 10.
3) Full Path to Job File (required): The content of a helper Job is created by the application to
provide additional functionality within the GammaVision environment. The main Job is
Page B4 of B77
normally configured to run this helper Job immediately after the application closes. The file
content is as follows:
a. If “Continue Count” is selected or the program closes automatically, and an item from the
Geometry list has been specified, then the command “Recall_Efficiency” followed by the
full path to a calibration file is written to the file with the file path determined as follows:
CalFilePath = CalDirectory + CalFilePrefix + Geometry + “.clb”.
b. If “Continue Count” is selected or the program closes automatically, and an item from the
geometry list has not been set – either due to no geometry list file specified or the dead
time limit being exceeded for the last geometry in the list – then the file is empty.
c. If “Cancel” is selected the file contains the QUIT command to terminate the Job and
close GammaVision immediately.
4) Dead Time Check Duration (optional): This value is the number of seconds required for
monitoring the count time before the program can determine that the dead time is below the
limit. If the dead time exceeds the specified limit during the evaluation period the dead time
field will be set to a red background, and the warning message will be displayed when the
evaluation period has expired. If the dead time does not exceed the limit, then the
application will terminate without any messages after the specified duration has elapsed.
The minimum and default value for this parameter is 10.
5) Full Path to Geometry List (optional): The specified file must be a text file that contains a list
of valid geometries for the specified sample type on each line. The first geometry is the
default and will determine the efficiency calibration file recalled in the subsequent Job file if
the dead time limit is not exceeded. If the dead time limit is exceeded, then the user will be
prompted to move the sample to the next geometry position in the list after which the dead
time will be checked again. If the dead time limit is not exceeded, then the specified
geometry will determine the efficiency calibration file loaded in the subsequent Job file. If
the dead time limit is exceeded after all geometries in the list have been used, then the
message will simply indicate that the dead time limit has been exceeded. Under this
condition no efficiency calibration is loaded in the subsequent Job file, therefore some
default efficiency calibration should be specified prior to running this program in the main
automation Job.
6) Calibration Directory (optional): Used to generate a fully qualified calibration file path. This
parameter is only required if a valid Geometry list is specified. (See 3.a)
7) Calibration File Prefix (optional): Used to generate a fully qualified calibration file path. This
parameter is only required if a valid Geometry list is specified. (See 3.a)
B.5
GVTimerControl
This program is typically used within the
automation process to ensure that the data
acquisition is started at a precise time. It
acts as a countdown timer to pause an
automation Job until the specified date/time
is reached. This is accomplished by entering
the Target Date/Time and clicking on the
“Start Timer” button. When the time
remaining reaches zero, the program closes
and allows the Job to continue to the next
step. The program can also be closed
immediately by selecting the “End Timer” button.
Page B5 of B77
Figure B.5.1 GVTimerControl Prompt
B.6
GVSampleData
This program is used in automation Jobs to collect basic data related to sample
analysis. It allows the use of Microsoft Excel spreadsheets for custom calculations and
data entry, or a basic data entry form for routine samples. The following parameters are
available:
-
Sample Description
Decay Correction Date/Time
Sample Collection Start and Stop Date/Time (when using Excel interface only)
Sample Quantity and Quantity Units
Live Time Preset
The Interface method is dictated by command line parameters as described below.
Implementation for each method is further detailed in sections B.6.1 and B.6.2.
GVSampleData has the following comma-delimited command line parameters:
1) Full Path to SDF file (required): The Decay date/time (and Collection Dates/Times when
using the Excel interface) and Sample Quantity and Units will be written to the SDF file
specified on the command line. This parameter is required and should be unique to the
detector so that Jobs running on other systems will not inadvertently modify this file prior to
being loaded into GammaVision.
2) Full Path to JOB file (required): The content of a helper Job is created by the application to
provide additional functionality within the GammaVision environment. The main Job is
normally configured to run this helper Job immediately after the application closes. The file
content is as follows:
a. If the Excel interface is used or “OK” is selected on the basic data interface then the
following commands are written to the Job File:
Describe_Sample “Description Specified”
Recall_Options “SDFPath”
Set_Preset_Clear
Set_Preset_Live <Live Time Value>
NOTE: The Preset commands are only written if the Live Time field is implemented with
this program. (See parameter #8.) Presets cannot be changed in GammaVision during
an active acquisition, so the main automation Job must ensure that the acquisition is
stopped prior calling this Job, and started (or restarted) afterwards as applicable.
b. If “Cancel” is selected the file contains the QUIT command to terminate the Job and
close GammaVision immediately.
3) Full Path to Microsoft Excel file (optional): If a valid path is provided, then the file will
automatically be opened for data entry. All of the other command line parameters used for
data input are ignored with the exception of the Live Time Preset. (See section B.6.2 for
additional details.)
4) Default Sample Description (optional): This parameter is used to populate the Description
field on the Basic Form interface. To display a dropdown list of sample descriptions, use the
following syntax for the Sample Description field: “FILE: FILEPATH” where FILEPATH is the
full path to a text file with a list of sample descriptions. Not applicable when using the Excel
interface.
Page B6 of B77
5) Default Decay Date/Time (optional): This parameter is used to populate the Decay
Date/Time field on the Basic Form interface. This field can be set to the current date using
the word “TODAY” or the current date/time using the word “NOW”. Not applicable when
using the Excel interface.
6) Default Quantity (optional): This parameter is used to populate the Quantity field on the
Basic Form interface. Not applicable when using the Excel interface.
7) Default Quantity Units (optional): This parameter is used to populate the Quantity Units field
on the Basic Form interface. Not applicable when using the Excel interface.
8) Default Live Time (optional): This parameter is used to populate the Live Time field. If
omitted the Live Time field is hidden such that this application has no control over live time
settings. This may be desirable in automation processes where different preset types are
employed (such as Real Time, MDA, Uncertainty, etc.) or the Live Time preset is not
intended to be adjustable by the analyst. The Live Time preset field is applicable to both the
basic data entry form and the Excel interface. If the Re-Analysis Flag (parameter #9) is set
to “T” (true), then the Live Time field behaves as if the default live time was omitted.
9) Re-Analysis Flag (optional): If set to “T” (true), the Sample Description, Decay Date,
Quantity, and Quantity Units fields on the Basic Form interface are populated with data from
the previous analysis. Any default parameters are ignored. A valid Re-Analysis Data File
path (parameter #10) must also be specified. Not applicable when using he Excel interface.
10) Re-Analysis Data File (optional): If the Re-Analysis Flag (parameter #9) is set to “T” (true),
this file is read to populate fields on the Basic Form interface. The re-analysis data file must
be generated by the GVRecallSpectrum program (section B.3) or a custom developed
application capable of creating the same content. Not applicable when using the Excel
interface.
11) Editable Quantity Units Flag (optional): If set to “T” (true), the Quantity Units field on the
Basic Form interface is editable to allow changes by the analyst. If not set to “T”, the
Quantity Units are not editable. Not applicable when using the Excel interface.
B.6.1 GVSampleData Basic Form Interface
The Basic Form interface shown in
Figure B.6.1.1 is displayed when the
Excel file path command line parameter
is omitted. Fields in this dialog are
populated with default values specified
on the command line. If the Re-Analysis
Flag is set to “T”, then these fields are
populated from the Re-Analysis Data file,
and any default values set in command
line parameters are ignored.
Figure B.6.1.1 GVSampleData Basic Form
The following is an example Job excerpt using the Basic Data Entry form:
Set_Detector 1
Stop
Clear
Run "C:\User\GVCR\GVSampleData.exe C:\User\1_AirFilter.sdf, C:\User\1_SampleData.job, , Waste Tank, Now, 55, ml, 100"
Wait "C:\User\GVCR\GVSampleData.exe”
Call " C:\User\1_SampleData.job"
Start
Wait
Analyze
Page B7 of B77
B.6.2 GVSampleData Excel Interface
The Excel interface is implemented by specifying a valid Excel File Path for the respective
command line parameter. The Excel file is automatically opened when GVSampleData is run.
After entering sample data and calculating parameters if required, the Excel file must be saved
and closed. When the Excel file is closed, the GVSampleData program reads data from the file
and updates the SDF and Job files specified on the command line. If the Excel file was not
saved after changes, then inaccurate data will be used for the analysis. In addition to the
standard analysis parameters saved to the SDF file, custom data parameters and additional
analysis settings can be set using VBA code. The example Excel Interface automation routine
in the default installation, which is configured to calculate air sample volume, demonstrates how
to pass custom data parameters to Global Value and populate the Excel interface with the
original data during the re-analysis process.
With the exception of the Live Time all other parameters used for the Basic Form Interface are
ignored when the Excel interface is implemented. If a default Live Time preset is specified on
the command line, then a prompt for the Live Time as shown in Figure B.6.2.1 will be displayed
after the Excel file is closed. Note that the Live Time can also be set dynamically using VBA
code as described later in this section.
Figure B.6.2.1 GVSampleData Live Time Prompt
The following is an example Job excerpt using the Excel interface:
Set_Detector 1
Stop
Clear
Run "C:\User\GVCR\GVSampleData.exe C:\User\1_AirFilter.sdf, C:\User\1_SampleData.job, C:\User\1_AirVolume.xls"
Wait "C:\User\GVCR\GVSampleData.exe"
Call “C:\User\1_SampleDataJOB"
Start
Wait
Analyze
B.6.2.1
Excel Workbook Format Requirements
The Excel file must be configured properly to ensure that the correct data is returned. This
program reads data from the following cells in a worksheet named “GlobalValue”:
Cell
B1
B2
B3
B4
B5
B6
Sample Data
Sample Description
Collection Start Date/Time
Collection Stop Date/Time
Decay Correction Date/Time
Quantity
Quantity Units
Page B8 of B77
If a worksheet named “GlobalValue” is not found, or these fields are not populated, then no data
is returned by the program.
NOTE: The “GlobalValue” worksheet fields are typically linked to another worksheet that is
configured for data entry and calculations, such as sample volume based on flow rate, as shown
in Figures B.6.2.2 and B.6.2.3.
Figure B.6.2.3 “GlobalValue” Worksheet
Figure B.6.2.2 Data Entry Worksheet
B.6.2.2
Using Excel Forms and Macros
Visual Basic for Applications (VBA) may be used to optimize data entry and populate the
worksheet with the original data during a re-analysis process. VBA Forms may also be
employed when a more standard interface is preferred over the spreadsheet view. Forms may
also simplify data validation and other processes during or after data entry for those familiar with
VBA programming.
Workbooks that run Excel Forms or Macros on startup can fire these processes twice in
succession when launched from GVSampleData. The typical result is that two forms are
displayed when the workbook opens. This effect is due to the connection method employed by
GVSampleData and is easily addressed with a simple validation process shown in the VBA
code snippet below. This process checks a worksheet cell to see if a date/time has been set in
the previous five seconds. If it hasn’t then the date/time gets set in that cell. This part of the
code will execute when the GVSampleData program connects to the workbook. If the date/time
has been set within the previous five seconds, then the connection phase must have been
executed so the form is displayed. The position settings effectively hide Excel so it is not readily
apparent to the end-user that Excel is being used for the data entry process. The affect is
similar to interfacing with a stand-alone Windows application.
Page B9 of B77
Private Sub Workbook_Activate()
On Error Resume Next
If Worksheets("Calc").Range("A20").Value > Now - (5 / 24 / 60 / 60) Then
With Application
.WindowState = xlNormal
sLeftPos = .Left
sTopPos = .Top
sHeight = .Height
sWidth = .Width
.Left = -100
.Top = -100
.Height = 10
.Width = 10
End With
frmDataEntry.Show
Else
Worksheets("Calc").Range("A20") = Now
End If
End Sub
Typically, a second macro (as shown below) is run when the workbook is closed to reset the
Excel window size so that it displays properly when opened using any method other than the
GVSampleData program. (Note that the position and size variables have PUBLIC scope to the
workbook.)
Sub Auto_Close()
On Error Resume Next
With Application
If Not sLeftPos = 0 Then
.Left = sLeftPos
.Top = sTopPos
.Height = sHeight
.Width = sWidth
End If
End With
End Sub
B.6.2.3
Custom Data Parameters and Re-Analysis Automation
The Excel Interface can be used in combination with other Global Value Job Programs to pass
custom data associated with the sample during the measurement process and re-populate the
Excel interface with the original sample data during re-analysis. The Excel Interface examples
demonstrate this process and can be referenced for additional detail for specific commands and
parameters used in the automation Jobs. The Reanalysis process is described below with the
standard sample count being very similar. File paths and WAIT commands have been removed
for simplicity.
1)
Prompt for user login and make a Buffer window active in GammaVision.
2)
Select the buffer and prompt for a spectrum to re-analyze. The file created at this step will be read by the Excel
spreadsheet to get some of the sample data. (See Section B.3 GVRecallSpectrum for detail related to the file
content.)
Run "GVRecallSpectrum.exe GlobalValue1.mdb, 1_Recall.Job, 1_RecallData.txt"
Page B10 of B77
3)
Create an SDF file from the detector-independent template file and modify default parameters as applicable.
This SDF file will be updated by GVSampleData later.
Run "GVCopyFile.exe DecayCorrection_uCi.Sdf, 1_RunReanalysis.sdf"
4)
Make a detector specific copy of an Excel file that can be used for data input with the GVGetSampleData
program. Note that “Reanalysis” is appended to the file name as this naming convention will be used in the
Excel VBA code to set the sample data fields.
Run "GVCopyFile.exe AirVolumeCalc.xls, 1_AirVolumeCalcReanalysis.xls"
5)
Prompt for sample data using the Excel Workbook that was just created. See B.6 Item #2 for parameters that
will be set in the helper Job (Sample Description, Recall SDF, and Live Time if applicable).
Run "GVSampleData.exe 1_RunReanalysis.sdf, 1_SampleDataReanalysis.Job,
1_AirVolumeCalcReanalysis.xls, , , , , , T, 1_RecallData.txt, T"
Call "1_SampleDataReanalysis.Job"
6)
Load the Efficiency calibration and Library. This can be accomplished either using GVGetConfiguration as shown
here, or by calling a Job that is dynamically created by the Excel VBA code from the previous step if desired.
Run "GVGetConfiguration.exe 1_ConfigReanalysis.Job, 1_, C:\User\Cal\, C:\User\Lib\, , , T,
1_RecallData.txt"
7)
Set or prompt for PBC files and other parameters. Similar to the calibration and library parameters, these
settings can be modified by creating dynamic Jobs in Excel VBA code, and then calling those Jobs here.
8)
Run_GVGetCustomData to load custom data from a file created by the Excel VBA code previously. The file
path to the custom data file must be synchronized in the Excel file to ensure that the correct file is used here.
Run "GV_GetCustomData.exe GlobalValue1.mdb, 1_GVSampleData-CustomDataReanalysis.txt, T, T,
C:\User\GVCR\TEMP\1_AbortReanalysis.Job"
9)
Analyze the spectrum, load the analysis data to the database, generate the custom report, and print the results
as applicable.
In Step #5, the GVSampleData program is run with key command line parameters that specify its behavior. In this
case, it is passed the SDF file, helper Job file, Excel file, Re-analysis data file, and a flag indicating that it will run in
the Re-analysis mode. (See comma-delimited command line parameters in Section B.6). The following process is
implemented when GVSampleData is run:
1)
Since a path to an Excel file is passed to the program this file is automatically opened.
2)
When the Excel file is opened the VBA code in the sub routine “Workbook_Activate” fires. The following is a
brief snippet of this sub routine to highlight the main process. Details are omitted for simplicity. Refer to the VBA
code in the AirVolumeCalc.xls file for full details.)
Private Sub Workbook_Activate()
'Determine if any code should be run based on flag setting. This prevents the code from
'running when data is read from the GlobalValue worksheet after the file has been closed
'by the user.
If Not Sheets("Main").Range("DataSavedFlag") = "TRUE" Then
'If the file contains the word “Reanalysis” then read the Reanalysis Data File with
'the same file prefix as this Excel file name. Details for reading the content of the
'Reanalysis Data file are in the “GetReanalysisData” function.
If InStr(1, ActiveWorkbook.Name, "Reanalysis", vbTextCompare) > 0 Then
szRootReanalysisDataFileName = Sheets("Main").Range("ReanalysisDataRootFileName")
bRecallDataSuccess = GetReanalysisData(GetAppPath & GetFilePrefix & _
szRootReanalysisDataFileName & ".txt")
If bRecallDataSuccess Then
'If the RecallData file is read successfully, then set the applicable fields
'to the previous analysis data either from the parameters read from the
'RecallData file or by using the GVAnalysisParameter Excel Add-In function.
End If
Else
'Setup default parameters for non-reanalysis conditions here if desired...
End If
'Set a cell value so this code doesn’t run again when the GlobalValue worksheet
'is read by the GVSampleData program.
Sheets("Main").Range("DataSavedFlag") = "TRUE"
End If
End Sub
Page B11 of B77
The following is a brief overview of the process implemented in the Workbook_Activate code:
a. Check the cell content in the “Main” worksheet to prevent the code from firing twice. This is similar to
the process described in Section B.6.2.2. Instead of setting a date/time, we simply change the content
of a cell to the word “TRUE” when the code runs. After the file is saved and closed, the GVSampleData
program opens the file to read the content of the GlobalValue worksheet, and the Workbook_Activate
function fires again. This time the cell content is already set to “TRUE” so the rest of the code is
bypassed. This requires that the value of the cell in the source file copied in Step #4 of the Job process
described previously is something other than “TRUE”.
b. If the Excel file name contains the word “reanalysis”, then populate the applicable fields with data from
the original analysis as follows:
i. Read the text file created by the GVRecallSpectrum program in Step #2 of the Job process
described previously. The path to this file is determined by a “root” file name stored in the
“Main” worksheet along with the file prefix which is determined by the name of the Excel file.
This requires the Excel file to be named using the same Detector Prefix as the RecallData text
file. The path is assumed to be in the same directory as the Excel file since both files are
dynamically created in the C:\User\GVCR\Temp directory for each automation process.
ii. When reading the RecallData text file several variables are set to the values stored within this
file to use for populating fields in various worksheets. The target database path and Spectrum
ID are also read from the RecallData file, and this data allows the use of the
GVAnalysisParameter Excel Add-In function (See Appendix F) to get any other analysis or
custom data for this sample to repopulate fields in the worksheet.
c. If the Excel file name does not contain the work “reanalysis”, then the current code doesn’t do anything.
A commented placeholder is used to indicate where special initialization code would be set for this
condition. Typically, additional code is unnecessary here because the worksheet is generally easier to
configure with default settings than it would be to use VBA code.
3)
When the Excel file is closed it is important to capture all of the important data and save the file. This is usually
accomplished by having the user click a button on the Worksheet or Form that runs VBA code to automate this
process. In the Excel example Job that uses AirVolumeCalc.xls a button is included on the “Calc” worksheet
with the caption “Save and Continue”. The VBA code that runs when this button is clicked is as follows:
Private Sub cmdContinue_Click()
Call GenerateCustomDataFile
ActiveWorkbook.Save
Application.Quit
End Sub
Sub GenerateCustomDataFile()
On Error GoTo errHandler
Open GetCustomDataFilePath For Output As #1
Print #1, "DisplayForm = No"
Print #1, "ShowSavedData = No"
Print #1, "SampleFlowrate = " & Sheets("Calc").Range("SampleFlowRate")
Print #1, "FlowrateUnits = " & Sheets("FlowUnitsList").Range("FlowRateUnits")
Print #1, "CollectionEfficiency = " & Sheets("Calc").Range("CollectionEfficiency")
Close #1
Exit Sub
errHandler:
'Exit
End Sub
The following is a brief overview of the process implemented in this code:
a. Run the GenerateCustomDataFile routine to create a text file that will be passed to the
GV_GetCustomData program in Step #8 of the Job process described previously. Refer to
GV_GetCustomData for more detail related to the content of this file. Note that the DisplayForm and
ShowSavedData parameters are set to “No” so that this data transfer process is invisible to the user.
b. After the custom data file is created, the file is saved and Excel is closed. At this point, the
GVSampleData program opens the Excel file, reads the data from the GlobalValue worksheet, updates
the SDF file specified on the command line, and creates the helper Job file content as described in
Section B.6.2.
If analysis setting changes beyond those specified on the GlobalValue worksheet are desired then additional
VBA code may be used to create a Helper Job that is called before Step #9 of the Job process described
previously. The content of this Job will be a series of “Set_Setting” Job commands for each applicable
parameter, and the file can be created using a function similar to “GenerateCustomDataFile” shown in the
previous example. Refer to the Set_Setting Job command in the GammaVision User Manual for additional detail
with this command.
Page B12 of B77
B.7
GVSampleDataPlus
GVSampleDataPlus is a sample data entry program that extends the basic form interface of the
original GVSampleData to include sample collection start and stop time, and sample quantity
calculations based on flowrate or unit conversion. The quantity calculations include adjustment
by a multiplier and divisor to correct for collection efficiency, sample plateout, dry/wet ratio, etc.
Various flags in the application’s
configuration file determine which
fields are displayed on the user
interface and how sample volume
calculations will be implemented.
When the application is started, the
interface shown in Figure B.7.1 is
displayed. Several fields may be
hidden depending on flags set in the
application’s configuration file
described in section B.7.1. These
flags allow the user interface to be
customized for specific sample types,
and determine how the analysis
quantity will be calculated when
applicable.
Figure B.7.1 GVSampleDataPlus Interface
GVSampleDataPlus has the following command line parameter:
1) Full Path to Configuration File (required): The configuration file must contain the parameters
described in section B.7.2. This file should be unique to ensure that it is not overwritten by
other processes prior to use.
B.7.1 GVSampleDataPlus Operation
GVSampleDataPlus is run from within GammaVision automation Jobs, and displays the
interface shown in Figure B.7.1. When the program is closed the content of a helper Job is
created by the application to provide additional functionality within the GammaVision
environment. The main Job is normally configured to run this helper Job immediately after the
application closes. The file content is as follows:
a. If “OK” is selected then the following commands are written to the Job File:
Describe_Sample “Description Specified”
Recall_Options “SDFPath”
Set_Preset_Clear
Set_Preset_Live <Live Time Value>
NOTE: The Preset commands are only written if the Live Time Preset parameter is
implemented with this program. (See Section B.7.2) Presets cannot be changed in
GammaVision during an active acquisition, so the main automation Job must ensure that
the acquisition is stopped prior calling this Job, and started (or restarted) afterwards as
applicable.
Page B13 of B77
b. If “Cancel” is selected the file contains the QUIT command to terminate the Job and
close GammaVision immediately.
This application also creates a Custom Data File which allows custom data parameters to be
stored for the analysis (See Section B.7.2.31).
The following is an example of how this application would be run from an acquisition Job.
Run "C:\User\GVCR\GVSampleDataPlus.exe C:\User\GVCR\Temp\1_GVQuickStart.cfg"
Wait "C:\User\GVCR\GVSampleDataPlus.exe"
Stop
Call "C:\User\GVCR\Temp\1_SampleDataPlus.job"
Start
...
Run "C:\User\GVCR\GV_GetCustomData.exe” (with applicable parameters)
B.7.2 GVSampleDataPlus Configuration
The parameters in this section are required in the configuration file specified on the command
line for this program. Any other text in the configuration file is ignored to allow comments or
other parameters to be included without affecting the application.
Any valid variables may be used for setting the configuration file parameters in the Global Value
Quick Start process as well. Typically, this would include parameters defined in the Global or
Job Configuration Files, or those generated by GlobalValueQuickStart when an automation
process is initiated. This is normally accomplished in the automation Job by making a copy of
GVQuickStart.cfg (or GVQuickStartReanalysis.cfg) using GVCopyFile. The following is an
example Job excerpt that would be run prior to GVSampleDataPlus:
Run "C:\User\GVCR\GVCopyFile.exe C:\User\GVCR\GVQuickStart.cfg, C:\User\GVCR\Temp\1_GVQuickStart.cfg"
Wait "C:\User\GVCR\GVCopyFile.exe"
The file path “C:\User\GVCR\Temp\1_GVQuickStart.cfg” is passed to GVSampleDataPlus as a
command line argument as shown in section B.7.1.
Page B14 of B77
Configuration File Parameter List
The following parameters must be defined in the configuration file passed to the application.
Each parameter is defined in detailed in the remainder of this section.
Section
Parameter Name
B.7.2.1
|GVSampleDataPlus_ReanalysisFlag|
B.7.2.2
|GVSampleDataPlus_SampleDescription|
B.7.2.3
|GVSampleDataPlus_CollectionStartTime|
B.7.2.4
|GVSampleDataPlus_ShowCollectionStartField|
B.7.2.5
|GVSampleDataPlus_CollectionStopTime|
B.7.2.6
|GVSampleDataPlus_ShowCollectionStopField|
B.7.2.7
|GVSampleDataPlus_Quantity|
B.7.2.8
|GVSampleDataPlus_QuantityOutputShow|
B.7.2.9
|GVSampleDataPlus_LiveTimePreset|
B.7.2.10
|GVSampleDataPlus_MaxDecayHours|
B.7.2.11
|GVSampleDataPlus_QuantityCalculationMethod|
B.7.2.12
|GVSampleDataPlus_QuantityCalculationMethodShow|
B.7.2.13
|GVSampleDataPlus_QuantityCalculationInputValue|
B.7.2.14
|GVSampleDataPlus_QuantityCalculationInputUnits|
B.7.2.15
|GVSampleDataPlus_QuantityCalculationInputUnitsAllowChange|
B.7.2.16
|GVSampleDataPlus_QuantityCalculationInputUnitsLabel|
B.7.2.17
|GVSampleDataPlus_QuantityCalculationOutputUnits|
B.7.2.18
|GVSampleDataPlus_QuantityCalculationOutputUnitsAllowChange|
B.7.2.19
|GVSampleDataPlus_QuantityCalculationOutputUnitsLabel|
B.7.2.20
|GVSampleDataPlus_QuantityCalculationMultiplierValue|
B.7.2.21
|GVSampleDataPlus_QuantityCalculationMultiplierLabel|
B.7.2.22
|GVSampleDataPlus_QuantityCalculationMultiplierShow|
B.7.2.23
|GVSampleDataPlus_QuantityCalculationDivisorValue|
B.7.2.24
|GVSampleDataPlus_QuantityCalculationDivisorLabel|
B.7.2.25
|GVSampleDataPlus_QuantityCalculationDivisorShow|
B.7.2.26
|GVSampleDataPlus_QuantityCalculationIgnorePrevious|
B.7.2.27
|GVSampleDataPlus_SDFFilePath|
B.7.2.28
|GVSampleDataPlus_JOBFilePath|
B.7.2.29
|GVSampleDataPlus_ReanalysisDataFilePath|
B.7.2.30
|GVSampleDataPlus_CustomDataInputFilePath|
B.7.2.31
|GVSampleDataPlus_CustomDataOutputFilePath|
B.7.2.32
|GVSampleDataPlus_QuantityCalculationConversionTablePath|
Page B15 of B77
B.7.2.1
|GVSampleDataPlus_ReanalysisFlag|
This flag is set to either “T” (true) or “F” (false). If set to “T”, then a valid reanalysis data file
path must be provided. (See B.7.2.29) The Live Time Preset field is also hidden and not
used if this parameter is set to “T”. Setting this parameter to anything other than “T” equates
to “F” (false).
Example:
|GVSampleDataPlus_ReanalysisFlag|=T
B.7.2.2
|GVSampleDataPlus_SampleDescription|
This parameter sets the default Sample Description or the Full Path to a text file with a list of
Sample Descriptions. To display a dropdown list of sample descriptions, use the following
syntax for the Sample Description field: “FILE: FILEPATH” where FILEPATH is the full path
to a text file with a list of sample descriptions.
Example:
|GVSampleDataPlus_SampleDescription|=FILE: |CONFIGDIR|DescriptionList.txt
Where |CONFIGDIR| is defined in the Configuration Files, and the contents of
DescriptionList.txt are configured as follows:
First Description
Second Description
Etc. (no limits on number of descriptions entered)
B.7.2.3
|GVSampleDataPlus_CollectionStartTime|
This parameter sets the default Date/Time for the Collection Start field when it is displayed.
The parameter can be set to a static date/time or keywords can be used where
“TODAY”=current date and “NOW”=current date and time.
If the Collection Start Time field is hidden (See B.7.2.4), then this parameter is ignored.
Examples:
|GVSampleDataPlus_CollectionStartTime|=2012-06-08 13:25
|GVSampleDataPlus_CollectionStartTime|=April 1, 2012 12:00
|GVSampleDataPlus_CollectionStartTime|=NOW
|GVSampleDataPlus_CollectionStartTime|=TODAY
Page B16 of B77
B.7.2.4
|GVSampleDataPlus_ShowCollectionStartField|
This flag is set to either “T” (true) or “F” (false) to show or hide the Sample Collection Start
Time field respectively. If the Sample Collection Stop Time field is hidden, then the Sample
Collection Start Time field is hidden automatically, and this parameter is ignored.
If this field is hidden, then the Sample Collection Start time passed to the SDF file will be the
same as the Sample Collection Stop Time. The label for the Sample Collection Stop Time
field is also changed to reflect a single sample date/time entry.
This field must be displayed when using the “Flowrate” Quantity Calculation Method. (See
B.7.2.11)
Example:
|GVSampleDataPlus_ShowCollectionStartField|=T
B.7.2.5
|GVSampleDataPlus_CollectionStopTime|
This parameter sets the default Date/Time for the Collection Stop Time (or Sample
Date/Time) field. The parameter can be set to a static date/time or keywords can be used
where “TODAY”=current date and “NOW”=current date and time.
If the Collection Stop Time (or Sample Date/Time) field is hidden, then this default time is
written to the specified SDF file for analysis. If this field is hidden and a default date/time is
not specified, then the current date/time is written to the specified SDF file.
Examples:
|GVSampleDataPlus_CollectionStopTime |=2012-06-08 13:25
|GVSampleDataPlus_CollectionStopTime |=8/9/2012 08:00
|GVSampleDataPlus_CollectionStopTime |=NOW
|GVSampleDataPlus_CollectionStopTime |=TODAY
B.7.2.6
|GVSampleDataPlus_ShowCollectionStopField|
This flag is set to either “T” (true) or “F” (false) to show or hide the Sample Collection Stop
Time field respectively. If the Sample Collection Stop Time field is hidden, then the Sample
Collection Start Time field is also hidden automatically.
If this field is hidden, then the default Sample Collection Stop time is passed to the SDF file.
Both the Sample Collection Start and Stop Time fields must be displayed in order for the
“Flowrate” Quantity Calculation Method to be calculated correctly. (See B.7.2.11)
Example:
|GVSampleDataPlus_ShowCollectionStopField|=T
Page B17 of B77
B.7.2.7
|GVSampleDataPlus_Quantity|
This parameter sets the default analysis quantity. The analysis quantity field is also the
QuantityCalculationOutput field. If a quantity calculation method is specified, then this field
is disabled and the content is determined by the calculation method.
Example:
|GVSampleDataPlus_Quantity|=1000
B.7.2.8
|GVSampleDataPlus_QuantityOutputShow|
This flag is set to either “T” (true) or “F” (false) to show or hide the Analysis Quantity
(QuantityCalculationOutput) field. When this field is hidden, the Quantity Output Units field
is also hidden. If the Quantity Output Units field is enabled, then this flag should be set to
“T”.
Example:
|GVSampleDataPlus_QuantityOutputShow|=T
B.7.2.9
|GVSampleDataPlus_LiveTimePreset|
The Live Time Preset is the default preset in seconds. If this field is not set (or set equal to
nothing) then the Live Time Preset field is hidden and the application does not return Preset
Job commands in the helper Job. (See Section B.7.1)
Example:
|GVSampleDataPlus_LiveTimePreset|=3600
B.7.2.10 |GVSampleDataPlus_ MaxDecayHours|
The Max Decay Hours specifies the maximum number of hours allowed between the
Sample Date/Time (or Sample Collection Stop Time) and the current time. This parameter
is useful for applications that require samples to be counted within a specified time period
after collection. Fractional hours are acceptable.
Examples:
|GVSampleDataPlus_MaxDecayHours|=2
|GVSampleDataPlus_MaxDecayHours|=0.5
Page B18 of B77
B.7.2.11 |GVSampleDataPlus_QuantityCalculationMethod|
The Quantity Calculation Method dictates how the Analysis Quantity
(QuantityCalculationOutput) value is calculated. The options are as follows:
1) None - The Analysis Quantity field is enabled for direct entry/modification by the
analyst. The Quantity Calculation Input field is hidden, and no calculations are
implemented. The Analysis Quantity Units dropdown list is populated with the
default Output Quantity Units and those specified in the Quantity Calculation
Conversion Table (See B.7.2.32). If the Method specified is not set to either
“Flowrate” or “UnitConversion” as described below, then it is automatically set to
“None”.
2) Flowrate – This method calculates the analysis quantity in the required units based
on flowrate in the units specified. The flowrate and analysis quantity units are
configured in the Quantity Calculation Conversion Table (See B.7.2.32). The
Analysis Quantity is calculated as follows:
AQ = QI * Dur * CF * M / D
Where:
AQ
= Analysis Quantity
QI
= Quantity Input value (flow rate in this case)
Dur
= Duration (Collection Stop Time – Collection Start Time in minutes)
CF
= Conversion Factor (See B.7.2.32)
M
= Multiplier value
D
= Divisor value
3) UnitConversion – This method allows the sample quantity to be entered in different
units than the analysis quantity. For example, the analyst may enter 100 g and have
0.1 Kg used for the analysis. The Analysis Quantity is calculated as follows:
AQ = QI * CF * M / D
Where:
AQ
= Analysis Quantity
QI
= Quantity Input value
CF
= Conversion Factor (See B.7.2.32)
M
= Multiplier value
D
= Divisor value
Examples:
|GVSampleDataPlus_QuantityCalculationMethod|=None
|GVSampleDataPlus_QuantityCalculationMethod|=Flowrate
|GVSampleDataPlus_QuantityCalculationMethod|=UnitConversion
Page B19 of B77
B.7.2.12 |GVSampleDataPlus_QuantityCalculationMethodShow|
This flag is set to either “T” (true) or “F” (false) to show or hide the Quantity Calculation
Method dropdown list. Displaying the list provides maximum flexibility in performing various
calculations, but this configuration does not provide the structure that is often desired for
data input. When this configuration is used the labels for the Quantity Calculation Input,
Multiplier, and Divisor fields must be sufficiently generic to apply to all types of calculations.
Typically, this field is hidden and the Quantity Calculation Method is preset for a specific
sample type. For example, an automation Job for Air Filters may use the Flowrate
Calculation Method, with the labels set similar to those shown in Figure B.7.1.
Example:
|GVSampleDataPlus_QuantityCalculationMethodShow|=F
B.7.2.13 |GVSampleDataPlus_QuantityCalculationInputValue|
This parameter sets the default value for the Quantity Calculation Input field. This field is
only used when the Quantity Calculation Method is set to either “Flowrate” or
“UnitConversion”. (See B.7.2.11)
Example:
|GVSampleDataPlus_QuantityCalculationInputValue|=2
B.7.2.14 |GVSampleDataPlus_QuantityCalculationInputUnits|
This parameter sets the default units for the Quantity Calculation Input field. This field is
only used when the Quantity Calculation Method is set to either “Flowrate” or
“UnitConversion”. (See B.7.2.11) The input and output unit combination must be defined in
the Quantity Calculation Conversion Table (See B.7.2.32).
Example:
|GVSampleDataPlus_QuantityCalculationInputUnits|=cfm
B.7.2.15 |GVSampleDataPlus_QuantityCalculationInputUnitsAllowChange|
This flag is set to either “T” (true) or “F” (false) to enable or disable the Quantity Calculation
Input Units field. If enabled the analyst can select predefined units from the dropdown list,
or manually type in their own units.
Example:
|GVSampleDataPlus_QuantityCalculationInputUnitsAllowChange|=T
Page B20 of B77
B.7.2.16 |GVSampleDataPlus_QuantityCalculationInputUnitsLabel|
This parameter sets the label for the Quantity Calculation Input field. This label is normally
set to describe the expected units for this field, such as flow rate, weight, volume, etc.
When the Quantity Calculation Method dropdown list is displayed this label should be
generic enough for all calculation methods so that it is meaningful regardless of the method
selected. (See B.7.2.11)
Examples:
|GVSampleDataPlus_QuantityCalculationInputUnitsLabel|=Sample Flow Rate:
|GVSampleDataPlus_QuantityCalculationInputUnitsLabel|=Sample Dry Weight:
B.7.2.17 |GVSampleDataPlus_QuantityCalculationOutputUnits|
This parameter sets the default units for the Quantity Calculation output (analysis quantity)
field. When the Quantity Calculation Method is set to either “Flowrate” or “UnitConversion”,
the input and output unit combination must be defined in the Quantity Calculation
Conversion Table (See B.7.2.32).
Examples:
|GVSampleDataPlus_QuantityCalculationOutputUnits|=cc
|GVSampleDataPlus_QuantityCalculationOutputUnits|=Kg
B.7.2.18 |GVSampleDataPlus_QuantityCalculationOutputUnitsAllowChange|
This flag is set to either “T” (true) or “F” (false) to enable or disable the Quantity Calculation
Output Units field. If enabled the analyst can select predefined units from the dropdown list,
or manually type in their own units.
Example:
|GVSampleDataPlus_QuantityCalculationOutputUnitsAllowChange|=T
B.7.2.19 |GVSampleDataPlus_QuantityCalculationOutputUnitsLabel|
This parameter sets the label for the Quantity Calculation Output (analysis quantity) field.
This label is normally set to describe the expected units for this field, such as Analysis
Quantity, Calculated Volume, etc. When the Quantity Calculation Method dropdown list is
displayed this label should be generic enough for all calculation methods so that it is
meaningful regardless of the method selected. (See B.7.2.11)
Examples:
|GVSampleDataPlus_QuantityCalculationOutputUnitsLabel|=Analysis Quantity:
|GVSampleDataPlus_QuantityCalculationOutputUnitsLabel|=Sample Wet Weight:
|GVSampleDataPlus_QuantityCalculationOutputUnitsLabel|=Sample Volume:
Page B21 of B77
B.7.2.20 |GVSampleDataPlus_QuantityCalculationMultiplierValue|
This parameter sets the default value for the Quantity Calculation Multiplier field. This field
is only used when the Quantity Calculation Method is set to either “Flowrate” or
“UnitConversion”. (See B.7.2.11)
Example:
|GVSampleDataPlus_QuantityCalculationMultiplierValue|=0.95
B.7.2.21 |GVSampleDataPlus_QuantityCalculationMultiplierLabel|
This parameter sets the label for the Quantity Calculation Multiplier field. This label is
normally set to describe the expected units for this field, such as Efficiency, wet/dry ratio,
etc. When the Quantity Calculation Method dropdown list is displayed this label should be
generic enough for all calculation methods so that it is meaningful regardless of the method
selected. (See B.7.2.11)
Examples:
|GVSampleDataPlus_QuantityCalculationMultiplierLabel|=Sampler Efficiency:
|GVSampleDataPlus_QuantityCalculationMultiplierLabel|=Wet/Dry Ratio:
B.7.2.22 |GVSampleDataPlus_QuantityCalculationMultiplierShow|
This flag is set to either “T” (true) or “F” (false) to show or hide the Quantity Calculation
Multiplier field. When the field is displayed the content is editable by the analyst. When it is
hidden, the default Quantity Calculation Multiplier value is used for any quantity calculations
specified as long as the default value is greater than zero. If the default is zero, then the
multiplier is not used in the quantity calculation.
This field is only used for Quantity Calculations, so it is normally hidden when the Quantity
Calculation Method is set to “None”.
Example:
|GVSampleDataPlus_QuantityCalculationMultiplierShow|=T
B.7.2.23 |GVSampleDataPlus_QuantityCalculationDivisorValue|
This parameter sets the default value for the Quantity Calculation Divisor field. This field is
only used when the Quantity Calculation Method is set to either “Flowrate” or
“UnitConversion”. (See B.7.2.11)
Example:
|GVSampleDataPlus_QuantityCalculationDivisorValue|=2.5
Page B22 of B77
B.7.2.24 |GVSampleDataPlus_QuantityCalculationDivisorLabel|
This parameter sets the label for the Quantity Calculation Divisor field. This label is normally
set to describe the expected units for this field, such as Plate out Factor, Dry/Wet Ratio, etc.
When the Quantity Calculation Method dropdown list is displayed this label should be
generic enough for all calculation methods so that it is meaningful regardless of the method
selected. (See B.7.2.11)
Examples:
|GVSampleDataPlus_QuantityCalculationDivisorLabel|=Plate out factor:
|GVSampleDataPlus_QuantityCalculationMultiplierLabel|=Dry/Wet Ratio:
B.7.2.25 |GVSampleDataPlus_QuantityCalculationDivisorShow|
This flag is set to either “T” (true) or “F” (false) to show or hide the Quantity Calculation
Divisor field. When the field is displayed the content is editable by the analyst. When it is
hidden, the default Quantity Calculation Divisor value is used for any quantity calculations
specified as long as the default value is greater than zero. If the default is zero, then the
divisor is not used in the quantity calculation.
This field is only used for Quantity Calculations, so it is normally hidden when the Quantity
Calculation Method is set to “None”.
Example:
|GVSampleDataPlus_QuantityCalculationDivisorShow|=F
B.7.2.26 |GVSampleDataPlus_QuantityCalculationIgnorePrevious|
This flag is set to either “T” (true) or “F” (false), and it is only used when the Reanalysis Flag
is set to “T” (true).
When set to “T”, the Quantity Calculation method specified in the configuration file is used
regardless of what method was used in the previous analysis (if applicable). In order to be
able to change the calculation method during reanalysis (i.e. when a sample is initially
analyzed with an incorrect method) this parameter should be set to “T”.
When set to “F” the Quantity Calculation method used with the previous analysis is used
instead of the Quantity Calculation method specified in the configuration file. This option is
normally used for routine sample reanalysis so that all of previous parameters are shown in
the data entry window.
Example:
|GVSampleDataPlus_QuantityCalculationIgnorePrevious|=T
Page B23 of B77
B.7.2.27 |GVSampleDataPlus_SDFFilePath|
This parameter requires the full path to an SDF file. The Decay and Collection Dates/Times,
Sample Quantity, and Quantity Units for analysis will be written to the SDF file which is
subsequently loaded into GammaVision in the helper Job. (See Section B.7.1). This file
path should be unique for each detector so that Jobs running on other systems will not
inadvertently modify this file before it is read into GammaVision during the automation
process.
Examples:
|GVSampleDataPlus_SDFFilePath|=C:\User\GVCR\Temp\1_Run.sdf
|GVSampleDataPlus_SDFFilePath|=|GVCopySDF_Destination|
The second example shows how a parameter variable from Quick Start configuration files
can be used to set the file path. This parameter must be defined in the configuration file
passed to the program. In this example, this parameter is the destination path in the
Run_GVCopyFile program definition. Early in the main automation Job a template SDF file
is normally copied from the default location to a temporary folder with the detector name
specified as a prefix to ensure that it is unique for this process.
B.7.2.28 |GVSampleDataPlus_JOBFilePath|
This parameter requires the full path to a helper Job that is called when the program closes.
(See Section B.7.1 for file content.)
Example:
|GVSampleDataPlus_JOBFilePath|=|GLOBALVALUEDIR|TEMP\|DETNO|_SampleData.Job
This example demonstrates how parameter variables from Quick Start configuration files
can be used to define the file path. These parameters must be defined in the configuration
file passed to the program.
B.7.2.29 |GVSampleDataPlus_ReanalysisDataFilePath|
This parameter requires the full path to the reanalysis data file generated by the
GVRecallSpectrum application. (See Section B.3) This parameter is only used when the
Reanalysis Flag is set to “T”.
Example:
|GVSampleDataPlus_ReanalysisDataFilePath|=|GVRecallSpectrum_DataFilePath|
This example demonstrates how parameter variables from Quick Start configuration files
can be used to define the file path. The parameter variable shown is defined in the Global
Configuration Files, and it routinely used for any program requiring access to this file.
Page B24 of B77
B.7.2.30 |GVSampleDataPlus_CustomDataInputFilePath|
This parameter requires the full path to a custom data input file as described for
GV_GetCustomData. (See Section B.22) This file is used as a template for creating the
Custom Data Output File described below. This file should normally contain the following
text:
DisplayForm = No
ShowSavedData = No
Example:
|GVSampleDataPlus_CustomDataInputFilePath|=
|CONFIGDIR|GVSampleDataPlus_CustomDataInput.txt
B.7.2.31 |GVSampleDataPlus_CustomDataOutputFilePath|
This parameter requires the full path to a custom data output file. (See Section B.22) This
file is generated when the application closes and must be used as an input to the
GV_GetCustomData application in the main automation Job file after the application closes
and before using the GV_GetCustomData program to capture other custom data. This file
has the following content:
Full content of the Custom Data Input File as described in B.7.2.30.
QuantityCalculationType=Calculation Method Type (i.e. Flowrate, UnitConversion, or
N/A if no quantity calculation is applied)
QuantityCalculationValue=Calculation Input value (i.e. Flowrate or Unit Conversion
Input value, or N/A if no quantity calculation is applied.)
QuantityCalculationUnits=Calculation Input Units or N/A if no quantity calculation is
applied.
QuantityCalculationMultiplier=Multiplier field value formatted as “0.000E+00” or N/A if
the multiplier is not used.
QuantityCalculationDivisor=Divisor field value formatted as “0.000E+00” or N/A if the
multiplier is not used.
If the Reanalysis Flag is set to “T”, then the parameter names and values of any
previously stored custom data are also included in this file.
The following Quantity Calculation Custom fields must be defined in the Sample
Administration Configuration in order for these parameters to be stored in the Global
Value database:
QuantityCalculationType
QuantityCalculationValue
QuantityCalculationUnits
QuantityCalculationMultiplier
QuantityCalculationDivisor
Page B25 of B77
Example:
|GVSampleDataPlus_CustomDataOutputFilePath|=
|GLOBALVALUEDIR|TEMP\|DETNO|_CustomData.txt
Example Custom Data Output File Content:
DisplayForm =No
ShowSavedData =No
QuantityCalculationType=Flowrate
QuantityCalculationValue=2.000E+00
QuantityCalculationUnits=cc/min
QuantityCalculationMultiplier=9.500E-01
QuantityCalculationDivisor=1.000E+00
B.7.2.32 |GVSampleDataPlus_QuantityCalculationConversionTablePath|
This parameter requires the full path to a Conversion Table file that is used for Flow rate and
Unit Conversion Analysis Quantity Calculations. This file is also used to define the default
Analysis Quantity units to display in the dropdown list when the Quantity Calculation Method
is set to “None”.
Example:
|GVSampleDataPlus_QuantityCalculationConversionTablePath|=
|CONFIGDIR|ConversonTable.txt
The File format for the Conversion Table content is four comma-delimited parameters as
follows:
Calculation Method, Input Units, Output Units, Conversion Factor
The Conversion factor is used to convert the input units into the output units specified using
the calculations shown in Section B.7.2.11. The Input and Output units define the available
selections in the Quantity Calculation Input and Output unit dropdown list.
Examples:
Flowrate, cc/min, L, 1E-3
Flowrate, CFM, L, 28.320
UnitConversion, L, cc, 1000
UnitConversion, g, Kg, 1E-3
The default quantity units to display without calculations are also included in this file. These
settings have three comma-delimited parameters and must follow the Flowrate and
UnitConversion parameters. Note that the second parameter is ignored, and can be blank.
Examples:
None, ,L
None, ,gm
Page B26 of B77
B.8
GVSampleDataSC
GVSampleDataSC provides an interface for sample data entry when using sample changers,
importing data, and using custom data fields. This program includes most commonly used
parameters, including Geometry and Library selection, so that all data can be entered for
multiple samples from a common location.
When using the “Multiple Samples” option, which is typical for sample changer operations, the
interface is similar to that shown in Figure B.8.1. The Sample Queue is hidden when run in the
Single Sample mode.
The content of the Analysis Data and Custom Sample Data sections may be modified by the
Analysis Method and Custom Data configurations respectively.
Figure B.8.1 GVSampleDataSC for Multiple Samples
GVSampleDataSC has the following command line parameter:
1) Full Path to Configuration File (required): The configuration file must contain the parameters
described in section B.8.2. This file should be unique to ensure that it is not overwritten by
other processes prior to use.
Page B27 of B77
B.8.1 GVSampleDataSC Operation
B.8.1.1
Implementation
GVSampleDataSC is run from within GammaVision automation Jobs to allow Sample Data
to be captured for one or more samples depending on the mode. When the “Continue”
button is selected the following processes occur:
1) If the Multiple Samples option is disabled, then the sample data displayed is stored as
the only sample in the hidden queue.
2) An automation Job is created for each sample in the queue by merging the Output
Configuration file (See Section B.8.3) with the specified Job Template (See Sections
B.8.2.11, B.8.2.18, and B.8.2.19 for Samples, QA Peaks, and QA Background
respectively). This Job file creation processes is similar to that described for
GVTemplateMaster (See Section B.32). The file name for each Job file is the same as
the Job File Path parameter (See Section B.8.2.5) with the Sample Queue position
appended.
3) A text file containing analysis data is created for each sample in the queue. The file
name for each sample is the same as the Job File Path parameter (See Section B.8.2.5)
with “_SDFData” and the Sample Queue position appended. These files must be
passed to the GVSDFData program (See Section B.9) in the sample specific Jobs
created in Step #1. See Section B.8.3.17 for the full content and format of this file.
4) A text file containing custom data is created for each sample in the queue. The file
name for each sample is the same as the Job File Path parameter (See Section B.8.2.5)
with “_CustomData” and the Sample Queue position appended. These files must be
passed to the GV_GetCustomData program (See Section B.21) in the sample specific
Jobs created in Step #1. See Section B.8.3.16 for the full content and format of this file.
5) When reanalyzing samples a Job file is created to load the PBC file used in the previous
analysis. (See Section B.8.2.10 for file path and content.)
6) If more than one sample has been added to the Sample Queue, then a report showing
the full list of samples is printed to the default printer.
7) A helper Job is created which calls the automation Job generated in the Step #1 for the
first sample in the queue. If multiple samples were in the queue, then the automation
Job for each subsequent sample is called at the end of the current sample Job. (See
Section B.8.3 for applicable Job Template parameters that are used for this purpose.)
When the “Cancel” button is selected a helper Job is created as described in Step #7 except
that the content of the file is the QUIT command to terminate GammaVision.
The following is an example of how this application would be run from an acquisition Job:
Run "C:\User\GVCR\GVSampleDataSC.exe C:\User\GVCR\Temp\1_SampleDataSCData.txt"
Wait "C:\User\GVCR\GVSampleDataSC.exe"
Call "C:\User\GVCR\Temp\1_SampleDataSC.job"
NOTE: When using this application with multiple samples that include the QA Peak and QA
Background options, the user must login to both the Detector/Sample database and the QA
Database using GVSetUser and GVQASetUser respectively prior to running this application.
Page B28 of B77
(See Section B.1) This is required in order to set the current analyst name for all
subsequent measurements that will result from running this program. This is frequently
unnecessary because QA measurements are typically run and verified prior to starting a
batch of unattended measurements using a sample changer. If only Samples or QA
measurements are made, then login to only the applicable database is necessary
B.8.1.2
Data Entry
1) Select an Analysis Method from the dropdown list. The analysis method specifies a
number of parameters to use in the analysis process as well as default values for many
of the sample data fields. See Section B.8.2.4 for details related to the Analysis Method
settings.
2) If Laboratory Information Management System (LIMS) Data is imported as shown in
Figure B.8.1, then select the appropriate sample data. The LIMS Data can be linked to
Analysis Data fields that are updated when the LIMS record is selected. If LIMS data is
not imported, then custom data section may be used for manual data entry as shown in
Figure B.8.2. These parameters cannot be linked to the other Analysis Data fields, so
they can be updated at any time. See Section B.8.2.24 for details related to the LIMS
Data integration.
3) Validate or update all sample data
fields.
4) If using the “Multiple Samples” mode
then select the “Add” button to add the
current sample to the list. The Position
Number will automatically be set to the
sample position within the grid.
5) Sample data may be reviewed by
selecting the applicable item within the
list. All of the associated fields will be
populated with the data last saved for
the selected sample. If any changes to
the data are required, then select the
“Update” button after making changes
to save changes in the Sample Que.
Figure B.8.2 GVSampleDataSC for Single Sample
6) A sample may be removed from the Sample Queue by selecting the item within the list
and then selecting the “Remove” button. All samples following the removed item will
automatically be renumbered based on their order in the list.
7) After all samples have been added to the Sample Queue (or when using the Single
Sample mode), select the “Continue” button to initiate the processes described
previously in this section. Alternatively, the measurement can be canceled and
GammaVision closed by selecting the “Cancel” button.
Page B29 of B77
B.8.1.3
Analysis Quantity Calculations
The Analysis Quantity is calculated based on sample flow rate or dilution depending on the
settings in the Analysis Method selected. See Section B.8.2.4 for details related to the Analysis
Methods.
1)
Analysis Quantity based on Flow rate
AQ = SF * EFF * Dur * CF / DF
Where:
AQ
SF
EFF
Dur
CF
DF
= Analysis Quantity
= Sample Flow rate (See B.8.2.4.16)
= Collection Efficiency (B.8.2.4.18)
= Duration (Collection Stop Time – Collection Start Time in minutes)
= Conversion Factor (See B.8.2.4.17)
= Dilution Factor (See B.8.2.4.14)
2) Analysis Quantity based on Dilution
AQ = SQ * EFF / DF
Where:
AQ
SQ
EFF
DF
= Analysis Quantity
= Sample Quantity (See B.8.2.4.5)
= Collection Efficiency (B.8.2.4.18)
= Dilution Factor (See B.8.2.4.14)
B.8.2 GVSampleDataSC Configuration
The parameters in this section are required in the configuration file specified on the command
line for this program. Any other text in the configuration file is ignored to allow comments or
other parameters to be included without affecting the application.
Any valid variables may be used for setting the configuration file parameters in the Global Value
Quick Start process as well. Typically, this would include parameters defined in the Global or
Job Configuration Files, or those generated by GlobalValueQuickStart when an automation
process is initiated. This is normally accomplished in the automation Job by making a copy of
GVQuickStart.cfg (or GVQuickStartReanalysis.cfg) using GVCopyFile. The following is an
example Job excerpt that would be run prior to GVSampleDataSC:
Run "C:\User\GVCR\GVCopyFile.exe C:\User\GVCR\GVQuickStart.cfg, C:\User\GVCR\Temp\1_SampleDataSCData.txt"
Wait "C:\User\GVCR\GVCopyFile.exe"
The file path “C:\User\GVCR\Temp\1_SampleDataSCData.txt” is passed to GVSampleDataSC
as a command line argument as shown in section B.8.1.
Page B30 of B77
Configuration File Parameter List
The following parameters must be defined in the configuration file passed to the application.
Each parameter is defined in detailed in the remainder of this section.
Section
Parameter Name
B.8.2.1
|GVSampleDataSC_MultipleSamples|
B.8.2.2
|GVSampleDataSC_DETNO|
B.8.2.3
|GVSampleDataSC_DETSPECTRUMPREFIX|
B.8.2.4
|GVSampleDataSC_AnalysisMethodFilePath|
B.8.2.5
|GVSampleDataSC_JobFilePath|
B.8.2.6
|GVSampleDataSC_CalibrationDirectory|
B.8.2.7
|GVSampleDataSC_LibraryDirectory|
B.8.2.8
|GVSampleDataSC_DETRPTDIR|
B.8.2.9
|GVSampleDataSC_PBCDirectory |
B.8.2.10
|GVSampleDataSC_PBCLoadJobFilePath|
B.8.2.11
|GVSampleDataSC_JobTemplateFilePath|
B.8.2.12
|GVSampleDataSC_DefaultSDFFilePath|
B.8.2.13
|GVSampleDataSC_DefaultReportTemplate|
B.8.2.14
|GVSampleDataSC_ActivityUnitsFilePath|
B.8.2.15
|GVSampleDataSC_SampleSizeUnitsFilePath|
B.8.2.16
|GVSampleDataSC_FlowUnitsFilePath|
|GVSampleDataSC_DilutionFactorsFilePath|
B.8.2.17
B.8.2.18
|GVSampleDataSC_QAPeakJobTemplateFilePath|
B.8.2.19
|GVSampleDataSC_QABkgdJobTemplateFilePath|
B.8.2.20
|GVSampleDataSC_QAPeakConfigurationFilePath|
B.8.2.21
|GVSampleDataSC_QABkgdConfigurationFilePath|
B.8.2.22
|GVSampleDataSC_Reanalysis|
B.8.2.23
|GVSampleDataSC_ReanalysisDataFilePath|
B.8.2.24
|GVSampleDataSC_LIMSInputFilePath|
B.8.2.25
|GVSampleDataSC_EditableLIMSData|
B.8.2.26
|GVSampleDataSC_EditableCollectionEfficiency|
B.8.2.27
|GVSampleDataSC_HideLiveTimePreset|
B.8.2.28
|GVSampleDataSC_ContinueCommand|
Page B31 of B77
B.8.2.1
|GVSampleDataSC_MultipleSamples|
This flag is set to either “T” (true) or “F” (false). When set to “T” (true) the grid for adding
samples to the automation queue is displayed. (See Figure B.8.1) If set to anything else,
the grid is not displayed so the application is effectively in the single sample analysis mode.
(See Figure B.8.2).
This flag is ignored in Reanalysis mode because the program is configured to edit only the
sample being reanalyzed.
Example:
|GVSampleDataSC_MultipleSamples|=T
B.8.2.2
|GVSampleDataSC_DETNO|
This parameter is the Detector Number as set in Global Value configuration on the
Detectors tab. This is the same number established for the respective detector in MCB
Configuration during the hardware configuration.
Example:
|GVSampleDataSC_DETNO|=|DETNO|
where |DETNO| is defined in the Quick Start Configuration file. (See Section A.1 for more
details regarding the Quick Start configuration files.)
B.8.2.3
|GVSampleDataSC_DETSPECTRUMPREFIX|
This parameter is the Spectrum Prefix as set in Global Value configuration on the Detectors
tab for the applicable detector.
Example:
|GVSampleDataSC_DETSPECTRUMPREFIX|=|DETSPECTRUMPREFIX|
where |DETSPECTRUMPREFIX| is defined in the Quick Start Configuration file. (See
Section A.1 for more details regarding the Quick Start configuration files.)
Page B32 of B77
B.8.2.4
|GVSampleDataSC_AnalysisMethodFilePath|
This parameter requires the full path to the Analysis Method File. This file is a commaseparated values (CSV) file format that contains all of the Analysis Methods and associated
parameters except for those associated with “QA Peaks” and “QA Background”. The first
record (row) in this file is reserved as the parameter (column) headings. This record is
ignored when the file is read by GVSampleDataSC, so any meaningful descriptions may be
used. The default header descriptions are similar to the following:
AnalysisMethod, SDFFileName, Geometry, Library, Quantity, QuantityUnits, ActivityUnits,
LiveTime, ReportTemplate, SampleType, Different Start/StopTimes,
DefaultSampleDateTime, UseDilution, DilutionFactor, UseFlowrate, Flowrate, FlowrateUnits,
CollectionEfficiency, SampleComment, SampleDescription, ContinueCommand
Example:
|GVSampleDataSC_AnalysisMethodPath|=|CONFIGDIR|GVSampleDataSC_Methods.csv
where |CONFIGDIR| is defined in the Quick Start Configuration file. (See Section A.1 for
more details regarding the Quick Start configuration files. This parameter is normally set in
the Global Configuration Files.)
As described in Section B.8.1, several parameters are set to default values when the
Analysis Method is selected on the GVSampleDataSC interface. These parameters are
described in the remainder of this section.
B.8.2.4.1
Analysis Method
These method names are displayed in the Analysis Method dropdown list on the
GVSampleDataSC interface. The method names must be unique; therefore, empty
records (rows) are not allowed in this file.
B.8.2.4.2
SDF File Name
The SDF File Name excludes the directory path and file extension. This file name is used
to set the |GVSampleDataSCOut_SDFDATAFILEPATH| parameter (See Section B.8.3.17)
with the SDF path defined as “|SDFDIR|SDFFileName.sdf" where |SDFDIR| must be
defined in the Quick Start Configuration file.
If this parameter is omitted then the default SDF file path (See B.8.2.12) is used to set the
|GVSampleDataSCOut_SDFDATAFILEPATH| parameter.
B.8.2.4.3
Geometry
The Geometry is the default Calibration File name excluding the directory path, File Prefix
as defined for each detector in Global Value Configuration, and the file extension. If
omitted or a valid geometry is not specified, then no default selection is made in the
Geometry dropdown list.
B.8.2.4.4
Library
The Library is the default Library File name excluding the directory path and file extension.
If omitted or a valid library is not specified, then no default selection is made in the Library
dropdown list.
Page B33 of B77
B.8.2.4.5
Quantity
The default quantity must be numeric if set. If omitted the Analysis Quantity field is blank.
When using Flowrate calculations, this field is ignored.
B.8.2.4.6
Quantity Units
This parameter sets the default units for the Sample Quantity and Analysis Quantity.
The dropdown list for the Analysis Quantity Units is populated from the Flow Units File
(See Section B.8.2.16) when the Flowrate calculation is implemented.
The dropdown list for the Sample Quantity Units is populated from the Sample Size Units
File (See Section B.8.2.15) when the Flowrate calculation is not implemented.
B.8.2.4.7
Activity Units
The default activity units must match one of those defined in the Activity Units file. (See
Section B.8.2.14) If omitted then no default selection is made in the Activity Units
dropdown list.
NOTE: The SDF file activity units must be set to “Bq” for the activity conversion to be
valid. The Activity Units file has conversion factors to convert the reported activity from Bq
to the activity units selected in GVSampleDataSC. This conversion factor is written to the
SDF file Activity Units Divisor field as part of the automation Job process as described in
Section B.8.1.1 Step #3.
B.8.2.4.8
Live Time
The default Live Time preset value must be numeric. If omitted the user must enter a Live
Time for the sample count.
This field is ignored in the Reanalysis Mode since presets are not applicable.
B.8.2.4.9
Report Template
The Report Template must match the name of a Report Template defined in the Global
Value Configuration on the Report Templates tab. This parameter is not editable on the
program interface. If an invalid template name is specified, then the user will be prompted
to select a valid name when the report is generated for the measurement. See Section
B.25 for a detailed description of the GV_Custom_Rpt program.
B.8.2.4.10 Sample Type
The Sample Type must match one of the Sample Types defined within the Global Value
Configuration on the “Sample Types” tab. If it doesn’t match a predefined Sample Type,
then none of the items in the dropdown list will be selected by default.
B.8.2.4.11 Different Start/Stop Times
This parameter is set to either “Yes” or “No”. When set to “Yes” the Sample Start
Date/Time field is displayed in the Analysis Data section. When set to “No” only the
Sample Stop Date/Time is displayed and the label is changed to “Decay Date/Time”. In
this condition the Sample Start Date/Time is set to the same time as the Sample Stop
Time.
Page B34 of B77
B.8.2.4.12 DefaultSampleDateTime
The default Sample Date/Time can be any valid date/time format. It can also be set to the
current date using the word “TODAY” or the current date/time using the word “NOW”.
Both the Sample Collection Start and Stop Time fields are populated with this setting.
B.8.2.4.13 Use Dilution
This parameter is set to either “Yes” or “No”. When set to “Yes” the Dilution field and a
button to access selectable Dilution schemes are displayed. See Section B.8.2.17 for
details related to the Dilution Factors file format.
When set to “No” the Dilution Factor field is hidden and set to a value of one.
B.8.2.4.14 Dilution Factor
A Default Dilution Factor may be set if desired. The value must be greater than zero. If
the “Use Dilution” parameter is set to “No”, then this parameter is ignored, and a default
value of one is used.
B.8.2.4.15 Use Flowrate:
This parameter is set to either “Yes” or “No”. When set to “Yes” the Flowrate, Flowrate
Units, and Collection Efficiency fields are displayed and populated with the default
parameters specified in this section.
When set to “No” the Flowrate and Flowrate Units fields are hidden and not used for
Analysis Quantity calculations.
B.8.2.4.16 Flowrate:
The default flowrate is set to zero if the default value is blank, less than zero, or nonnumeric. This field is ignored if the “Use Flowrate” parameter is set to “No”.
B.8.2.4.17 Flowrate Units
The default Flowrate units must match one of those defined in the Flow Units File (See
Section B.8.2.16) If omitted then no default selection is made in the Flow Units dropdown
list.
B.8.2.4.18 Collection Efficiency
If the Collection Efficiency value is greater than zero or the “Use Flowrate” parameter is
set to “Yes”, then the Collection Efficiency field is displayed and populated with the default
value.
If the Collection Efficiency is not specified and the Flowrate calculation is not implemented,
then this field is hidden and not used in the Analysis Quantity calculation.
B.8.2.4.19 SampleComment
This parameter sets the default text for the Sample Comment field.
Page B35 of B77
B.8.2.4.20 Sample Description
This parameter sets the default Sample Description or the Full Path to a text file with a list
of Sample Descriptions. To display a dropdown list of sample descriptions, use the syntax
“FILE: FILEPATH” where FILEPATH is the full path to a text file with a list of sample
descriptions.
B.8.2.4.21 Continue Command
This parameter sets the automation Job instructions that will be created in the helper Job
described in Section B.8.1.1 Step #7 when the “Continue” button is selected. The
instructions in this helper Job are performed prior to calling the automation Job for the first
sample.
If nothing is specified then the default Continue Command for the program will be used.
This is typically the desired configuration when using the “multiple samples” mode
because the command set in this condition is not specified to the last sample loaded in the
sample queue.
When using the Single Sample mode each Analysis Method can specify different
instructions to run when the program closes. For example, a method may be configured
for samples that require Radiation Monitor Readings (See Section B.21). The commands
that must be generated to prompt for this information can be set in the Continue Command
as follows:
The Continue Command requires one parameter that is defined in the configuration file
passed to this program followed by the equals (“=”) sign.
Example: “ |Run_GVGetRadMonitor|=”
When using the process described in Section B.8.2 with the default Global Value
installation, the content of the helper Job when counting a sample on Detector #3 would
be:
Run "C:\...\GV_GetRadMon.exe C:\...\GlobalValue3.mdb, F, C:\...\3_Abort.Job"
Wait "C:\...\GV_GetRadMon.exe"
Call "C:\...\3_Abort.Job"
Call "C:\...\3_SampleDataSC1.Job"
The last line calls the automation Job for the first (or in this case the only) sample in the
queue.
Configuration Parameters may also be combined to allow for multiple commands. This is
accomplished by making a parameter that includes others that are predefined. The
following example shows a parameter configured to prompt for Radiation Monitor
Readings and Radiation Work Permits:
|RunRadMonitor_RunRWP|=|Run_GVGetRadMonitor||CrLf||Run_GVGetRWP|
If the Continue Command is set to “|RunRadMonitor_RunRWP|=” then the helper Job
content would be:
Run "C:\...\GV_GetRadMon.exe C:\...\GlobalValue3.mdb, F, C:\...\3_Abort.Job"
Wait "C:\...\GV_GetRadMon.exe"
Page B36 of B77
Call "C:\...\3_Abort.Job"
Run "C:\...\GV_GetRWP.exe C:\...\GlobalValue3.mdb, F, C:\...\3_Abort.Job"
Wait "C:\...\GV_GetRWP.exe"
Call "C:\...\3_Abort.Job"
Call "C:\...\3_SampleDataSC1.Job"
Refer to Section B.32 (GVTemplateMaster) for details related to configuration parameters
and how they are used with Job Templates to create automation Job commands.
B.8.2.5
|GVSampleDataSC_JobFilePath|
This parameter specifies the full path to a Job File that will be called from the main
application Job immediately after the GVSampleDataSC application closes. The contents of
this Job are either the word “Quit” if the Cancel button is selected in the application interface
(this command terminates the automation routine and closes GammaVision), or the text
specified in the “ContinueCommand” parameter followed by the path to a dynamically
generated Job file for the first sample in the queue.
Example:
|GVSampleDataSC_JobFilePath|=
|GLOBALVALUEDIR|Temp\|DETNO|_SampleDataSC|TempFileSuffix|.job
where each parameter is defined in the Quick Start Configuration file. (See Section A.1 for
more details regarding the Quick Start configuration files.)
B.8.2.6
|GVSampleDataSC_CalibrationDirectory|
This parameter specifies the directory to search for valid calibration files associated with the
applicable detector. This relationship between the calibration file name and the detector is
based on the file name prefix matching the required detector prefix. (See Section B.8.2.3)
The Geometry list on the application’s interface is populated with all of the files with “.clb”
extension and the specified File Prefix within this directory. The file prefix and extension is
omitted from the file name when displayed in the Geometry list.
Example:
|GVSampleDataSC_CalibrationDirectory|=|CALDIR|
where |CALDIR| is defined in the Quick Start Configuration file. (See Section A.1 for more
details regarding the Quick Start configuration files.)
Page B37 of B77
B.8.2.7
|GVSampleDataSC_LibraryDirectory|
This parameter specifies the directory to search for valid library files. The Library list on the
application’s interface is populated with all of the files with “.lib” extension from this directory.
The file extension is omitted from the file name when displayed in the Library list.
Example:
|GVSampleDataSC_LibraryDirectory|=|LIBDIR|
where |LIBDIR| is defined in the Quick Start Configuration file. (See Section A.1 for more
details regarding the Quick Start configuration files.)
B.8.2.8
|GVSampleDataSC_DETRPTDIR|
This parameter is used to set the “ReportFileName” parameter in the SDF Data file. The
use of this file is described in Section B.8.1.1 Step #3. The full content of the SDF Data file
is described in Section B.8.3.17.
Example:
|GVSampleDataSC_DETRPTDIR|=|DETRPTDIR|
where |DETRPTDIR| is defined in the Quick Start Configuration file. (See Section A.1 for
more details regarding the Quick Start configuration files.)
B.8.2.9
|GVSampleDataSC_PBCDirectory|
This parameter specifies the directory where PBC (Peak Background Files) are stored. It is
used to create the content of a helper Job that is called in the automation Job created for
reanalysis processes as described in Section B.8.1.1 Step #5.
The full content of the helper Job is: Load_PBC “PBCDirectory\PBCFilename”
Where the PBCDirectory is the directory specified for this parameter, and PBCFileName is
the name stored in Global Value for the previous analysis. If PBC was not used for the
previous analysis then the content of the helper Job is blank.
Example:
|GVSampleDataSC_PBCDirectory|=|PBCDIR|
where |PBCDIR| is defined in the Quick Start Configuration file. (See Section A.1 for more
details regarding the Quick Start configuration files.)
Page B38 of B77
B.8.2.10 |GVSampleDataSC_PBCLoadJobFilePath|
This parameter specifies the file path where the Job content described in Section B.8.2.9 will
be saved.
Example:
|GVSampleDataSC_PBCLoadJobFilePath|=
|GLOBALVALUEDIR|Temp\|DETNO|_LoadPBCReanalysis.job
where each parameter is defined in the Quick Start Configuration file. (See Section A.1 for
more details regarding the Quick Start configuration files.)
B.8.2.11 |GVSampleDataSC_JobTemplateFilePath|
This parameter specifies the full path to a Job Template file which is used to create the
automation Jobs for each sample in the queue as described in Section B.8.1.1 Step #2.
This template is not used for Peak or Background QA. At a minimum this Job Template
must include the following functions:
1)
2)
3)
4)
5)
6)
7)
8)
9)
10)
11)
12)
Change Sample (Multiple Samples mode only. Changer type dictates the specific commands.)
Set Sample Description
Copy the Default SDF file to the sample specific SDF file path
Update the sample specific SDF file using data from the SDF Data file
Load the SDF file into GammaVision
Set the Sample Type / R-Type
Load the calibration and library files
Load the Custom Data from the Custom Data file.
Load the PBC file used for the previous analysis (for re-analysis only)
Save, Analyze, and load analysis data into Global Value.
Create and Print (if applicable ) reports
Call the Job File for the Next sample in the queue
Refer to Section B.31 and the example Job Templates for more detail related to the file
content.
Example:
|GVSampleDataSC_JobTemplateFilePath|=|JOBTemplateDIR|SCCountSamples.jtp
where |JOBTemplateDIR| is defined in the Quick Start Configuration file. (See Section A.1
for more details regarding the Quick Start configuration files.)
Page B39 of B77
B.8.2.12 |GVSampleDataSC_DefaultSDFFilePath|
This parameter specifies the full path to the SDF file to be used if an SDF File name is not
specified in the Analysis Methods file for the selected method. Typically, this parameter is
not used.
Example:
|GVSampleDataSC_DefaultSDFFilePath|=|GVCopySDF_Destination|
where |GVCopySDF_Destination| defines the SDF File path where the template SDF File is
saved using the GVCopyFile program as described in Section B.8.2.
B.8.2.13 |GVSampleDataSC_DefaultReportTemplate|
This parameter specifies the Report Template to be used if a Report Template name was
not specified in the Analysis Methods file for the selected method. See Section B.8.2.4.9 for
template name requirements. Typically, this parameter is not used.
Example:
|GVSampleDataSC_DefaultReportTemplate|=Generic Template
B.8.2.14 |GVSampleDataSC_ActivityUnitsFilePath|
This parameter specifies the full path to a text file that defines the valid units that are used to
populate the Activity Units dropdown list. The file also includes conversion factors to
convert from the standard activity units set in the SDF file to those specified. The default
file content includes conversion factors from standard units of Becquerel (Bq).
Example:
|GVSampleDataSC_ActivityUnitsFilePath|=
|CONFIGDIR|GVSampleDataSC_ActivityUnits.txt
The file contains comma-delimited parameters as follows: (Unit, Conversion Factor)
Data starts after the asterisk (*) line.
**************************************************************************************
Ci, 3.7E+10
Bq, 1
DPM, 0.01666667
Any text can precede the asterisk (*) line, but the asterisk line must exist as it signals the
start of the parameters to be read. The units use conversion factors from Bq. This
conversion factor is written to the SDF file Activity Units Divisor field as part of the
automation Job process as described in Section B.8.1.1 Step #3.
Page B40 of B77
B.8.2.15 |GVSampleDataSC_SampleSizeUnitsFilePath|
This parameter specifies the full path to a text file that defines the valid units that are used to
populate the Sample Quantity Units dropdown list. Note that the user can also enter units
that are not included this list.
Example:
|GVSampleDataSC_SampleSizeUnitsFilePath|=
|CONFIGDIR|GVSampleDataSC_SampleSizeUnits.txt
The file format is as follows:
Data starts after the asterisk (*) line.
**************************************************************************************
g
mg
Kg
ml
L
Sample
Any text can precede the asterisk (*) line, but the asterisk line must exist as it signals the
start of the parameters to be read.
B.8.2.16 |GVSampleDataSC_FlowUnitsFilePath|
This parameter specifies the full path to a text file that defines the valid sample flow and
analysis quantity units that are used to populate the Flowrate and Analysis Quantity Units
dropdown lists. The file also includes conversion factors to convert from the flow units to the
analysis units.
Example:
|GVSampleDataSC_FlowUnitsFilePath|=|CONFIGDIR|GVSampleDataSC_FlowUnits.txt
The file contains comma-delimited parameters as follows:
(Flow Units, Volume Units, Conversion Factor)
Data starts after the asterisk (*) line.
**************************************************************************************
SCFM, cc, 28316.84659
LPM, cc, 1000
Any text can precede the asterisk (*) line, but the asterisk line must exist as it signals the
start of the parameters to be read. Only acceptable combinations can be used for the Flow
rate calculation (See Section B.8.1.3 for the Flow rate calculation.)
Page B41 of B77
B.8.2.17 |GVSampleDataSC_DilutionFactorsFilePath|
This parameter specifies the full path to a text file that defines the
valid dilution schemes that are used to populate the Dilution
Schemes list. This list is accessed by selecting the “Lookup” button
next to the Dilution Factor field. When an item in this list is selected
and the dialog box is closed, the associated dilution value is set in
the Dilution Factor field. This process can simplify the calculation of
multiple dilutions when the typical dilution fractions are pre-defined.
Example:
Figure B.8.2.17 Dilution Schemes
|GVSampleDataSC_DilutionFactorsFilePath|=
|CONFIGDIR|GVSampleDataSC_DilutionFactors.txt
The file contains comma-delimited parameters as follows: (Dilution Scheme, Dilution Factor)
Data starts after the asterisk (*) line.
**************************************************************************************
1-10, 10
1-100, 100
1-10 plus 1-10, 100
Any text can precede the asterisk (*) line, but the asterisk line must exist as it signals the
start of the parameters to be read.
B.8.2.18 |GVSampleDataSC_QAPeakJobTemplateFilePath|
This parameter specifies the full path to a Job Template file which is used to create the
automation Jobs for the “QA Peaks” Analysis Method as described in Section B.8.1.1 Step
#2. At a minimum this Job Templates must include the following functions:
1)
2)
3)
4)
5)
6)
7)
8)
9)
Change Sample (Multiple Samples mode only. Changer type dictates the specific commands.)
Set Sample Description
Copy the Default SDF file to the sample specific SDF file path
Update the sample specific SDF file using options set in the QA Peak Configuration File (See
Section B.8.2.20)
Load the SDF file into GammaVision
Load the calibration and library files
Save, Analyze, and load QA data into Global Value.
Recalibrate Energy/FWHM, and load AS LEFT QA data (as applicable)
Call the Job File for the Next sample in the queue
Refer to Section B.31 and the example Job Templates for more detail related to the file
content.
Example:
|GVSampleDataSC_QAPeakJobTemplateFilePath|=|SCQAPeak|
where |SCQAPeak| is defined in the Quick Start Configuration file. (See Section A.1 for
more details regarding the Quick Start configuration files.)
Page B42 of B77
B.8.2.19 |GVSampleDataSC_QABkgdJobTemplateFilePath|
This parameter specifies the full path to a Job Template file which is used to create the
automation Jobs for the “QA Background” Analysis Method as described in Section B.8.1.1
Step #2. At a minimum this Job Templates must include the following functions:
1)
2)
3)
4)
5)
6)
7)
8)
Change Sample (Multiple Samples mode only. Changer type dictates the specific commands.)
Set Sample Description
Copy the Default SDF file to the sample specific SDF file path
Update the sample specific SDF file using options set in the QA Background Configuration File
(See Section B.8.2.20)
Load the SDF file into GammaVision
Load the calibration and library files
Save, Analyze, and load Background data into Global Value.
Call the Job File for the Next sample in the queue
Refer to Section B.31 and the example Job Templates for more detail related to the file
content.
Example:
|GVSampleDataSC_QABkgdJobTemplateFilePath|=|SCQABkgd|
where |SCQABkgd| is defined in the Quick Start Configuration file. (See Section A.1 for
more details regarding the Quick Start configuration files.)
B.8.2.20 |GVSampleDataSC_QAPeakConfigurationFilePath|
This parameter specifies the full path to a Configuration file which defines Job specific
parameters used to create the automation Jobs for the “QA Peaks” Analysis Method as
described in Section B.8.1.1 Step #2. This configuration file is normally the Job
Configuration File used to run QA Peaks as a standalone process from Quick Start.
Refer to Section B.31 and the example Job Configuration Files for more detail related to the
file content.
Example:
|GVSampleDataSC_QAPeakConfigurationFilePath|=
|JobDir|Det|DETNO|\QA\Daily Calibration Check.cfg
where each parameter is defined in the Quick Start Configuration file. (See Section A.1 for
more details regarding the Quick Start configuration files.)
Page B43 of B77
B.8.2.21 |GVSampleDataSC_QABkgdConfigurationFilePath|
This parameter specifies the full path to a Configuration file which defines Job specific
parameters used to create the automation Jobs for the “QA Background” Analysis Method
as described in Section B.8.1.1 Step #2. This configuration file is normally the Job
Configuration File used to run QA Background as a standalone process from Quick Start.
Refer to Section B.31 and the example Job Configuration Files for more detail related to the
file content.
Example:
|GVSampleDataSC_QABkgdConfigurationFilePath|=
|JobDir|Det|DETNO|\QA\Daily Background.cfg
where each parameter is defined in the Quick Start Configuration file. (See Section A.1 for
more details regarding the Quick Start configuration files.)
B.8.2.22 |GVSampleDataSC_Reanalysis|
This flag is set to either “T” (true) or “F” (false). If set to “T”, then a valid reanalysis data file
path must be provided. (See B.7.2.29) The Live Time Preset field is also hidden and not
used if this parameter is set to “T”. Setting this parameter to anything other than “T” equates
to “F” (false).
Example:
|GVSampleDataPlus_ReanalysisFlag|=T
B.8.2.23 |GVSampleDataSC_ReanalysisDataFilePath|
This parameter specifies the full path to the reanalysis data file generated by the
GVRecallSpectrum program previously in the automation job. (See Section B.3) If the
Reanalysis Flag is set to “T”, then the contents of this file are read by the application to
populate the program fields with data from the previous analysis.
Example:
|GVSampleDataSC_ReanalysisDataFilePath|=|GVRecallSpectrum_DataFilePath|
where |GVRecallSpectrum_DataFilePath| is defined in the Quick Start Configuration file.
(See Section A.1 for more details regarding the Quick Start configuration files.)
Page B44 of B77
B.8.2.24 |GVSampleDataSC_LIMSInputFilePath|
This parameter specifies the full path to the LIMS Input data file. The “LIMS” term refers to a
Laboratory Information Management System which could be any data storage system.
When these systems can be configured to create a CSV file in the proper format the data
can be seamlessly loaded into Global Value. When LIMS integration is not necessary or
possible this file can be used to establish data input fields for custom data parameters or
default parameters for configurations that require modification to the Analysis Method
defaults.
Example:
|GVSampleDataSC_LIMSInputFilePath|=
|LIMSDIR|GVSampleDataSC_CustomInputData.csv
where |LIMSDIR| is defined in the Quick Start Configuration file. (See Section A.1 for more
details regarding the Quick Start configuration files.)
B.8.2.24.1 LIMS Input File Format
The format of the LIMS Input File is Comma-Separated Values (CSV) with a variable
number of parameters up to a maximum of twelve for the List and Field types described
below. The Link field types do not count against the number of parameters allowed. The
header consists of the first four records which define the parameters and their use as
follows:
1) Record 1: Parameter Name – Any descriptive name is valid.
2) Record 2: Parameter Type – Valid entries are:
a. “List”: All unique data for this field will be displayed in the Custom Sample Data
section of the GVSampleDataSC program in a dropdown list box. List
parameter types should be listed as the first set of parameters in the file,
and the order in the file dictates the dropdown field order as well. The
content of subsequent fields is limited to those records containing all of
the previous dropdown list selections. It is critical to ensure that the full
combination of all List fields results in a unique records within this file.
b. “Field”: The associated data will be displayed in standard text fields. When List
parameters are implemented, the content of the Field parameters is
based on the unique record defined by the selection of all List items.
c. “Link”: The data will be updated in the respective field in the Analysis Data
section of GVSampleDataSC. Similar to the Field parameters, the
Linked parameters are determined by the unique combination of
parameters in the List fields. When no data is specified for a linked field
the associated field will be cleared and require manual entry by the
analyst. An appropriate Analysis Method must be selected before
selecting the LIMS data or some parameters may be ignored. For
example, data specified for FLOWRATE will be ignored if the Analysis
Method does not implement the flow rate calculation. The following Link
field codes are available to update the respective fields in the Analysis
Data section:
i.
SAMPLEDESCRIPTION
ii.
SAMPLECOMMENT
iii.
COLLECTIONSTART
iv.
COLLECTIONSTOP
Page B45 of B77
v.
SAMPLETYPE
vi.
GEOMETRY
vii.
LIBRARY
viii.
SAMPLEQUANTITY
ix.
SAMPLEQUANTITYUNITS
x.
DILUTIONFACTOR
xi.
COLLECTIONEFFICIENCY
xii.
ACTIVITYUNITS
xiii.
COUNTTIME
xiv.
FLOWRATE
xv.
FLOWRATEUNITS
3) Record 3: Field Label – The label as displayed on the program interface.
4) Record 4: Parameter Name – The Parameter Name must match a name defined in the
Sample Administration Configuration Custom Fields. The data associated with these
parameters is written to the Custom Data file for each sample as described in Section
B.8.1.1 Step #4 so that the data can be stored in the Global Value database and
reported as required. The parameter name is not required for Linked fields because the
associated data is stored with the Analysis Data parameters.
B.8.2.24.2 LIMS Input File Examples
The following examples demonstrate how the LIMS Input file can be configured for different
applications. The file content is shown in the Microsoft Excel interface for clarity.
1) Simple field for user entry:
This example demonstrates a single custom parameter field that allows the analyst to
enter the applicable data. Since there aren’t any List type parameters, the displayed
field will be blank even if data is provided after the fourth record.
Figure B.8.2.24.2.2 Custom Data for Single parameter data
Figure B.8.2.24.2.1 Simple
LIMS Input File Content
Page B46 of B77
2) Complex LIMS Data:
This example demonstrates a more robust integration with the file content generated by
a LIMS. The first two parameters define the unique records, the second two are fields
populated with the specified data, and the last three are linked to Analysis Data fields to
update the respective parameters when a unique record is selected.
Note that the List fields display only the unique data for that parameter list as shown
below. When selections are made in the List fields the Field parameters and Linked
parameters are updated accordingly.
Figure B.8.2.24.2.3 Complex LIMS Input File Content
Figure B.8.2.24.2.4 Custom Data Display List Fields limited to unique data
Figure B.8.2.24.2.5 Custom Data fields populated based on List Field selections
Page B47 of B77
B.8.2.25 |GVSampleDataSC_EditableLIMSData|
This flag is set to either “T” (true) or “F” (false) to enable or disable editing of LIMS Data.
When set to “T”, the “FIELD” parameters can be edited after selections have been made in
the “LIST” parameter dropdown boxes. When set to “F”, the “FIELD” parameters are
disabled to ensure that the data stored in the LIMS Input File is used for the sample
analysis. (See Section B.8.2.24 for LIMS File field types.)
Example:
|GVSampleDataSC_EditableLIMSData|=T
B.8.2.26 |GVSampleDataSC_EditableCollectionEfficiency|
This flag is set to either “T” (true) or “F” (false) to enable or disable editing of the Collection
Efficiency field when it is displayed.
Example:
|GVSampleDataSC_EditableCollectionEfficiency|=T
B.8.2.27 |GVSampleDataSC_HideLiveTimePreset|
This flag is set to either “T” (true) or “F” (false) to display or hide the Live Time preset field.
When displayed a valid number (seconds) greater than zero is required.
This flag has no affect in reanalysis mode. In this condition the Live Time preset field is
hidden because it is not used.
Example:
|GVSampleDataSC_HideLiveTimePreset|=F
B.8.2.28 |GVSampleDataSC_ContinueCommand|
This parameter specifies the default functions to be run in the helper Job when the program
is closed by selecting the “Continue” button. This parameter is ignored if a Continue
Command has been specified for the last sample in the queue (or the only sample when
using Single sample mode). See Section B.8.2.4.21 for details related to the use of the
Continue Command.
Note that the Continue Command is not followed by the equal sign (“=”) in this context, but it
is required when specified in the Analysis Methods.
Example:
|GVSampleDataSC_ContinueCommand|=|Run_GVAskConfirm|
where |Run_GVAskConfirm| is defined in the Quick Start Configuration file. (See Section
A.1 for more details regarding the Quick Start configuration files.)
Page B48 of B77
B.8.3 GVSampleDataSC Output Configuration File
As described in Section B.8.1.1 Step #2, an automation Job is created for each sample in the
queue when the Continue button is selected. This process is similar to that described for the
GVTemplateMaster in Section B.32 which requires a Configuration File and a Job Template.
The Job Template was described in Sections B.8.2.11, B.8.2.18, and B.8.2.19 for Samples, QA
Peaks and QA Background respectively. The Configuration File content is the subject of this
section.
The Configuration File consists of a series of parameters generated by GVSampleDataSC
followed by the entire content of the configuration file passed to this program on the command
line. Additionally, when the Analysis Method is “QA Peaks” or “QA Background” the content of
the QA Peak or QA Background Configuration file (See Sections B.8.2.20 and B.8.2.21
respectively) is added to the beginning of the file content.
Since the configuration file passed to the program is typically a copy of the configuration file
generated by Quick Start, it should include all of the parameters normally expected in Job
Templates when combined with those added by GVSampleDataSC. The output configuration
file is generated in the same directory as the application with a name of GVSampleDataSC.cfg
for acquisition processes or GVSampleDataSCReanalysis.cfg for reanalysis processes. It is
overwritten for each sample prior to use in creating automation Jobs.
The parameters generated by GVSampleDataSC for samples are as follows:
B.8.3.1
|GVSampleDataSCOut_COUNTPOSITION|
Position within the Sample Queue list.
B.8.3.2
|GVSampleDataSCOut_SAMPLEPOSITION|
Position within the Sample Queue list. (Same as COUNTPOSITION.)
B.8.3.3
|GVSampleDataSCOut_NEXTPOSITION|
Next position in the Sample Queue list (i.e. COUNTPOSITION + 1).
B.8.3.4
|GVSampleDataSCOut_NEXTJOB|
This parameter is used to allow automation Jobs for each sample position to link to the next
Job. The parameter is set to the “Call” Job command followed by the Job File Path with the
NEXTPOSITION value appended. The following is an example of the content for the first of
two samples in the queue:
|GVSampleDataSCOut_NextJob|=Call "C:\User\GVCR\Temp\3_SampleDataSC2.job"
When this parameter is used as the last step in the Job Templates, the automation Job for
the first sample would automatically call the automation Job for the next sample.
This parameter is set equal to nothing for the last sample in the queue so that the
automation Job process returns to the main automation Job where the QUIT command is
normally set to close GammaVision upon completion of the counting processes.
Page B49 of B77
B.8.3.5
|GVSampleDataSCOut_LISTINDEX|
Position within the Sample Queue list buffered to two places (i.e. 01)
B.8.3.6
|GVSampleDataSCOut_SPECTRUMNAME|
This parameter provides a standard spectrum file naming convention as follows:
(Note: Other methods for defining spectrum file names can be used in lieu of this option.
For example, in some applications it is useful to include some of the other
GVSampleDataSCOut parameters including the Analysis Method or one of the parameters
specified from the LIMS integration in combination with the Date parameters generated by
Quick Start and the |GVSampleDataSCOut_LISTINDEX| parameter from Section B.8.3.5.)
1) When a single sample is counted the spectrum name consists of the Detector Spectrum
Prefix (See Section B.8.2.3) followed by the Start Date Year, Start Date Month, Start
Date Day, and Daily Spectrum counter. These are the same parameters generated by
Quick Start when an automation Job is initiated. (See Section A.1).
Example:
|GVSampleDataSCOut_SPECTRUMNAME|=
3_|STARTDATE_YEAR|-|STARTDATE_MONTH|-|STARTDATE_DAY|_|DAYSPECTRUMCOUNTERBUFFERED3|
2) When multiple samples are counted the same spectrum naming convention is used with
the sample queue position appended.
Example:
|GVSampleDataSCOut_SPECTRUMNAME|=
3_|STARTDATE_YEAR|-|STARTDATE_MONTH|-|STARTDATE_DAY|_|DAYSPECTRUMCOUNTERBUFFERED3|01
3) When a spectrum is reanalyzed this parameter is set to the original spectrum file name.
B.8.3.7
|GVSampleDataSCOut_DETECTORFILEPREFIX|
Detector Spectrum File Prefix (See Section B.8.2.3)
B.8.3.8
|GVSampleDataSCOut_DESCRIPTION|
Sample Description as entered for the sample.
B.8.3.9
|GVSampleDataSCOut_ANALYSISQUANTITY|
Analysis Quantity specified for the sample (formatted as 0.00000E+00).
B.8.3.10 |GVSampleDataSCOut_QUANTITYUNITS|
Analysis Quantity units specified for the sample.
Page B50 of B77
B.8.3.11 |GVSampleDataSCOut_COLLSTARTDATETIME|
Sample Collection Start Date and Time.
B.8.3.12 |GVSampleDataSCOut_COLLSTOPTDATETIME|
Sample Collection Stop Date and Time.
B.8.3.13 |GVSampleDataSCOut_DECAYDATETIME|
Same as Sample Collection Stop Date and Time.
B.8.3.14 |GVSampleDataSCOut_EFFICIENCYFILEPATH|
Full path to the Efficiency Calibration file. This parameter consists of the Calibration
Directory (See Section B.8.2.6), Detector Spectrum Prefix (See Section B.8.2.3), Geometry
name selected for the sample, and the “.clb” file extension.
Example:
|GVSampleDataSCOut_EFFICIENCYFILEPATH|=C:\User\Cal\3_250mlVial.clb
B.8.3.15 |GVSampleDataSCOut_LIBRARYFILEPATH|
Full path to the Library file. This parameter consists of the Library Directory (See Section
B.8.2.7), Library name selected for the sample, and the “.lib” file extension.
Example:
|GVSampleDataSCOut_LIBRARYFILEPATH|=C:\User\Lib\Environmental.lib
Page B51 of B77
B.8.3.16 |GVSampleDataSCOut_CUSTOMDATAFILEPATH|
Full path to the Custom Data File path described in Section B.8.1.1 Step #4. The file name
for each sample is the same as the Job File Path parameter (See Section B.8.2.5) with
“_CustomData” and the Sample Queue position appended.
Example:
|GVSampleDataSCOut_CUSTOMDATAFILEPATH|=C:\User\GVCR\Temp\3_SampleDataSC_CustomData1.txt
This file contains the custom data parameters and associated data for each sample. Each
of these parameters must be defined in the Sample Administration Configuration Custom
Fields. The following shows the content of this file. Data for each sample would be
specified for each parameter. All of the fields in the Custom data section (LIMS Input) would
follow these fixed parameters:
DisplayForm = No
ShowSavedData = No
AnalysisMethod =
DilutionFactor =
SampleQuantity =
SampleComment =
SampleFlowrate =
FlowrateUnits =
CollectionEfficiency =
B.8.3.17 |GVSampleDataSCOut_SDFDATAFILEPATH|
Full path to the SDF Data File described in Section B.8.1.1 Step #3. The file name for each
sample is the same as the Job File Path parameter (See Section B.8.2.5) with “_SDFData”
and the Sample Queue position appended.
Example:
|GVSampleDataSCOut_SDFDATAFILEPATH|=C:\User\GVCR\Temp\3_SampleDataSC_SDFData1.txt
This file contains the parameters that will be passed to the SDF file used for analysis using
the GVSDFData program (See Section B.9) during the automation processes. This file
content is as follows:
LiveTime: (as specified for Live Time preset)
Weight: (Analysis quantity from Sample Data)
ActivityUnits: (Activity Units from Sample Data)
QuantityUnits: (Analysis Quantity from Sample Data)
Divisor: 1 (Activity Units Conversion Factor)
DecayDateTime: (Sample collection Stop Date and Time)
CollectionStart: (Sample collection Start Date and Time)
CollectionEnd: (Sample collection Stop Date and Time)
ReportFileName: (Path specified for DetRptDir (See Section B.8.2.8) with “*” appended.
Page B52 of B77
B.8.3.18 |GVSampleDataSCOut_SAMPLETYPE|
Sample Type selected as selected.
B.8.3.19 |GVSampleDataSCOut_REPORTTEMPLATE|
The Report Template specified for the selected analysis method or the default template if
none is specified for the analysis method.
B.8.3.20 |GVSampleDataSCOut_AnalysisMethod|
The Analysis Method specified for the sample.
B.8.3.21 |GVSampleDataSCOut_DilutionFactor|
The Dilution Factor specified for the sample.
B.8.3.22 |GVSampleDataSCOut_SampleQuantity|
The Sample Quantity specified for the sample.
B.8.3.23 |GVSampleDataSCOut_SampleComment|
The Sample Comment specified for the sample.
B.8.3.24 |GVSampleDataSCOut_SampleFlowrate|
The Sample Flowrate specified for the sample.
B.8.3.25 |GVSampleDataSCOut_SampleFlowrateUnits|
The Sample Flowrate Units specified for the sample.
B.8.3.26 |GVSampleDataSCOut_CollectionEfficiency|
The Collection Efficiency specified for the sample.
B.8.3.27 Other GVSampleDataSCOut parameters:
A parameter is generated for each of the Custom Data parameters specified for the sample
in the format |GVSampleDataSCOut_CustomDataParameterName| where
CustomDataParameterName is the name of the parameter as specified in the fourth record
of the LIMS Input file. For the Custom Data shown in Figure B.8.2.24.2.5 the following
parameters would be generated:
|GVSampleDataSCOut_BatchID|=B-12345
|GVSampleDataSCOut_ProjectID|=Project B
|GVSampleDataSCOut_AnalysisID|=AN-234
|GVSampleDataSCOut_Matrix|=Liquid
Page B53 of B77
B.9
GVSDFData
This program is used to modify Sample Definition File (SDF) fields with analysis information
stored in a simple text file. This text file is very easy to generate with a custom application as
compared to writing the data directly to the binary SDF structure. A static set of parameters can
also be set in this text file to meet the needs for some implementations. This program is more
efficient than the GVSetSDFParameter program (See Section B.10) when multiple parameters
must be written to the file.
After updating the SDF file with GVSDFData the SDF file must be recalled in GammaVision to
be used for the spectrum analysis.
GVSDFData has the following comma-delimited command line parameters:
1) Full Path to SDF file (required): This file should be unique to the detector so that Jobs
running on other systems will not inadvertently modify this file prior to being loaded into
GammaVision.
2) Full Path to SDF Data file (required): This text file contains the parameters and associated
data to write to the SDF file. The file content is as follows:
Each line of the SDF Data file should contain the Parameter, a Colon, and the Parameter
Value. The following list includes all parameters that can be modified by this program:
CollectionStart
CollectionEnd
DecayDateTime
LiveTime
RealTime
Weight
Multiplier
Divisor
ActivityUnits
QuantityUnits
ReportFileName
LibFileName
CalFileName
PBCFileName
SystematicError
RandomError
ABSConfigID
ABSLength
ABSTypeID
ABSFileName
RandomSummingFactor
Notes:
1) The parameters may be in any order and only those to update are required.
2) Parameters not matching those listed above exactly are ignored.
3) Date/Time parameters may be any standard date/time format.
4) ActivityUnits and QuantityUnits are limited to 6 characters.
5) ReportFileName is limited to 255 characters.
6) LiveTime and RealTime are Long Integers
7) Changes to ActivityUnits and QuantityUnits will require appropriate adjustments in the
Multiplier and Divisor since the standard activity units in GammaVision are “uCi” or “Bq” as
set in the Sample Defaults File.
8) ABSLength is the Absorber length.
9) ABSConfigID is either Linear (0) or Mass (positive number). An empty space is equivalent
to zero; therefore, a negative value is required for no change.
10) ABSTypeID is either External (0) or Internal (positive number). An empty space is
equivalent to zero; therefore, a negative value is required for no change.
11) ABSFileName is the full path to an Attenuation file. If a path is specified, then the “Internal”
attenuation option is automatically turned off.
Page B54 of B77
B.10 GVSetSDFParameter
This program is used to update a single field in a Sample Definition File (SDF) with the specified
data as described below. This process simplifies implementation for some applications, but the
GVSDFData program (See Section B.9) is more efficient when many parameters must be
updated.
GVSetSDFParameter has the following comma-delimited command line parameters:
1) Full Path to SDF file (required): This file should be unique to the detector so that Jobs
running on other systems will not inadvertently modify this file prior to being loaded into
GammaVision.
2) SDF Parameter Name (required): Any of the parameters described for GVSDFData (See
Section B.9) may be specified.
3) Parameter Value (required): If an invalid data type is specified then no changes are written
to the SDF file.
B.11 GVAskConfirm
This application replaces the standard ASK_CONFIRM job command in GammaVision by
prompting for user response with a message.
Figure B.11.1 GVAskConfirm Prompt
GVAskConfirm has the following comma-delimited command line parameters:
1) Full Path to Job File (required): The content of a helper Job is created by the application to
provide additional functionality within the GammaVision environment. The main Job is
normally configured to run this helper Job immediately after the application closes. The file
content is as follows:
a. If “OK” is selected the file is empty as no further processing is necessary.
b. If “Cancel” is selected, the file contains the QUIT command to terminate the Job and
close GammaVision immediately.
2) Message (required): Prompt for user response formed as a question where the Yes/No
answer is expected to perform the actions described above. Pipe characters (“|”) may be
used for force a new line in the message.
Page B55 of B77
B.12 GVGetConfiguration
This program prompts the user for a Geometry and Library to use for analysis.
Figure B.12.1 GVGetConfiguration Prompt
GVGetConfiguration has the following comma-delimited command line parameters:
1) Full Path to Job File (required): The content of a helper Job is created by the application to
provide additional functionality within the GammaVision environment. The main Job is
normally configured to run this helper Job immediately after the application closes. The file
content is as follows:
a. If “OK” is selected the file contains commands to load the efficiency calibration and
library files as follows.
Recall_Efficiency “CALFILE PATH”
Load_Library “LIBFILE PATH”
Where:
CALFILEPATH = Calibration File Directory & File Prefix & Geometry & .clb
LIBFILEPATH = Library File Directory & Library & .lib
Each of the file path parameters are specified as command line parameters.
b. If “Cancel” is selected, the file contains the QUIT command to terminate the Job and
close GammaVision immediately.
2) File Prefix (required): The Geometry list is populated with Calibration Files starting with the
File Prefix in the Calibration File directory (without the file prefix or extension). This
parameter is also used to generate the Calibration File Path as described in the first
command line parameter. In order for this application to work properly the calibration files
should use the Detector File Prefix as configured on the Detectors tab in Sample
Administration Configuration.
3) Calibration File Directory (required): The Geometry list is populated with Calibration Files
starting with the File Prefix in the Calibration File directory (without the file prefix or
extension). This parameter is also used to generate the Calibration File Path as described
in the first command line parameter. The directory must terminate with the “\” character.
4) Library File Directory (required): The Library list is populated with Library Files in the Library
File directory (without the file extension). This parameter is also used to generate the
Library File Path as described in the first command line parameter. The directory must
terminate with the “\” character.
5) Default Geometry (optional): The Geometry is a calibration file name without the File Prefix
and extension. If the specified geometry matches an item in the geometry list, then that item
is selected by default. If no match is available then no items are selected. This parameter
is also used to generate the Calibration File Path as described in the first command line
parameter.
Page B56 of B77
6) Default Library (optional): The Library is a file name without the file extension. If the
specified library matches an item in the library list, then that item is selected by default. If no
match is available then no items are selected. This parameter is also used to generate the
Library File Path as described in the first command line parameter.
7) Re-Analysis Flag (optional): If set to “T” (true), then the Geometry and Library list items are
set to those used in the previous analysis stored in the Global Value database. If the files
are no longer available in the specified directories then no item will be selected in the
respective list.
8) Re-Analysis Data File (optional): If the Re-Analysis Flag (parameter #7) is set to “T” (true),
this file is read to determine which Calibration and Library files were used in the previous
analysis. The re-analysis data file must be generated by the GVRecallSpectrum program
(section B.3) or a custom developed application capable of creating the same content.
B.13 GV_GetRType
This program sets the Sample and Record Type for the
sample. The Sample Type relates a meaningful description
to a document control code (R-Type or Record Type) that
may be less meaningful to the analyst. See Section A.2.3.3
for Sample Type and R-Type configuration.
GV_GetRType has the following comma-delimited command
line parameters:
1) Full Path to Detector (Samples) Database (required): The
database path is defined on the Detectors tab in Sample
Administration Configuration for each detector.
Figure B.13.1 GV_GetRType Prompt
2) Sample Type (optional): If a valid Sample Type is specified, then the R-Type is
automatically set based on the configuration established in Sample Administration
Configuration on the Sample Types tab. If this parameter is omitted the dialog shown in
Figure B.13.1 is displayed to allow the analyst to select the appropriate Sample Type. In
addition to the pre-defined Sample Types displayed in the list the analyst may also enter any
other Sample Types by typing in the dropdown field.
3) Re-Analysis Flag (optional): If set to “T” (true), then the Sample Type from the previous
analysis is used as the default. If a Sample Type was previously specified then the prompt
is not displayed. If a Sample Type was not previously specified then the prompt is displayed
requiring analyst input.
4) Full Path to Job File (required): The content of a helper Job is created by the application to
provide additional functionality within the GammaVision environment. The main Job is
normally configured to run this helper Job immediately after the application closes. The file
content is as follows:
a. If “OK” is selected the file is empty so the automation process is unaffected.
b. If “Cancel” is selected, the file contains the QUIT command to terminate the Job and
close GammaVision immediately.
Page B57 of B77
B.14 GV_GetSiteUnit
This program sets the Site Unit for the sample.
GV_GetSiteUnit has the following comma-delimited
command line parameters:
1) Full Path to Detector (Samples) Database (required):
The database path is defined on the Detectors tab in
Sample Administration Configuration for each detector.
Figure B.14.1 GV_GetSiteUnit Prompt
2) Site Unit (optional): Any text may be specified for the site unit. If this parameter is omitted
the dialog shown in Figure B.14.1is displayed to allow the analyst to select from a predefined list or manually type the unit name. If a Site Unit is specified then the dialog is not
displayed.
3) Re-Analysis Flag (optional): If set to “T” (true), then the Site Unit from the previous analysis
is used as the default. The prompt is always displayed for reanalysis mode.
4) Full Path to Job File (required): The content of a helper Job is created by the application to
provide additional functionality within the GammaVision environment. The main Job is
normally configured to run this helper Job immediately after the application closes. The file
content is as follows:
a. If “OK” is selected the file is empty so the automation process is unaffected.
b. If “Cancel” is selected, the file contains the QUIT command to terminate the Job and
close GammaVision immediately.
B.15 GV_GetBatch
This program sets the Batch Description for the sample.
GV_GetBatch has the following comma-delimited command
line parameters:
1) Full Path to Detector (Samples) Database (required): The
database path is defined on the Detectors tab in Sample
Administration Configuration for each detector.
Figure B.15.1 GV_GetBatch Prompt
2) Batch Description (optional): Any text may be specified for
the batch description. If this parameter is omitted the dialog shown in Figure B.15.1is
displayed to allow the analyst to enter the Batch identifier. If a Batch Description is specified
then the dialog is not displayed.
3) Re-Analysis Flag (optional): If set to “T” (true), then the Batch from the previous analysis is
used as the default. The prompt is always displayed for reanalysis mode.
4) Full Path to Job File (required): The content of a helper Job is created by the application to
provide additional functionality within the GammaVision environment. The main Job is
normally configured to run this helper Job immediately after the application closes. The file
content is as follows:
a. If “OK” is selected the file is empty so the automation process is unaffected.
b. If “Cancel” is selected, the file contains the QUIT command to terminate the Job
and close GammaVision immediately.
Page B58 of B77
B.16 GV_GetComment
This program prompts the analyst for comments associated
with the sample. The display shown in Figure B.16.1 is
displayed under all conditions. Comments may be entered
as free-form text with line breaks similar to any text editor;
however, the TAB character cannot be used.
GV_GetComment has the following comma-delimited
command line parameters:
1) Full Path to Detector (Samples) Database (required):
The database path is defined on the Detectors tab in
Sample Administration Configuration for each
detector.
Figure B.16.1 GV_GetComment Prompt
2) Pre-defined Comments (optional): The pre-defined comments provide a method of
generating a custom prompt for specific comments. The analyst is not required to add
additional comments and is allowed to change the pre-defined text if desired. Line breaks
can be forced in the Pre-defined comments by using the pipe character (“|”). For example, a
pre-defined comment of “Name:|Company:” would show “Name:” and “Company:” on
separate lines. The pre-defined comments are ignored in re-analysis mode.
3) Re-Analysis Flag (optional): If set to “T” (true), then the Comments from the previous
analysis are used as the default.
4) Full Path to Job File (required): The content of a helper Job is created by the application to
provide additional functionality within the GammaVision environment. The main Job is
normally configured to run this helper Job immediately after the application closes. The file
content is as follows:
a. If “OK” is selected the file is empty so the automation process is unaffected.
b. If “Cancel” is selected, the file contains the QUIT command to terminate the Job
and close GammaVision immediately.
B.17 GV_GetGDTPressure
This program sets the Gas Decay Tank pressure for the
sample. This parameter is normally used to calculate
Total Equivalent Xenon activity. A default entry can be
specified in Sample Administration Configuration on the
Misc tab.
GV_GetGDTPressure has the following commadelimited command line parameters:
1) Full Path to Detector (Samples) Database (required): Figure B.17.1 GV_GetGDTPressure Prompt
The database path is defined on the Detectors tab in
Sample Administration Configuration for each detector.
2) Re-Analysis Flag (optional): If set to “T” (true), then the GDT pressure from the previous
analysis is used as the default.
3) Full Path to Job File (required): The content of a helper Job is created by the application to
provide additional functionality within the GammaVision environment. The main Job is
normally configured to run this helper Job immediately after the application closes. The file
content is as follows:
a. If “OK” is selected the file is empty so the automation process is unaffected.
b. If “Cancel” is selected, the file contains the QUIT command to terminate the Job
and close GammaVision immediately.
Page B59 of B77
B.18 GV_GetSamplePump
This program sets the Sample Pump Identification for the
sample. A default entry can be specified in Sample
Administration Configuration on the Misc tab.
GV_GetSamplePump has the following comma-delimited
command line parameters:
1) Full Path to Detector (Samples) Database (required):
The database path is defined on the Detectors tab in
Sample Administration Configuration for each
detector.
Figure B.18.1 GV_GetSamplePump Prompt
2) Re-Analysis Flag (optional): If set to “T” (true), then the Sample Pump ID from the previous
analysis is used as the default.
3) Full Path to Job File (required): The content of a helper Job is created by the application to
provide additional functionality within the GammaVision environment. The main Job is
normally configured to run this helper Job immediately after the application closes. The file
content is as follows:
a. If “OK” is selected the file is empty so the automation process is unaffected.
b. If “Cancel” is selected, the file contains the QUIT command to terminate the Job
and close GammaVision immediately.
B.19 GV_GetRWP
This program sets the Radiation Work Permits for the
sample. The default prefix can be specified in Sample
Administration Configuration on the Misc tab. Several
RWPs may be entered using the Add button, and
existing RWPs may be removed using the Remove
button.
GV_GetRWP has the following comma-delimited
command line parameters:
1) Full Path to Detector (Samples) Database (required):
The database path is defined on the Detectors tab in
Sample Administration Configuration for each
detector.
Figure B.19.1 GV_GetRWP Prompt
2) Re-Analysis Flag (optional): If set to “T” (true), then the RWPs from the previous analysis
are used as the default.
3) Full Path to Job File (required): The content of a helper Job is created by the application to
provide additional functionality within the GammaVision environment. The main Job is
normally configured to run this helper Job immediately after the application closes. The file
content is as follows:
a. If “OK” is selected the file is empty so the automation process is unaffected.
b. If “Cancel” is selected, the file contains the QUIT command to terminate the Job
and close GammaVision immediately.
Page B60 of B77
B.20 GV_GetRadMon
This program sets the Radiation Monitor Readings for the
sample. The monitor list is established in Sample
Administration Configuration on the Misc tab. Ad hoc
monitor names may also be manually entered. Several
monitor readings may be entered using the Add button,
and existing entries may be removed using the Remove
button. All monitor readings must be numeric.
GV_GetRadMon has the following comma-delimited
command line parameters:
1) Full Path to Detector (Samples) Database (required):
The database path is defined on the Detectors tab in
Sample Administration Configuration for each detector.
Figure B.20.1 GV_GetRadMon Prompt
2) Re-Analysis Flag (optional): If set to “T” (true), then the monitor readings from the previous
analysis are used as the default.
3) Full Path to Job File (required): The content of a helper Job is created by the application to
provide additional functionality within the GammaVision environment. The main Job is
normally configured to run this helper Job immediately after the application closes. The file
content is as follows:
a. If “OK” is selected the file is empty so the automation process is unaffected.
b. If “Cancel” is selected, the file contains the QUIT command to terminate the Job
and close GammaVision immediately.
B.21 GV_GetCustomData
This program sets the Custom Data parameters for the sample. This data may be collected
using a prompt similar to Figure B.21.1 or by reading the data file passed to the program on the
command line. The option to display the prompt or not is specified in the data file as described
below.
Figure B.21.1 GV_GetCustomData Prompt
GV_GetCustomData has the following comma-delimited command line parameters:
1) Full Path to Detector (Samples) Database (required): The database path is defined on the
Detectors tab in Sample Administration Configuration for each detector.
2) Data Source File (optional): The data source file is an ASCII text file that determines if the
prompt shown in Figure B.21.1 will be displayed, or if the data will be stored directly in the
database. It also determines which parameters are used along with the associated data.
If this parameter is omitted, then all Custom Parameters defined in Global Value will be
displayed in the prompt with no default values specified. This configuration is rare.
The first two lines in Data Source file should have the parameters “DisplayForm” and
“ShowSavedData” followed by either “Yes” or “No” (anything other than “Yes” equals “No”).
Page B61 of B77
If “DisplayForm” is set to “Yes”, then a prompt similar to Figure B.21.1 will be displayed. If
“DisplayForm” is set to “No” then the data parameters specified in the file are stored in the
database without the prompt.
If “ShowSavedData” is set to “Yes” then the custom data currently stored for each parameter
will be used as the default. Any parameters set to default values within the Data Source file
are ignored. If “ShowSavedData” is set to “No” then the parameter data stored in the Data
Source files is used as the default. This parameter should be set to “Yes” for reanalysis
processes. It should be set to “No” for other processes that may require default parameters
to be defined within the Data Source file.
Following the “DisplayForm” and “ShowSavedData” parameters the names of any Custom
Parameters established in Sample Administration Configuration on the Custom Fields tab
can be listed along with default values. When using a Data Source file, the list of Custom
Parameter displayed in the prompt will be limited to those specified in this list. This allows
the analyst to be prompted for only the specific custom parameters necessary for a
particular type of sample.
The following example shows the file content required to prompt for the parameters shown
in Figure B.21.1 with default data:
DisplayForm = Yes
ShowSavedData = No
SampleNumber=12345
AnalysisMethod=RCS Liquid Isotopic
The following example shows the file content required to store data generated by another
application directly in the database:
DisplayForm = No
ShowSavedData = No
SampleFlowRate=2
SampleFlowUnits=scfm
3) Append Custom Data Flag (required): When this flag is set to “T” (true) the custom data is
appended to any existing custom data parameters for the specified sample. When set to “F”
(false) then all custom data associated with the specified sample is deleted prior to saving
the current parameters. This flag is normally set to “T” (true).
4) Re-Analysis Flag (optional): If set to “T” (true) and the “ShowSavedData” parameter is set to
“Yes” the custom data from the previous analysis is used as the default.
5) Full Path to Job File (required): The content of a helper Job is created by the application to
provide additional functionality within the GammaVision environment. The main Job is
normally configured to run this helper Job immediately after the application closes. The file
content is as follows:
a. If “OK” is selected the file is empty so the automation process is unaffected.
b. If “Cancel” is selected, the file contains the QUIT command to terminate the Job
and close GammaVision immediately.
Page B62 of B77
B.22 GV_GetRptData
This program loads the analysis data from the most recent GammaVision analysis results for
the specified detector. The criteria for determining the most recent analysis result is determined
by the detector specific analysis report file (RPT extension) in the GammaVision Analysis
directory. The detector specific directory and file prefix is specified on the Detectors tab in
Sample Administration Configuration. Once the correct analysis result is identified the results
are retrieved from a combination of the analysis report, UFO file, and spectrum file. In addition
to the specific analysis parameters, a complete image of the analysis report (without the
signature lines) is also stored in the detector specific database.
When making a new measurement, data that is not directly required for the spectrum analysis is
stored in the database with a temporary spectrum ID. This includes the sample data collected
using any of the “GV_Get…” programs (i.e. GV_GetSiteUnit). The final spectrum ID is
determined as described above based on the most recent analysis results for the specified
detector. When the analysis results are stored, all of the temporary records are updated with
the final spectrum ID. This process requires GV_GetRptData to be called immediately after the
spectrum analysis, and the other “GV_Get…” programs to be called prior to the analysis. When
reanalyzing a spectrum, the spectrum ID is already known so the process of using a temporary
GV_GetRptData has the following comma-delimited command line parameters:
1) Full Path to Detector (Samples) Database (required): The database path is defined on the
Detectors tab in Sample Administration Configuration for each detector.
2) Analysis Number (optional): The analysis number can be set to one (1) or two (2). If any
other value is specified, it is treated as one (1). If the analysis number is set to one then any
previously stored analysis data for the most recent analysis associated with the specified
detector are deleted and the new results are saved. The Unidentified Peak list is also saved
from the first analysis of a spectrum.
If the analysis number is set to two then the results from a second analysis of the same
spectrum is saved to the database. The report image, calibration file name/dates, library file
name, PBC file name/date, analysis engine/version, and nuclide information are saved from
the second analysis. All other parameters are expected to be identical to the first analysis.
Duplicate nuclides are not allowed between the first and second analysis therefore different
libraries are required. This functionality is intended for Particulate/Charcoal air samples
analyzed from a single spectrum so that results from both analyses can be displayed on a
single report summary. For this application the library content is usually identical for both
analyses except for the nuclide flags. Nuclides flagged as “Activity Not in Total” are not
stored in the Global Value database, so this flag can be used to filter out nuclides that are
not of interest. For example, all of the particulate nuclides may have this flag set for the
iodine analysis, and the iodine nuclides have the flag set for the particulate analysis. The
primary reasons for using a consistent library structure are to avoid an extensive unidentified
peak list in either analysis, and to ensure that interference corrections are implemented
appropriately for complex analyses.
There are other applications aside from the Particulate/Charcoal air samples example that
can benefit from this configuration. For example, it could be used to determine the activity
for two different nuclides from the same peak which is often used as a conservative
measure for some applications. It can also be used to simplify the analysis of particular
nuclides by eliminating interferences in the second analysis library.
3) Omit Flag for Half-Life Cutoff (optional): If set to “T” (true), then nuclides reported as “> X
Halflives” in the decayed activity column are not transferred to the Global Value database. If
Page B63 of B77
this parameter is not set to “T” (true), then the nuclide data is stored with the default
decayed activity set to 9.999E+99 which is intended to flag the data is questionable.
4) Zero Flag for Half-Life Cutoff (optional): If set to “T” (true), then nuclides reported as “> X
Halflives” in the decayed activity column are transferred to the Global Value database with a
decayed activity of zero instead of the default value of 9.999E+99. This flag is ignored if the
Omit Flag for Half-Life Cutoff is not set to “T”.
5) Re-Analysis Flag (optional): If set to “T” (true), then the spectrum ID for retrieving analysis
results is based on the most recent selection in the GVRecallSpectrum program instead of
searching for the most recent analysis as described previously. As with all of the Job
programs that use the reanalysis flag, the GVRecallSpectrum program must be run at the
beginning of the automation process to ensure that the correct spectrum ID is used for the
reanalysis processes.
B.23 GVIncrementCounter
This program updates the Daily, Monthly, and Annual spectrum counters for the specified
detector database. Each time this program is run the counters are incremented by one.
The counter values are available as configuration parameters which are dynamically generated
by GVQuickStart. These parameters can be used in Job Templates and Configuration files to
generate spectrum file names from parts of the current date (day, month, and year) and the
associated sequential counter value.
Aside from the configuration file generated by GVQuickStart, the current counter values can
also be accessed using the GVINIParameter function from the Excel Add-In. See Appendix F
Function F4.
GVIncrementCounter has the following command line parameter:
1) Full Path to Detector (Samples) Database (required): The database path is defined on the
Detectors tab in Sample Administration Configuration for each detector.
B.24 GV_Custom_Rpt
This program generates the Custom Report
summary based on the Report Template
specified and analysis information stored in the
database. If the Report Template is not valid
then a prompt similar to that shown in Figure
B.24.1 is displayed for the analyst to select one
from the list.
Figure B.24.1 GV_Custom_Rpt Prompt
This summary report is stored in the database and can be viewed using the Sample
Administration Analysis Editor, Analysis Log, or using the print functions described in Section
B.25.
GV_Custom_Rpt has the following comma-delimited command line parameters:
1) Full Path to Detector (Samples) Database (required): The database path is defined on the
Detectors tab in Sample Administration Configuration for each detector.
2) Report Template name (optional): The template names are established in Sample
Administration Configuration on the Report Templates tab. If an invalid template name is
specified then the dialog shown in Figure B.24.1 is displayed to allow the analyst to select a
pre-defined template name.
Page B64 of B77
This program currently allows Report Template files with the .cus extension to be used for
backward compatibility. The file content must follow the same configuration rules as the
report templates defined in the database.
3) Re-Analysis Flag (optional): If set to “T” (true), then the spectrum ID used for generating the
report summary is based on the most recent selection in the GVRecallSpectrum program. If
set to “F” (false), then the spectrum ID used for generating the report summary is based on
the most recent analysis. See Section B.22 for more information regarding the spectrum ID
determination.
B.25 Print_Rpt
This program sends the report to a text or PDF File, Microsoft Word, or the default printer as
specified by the command line arguments. All of the same options for generating reports are
available from the Analysis Editor in the Sample Administration program.
Print_Rpt has the following comma-delimited command line parameters:
1) Full Path to Detector (Samples) Database (required): The database path is defined on the
Detectors tab in Sample Administration Configuration for each detector.
2) Report Filename: This parameter is no longer used and should be blank.
3) Report Type (optional): The following report types are acceptable:
CVR - Print only the report summary (Global Value Custom Report)
ALL - Print report summary and all detailed GammaVision analysis reports
Omitted – Print detailed GammaVision analysis reports without the report summary.
4) Report Destination (optional): Any of the following parameters are acceptable:
WORD – Displays report in Microsoft Word (requires MS Word to be installed)
PDF – Save report to a PDF file (required Directory – Item #6)
TXT – Save report to a Text file
Omitted – Print report on the default printer
5) Font Size (optional): If omitted the default size is 11 points. The maximum practical font
size is also 11 points to avoid formatting and table alignment issues on the standard
GammaVision analysis report. The minimum practical font size is 8 points.
6) File Directory (optional): This parameter specifies the directory PDF or Text reports. It is
ignored if the Report Destination is not set to PDF or TXT. If a path for PDF or Text reports
is not specified then the Custom Report Path specified in Sample Administration
Configuration on the Detectors tab for the applicable detector is used as the default. The file
name will always be the same as the Spectrum File name.
7) Re-Analysis Flag (optional): If set to “T” (true), then the spectrum ID used for generating the
report summary is based on the most recent selection in the GVRecallSpectrum program. If
set to “F” (false), then the spectrum ID used for generating the report summary is based on
the most recent analysis. See Section B.22 for more information regarding the spectrum ID
determination.
Page B65 of B77
B.26 GrossGamma
This program gets the Total Counts, Live Time, and Counts
per second from the specified Background and Sample
spectra, and calculates the difference in Total Counts and
Count rate. The data may be displayed in a prompt similar to
that shown in Figure B.26.1 or stored in an Excel Worksheet
as described below. When using the Excel interface, the
functionality offered by this application can also be
accomplished using the Excel Add-In which offers additional
capability. See Appendix F for more information regarding
the Excel Add-In.
Figure B.26.1 GrossGamma Prompt
GrossGamma has the following comma-delimited command line parameters:
1) Full path to background spectrum (required): Spectrum format must be Integer SPC.
2) Full path to sample spectrum (required): Spectrum format must be Integer SPC.
3) Excel File path (optional): If a file path to an Excel file is provided, then the content shown in
Figure B.26.1 is stored in the Excel file. The Excel Workbook must have a Worksheet
named “GlobalValue” where the data is stored starting with the first row and column as
shown in Figure B.26.2..
If a path is not provided, then a prompt
similar to that shown in Figure B.26.1 is
displayed. The parameters in the grid are
automatically copied to the clipboard when
selected to allow pasting the data into
another program.
Figure B.26.2 GrossGamma Excel
B.27 GVQAPeaks
This program collects the applicable QA information for spectrum peaks and generates the QA
report. Similar to the GV_GetRptData program (See Section B.22) the applicable data is read
from the most recent analysis results in the specified location.
The QA report content is determined by the configuration established in the QA Administration
program (See Section A.4.5) which specifies the report header, QA Points/Limits, and other
reporting options, such as whether the detailed GammaVision report is included with the QA
report.
GVQAPeaks has the following comma-delimited command line parameters:
1) Detector ID (required): This is the Detector number specified in the MCB Configuration
which is also the Detector ID specified in Sample Administration Configuration on the
Detectors tab.
2) Full Path to the QA Database (required): The QA database path is defined on the Detectors
tab in Sample Administration Configuration for each detector.
3) Report Destination (optional): Any of the following parameters are acceptable:
WORD – Displays report in MSWord
NONE – No report will be displayed or printed; however, the report is available
for review and printing using the QA Administration program.
Omit this parameter to print the report on the default printer
Page B66 of B77
B.28 GVQABackground
This program collects the applicable QA information for spectrum background and generates
the QA report. Similar to the GV_GetRptData program (See Section B.22) the applicable data
is read from the most recent analysis results in the specified location.
The QA report content is determined by the configuration established in the QA Administration
program (See Section A.4.5) which specifies the report header, QA Points/Limits, and other
reporting options, such as whether the detailed GammaVision report is included with the QA
report.
GVQABackground has the following comma-delimited command line parameters:
1) Detector ID (required): This is the Detector number specified in the MCB Configuration
which is also the Detector ID specified in Sample Administration Configuration on the
Detectors tab.
2) Full Path to the QA Database (required): The QA database path is defined on the Detectors
tab in Sample Administration Configuration for each detector.
3) Report Destination (optional): Any of the following parameters are acceptable:
WORD – Displays report in MSWord
NONE – No report will be displayed or printed; however, the report is available
for review and printing using the QA Administration program.
Omit this parameter to print the report on the default printer
B.29 GVQACheckStatus
This program checks the most recent QA Peak and Background results and displays a prompt
similar to that shown in Figure B.29.1 if any parameters were outside the specified limits. The
View QA Reports button can be selected to show the last QA Peak and Background reports.
This program would normally be called as one of the first few functions in an automated analysis
routine requiring spectrum acquisition.
Figure B.29.1 GVQACheckStatus Failure Notification
Page B67 of B77
GVQACheckStatus has the following comma-delimited command line parameters:
1) Detector ID (required): This is the Detector number specified in the MCB Configuration
which is also the Detector ID specified in Sample Administration Configuration on the
Detectors tab.
2) Full Path to the QA Database (required): The QA database path is defined on the Detectors
tab in Sample Administration Configuration for each detector.
3) Full Path to Job File (required): The content of a helper Job is created by the application to
provide additional functionality within the GammaVision environment. The main Job is
normally configured to run this helper Job immediately after the application closes. The file
content is as follows:
a. If “OK” is selected the file is empty so the automation process is unaffected.
b. If “Cancel” is selected, the file contains the QUIT command to terminate the Job
and close GammaVision immediately.
4) Allow Continue Flag (optional): If set to “T”, then the Continue Counting Sample button is
displayed on the warning prompt. The user can select this button to continue a sample
count even though a QA parameter failed. If this flag is set to “F” or omitted, then the user
has no choice but to abort the count if any parameter fails the QA check.
B.30 UfoToPbc
This program creates a Peak Background Correction (PBC) file using all of the Identified Peaks
stored in the specified UFO file. This function is similar to the CREATEPBC job command in
GammaVision except that the PBC file name can be named with the current date/time
automatically, and an automation Job with commands to load this PBC file is updated.
This program is typically run in the QA Background automation processes when long
background counts are measured.
UfoToPbc has the following comma-delimited command line parameters:
1) UFO File Path (required): Full path to the UFO file generated by the GammaVision analysis.
2) PBC File Path (required): Full path to the PBC file to be created. This path may use the
keyword “DATE” which will be replaced by the current date and time in the format "YYYYMM-DD_hhmm".
Example:
On June 22, 2012 16:49 C:\User\PBC\1_Date.pbc translates to
C:\User\PBC\1_2012-06-22_1649.pbc
3) JOB File Path (optional): If the full path to a JOB file is provided, then the contents will be
replaced with the text Load_PBC “PBCFileName” where PBCFileName is the PBC file path
specified as the second command line argument. This helper Job would normally be called
in the main analysis Jobs to set the default PBC file for analysis to the current file path.
Example:
Laod_PBC “C:\User\PBC\1_2012-06-22_1649.pbc”
Page B68 of B77
B.31 GVTemplateMaster
This program replaces user-defined parameters in a Template file with the parameter values
specified in a Configuration file and saves the merged data to a Result file. In general, the
Template file defines the process, and the Configuration file provides the details within that
process. This functionality is used by Quick Start to create dynamic Job files in the automation
process as described in Section A.1 and the GVSampleDataSC program described in Section
B.8. The GVTemplateMaster program allows this functionality to be implemented with other
custom applications.
GVTemplateMaster has the following comma-delimited command line parameters:
1) Template File Path (required): Full path to the file that defines the process.
2) Configuration File Path (required): Full path to the file that contains the parameter details.
3) Result File Path (required): Full path to the file that is generated when the Configuration
parameters are merged with the process Template. This file is overwritten if it exists.
Process Details:
The GVTemplateMaster starts by reading the Configuration file and saving the parameter list
and associated data. These parameters are similar to variables declared in a programming
language. These parameters are used in the Job Templates to allow the process to be
consistent for all measurements while details within that process are determined by the
parameter data specified.
Qualified parameter names are encased in pipes. The data assigned to the parameters can be
static text or other valid parameters defined within the same file.
Example:
Three parameters are defined as |Message|, |Name|, and |Greeting|. Data can be assigned
to these variables as follows:
|Name|=Mike
|Message|=Hello
|Greeting|=|Message| |Name|
The data stored with the |Greeting| parameter is interpreted as “Hello Mike”. If data for the
|Name| or |Message| parameters were not defined, then an error would occur.
When the Configuration file is read, all parameters that are followed immediately by the equal
sign (“=”) are stored with their associated data. Any matching parameters found in the
Template file are replaced with the data stored for that parameter, and the result is saved to the
Result file path specified.
There are two special parameters that are interpreted by the program and cannot be used to
store any other data.
1) |CrLf| - This parameter is automatically replaced with the “Carriage Return Line Feed”
character set to force a new line in the Result file.
2) |LINK| - This parameter should be followed by the full path to another Configuration file.
After the list of parameters defined in the current file is loaded the program will load any
parameters from the file path specified by the |LINK| parameter. This chain will continue
until the |LINK| parameter is not set to a valid file name. (NOTE: The full path specified
for the |LINK| parameter CANNOT contain any user-defined variables!)
Page B69 of B77
Implementation Example:
Template File Content
Configuration File Content
My Name is |MyName|.
My Department is |MyDepartment|.
My User ID is |MyID|.
|MyInfo|
|MyName|=JB Nimble
|MyDepartment|=Chemistry
|MyID|=2345
|MyInfo|=|MyName||CrLf||MyDepartment||CrLf||MyID|
The Result file generated by running the GVTemplateMaster program will be:
My Name is JB Nimble
My Department is Chemistry.
My User ID is 2345.
JB Nimble
Chemistry
2345
When reading Configuration files the data is stored for each parameter the first time the
parameter is found. If the parameter is set multiple times within the configuration file, then it is
ignored after the first instance. For example, if the following text was specified in a
Configuration file, then the value of |MyParameter| that gets returned in the Results file will be
“One”.
|MyParameter|=One
|MyParameter|=Two
This process allows standard parameters that may run external process to be overridden or
“turned off” by setting the parameter equal to nothing earlier in the configuration file. This
methodology is frequently employed in the automation Jobs initiated by Quick Start where
functions defined in the Global Configuration files are overridden in the Job Configuration file.
See Section A.1 for more detail related to the Quick Start program.
Parameter definitions are nearly limitless in terms of the number of parameters and naming
convention; however care should be taken to avoid using the same parameter within its own
data definition. For example, “|MyValue|=My value is |MyValue|” is a circular reference that
cannot be resolved. This condition will cause the program to fail without generating the Results
file.
B.32 GVCopyFile
This program makes a copy of any valid file. If the specified file to copy or the destination
directory does not exist, or the destination file name is not specified, then the program fails
without displaying any errors.
This program is typically used for copying a generic system file to a detector specific file name.
For example, Decay.sdf may be copied to 1_Decay.sdf during an automation process so that
changes can be made to the target file without affecting the source file or any automation
routines running on other detectors.
GVCopyFile has the following comma-delimited command line parameters:
1) Source File Path (required): Full path to Source file to be copied.
2) Destination File Path (required): Full path to Destination file to be created. The directory
where this file will be copied must exist or the copy process will fail.
Page B70 of B77
B.33 GVOpenFile
This program opens the file specified using the default program. This process is similar to
opening a file from Windows Explorer. This program is useful for opening files from applications
that may change installation path with different versions, such as Microsoft Excel or Word.
GVOpenFile has the following command line parameter:
1) Target File Path (required): Full path to File to be opened using the default program.
B.34 GV_ResetInputs
This program is included for backward compatibility for installations that use the legacy
reanalysis method. It is not used with the reanalysis configurations supplied with this release.
As described in Section B.22, the “non-analysis” parameters are usually saved with a temporary
spectrum ID during the spectrum acquisition phase. When the GV_GetRprtData program runs
these temporary spectrum IDs are updated to the actual spectrum ID. The old reanalysis
process operated in the same way as the spectrum acquisition process which required all of the
“non-analysis” parameters to be reset to the temporary spectrum ID, and the GV_ResetInputs
program accomplished this task. With this configuration it is not possible to perform acquisition
and reanalysis processes in parallel, and there is a risk of data loss if a reanalysis process is
canceled before completion. For these reasons, the new methodology is preferred, which
makes the GV_ResetInputs program obsolete.
GV_ResetInputs has the following comma-delimited command line parameters:
1) Full Path to Detector (Samples) Database (required): The database path is defined on the
Detectors tab in Sample Administration Configuration for each detector.
2) Spectrum ID. This parameter is normally set by the Job File variable “$(ShortBase)” when
recalling a spectrum for reanalysis.
B.35 GVSpectrumMux
This program provides a simple method for summing multiple spectra into a single spectrum.
This process is similar to a hardware signal multiplexer, but with much better performance and
additional options to meet various application needs. The options included with this program
include:
1) Summing multiple spectra data by channel or energy position with the option to also sum the
acquisition time.
2) Perform software Gain Adjustment based on a user-defined energy calibration.
3) Convert the Input Spectra to a different ADC Conversion Gain in the output spectrum.
These options can be implemented in an automated fashion by specifying a configuration file as
a command line argument to the program (See Section B.35.2) or using the standard User
Interface that allows various settings to be adjusted and spectra generated interactively.
GVSpectrumMux has the following comma-delimited command line parameters:
1) Configuration File Path: Full path to Configuration file formatted as described in Section
B.35.2. If a valid path is provided, then the output spectrum will be created automatically
based on the configuration file settings. If a valid file path is not specified, then the User
Interface described in Section B.35.1 is displayed for interactive spectrum multiplexing.
Page B71 of B77
B.35.1 GVSpectrumMux User Interface
The User Interface mode of operation is typically used to perform manual spectrum summing or
conversion operations as needed for special circumstances and generate configuration files that
can be used as a template in automation processes.
Figure B.35.1 GVSpectrumMux User Interface
As shown in Figure B.35.1, the GVSpectrumMux interface has two functional sections. The
upper section establishes the multiplexer processing options, and the lower section defines the
paths to the input spectra to process and the path to the output spectrum that will be generated.
After the Spectrum paths and Processing options are set select the “Process Spectra” button to
create the Output Spectrum.
Spectra are added and removed from the Input Spectra list using the buttons to the left of this
field. At least one Input spectrum is required. With a single spectrum input configuration the
multiplexer simply offers a simple way to convert an existing spectrum to a different number of
channels or normalize the “peak to channel” positions based on user-defined energy calibration
coefficients. This can be useful when evaluating spectra by Regions of Interest in applications
that define Regions of Interest by start and stop channel (vs start/stop energy) when gain shifts
are routinely corrected by energy recalibration in the software rather than actual gain
adjustments in the hardware. If the energy calibration is accurate then the manual energy
calibration parameters will effectively perform a software gain adjustment in the resulting
spectrum that should match the pre-defined Regions of Interest based on channel position.
Page B72 of B77
The processing options are as follows:
1) Multiplex Method
The Multiplex Method determines how the spectrum channel data will be summed with
the following options:
a. Raw Channel Data: This method sums the total counts for each channel from all
input spectra. This method is useful when peak positions for all spectra are well
matched, and either the Live Time is the same for all spectra or the Sum
Acquisition Time option is used.
b. Channel Count Rate: This method sums the Live Time corrected count rate for
each channel from all input spectra and then divides the total by the effective
Live Time to determine the final channel counts. This method is useful when
peak positions for all spectra are well matched, and the Live Times for input
spectra are not the same for all spectra.
c. Energy Count Rate: This method calculates the Live Time corrected channel
count rate for each spectrum based on the fractional energy range represented
by the input spectrum channel width to that of the channel width represented in
the output spectrum. The total channel count rate is then divided by the effective
Live Time to determine the final channel counts. This method is useful when the
Energy Calibration for each input spectrum is expected to be more accurate than
the actual peak positions by channel due to gain differences in individual
instruments. Live Time differences are also taken into account with this method.
Since each spectrum channel represents the number of events measured within
a specified energy range we can calculate the fractional counts from the Input
Spectrum channels to the relevant Output Spectrum channels as follows:
i. Determine if the input and output spectrum channels overlap based on their
minimum and maximum energy range meeting the following criteria:
OCMin < ICMax AND OCMax > ICMin
Where:
ICMin = Minimum Energy for the Input Spectrum Channel
ICMax = Maximum Energy for the Input Spectrum Channel
OCMin = Minimum Energy for the Output Spectrum Channel
OCMax = Maximum Energy for the Output Spectrum Channel
ii. If the energy range overlaps then determine the fraction of the Input channel
energy range that overlaps the output channel energy range as follows:
ICFMin = Higher of ICMin and OCMin
ICFMax = Lower of ICMax and OCMax
OCCountrate = ICCountrate * (ICFMax – ICFMin) / (ICMax - ICMin)
Where:
ICFMin = Minimum Energy for the Input Channel Fraction
ICFMax = Maximum Energy for the Input Channel Fraction
ICCountrate = Input Channel Countrate
OCCountrate = Output Channel Countrate
Page B73 of B77
iii. Sum all of the output channel countrate contributions from all applicable input
channels and then divide by the effective Live Time to determine the total
output spectrum channel counts.
The following example demonstrates how this method is applied when the input
and output are not perfectly matched by energy/gain. As shown in Figure B.35.2
there are two channels in the Input Spectrum (999 and 1000) that overlap the
applicable energy range for Channel 1000 in the Output Spectrum. For this
example assume that the Input and Output Spectrum Live Time is 100 seconds.
Input Spectrum Channel 999 count rate contribution =
1000/100 * (250.000 – 249.875) / (250.000 – 249.750) = 5.0 cps
Input Spectrum Channel 1000 count rate contribution =
500/100 * (250.125 – 250.000) / (250.25 – 250.000) = 2.5 cps
Total Input Spectrum count rate contribution = 5.0 + 2.5 = 7.5 cps
Output Spectrum Channel 1000 counts = 7.5 cps * 100 seconds = 750
Input Spectrum Data
500 Counts
5 cps
1000 Counts
10 cps
Channel 999
249.750 kev
250.000 kev
Channel 1000
250.25 kev
Output Spectrum Data
750 Counts
249.875 kev
2) Spectrum Template
Channel 1000
250.125 kev
Figure B.35.2 Sum by Energy Countrate Example
The Spectrum Template defines all of the spectrum parameters that are not modified by
the multiplexer program. The program loads this spectrum file as the starting point for
the output spectrum format and then modifies the channel data and ADC Conversion
Gain, Energy Calibration coefficients, and Live/Real Time parameters (as applicable).
The options for the Spectrum Output Template are:
a. First Spectrum in List: This option uses the first spectrum in the array of spectra
being summed as the output template.
b. User Defined: This option enables the Spectrum Template Path field and
requires a valid spectrum file path to be specified.
Page B74 of B77
3) ADC Conversion Gain
The ADC Conversion Gain (number of spectrum channels) in the output spectrum file
can be different from the input files. This option may be useful when there are few
spectrum counts in order to make spectrum peaks more obvious by converting 16,384
channel spectra to 8,192 or 4,096 channels. This option should be used in conjunction
with the “Energy Count Rate” Multiplex Method and an appropriate Energy calibration to
ensure that the full spectrum is converted. Also note that changes to the ADC
Conversion Gain should only go from a higher number channels in the Input spectra to
fewer channels in the Output spectrum to avoid spectrum distortion.
a. Use Template: This option uses the spectrum template file as described above to
determine the ADC Conversion Gain.
b. Static Settings: 128, 256, 512, 1024, 2048, 4096, 8192, 16384, 32768: These
options set the ADC Conversion Gain to the value specified.
4) Sum Acquisition Time
a. Enabled: This option emulates an extension of the acquisition time for a single
detector by summing the Real and Live time in addition to the spectrum data.
The Dead Time is calculated by the new Real and Live time values.
b. Disabled: This option emulates the concurrent acquisition from multiple detectors
at the same time such that the Live and Real time is normalized for the
measurement time based on the Multiplex Method and Spectrum Template
selected when the spectrum data is summed.
5) Energy Calibration
a. Use Template: The Energy Calibration in the Spectrum Template is used for the
Output Spectrum.
b. User Defined: The values specified for the Energy Calibration Intercept, Slope,
and Quadratic are used for the Output Spectrum energy calibration.
B.35.2 GVSpectrumMux Automation with Configuration Files
The GVSpectrumMux program can be run in a more automated mode by setting the specified
parameters in a configuration file and passing this file to the program as a command line
parameter. This is a convenient way to operate a multiple detector array with software
multiplexing in the standard GammaVision automation Job process. The individual detector
spectra and the summed output spectrum can also be analyzed independently.
The configuration file must be configured as shown below. The same format is used for the
GVSpectrumMux.INI file which is updated each time the “Process Spectra” button is selected in
the User Interface mode. This INI file can be used as a template if desired, but a different file
name should be used for automation routines to avoid inadvertent changes when the User
Interface mode is used.
The following is an example configuration file followed by an explanation of each parameter.
|GVSpectrumMux_SumMethod|=3
|GVSpectrumMux_SpectrumTemplateOption|=0
|GVSpectrumMux_ADCConvGainOption|=0
|GVSpectrumMux_OutputADCConvGain|=
|GVSpectrumMux_EnergyCalibrationOption|=0
|GVSpectrumMux_OutputEnergyIntercept|=
Page B75 of B77
|GVSpectrumMux_OutputEnergySlope|=
|GVSpectrumMux_OutputEnergyQuadratic|=
|GVSpectrumMux_SpectrumTemplatePath|=
|GVSpectrumMux_SpectrumOutputPath|=C:\User\SPC\OutputSpectrum.spc
|GVSpectrumMux_NumberOfSpectra|=2
|GVSpectrumMux_SpectrumPath1|= C:\User\SPC\InputSpectrum1.spc
|GVSpectrumMux_SpectrumPath2|= C:\User\SPC\InputSpectrum2.spc
|GVSpectrumMux_SumAcquisitionTime|=F
|GVSpectrumMux_SumMethod|= Multiplex Method Index
(1=Raw Channel Data, 2=Channel Count Rate, 3=Energy Count Rate)
|GVSpectrumMux_ADCConvGainOption|= ADC Conversion Gain Option Index
(0=Use Template, 1=128, 2=256, 3=512, 4=1024, 5=2048, 6=4096, 7=8192, 8=16384, 9=32768)
|GVSpectrumMux_OutputADCConvGain|= ADC Conversion Gain Value
(Must be blank if the previous parameter is set to zero. Otherwise, a valid value from the
ADCConvGainOption list must be specified.)
|GVSpectrumMux_EnergyCalibrationOption|= Energy Calibration Option Index
(0=Use Template, 1=User Defined)
|GVSpectrumMux_OutputEnergyIntercept|= Energy Calibration Intercept Value
(Blank to use Template value.)
|GVSpectrumMux_OutputEnergySlope|= Energy Calibration Slope Value
(Blank to use Template value.)
|GVSpectrumMux_OutputEnergyQuadratic|= Energy Calibration Quadratic Value
(Blank to use Template value.)
|GVSpectrumMux_SpectrumOutputPath|= File path for output spectrum.
|GVSpectrumMux_SpectrumTemplateOption|= Spectrum Template Option Index
(0=First Spectrum in List, 1=User Defined)
|GVSpectrumMux_SpectrumTemplatePath|= File path for the spectrum template.
(Blank to use the first Input spectrum in the list.)
|GVSpectrumMux_NumberOfSpectra|= Number of Input Spectra
(Specifies the number of Input spectrum paths to read using the SpectrumPathX parameter.)
|GVSpectrumMux_SpectrumPathX|= Input Spectrum File Path
(Repeat for each input spectrum with X replaced by the spectrum list index.)
|GVSpectrumMux_SumAcquisitionTime|= Sum Acquisition Time Option
(T = Sum Acquisition Times, F = Do not Sum Acquisition Times)
B.36 GVGammaProductsChangeSample
This program communicates with the Gamma Products sample changer using computer to
computer serial communication with a Null Modem cable. The Gamma Products Sample
Changer computer must be running the sample changer software and configured to accept input
commands over the serial port for this communication to occur. The COMM port settings on the
Global Value computer are set by the program to 9600 bits/sec, 8 data bits, no parity, and flow
control Off as required by the sample changer communication protocol when this program was
developed.
Page B76 of B77
Multiple sample changers can be controlled from one Global Value computer using multiple
COMM ports. The target port for the application can then be specified as one of the command
line arguments as described below. For each COMM port connection, the program stores the
most recent sample changer position in an INI file with the syntax COMMX_POSITION=Y where
X is the COMM port number and Y is the current position.
The GVGammaProductsChangeSample program is compatible with an older DOS version of
the sample changer control software as well as a more recent version used in the Windows
environment. The communication protocol used for each of these configurations is specified
using a command line parameter as described below.
GVGammaProductsChangeSample has the following comma-delimited command line
parameters:
1) Target Position or Reset Command: This parameter is either the desired sample changer
position or the reset command (“R”) to send to the Gamma Products Sample Changer
computer. If a number is specified, then the command is formatted as “XL” where X is the
target sample position.
If this parameter is omitted, then the program’s INI file is read to determine the most recent
position for the specified COMM port. This value is incremented, and the INI file updated to
reflect the new position. This value is then used with the “XL” command format where X is
the target sample position. If the INI protocol is used, then the initial position (position 1)
must be specified on the command line in order to reset the value in the INI file for the first
sample.
2) COMM Port Number: This parameter specifies the COMM Port number as configured in the
computer Hardware Properties. Refer to the Windows Operating System documentation to
configure COMM Ports. If this parameter is omitted, then 1 is used as the default.
3) COMM Type: The COMM Type specifies the handshaking protocol between the Global
Value computer and the Gamma Products Sample Changer computer as follows:
0 (zero): This setting is used when the Gamma Products computer is running the
Windows application. With this configuration the program uses the Carriage Return
(Ascii character 13) as a termination character when sending commands and
receiving responses. Responses from the Sample Changer computer are managed
as follows:
o “LOK” – The Sample Position was set successful and the program exits.
o “E”
– An error occurred, and the error message is displayed. A “Retry”
button is displayed to allow the user to resend the command after correcting
the condition.
o “J”
– A message is displayed indicating that the Sample Changer has
jammed. A “Retry” button is displayed to allow the user to resend the
command after correcting the condition.
1 (one): This setting is used when the Gamma Products computer is running the
DOS application. With this configuration the program sends commands and receives
responses without the terminating Carriage Return character. Responses from the
Sample Changer computer are expected to be a single character managed as
follows:
o Bell Character (Ascii character 7) – The Sample Position was set successful
and the program exits.
o “J”
– A message is displayed indicating that the Sample Changer has
jammed. A “Retry” button is displayed to allow the user to resend the
command after correcting the condition.
Page B77 of B77
Appendix C – Summary of Global Value Programs
This appendix provides a quick reference to the application programs installed with Global Value and
their respective command line parameters. The list is organized by the high level application interfaces,
Utility Programs, and automation Job programs used with routine QA and Sample measurements.
These programs are installed in the C:\User\GVCR directory along with other support files and
subfolders required for normal operation of Global Value. Refer to the applicable section of this User
Manual for additional detail related to each program.
The following parameters are used throughout the table below:
DETNO: The Detector Number specified in Sample Administration Configuration.
DETDBPATH: Full Path to the applicable Detector Database for Sample data.
DETQADBPATH: Full Path to the applicable Detector Database for QA data.
JOBPATH: Full Path to a Job file created by the program and subsequently called in the main Job.
Refer to the GammaVision User Manual for detail related to SDF (Sample Defaults Files), UFO
(Unformatted Output Files), and PBC (Peak Background Correction Files).
Main Application and Administration Programs
Program
GlobalValueQuickStart
Section
A.1
GVSampleAdmin
A.2
GVQAAdmin
A.4
Command Line Parameters
N/A
1) DETDBPATH
2) Detector Description
1) DETQADBPATH
2) Detector Number
Application Specific Utility Programs
Program
Section
GVPublishSample
A.3
GVPublishQA
A.5
GVQASummary
AnalysisLog.xls
GVDetectorMonitor
GVDatabaseUtility
File Backup (BackupAndPurge.bat)
A.6
A.7
A.8
A.9
A.10
GVDeleteFiles
A.10
GVFileCompare
A.11
GVDataExport
A.12
GVEFTConvert
A.13
Command Line Parameters
1) PDF Report File Path
2) Configuration File Path
1) PDF Report File Path
2) Configuration File Path
N/A
N/A
N/A
N/A
1) Target Backup Directory
1) Target Directory
2) File Criteria (*.ext)
3) Max Days
1) Criteria File Path
2) Report Exceptions Only Flag
1) Detector Number
2) Spectrum ID
N/A
Page C1 of C4
Automation Job Programs Common to Quality Assurance and Sample Measurements
Program
Section
GVCopyFile
B.32
GVSetSDFParameter
B.10
GVSDFData
B.9
GVAskConfirm
B.11
GVIncrementCounter
GVOpenFile
B.23
B.33
GVTemplateMaster
B.31
GVSpectrumMux
B.35
GVGammaProductsChangeSample
B.36
Command Line Parameters
1) Source File Path
2) Destination File Path
1) SDF File Path
2) SDF Parameter Name
3) SDF Parameter Value
1) SDF File Path
2) SDF Data File Path
1) JOBPATH
2) Message Text
1) DETDBPATH
1) Target File Path
1) Template File Path
2) Configuration File Path
3) Result File Path
1) Configuration File Path
1) Position or Command
2) Comm Port Number
3) Comm Type
Automation Job Programs for Quality Assurance Measurements
Program
Section
GVQASetUser
B.1
GVQAPeaks
B.27
GVQABackground
B.28
UfoToPbc
(also be used for “Blank” Samples)
B.30
Command Line Parameters
1) DETQADBPATH
2) Detector Number
3) Require Login Flag
4) JOBPATH
1) Detector Number
2) DETQADBPATH
3) Report Destination (WORD, NONE, or omit)
1) Detector Number
2) DETQADBPATH
3) Report Destination (WORD, NONE, or omit)
1) UFO File Path
2) PBC File Path
3) Job File Path
Page C2 of C4
Automation Job Programs for Sample Measurements
Program
Section
GVSetUser
B.1
GV_ResetInputs
B.34
GVDeadTimeCheck
B.4
GVQACheckStatus
B.29
GVClearData
B.2
GVRecallSpectrum
B.3
GVSampleData
B.6
GVSampleDataPlus
GVSampleDataSC
B.7
B.8
GVGetConfiguration
B.12
GV_GetCustomData
B.21
Command Line Parameters
1) DETDBPATH
2) Require Login Flag
3) JOBPATH
4) Reanalysis Flag
1) DETDBPATH
2) Spectrum ID
1) Detector Number
2) Dead Time Limit Value
3) JOBPATH
4) Check Duration
5) Geometry List File Path
6) Calibration Directory
7) Calibration File Prefix
1) Detector Number
2) DETQADBPATH
3) JOBPATH
4) Allow Continue Flag
1) DETDBPATH
1) DETDBPATH
2) JOBPATH
3) Reanalysis Data File Path
1) SDF File Path
2) JOBPATH
3) Excel File Path
4) Default Sample Description
5) Default Decay Date/Time
6) Default Quantity
7) Default Quantity Units
8) Default Live Time
9) Reanalysis Flag
10)Reanalysis Data File Path
11)Editable Quantity Units Flag
1) Configuration File Path
1) Configuration File Path
1) JOBPATH
2) Calibration File Prefix
3) Calibration File Directory
4) Library File Directory
5) Default Geometry
6) Default Library
7) Reanalysis Flag
8) Reanalysis Data File Path
1) DETDBPATH
2) Data Source File Path
3) Append Data Flag
4) Reanalysis Flag
5) JOBPATH
Page C3 of C4
Automation Job Programs for Sample Measurements (continued)
Program
Section
GV_GetRType
B.13
GV_GetSiteUnit
B.14
GV_GetBatch
B.15
GV_GetComment
B.16
GV_GetGDTPressure
B.17
GV_GetSamplePump
B.18
GV_GetRWP
B.19
GV_GetRadMon
B.20
GVTimerControl
B.5
GV_GetRptData
B.22
GV_Custom_Rpt
B.24
Print_Rpt
B.25
GrossGamma
B.26
Command Line Parameters
1) DETDBPATH
2) Sample Type
3) Reanalysis Flag
4) JOBPATH
1) DETDBPATH
2) Site Unit
3) Reanalysis Flag
4) JOBPATH
1) DETDBPATH
2) Batch Description
3) Reanalysis Flag
4) JOBPATH
1) DETDBPATH
2) Default Comment
3) Reanalysis Flag
4) JOBPATH
1) DETDBPATH
2) Reanalysis Flag
3) JOBPATH
1) DETDBPATH
2) Reanalysis Flag
3) JOBPATH
1) DETDBPATH
2) Reanalysis Flag
3) JOBPATH
1) DETDBPATH
2) Reanalysis Flag
3) JOBPATH
N/A
1) DETDBPATH
2) Analysis Number
3) Omit Nuclide if >Half-Life Cutoff Flag
4) Decayed Activty = 0 if >Half-Life Cutoff Flag
5) Reanalysis Flag
1) DETDBPATH
2) Report Template Name
3) Reanalysis Flag
1) DETDBPATH
2) No Longer Used
3) Report Type (CVR, ALL, or omit)
4) Report Destination (WORD, PDF, TXT, or
omit)
5) Font Size
6) File Directory (for PDF or TXT files)
7) Reanalysis Flag
1) Background Spectrum Path
2) Sample Spectrum Path
3) Excel File Path
Page C4 of C4
Appendix D – Field Size Limitations
Field / Parameter
Limitations
Spectrum ID (Filename)
50 Characters (No Invalid File name characters allowed such as:
( ) \ / : * ? ” < > | and others.
Detector Description
100 characters max
(A practical limitation for proper display on custom report
summaries is 64 characters – i.e. use only the first line in the MCB
Configuration dialog box.
Sample Description
130 characters max
(A practical limitation for proper display on custom report
summaries is 64 characters – i.e. use only the first line in the
GammaVision Sample Description dialog box.)
Calibration Description
100 characters
(A practical limitation for proper display on custom report
summaries is 64 characters – i.e. use only the first line in the
GammaVision Calibration Description dialog box.)
Calibration File Name Path
255 characters
(A practical limitation for proper display on custom report
summaries is 64 characters in the file name.)
100 characters max
(A practical limitation for proper display on custom report
summaries is 64 characters in the file name.)
Library
Note that GammaVision has an additional limitation of 32
characters for the full path length when using Jobs. The library will
still be used for analysis if the path is longer, but the path is not
displayed correctly on the analysis report, and the default library
may not be set in the Global Value prompts when reanalyzing a
spectrum.
Custom Report Template
Report Template names in Configuration Management are limited
to 50 Characters.
Group and User Names
20 Characters max
PDF Passwords
50 Characters max
Sample Type / R-Type
20 characters max
RWP
20 characters max (prefix and suffix combined. Suffix max is 6
characters.)
Rad Monitor ID
10 characters max
Rad Monitor Reading
Numeric
Air Sampler ID
25 characters max
GDT Pressure
Numeric
Site Unit
50 characters max
Batch ID
50 characters max
Comments
64,000 characters max
Page D1 of D2
Field / Parameter
Limitations
Unidentified Peak Resolution
25 characters max
Nuclide/QA Peak Name
10 characters max
Nuclide Data Parameters
Numeric
Nuclide Adjustment Factors
Numeric
Nuclide Adjustment Tables
10 characters max and cannot contain the underscore character
(“_”) or blank spaces.
Custom Parameter Name
50 characters max
Custom Parameter Label
30 characters max
Custom Parameter Report Code
10 characters max
Custom Parameter Value
50 characters max
Page D2 of D2
Appendix E – Network Configuration Considerations
There are several different ways to setup the Gamma Spectroscopy system on a network – each with its own
advantages and disadvantages. Three configurations are described below to help you determine which
configuration is best suited for your application.
Unlike other systems which may require a client-server model, Global Value is well suited for any of these
configurations because each detector is assigned a unique database that can be located anywhere on the
local network. Configuration Management functions can be performed on any individual database and all
configuration changes easily pushed to all other databases in the network. This distributed data file
topography allows the convenience of managing configuration parameters as if you were working from a
centralized database server with the added flexibility of storing analysis and configuration data on a local
computer to minimize counting lab interruptions in the event of a single point failure (network, server, or PC).
Network Dependent
Advantages
- Remote data access
- PC failure does not affect entire
system
Server Centric Configuration
DB DB DB DB DB
Disadvantages
- Network or server failure
disables entire system
- More expensive
Limited Network Dependency
Advantages
- Remote data access
- Core functionality is still operable
with a network, server, or PC
failure
- Less Expensive
Disadvantages
-
Distributed File Configuration --
Most Reliable for Mission Critical
Applications
DB DB
Multiple system backups
Duplication of common files
Network Independent
Advantages
- Single System Backup
- Less Expensive
Disadvantages
- PC failure disables entire system
- No remote data access
DB DB DB DB
Single PC Configuration
Page E1 of E1
DB DB
DB
Appendix F – Excel Add-In Function Reference
Table of Content
Appendix F Notes ........................................................................................................................... F2
F1 - GVAnalysisParameter ............................................................................................................ F3
F2 - GVCustomDataParameterListCount ....................................................................................... F4
F3 - GVCustomDataParameter ...................................................................................................... F5
F4 - GVINIParameter ..................................................................................................................... F5
F5 - GVMostRecentFilename ......................................................................................................... F6
F6 - GVDetectorListCount ............................................................................................................. F6
F7 - GVDetector ............................................................................................................................ F7
F8 - GVDetectorDatabasePath....................................................................................................... F7
F9 - GVDetectorDatabasePathByDetectorNumber ......................................................................... F8
F10 - GVSpectrumList..................................................................................................................... F8
F11 - GVNuclideList ........................................................................................................................ F9
F12 - GVConsolidateNuclideList ..................................................................................................... F9
F13 - GVParseList ......................................................................................................................... F10
F14 - GVNuclideName ................................................................................................................... F10
F15 - GVNuclideActivity ................................................................................................................ F11
F16 - GVNuclideFactor .................................................................................................................. F11
F17 - GVNuclideData..................................................................................................................... F13
F18 - GVNuclideDataList ............................................................................................................... F14
F19 - GVUnidentifiedPeakListCount .............................................................................................. F14
F20 - GVUnidentifiedPeakList ....................................................................................................... F15
F21 - GVUnidentifiedPeak ............................................................................................................. F15
F22 - GVUnidentifiedPeakData ...................................................................................................... F16
F23 - GVUnidentifiedPeakDataList ................................................................................................ F16
F24 - GVRWPListCount................................................................................................................. F17
F25 - GVRWPList .......................................................................................................................... F17
F26 - GVRWP ................................................................................................................................ F18
F27 - GVRadMonitorListCount ...................................................................................................... F18
F28 - GVRadMonitorList ............................................................................................................... F19
F29 - GVRadMonitor ..................................................................................................................... F19
F30 - GVPopulateDetectorList....................................................................................................... F20
F31 - GVPopulateSpectrumList ..................................................................................................... F20
F32 - GVGenerateSpectrumList .................................................................................................... F21
Page F1 of F21
Appendix F Notes
1) To enable the functionality in the Excel Add-In a reference must be established to the GlobalValue.xla file
as follows:
a. Open the Visual Basic Editor in Excel. In Excel 2007 and later select the Visual Basic icon in the
“Code” section of the Developer tab on the ribbon. If the Developer tab is not visible, then it can be
enabled from the Options page (File\Options menu), Customize Ribbon tab, in the Main Tabs list.
b. In the Visual Basic Editor select the menu item “Tools\References”.
c. In the References dialog, select the Browse button.
d. In the Browser dialog change the “Files of Type” dropdown list to “Microsoft Excel Files (*.xlsm, *.xlam
*.xls, *.xla)” or “All Files *.*”.
e. Browse to “C:\User\GVCR\GlobalValue.xla”.
f. Select the “Open” button to close the browser dialog and set the reference.
g. “GlobalValue” should now be displayed in the Available References list.
h. Select the “Ok” button to close the Reference List dialog.
i. Close the Visual Basic Editor.
j. The Excel Add-In functions are now available for this workbook.
2) The “DatabasePath” parameter used in most functions is the full path to a Global Value database used for
storing Sample data. The Add-In functions are not compatible with QA databases.
3) The “WorkGroupPath” parameter used in most functions is the full path to the file “GVCustomReport.mdw”
which is located in the installation directory - usually "C:\User\GVCR".
4) The “SpectrumID” is a unique string that identifies each analysis in the database. It is the same as the
Spectrum and Analysis report name without the file extension.
5) The arguments required for each function may be a static numeric value or character string, a formula that
evaluates to a numeric value or character string, or a reference to a worksheet cell containing a numeric
value or character string as applicable.
6) Global Value functions are described in the table below. Examples are also provided to demonstrate how
these functions can be combined with calculations, common Excel functions, and conditional formatting to
demonstrate the power and flexibility of custom calculations in the Excel environment. Example files may
be found in the directory “C:\User\GVCR\Excel” (if the Default Configuration Support Files are installed) or
in “Example Files\User\GVCR\Excel”on the installation disk.
Page F2 of F21
F1 - GVAnalysisParameter
GVAnalysisParameter(DatabasePath,WorkGroupPath,SpectrumID,Parameter)
This function returns a string representing the specified Parameter for the associated SpectrumID.
Argument Notes:
See Appendix F Notes for a description of the DatabasePath, WorkGroupPath, and SpectrumID
arguments. The SpectrumID records must be stored in the specified database path.
Parameter is any one of the following: (not case sensitive)
- Multiple Parameter Codes can be used to return the same data as shown.
- Parameter Codes with 1 or 2 suffix return data for the first or second analysis respectively.
- ReportSummary, ReportDetail, and ChangeSummary codes are available for use with VBA as the
returned content will typically overflow a worksheet cell.
Data Returned
Acquisition Dead Time (%)
Acquisition Live Time (seconds)
Acquisition Real Time (seconds)
Acquisition Start Date/Time
Activity Units
Activity Units Divisor
Activity Units Multiplier
Activity Range Factor
Additional Random Uncertainty
Additional Systematic Uncertainty
Analysis Date/Time
Analysis Engine Name
Analysis Engine Version
Analyst Name
Batch ID
Change Summary
Comments
Custom Parameter Data
Detector Description
Edited Date/Time
Editor Name
Efficiency Calibration Date/Time
Efficiency Calibration Description
Efficiency Calibration File Name
Energy Calibration Date/Time
Gas Decay Tank Pressure
Gross Spectrum Counts (or first ROI)
Half-Lives Cutoff
Library Match Width
Library Name
PBC File Date/Time Modified
PBC File Name
PBC Match Width
Peak Cutoff
Published Date/Time
Publisher Name
Uncertainty Confidence Interval
User-Defined Uncertainty Name
User-Defined Uncertainty Value (%)
Parameter Codes
DEAD, DeadTime
LIVE, LiveTime
REAL, RealTime
SMP_ACQU, AcquisitionStart
AU, ActivityUnits
ActUDiv1, ActivityUnitsDivisor1 / ActUDiv2, ActivityUnitsDivisor 2
ActUMult1, ActivityUnitsMultiplier1 / ActUMult2,ActivityUnitsMultiplier 2
ACTRANGE, ActivityRangeFactor
RANDUNCERT, RandomUncertainty
SYSUNCERT, SystematicUncertainty
SMP_ANAL, ReportDate
ENG1 / ENG2
ENG1Ver / ENG2Ver
Analyst
Batch
ChangeSummary
Comment
CUSTOM! (Where “CUSTOM” is a valid custom parameter name)
DET, Detector
EditDate
Editor
CAL1EFDate / CAL2EFDate
Eff1, Calibration1 / Eff2, Calibration2
Cal1, CalibrationFile1 / Cal2 / CalibrationFile2
CAL1ENDate / CAL2ENDate
GDT-P, GDTPressure
GRCTS, TotalCounts
MAXHL, HalfLivesCutoff
LIBMW, LibraryMatchWidth
LIB1 / LIB2, Library1 / Library2
PBC1Date / PBC2Date
PBC1Name / PBC2Name
PBCMW, PBCMatchWidth
PKCUTOFF, PeakCutoff
PublishDate
Publisher
CI, ConfidenceInterval, Sigma
UDUN?, UserDefinedUncertaintyName? (where ? = 1 through 9)
UDUV?, UserDefinedUncertaintyValue? (where ? = 1 through 9)
Page F3 of F21
Random Summing Factor Correction
Random Summing Factor Slope
Record Type
Report Details (GammaVision output)
Report Summary (Coversheet)
Reviewed Date/Time
Reviewer Name
Sample Collection Start Date/Time
Sample Collection Stop Date/Time
Sample Description
Sample Pump ID
Sample Quantity
Sample Quantity Uncertainty
Sample Quantity Units
Sample Type
Site Unit
RSFCORR
RSFSLOPE
RType
ReportDetail1 / ReportDetail2
ReportSummary
ReviewDate
Reviewer
SMP_STRT, CollectionStart
SMP_STOP, CollectionStop
DESC, SampleDescription
SMPLR, SamplePump
VOL, Quantity
VOLUNCERT, QuantityUncertainty
VU, QuantityUnits
STYPE, SampleType
Unit
Example:
Spreadsheet formula =GVAnalysisparameter(A1,A2,A3,A4) returns the Sample Description for
spectrum 01_00324.
Where:
Cell A1 contains the full path to the database.
Cell A2 contains the full path to GVCustomReport.mdw.
Cell A3 contains the text “01_00324” (a valid SpectrumID in the Detector database)
Cell A4 contains the text “SampleDescription” or “Desc”
F2 - GVCustomDataParameterListCount
GVCustomDataParameterListCount(DatabasePath, WorkGroupPath)
This function returns the total number of Custom Data Parameters defined in the specified database.
Argument Notes:
See Appendix F Notes for a description of the DatabasePath, WorkGroupPath, and SpectrumID
arguments. The SpectrumID records must be stored in the specified database path.
Example:
Spreadsheet formula = GVCustomDataParameterListCount (A1,A2) returns the number of custom
parameters defined in GV_Report1.mdb.
Where:
Cell A1 contains the full path to the database.
Cell A2 contains the full path to GVCustomReport.mdw.
Page F4 of F21
F3 - GVCustomDataParameter
GVCustomDataParameter(DatabasePath, WorkGroupPath, ListID)
This function returns the name of the Custom Data Parameter associated with the specified ListID with
the exclamation point character (!) appended as a suffix. The string returned by this function may be
used with the GVAnalysisParameter function to return the value associated with the custom parameter
for a specified Spectrum ID.
Argument Notes:
See Notes 1 & 2 above for a description of the DatabasePath and WorkGroupPath arguments. The
database is detector specific.
ListID is a number that identifies the position of an item within the list.
Example:
Spreadsheet formula = GVCustomDataParameter(A1,A2, 2) returns the second custom parameter
name followed by “!”.
Where:
Cell A1 contains the full path to the database.
Cell A2 contains the full path to GVCustomReport.mdw.
F4 - GVINIParameter
GVINIParameter(DatabasePath, WorkGroupPath, Parameter)
This function returns a string representing the specified Initialization Parameter from the target
database.
Argument Notes:
See Appendix F Notes for a description of the DatabasePath and WorkGroupPath arguments. The
database is detector specific.
Parameter is any one of the following items:
- Detector Parameters: DetectorID (Detector Description), DetectorNumber, FilePrefix, RPT_PATH
(Analysis Report Path), CRPT_PATH (Custom Report Path) NET_PATH (Network Path),
Publish_Path, Job_Path, Database_Path, QADatabase_Path, DailySpectrumCounter,
MonthlySpectrumCounter, AnnualSpectrumCounter
- Non-Detector Specific Parameters: GDT_Volume (Gas Decay Tank Volume), MONITORLIST,
RWP_PREFIX
Example:
Spreadsheet formula =GVINIParameter(A1, A2,”RPT_PATH”) returns the directory specified for this
detector’s analysis reports.
Where:
Cell A1 contains the full path to the database.
Cell A2 contains the full path to GVCustomReport.mdw.
Page F5 of F21
F5 - GVMostRecentFilename
GVMostRecentFilename(Directory)
This function returns a string representing the file name of the last analysis report (no extension)
generated by GammaVision in the specified directory.
Argument Notes:
Directory is the full path to the GammaVision Analysis Report directory terminated by the “\” character.
Example:
Spreadsheet formula = GVMostRecentFilename(GVINIParameter(A1, A2, ”RPT_PATH”)) returns the
file name of the last analysis report generated in the analysis report directory specified in the specified
detector database.
Where:
Cell A1 contains the full path to the database.
Cell A2 contains the full path to GVCustomReport.mdw.
F6 - GVDetectorListCount
GVDetectorListCount(DatabasePath, WorkGroupPath)
This function returns the number of detectors configured in the Global Value database.
Argument Notes:
See Appendix F Notes for a description of the DatabasePath and WorkGroupPath arguments. The
database is not detector specific.
Example:
Spreadsheet formula = GVDetectorListCount(A1,A2) returns the number of detectors specified in the
specified database.
Where:
Cell A1 contains the full path to the database.
Cell A2 contains the full path to GVCustomReport.mdw.
Page F6 of F21
F7 - GVDetector
GVDetector(DatabasePath, WorkGroupPath, ListID)
This function returns the detector description for a specified detector in the Global Value database.
Argument Notes:
See Notes 1 & 2 above for a description of the DatabasePath and WorkGroupPath arguments. The
database is not detector specific.
ListID is a unique number that identifies each detector in the database. This number is defined by the
order that each detector was added to the database.
Example:
Spreadsheet formula = GVDetector(A1,A2,ROW()) returns the name of the detector listed in the
specified database where the ListID is the same value as the cell row.
Where:
Cell A1 contains the full path to the database.
Cell A2 contains the full path to GVCustomReport.mdw.
F8 - GVDetectorDatabasePath
GVDetectorDatabasePath(SourceDatabasePath, WorkGroupPath, DetectorName)
This function returns the full path to a specified detector’s database.
Argument Notes:
See Notes 1 & 2 above for a description of the SourceDatabasePath (equivalent to DatabasePath)
and WorkGroupPath arguments. The database is not detector specific.
DetectorName is the unique Detector Description that identifies each detector in the Sample
Administration Configuration on the Detectors tab.
Example:
Spreadsheet formula = GVDetectorDatabasePath(A1,A2,”Detector #2”)) returns the database path for the
detector named “Detector #2” in the Sample Administration Configuration.
Where:
Cell A1 contains the full path to the database.
Cell A2 contains the full path to GVCustomReport.mdw.
Page F7 of F21
F9 - GVDetectorDatabasePathByDetectorNumber
GVDetectorDatabasePathByDetectorNumber(SourceDatabasePath, WorkGroupPath, DetectorNumber)
This function returns the full path to a specified detector’s database.
Argument Notes:
See Notes 1 & 2 above for a description of the SourceDatabasePath (equivalent to DatabasePath)
and WorkGroupPath arguments. The database is not detector specific.
DetectorNumber is the unique Detector Number that identifies each detector in the Sample
Administration Configuration on the Detectors tab.
Example:
Spreadsheet formula = GVDetectorDatabasePathByDetectorNumber(A1,A2,2)) returns the database
path for the detector that has been assigned Detector Number 2.
Where:
Cell A1 contains the full path to the database.
Cell A2 contains the full path to GVCustomReport.mdw
F10 - GVSpectrumList
GVSpectrumList(DatabasePath, WorkGroupPath, _
Optional GreaterThanReportDate, _
Optional LessThanReportDate, _
Optional GreaterThanAcquisitionStartDate, _
Optional LessThanAcquisitionStartDate, _
Optional GreaterThanSampleStartDate, _
Optional LessThanSampleStartDate, _
Optional GreaterThanSampleStopDate, _
Optional LessThanSampleStopDate, _
Optional lMaximumSpectrumCount)
This function returns a comma delimited list of spectra that meet the specified date criteria with the
maximum number of spectra optionally limited by lMaximumSpectrumCount value. This function is
typically used in VBA code as worksheet cells may limit the string length.
Argument Notes:
See Notes 1 & 2 above for a description of the DatabasePath and WorkGroupPath arguments. The
database is detector specific.
GreaterThan…\LessThan… date arguments are optional and must be valid dates if supplied. The
SampleStopDate is equivalent to the Decay Correction Date in Global Value.
lMaximumSpectrumCount specifies the maximum number of records to return. The most recent
records are returned if the list is limited by this value.
Example:
Spreadsheet formula = GVSpectrumList(A1, A2, “1/1/03”) returns a comma delimited list of all spectra
in the specified database that were analyzed after January 1, 2003.
Where:
Cell A1 contains the full path to the database.
Cell A2 contains the full path to GVCustomReport.mdw.
Page F8 of F21
F11 - GVNuclideList
GVNuclideList(DatabasePath, WorkGroupPath, SpectrumID, Optional IncludeMDA)
This function returns a comma delimited list of all nuclides associated with the specified SpectrumID if
IncludeMDA is set to TRUE. If IncludeMDA is omitted or FALSE, then only nuclides not flagged as
<MDA are included in the list.
Argument Notes:
See Appendix F Notes for a description of the DatabasePath, WorkGroupPath, and SpectrumID
arguments. The database is detector specific.
IncludeMDA is a Boolean (TRUE/FALSE) that determines if all nuclides associated with the
SpectrumID are returned or only those not flagged as <MDA.
Example:
Spreadsheet formula = GVNuclideList(A1, A2, A3, TRUE) returns a comma delimited list of all nuclides
associated with the specified Spectrum ID – even those reported as <MDA.
Where:
Cell A1 contains the full path to the database.
Cell A2 contains the full path to GVCustomReport.mdw.
Cell A3 contains a valid SpectrumID in the Detector database.
F12 - GVConsolidateNuclideList
GVConsolidateNuclideList(NuclideList)
This function consolidates several nuclide lists into one comma delimited list with no duplicates. This is
useful when combining the results of several analyses on a single spreadsheet.
Argument Notes:
NuclideList is a comma delimited list of nuclides. When combining the results of several analysis
results, the nuclide lists must be combined before use in this function. (See Example below.)
Example:
Spreadsheet formula = GVConsolidateNuclideList(A4) returns a comprehensive list of all unique
nuclide from a comma-separated list that has some duplicated names.
Where:
Cells A1 and B1 contain the GVNuclideList function described in Formula F11 with two different
SpectrumIDs specified. Each cell contains a different nuclide list with some common nuclides
belonging to each analysis.
Cell A4 contains the formula: =A1 & “, “ & B1 which concatenates the two strings with a comma
between them to maintain the required comma delimited format required by the
GVConsolidateNuclideList function.
Page F9 of F21
F13 - GVParseList
GVParseList(List, ListID, ParseCharacter)
This function returns an item in a character delimited list based on the number of the item in the list.
This function is generally used in combination with the Nuclide Lists, Nuclide Data, Unidentified Peak
Lists, RWP Lists, Radiation Monitor Reading Lists, etc. to retrieve an individual item from the list.
Argument Notes:
List is a character string of items delimited by a common character.
ListID is a number that identifies the position of an item within the list.
ParseCharacter is the character that separates each item within the list. Global Value functions
generally return a comma (“,”) delimited list; however, strings delimited by other characters may be
parsed using this function.
Example:,
Spreadsheet formula = GVParseList(A1, 1, “,”) returns the first item of a comma delimited list stored in
cell A1.
F14 - GVNuclideName
GVNuclideName(DatabasePath, WorkGroupPath, SpectrumID, ListID)
This function returns a nuclide name for the specified SpectrumID based on the order number of the
nuclide in the database.
Argument Notes:
See Appendix F Notes for a description of the DatabasePath, WorkGroupPath, and SpectrumID
arguments. The database is detector specific.
ListID is the order number of the nuclide for the associated SpectrumID.
Example:
Spreadsheet formula = GVNuclideName(A1, A2, A3, 1) returns the first nuclide associated with the
specified SpectrumID.
Where:
Cell A1 contains the full path to the database.
Cell A2 contains the full path to GVCustomReport.mdw.
Cell A3 contains a valid SpectrumID in the Detector database.
Page F10 of F21
F15 - GVNuclideActivity
GVNuclideActivity(DatabasePath, WorkGroupPath, SpectrumID, Nuclide, Optional IncludeMDA)
This function returns the activity value associated with the specified Nuclide and SpectrumID. If
IncludeMDA is set to TRUE, then the activity value is returned for nuclides with activity <MDA as well
as nuclides with detectable activity. If IncludeMDA is omitted or FALSE, then the activity value is only
returned for nuclides not flagged as <MDA in the database.
Argument Notes:
See Appendix F Notes for a description of the DatabasePath, WorkGroupPath, and SpectrumID
arguments. The database is detector specific.
Nuclide is the exact nuclide name listed in the database.
IncludeMDA is a Boolean (TRUE/FALSE) that determines if the activity value will be returned for
nuclides with activity <MDA.
Example:
Spreadsheet formula = GVNuclideActivity(A1, A2, A3, A4, FALSE) returns the nuclide activity for the
associated SpectrumID and Nuclide if the activity is NOT reported as <MDA. Otherwise, zero is
returned.
Where:
Cell A1 contains the full path to the database.
Cell A2 contains the full path to GVCustomReport.mdw.
Cell A3 contains a valid SpectrumID in the Detector database.
Cell A4 contains the nuclide name.
F16 - GVNuclideFactor
GVNuclideFactor(DatabasePath, WorkGroupPath, Nuclide, AdjustmentTable)
This function returns the nuclide adjustment factor value associated with the specified Table. Nuclide
Adjustment tables are setup and modified using the Global Value Configuration Editor.
Argument Notes:
See Notes 1 & 2 above for a description of the DatabasePath and WorkGroupPath arguments. The
database is not detector specific.
Nuclide is the exact nuclide name listed in the database.
AdjustmentTable is the name of a valid Adjustment Table as displayed in the Configuration Editor.
Example:
Spreadsheet formula = GVNuclideFactor (A1, A2, A4, A5) returns the DAC Adjustment Factor for the
specified nuclide.
Where:
Cell A1 contains the full path to the database.
Cell A2 contains the full path to GVCustomReport.mdw.
Cell A4 contains the nuclide name.
Cell A5 contains the name of the nuclide Adjustment Factor table. (i.e. DAC, DEI, etc.)
Page F11 of F21
Page F12 of F21
F17 - GVNuclideData
GVNuclideData(DatabasePath, WorkGroupPath, SpectrumID, Nuclide)
This function returns a comma delimited string of all nuclide information stored in the database in the
following order:
1) Less than flag (<) or empty string if activity is not reported as <MDA.
2) Standard Activity Value (Decayed if applicable)
3) Analysis Number (1 or 2) (2 is for the second result set of a dual analysis)
4) Nuclide ListID (used for reporting order)
5) Edited Flag (True/False) (indicates if the nuclide data was modified in the Analysis Editor)
6) Standard Uncertainty (as reported on the Gamma Vision report)
7) Standard MDA
8) Standard Counting Uncertainty in Activity Units
9) Standard Total Uncertainty in Activity units
10) Standard MDA2 (normally set to Critical Level method in B30Winds.ini file)
11) Standard Time of Count Activity
12) Nuclide Name
13) Bad Shape Flag (True/False)
14) Half-Life (days)
15) Decay Correction
16) Elapsed Half-Lives
17) ISO NORM Activity (decayed if applicable)
18) ISO NORM Time of Count Activity
19) ISO NORM Counting Uncertainty in Activity Units
20) ISO NORM Counting Uncertainty in Percent
21) ISO NORM Total Uncertainty in Activity Units
22) ISO NORM Total Uncertainty in Percent
23) ISO NORM Minimum Activity
24) ISO NORM Maximum Activity
25) ISO NORM Detection Limit
26) ISO NORM Decision Threshold
Argument Notes:
See Appendix F Notes for a description of the DatabasePath, WorkGroupPath, and SpectrumID
arguments. The database is detector specific.
Nuclide is the exact nuclide name listed in the database.
Example:
Spreadsheet formula = GVParseList(GVNuclideData(A1, A2, A3, A4), 1, “,”) returns “<” if the standard
nuclide activity was reported as <MDA.
Where:
Cell A1 contains the full path to the database.
Cell A2 contains the full path to GVCustomReport.mdw.
Cell A3 contains a valid SpectrumID in the Detector database.
Cell A4 contains the nuclide name.
Page F13 of F21
F18 - GVNuclideDataList
GVNuclideDataList(DatabasePath, WorkGroupPath, SpectrumID)
This function returns the comma delimited nuclide data string described for GVNuclideData (F17) for all
nuclides associated with the specified SpectrumID with each nuclide data set delimited by the pipe “|”
character.
Argument Notes:
See Appendix F Notes for a description of the DatabasePath, WorkGroupPath, and SpectrumID
arguments. The database is detector specific.
Example:
Spreadsheet formula B1 = GVParseList(GVNuclideDataList (A1, A2, A3), 1, “|”) returns the commadelimited NuclideData data string described in F17 for the first nuclide in the list.
Spreadsheet formula B2 = GVParseList(B1, 1, “,”) returns “<” if the standard nuclide activity for the first
nuclide in the NuclideDataList was reported as <MDA.
Where:
Cell A1 contains the full path to the database.
Cell A2 contains the full path to GVCustomReport.mdw.
Cell A3 contains a valid SpectrumID in the Detector database.
F19 - GVUnidentifiedPeakListCount
GVUnidentifiedPeakListCount(DatabasePath, WorkGroupPath, SpectrumID)
This function returns the total number of unidentified peaks associated with the specified SpectrumID.
Argument Notes:
See Appendix F Notes for a description of the DatabasePath, WorkGroupPath, and SpectrumID
arguments. The database is detector specific.
Example:
Spreadsheet formula = GVUnidentifiedPeakListCount(A1, A2, A3) returns the number of unidentified
peaks associated with the specified Spectrum ID.
Where:
Cell A1 contains the full path to the database.
Cell A2 contains the full path to GVCustomReport.mdw.
Cell A3 contains a valid SpectrumID in the Detector database.
Page F14 of F21
F20 - GVUnidentifiedPeakList
GVUnidentifiedPeakList(DatabasePath, WorkGroupPath, SpectrumID)
This function returns a comma delimited string of all unidentified peak energies associated with the
specified SpectrumID along with any resolution text with the peak energy and resolution text separated
by a dash (“-“) character. The GVParseList function can be used to extract specific items from the list.
Argument Notes:
See Appendix F Notes for a description of the DatabasePath, WorkGroupPath, and SpectrumID
arguments. The database is detector specific.
Example:
Spreadsheet formula = GVUnidentifiedPeakList(A1, A2, A3) returns a comma delimited list of all
unidentified peaks and associated resolution comments separated by the dash character.
Where:
Cell A1 contains the full path to the database.
Cell A2 contains the full path to GVCustomReport.mdw.
Cell A3 contains a valid SpectrumID in the Detector database.
F21 - GVUnidentifiedPeak
GVUnidentifiedPeak(DatabasePath, WorkGroupPath, SpectrumID, ListID)
This function returns the unidentified peak associated with the specified SpectrumID and ListID along
with any resolution text. The GVParseList function can be used to extract the peak energy and
resolution text.
Argument Notes:
See Appendix F Notes for a description of the DatabasePath, WorkGroupPath, and SpectrumID
arguments. The database is detector specific.
ListID is a number that identifies the position of an item within the list.
Example:
Spreadsheet formula = GVUnidentifiedPeak(A1, A2, A3, 1) returns the first unidentified peak energy
and resolution text separated by the dash character for the associated Spectrum ID.
Where:
Cell A1 contains the full path to the database.
Cell A2 contains the full path to GVCustomReport.mdw.
Cell A3 contains a valid SpectrumID in the Detector database.
Page F15 of F21
F22 - GVUnidentifiedPeakData
GVUnidentifiedPeakData(DatabasePath, WorkGroupPath, SpectrumID, ListID)
This function returns a comma delimited string of all Unidentified Peak information stored in the
database in the following order:
1) Peak Energy
2) Peak Channel
3) Background Counts
4) Net Counts
5) Net Count Rate
6) Percent Uncertainty
7) FWHM
8) Suspect Nuclide
9) Peak Flags
10) Resolution Text (as entered in the Analysis Editor)
Argument Notes:
See Appendix F Notes for a description of the DatabasePath, WorkGroupPath, and SpectrumID
arguments. The database is detector specific.
ListID is a number that identifies the position of an item within the list.
Example:
Spreadsheet formula = GVParseList(GVUnidentifiedPeakData(A1, A2, A3, 1), 1, “,”) returns the peak
energy for the first unidentified peak associated with the specified Spectrum ID.
Where:
Cell A1 contains the full path to the database.
Cell A2 contains the full path to GVCustomReport.mdw.
Cell A3 contains a valid SpectrumID in the Detector database.
F23 - GVUnidentifiedPeakDataList
GVUnidentifiedPeakDataList(DatabasePath, WorkGroupPath, SpectrumID)
This function returns the comma delimited unidentified peak data string described for
GVUnidentifiedPeakData (F22) for all peaks associated with the specified SpectrumID with each peak
data set delimited by the pipe “|” character.
Argument Notes:
See Appendix F Notes for a description of the DatabasePath, WorkGroupPath, and SpectrumID
arguments. The database is detector specific.
Example:
Spreadsheet formula B1 = GVParseList(GVUnidentifiedPeakData (A1, A2, A3), 1, “|”) returns the
comma-delimited Unidentified Peak data string described in F22 for the first peak in the list.
Spreadsheet formula B2 = GVParseList(B1, 1, “,”) returns the peak energy for the first unidentified peak
in the list.
Where:
Cell A1 contains the full path to the database.
Cell A2 contains the full path to GVCustomReport.mdw.
Cell A3 contains a valid SpectrumID in the Detector database.
Page F16 of F21
F24 - GVRWPListCount
GVRWPListCount(DatabasePath, WorkGroupPath, SpectrumID)
This function returns the total number of Radiation Work Permits associated with the specified
SpectrumID.
Argument Notes:
See Appendix F Notes for a description of the DatabasePath, WorkGroupPath, and SpectrumID
arguments. The database is detector specific.
Example:
Spreadsheet formula = GVRWPListCount (A1, A2, A3) returns the number of RWPs associated with
the specified Spectrum ID.
Where:
Cell A1 contains the full path to the database.
Cell A2 contains the full path to GVCustomReport.mdw.
Cell A3 contains a valid SpectrumID in the Detector database.
F25 - GVRWPList
GVRWPList(DatabasePath, WorkGroupPath, SpectrumID)
This function returns a comma delimited string of all Radiation Work Permits associated with the
specified SpectrumID. The GVParseList function can be used to extract a specific item from the list.
Argument Notes:
See Appendix F Notes for a description of the DatabasePath, WorkGroupPath, and SpectrumID
arguments. The database is detector specific.
Example:
Spreadsheet formula = GVRWPList(A1, A2, A3) returns a comma delimited list of all RWPs associated
with the specified Spectrum ID.
Where:
Cell A1 contains the full path to the database.
Cell A2 contains the full path to GVCustomReport.mdw.
Cell A3 contains a valid SpectrumID in the Detector database.
Page F17 of F21
F26 - GVRWP
GVRWP(DatabasePath, WorkGroupPath, SpectrumID, ListID)
This function returns the Radiation Work Permit associated with the specified SpectrumID and ListID.
Argument Notes:
See Appendix F Notes for a description of the DatabasePath, WorkGroupPath, and SpectrumID
arguments. The database is detector specific.
ListID is a number that identifies the position of an item within the list.
Example:
Spreadsheet formula = GVRWP(A1, A2, A3, 1) returns the first RWP for the specified Spectrum ID.
Where:
Cell A1 contains the full path to the database.
Cell A2 contains the full path to GVCustomReport.mdw.
Cell A3 contains a valid SpectrumID in the Detector database.
F27 - GVRadMonitorListCount
GVRadMonitorListCount(DatabasePath, WorkGroupPath, SpectrumID)
This function returns the total number of radiation monitor readings associated with the specified
SpectrumID.
Argument Notes:
See Appendix F Notes for a description of the DatabasePath, WorkGroupPath, and SpectrumID
arguments. The database is detector specific.
Example:
Spreadsheet formula = GVRadMonitorListCount(A1, A2, A3) returns the number of Radiation Monitor
Readings associated with the specified Spectrum ID.
Where:
Cell A1 contains the full path to the database.
Cell A2 contains the full path to GVCustomReport.mdw.
Cell A3 contains a valid SpectrumID in the Detector database.
Page F18 of F21
F28 - GVRadMonitorList
GVRadMonitorList(DatabasePath, WorkGroupPath, SpectrumID)
This function returns a comma delimited string of all Radiation Monitor Readings associated with the
specified SpectrumID. The GVParseList function can be used to extract a specific item from the list.
Argument Notes:
See Appendix F Notes for a description of the DatabasePath, WorkGroupPath, and SpectrumID
arguments. The database is detector specific.
Example:
Spreadsheet formula = GVRadMonitorList(A1, A2, A3) returns a comma delimited list of all Radiation
Monitor Readings associated with the specified Spectrum ID.
Where:
Cell A1 contains the full path to the database.
Cell A2 contains the full path to GVCustomReport.mdw.
Cell A3 contains a valid SpectrumID in the Detector database.
F29 - GVRadMonitor
GVRadMonitor(DatabasePath, WorkGroupPath, SpectrumID, ListID)
This function returns the Radiation Monitor Reading associated with the specified SpectrumID and
ListID.
Argument Notes:
See Appendix F Notes for a description of the DatabasePath, WorkGroupPath, and SpectrumID
arguments. The database is detector specific.
ListID is a number that identifies the position of an item within the list.
Example:
Spreadsheet formula = GVRadMonitor (A1, A2, A3, 1) returns the first Radiation Monitor Reading for
the specified Spectrum ID.
Where:
Cell A1 contains the full path to the database.
Cell A2 contains the full path to GVCustomReport.mdw.
Cell A3 contains a valid SpectrumID in the Detector database.
Page F19 of F21
F30 - GVPopulateDetectorList
GVPopulateDetectorList(DatabasePath, WorkGroupPath, cbo)
This procedure adds each Detector Description and associated database path to two columns in the
specified combobox control. It is only available in VBA.
Set the “BoundColumn” property for the combobox to 2 to set the “LinkedCell” value to the detector
database path when a detector description is selected in the combobox.
This can be useful when used in combination with the GVPopulateSpectrumList procedure as
described in Formula F31.
Argument Notes:
See Notes 1 & 2 above for a description of the DatabasePath and WorkGroupPath arguments. The
database is detector specific.
cbo is the name of a valid combobox.
Example:
The following code populates the combobox “Detectors” when the workbook opens. The Database and
WorkGroup paths are stored in cells A2 and A3 respectively.
Sub AutoOpen()
GVPopulateDetectorList Sheets("Reference").Cells(1, 2).Text, _
Sheets("Reference ").Cells(1, 3).Text, _
Sheets("NuclideList").Detectors
End Sub
F31 - GVPopulateSpectrumList
GVPopulateSpectrumList(DatabasePath, WorkGroupPath, ComboBoxName)
This procedure adds each SpectrumID listed in the database to the specified combobox control. It is
only available in VBA.
Argument Notes:
See Notes 1 & 2 above for a description of the DatabasePath and WorkGroupPath arguments. The
database is detector specific.
ComboBoxName is the name of a valid combobox.
Example:
The following code is used in a worksheet combobox control Click event. The combobox “Detector1” is
linked to cell A1 to set the database path. When a detector is selected in this combobox, the database
path is updated in cell A1 and the combobox “Spectrums” gets populated with a list of SpectrumIDs for
that detector. The WorkGroupPath is specified in cell A2.
Private Sub Detector1_Click()
GVPopulateSpectrumList Me.Cells(1, 1), Me.Cells(2,1), Spectrum1
End Sub
Page F20 of F21
F32 - GVGenerateSpectrumList
GVGenerateSpectrumList(DatabasePath, WorkGroupPath, _
StartCellRange, _
Optional GreaterThanReportDate, _
Optional LessThanReportDate, _
Optional GreaterThanAcquisitionStartDate, _
Optional LessThanAcquisitionStartDate, _
Optional GreaterThanSampleStartDate, _
Optional LessThanSampleStartDate, _
Optional GreaterThanSampleStopDate, _
Optional LessThanSampleStopDate)
This procedure adds each SpectrumID matching the date criteria to subsequent rows in a column
starting from the specified cell. It is only available in VBA code.
Argument Notes:
See Notes 1 & 2 above for a description of the DatabasePath and WorkGroupPath arguments. The
database is detector specific.
StartCellRange is a string representing a cell reference in “A1” reference style (i.e. “C3”) where the first
of all SpectrumIDs will be returned.
GreaterThan…\LessThan… date arguments are valid dates used as query criteria. All dates are
optional. The SampleStopDate is equivalent to the Decay Correction Date in Global Value.
Example:
The following code is used in a worksheet button’s Click event. This code clears cells A13 through
A1000, then generates the Spectrum List starting from cell A13. The Database and WorkGroup paths
are stored in cells B1 and B2, and the date query parameters are listed in cells C3 through C10.
Private Sub Button1_Click()
Me.Range("A13:A1000").Clear
GVGenerateSpectrumList Me.Range("B1"), Me.Range("B2"), "A13", _
Me.Range("C3"), Me.Range("C4"), _
Me.Range("C5"), Me.Range("C6"), _
Me.Range("C7"), Me.Range("C8"), _
Me.Range("C9"), Me.Range("C10")
End Sub
Page F21 of F21