1
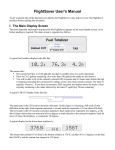
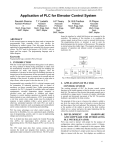
FlightSaver A combination flight-data recorder, fuel-flow totalizer, & more • Bright 32x128 pixel display provides supplemental engine, navigation, and air data information that greatly reduces pilot workload • Large memory (removable 256-Mbyte compact flash card) – sufficient to store all recorded data at five-second intervals for the life of your engine • Saves engine temperature data from GEM/JPI/EI engine instruments • Saves navigation/position data from any aviation GPS system • Saves instantaneous fuel flow data (with fuel flow transducer option) • Saves air data (OAT, TAS, CAS, pressure altitude, density altitude, etc.) • Saves last 60 seconds of cockpit communication (with voice-data option) The FlightSaver™ from Mennen Compact Flash Card Avionics is a new instrument FlightSaver quite unlike anything on the market today. We aim to Fuel Totalizer (fuel flow, Eject gallons & hours remaining) convince you that no aircraft 14.3 4 73.9 G 5.1 H should be without one. Hottest CHT 373 ⎧ 2nd Hottest CHT⎫ ⎪ ⎪ OAT ⎨ ⎬ ⎪ Oil Temp ⎪ ⎩ ⎭ 27 162T ↑ Mark ↓ Aux Set CDI TAS ⎧ ⎫ ⎪ Ground speed ⎪ ⎨ Zulu time ⎬ ⎪ System voltage ⎪ ⎩ ⎭ Despite FlightSaver’s wide array of features, the logical 3-button interface is so simple you won’t even need the manual to figure out how to use it. Unlike the liquid crystal displays used in many instruments, FlightSaver’s high-contrast adjustable-intensity vacuum fluorescent display has a wide viewing angle and is easy on the eyes in all lighting conditions. The FlightSaver functions are divided into five categories: 1. Engine temperatures 2. GPS data 3. Fuel-flow measurements 4. Air data / miscellaneous aircraft data 5. Bookmarking and voice recording I. Engine temperatures The FlightSaver allows you to take full advantage of the data collected by your engine analyzer. (Note that the FlightSaver is not an engine analyzer — it is an adjunct to it.) Some engine analyzers don’t provide any of the long-term storage needed to analyze catastrophic failures, spot trends, or verify correct operating procedures. Other analyzers do provide such storage, but none save data often enough or for long enough. Some analyzers even require the pilot to initiate the recording of anomalous engine situations, causing crucial data to be missed almost every time. The best recording available on any engine analyzer gives you about 50 hours of data. After that, if you don’t bring your laptop computer into the cockpit to retrieve the data, it will be lost. No analyzer can match the impressive recording capability of the FlightSaver – 16 data channels at five-second intervals for up to 3000 hours! Also unique to the FlightSaver is the ease of transferring the recorded data to your computer. Bringing a laptop computer to the airport is not required. Just push the data card-eject button on the front panel and take the card home. Read the data on any PC using the supplied USB compact-flash card reader. Put the same card back in the FlightSaver to continue recording. Or if it is more convenient, put a new card in. All the data is time stamped and is easily pieced together later. Faced with the complex operation of the typical high-performance aircraft engine, many pilots wonder if there is just one indicator that they can look at to give them a general sense of how happy the engine is. For instance on a scale of 1 to 4 we might want to categorize the engine stress as: This flight is just a walk in the park The engine operating safely but getting hot under the collar It’s time to do something to relieve some of the stress Things so bad that I should cut the power and look for the nearest airport One might argue that oil temperature provides such a measure; however, this rarely tells you if just one cylinder is in distress. After much research we have concluded that there is such an indicator – the temperature of the hottest cylinder. Unfortunately this is rarely available to the pilot. The traditional analog CHT gauge is accurate enough for the job (barely), but its main problem is that it may not be showing you the hottest cylinder. (Which cylinder is hottest changes over time and engine condition.) The engine analyzer comes closer but still fails because the resolution of the CHT bar graph is too low to pick out the desired trend. And your engine analyzer’s digital display won’t help unless you manually scroll through each cylinder – too time consuming a task to do continuously. Even the alarms on your engine analyzer won’t solve this problem completely since it distinguishes only two levels, not the four (or more) mentioned above. The FlightSaver solves this problem by continuously displaying the hottest CHT along with the corresponding cylinder number. You will soon appreciate the value of getting this information at a glance – no button pushing necessary. The FlightSaver also displays the cylinder number of the second hottest cylinder and how many degrees cooler it is than the hottest cylinder. This differential temperature is of great diagnostic value since a larger than normal differential is often the first sign of a cylinder in distress. It’s difficult to recognize such an elevated differential from the engine analyzer bar graph – again because of its low resolution. To get this value without the FlightSaver you would have to scroll through all the cylinders, while remembering the two highest temperatures. Lastly, the FlightSaver comes with sophisticated trending software that allows you to extract much more information from your engine analyzer than you can by merely viewing the instantaneous temperatures on the display. You can plot daily, weekly, monthly, or yearly trends in CHTs, EGTs, and oil temperature by comparing flights with similar operating conditions (i.e. OAT, TAS, fuel flow, altitude). This is possible because the FlightSaver can correlate the engine analyzer data with the simultaneously recorded data from the GPS and other sensors. The trending plots help you: Evaluate the health of your engine Fine tune your operating techniques to maximize performance and engine reliability Evaluate the effectiveness of engine or airframe modifications The flight history will even increase your aircraft’s resale value. The complete engine performance history leaves nothing to the imagination and will ease many of the buyer’s concerns. II. GPS position/nav data The FlightSaver records 3-D position information provided by your GPS output port. A compressed file format is used so that even several thousand hours of GPS data won’t stress the limits of the flash data card. Once you have this long-term record you will be amazed at the utility of the data when coupled with the mapping software supplied with the FlightSaver. A few examples are: See exactly what went awry on that ILS attempt Return to that unmarked dirt strip you visited several years ago Prove to the FAA that you were actually above the class B airspace that the controller insisted you violated Recreate those forgotten pilot logbook entries Review 3D plots of your competition acro sequences to hone your flying precision and box positioning skills even when you can’t find an observer qualified to critique your sequence. Identify the most efficient IFR and VFR routes and altitudes for your most common destinations. In addition to the recording functions you will come to appreciate the FlightSaver’s GPS display functions. For example, you can elect to display ground speed on the main display page – continuously, or on a rotating basis with other functions. More importantly, the FlightSaver enables its CDI display (course deviation indicator) whenever a GPS destination has been selected. Although your GPS can display a digital CDI, typically the CDI resolution is too coarse to easily gauge its movement. The FlightSaver’s CDI’s resolution however, is as good as a traditional analog display. Another compelling advantage is that the FlightSaver allows you to view the CDI continuously, freeing up the GPS display for other equally important navigation data – another example of reducing extraneous button pushing and knob fiddling. You could accomplish the same thing by adding a conventional analog indicator, but typically this will cost as much as the FlightSaver and use the same panel space for a small fraction of the utility. The FlightSaver also simultaneously displays a CCI (course correction indicator) - another graphical course indication that provides essential information not given by the conventional analog CDI. (See the side bar “ CCI – a new way to fly”). CCI – a new way to fly FlightSaver’s CCI display appears directly below the CDI and shows you which way and how much you should turn to fly direct to the selected destination. Each thin arrow indicates a turn of 2° and each thick arrow indicates a turn of 10°. When flying VFR, flying direct to your destination is usually what you want, so following the CCI is the easiest way of navigating. Other methods require you to integrate information from more than one instrument or display. Note that this is different than homing – accomplished by merely pointing the nose directly at the destination. Homing also gets you there but via an inefficient curved path because it doesn’t account for the effect of wind. The CCI however accounts for the wind without you even having to know what it is. Flying to keep the CCI zeroed will yield a straight path to the destination even as the winds are changing. Although the CCI is an angular measure, do not confuse it with the VOR CDI, which is also shown in degrees. The VOR shows you how many degrees you are from the selected course, but it does not integrate knowledge of the aircraft’s course and so by itself it can’t tell you which way to turn. What about when you are flying IFR? Flying to the destination is generally not enough. One must fly to the destination via a prescribed course. To do that, one must use the CDI along with the course interception and tracking skills so painfully acquired during your instrument training. However even for this task, you will find the CCI very useful because it tells you which way and how fast the CDI is going to move. If the CCI is pointing to the left, that means the CDI will be moving to the left. If you are trying to get back to the selected course you should be happy only when the CCI and CDI are pointing in opposite directions. As an example, suppose the CDI has drifted to the left. To make a 30° cut back to the course, steer so the CCI shows three thick arrows to the right. The CCI data (sometimes called track angle error) comes from your GPS and is computed as the difference between the bearing to the waypoint and the course over the ground. So, yes, it turns out you’ve had this information all along. However only with the FlightSaver can you display it in way that is easy to interpret (i.e. in graphical form right next to the CDI). If you have an HSI you probably depend on it for course guidance. Even so, you will find the CCI a useful adjunct and an important backup system. (Remember that your HSI depends on failure-prone mechanical parts such as the gyro and compass slaving system and some on the notoriously unreliable vacuum pump as well.) This plot shows some of the data available from a typical flight. Each trace is color coded and identified by the similarly colored label on the left (italics indicate a disabled trace). In this plot, only six traces have been enabled to reduce clutter (egt1, cht1, oil temp, fuel flow, and pressure altitude). Observe the fuel flow trace (cyan) to track the flight progress. For instance, you can see that takeoff (up to 28.4gph) occurred at T=7 minutes after master-on, soon followed by a quick lean back to 18gph followed by a very slow leaning operation down to 10.5gph which allowed us to create the accurate leaning chart shown on the next page. (Just click and drag to make a box around the leaning sequence and click “Lean” at the lower left.) The wild fuel flow variations starting at T=51 minutes are from two touch-and-go’s before the final landing at T=60. Extensive cursoring features are provided, which make it easy for you to get the information you want from the data. In the example above, the peak cursor button (↑) was used to find the hottest reading for CHT1 (319° at T=8.5). Notice the vertical line representing bookmark “Xray” and the user entered comment indicating that this starts a speed check. Click and drag the mouse to draw a box around the constant fuel-flow segment just after the bookmark. Then click inside the box and it will expand to show the graph on the left. Here, all the engine and air data traces have been disabled showing only the gps data mag course, ground speed, and gps altitude (blue, pink, and yellow respectively). From the four headings roughly 90° apart, it looks like this was a closed square course. You could easily verify that by importing the gps data into your favorite mapping program. III. Fuel-flow measurements Fuel-flow measurements require a fuel flow transducer, but you will likely find the option well worth the small additional cost. The FlightSaver continuously displays instantaneous fuel flow, fuel remaining, and hours remaining (at the current fuel flow) without any need to push any buttons. This is similar to the stand-alone fuel totalizers; however, the FlightSaver provides much more at a cost lower than that of most fuel totalizers. Unlike other fuel totalizers, the FlightSaver makes a permanent record of the instantaneous fuel flow once every second along with a time stamp allowing the data to be correlated with the recorded GPS and temperature data. The fuel flow record proves valuable since it can be directly related to horsepower (most accurately when operating LOP). Like most stand-alone totalizers the FlightSaver compares the hours of fuel remaining with the GPS ETE and warns the pilot if fuel reserves at the destination will be less than a pre-selected amount. You may preset two fuel levels (such as full and to the tabs for example) so that the FlightSaver may be initialized to either of those levels quickly. You can also adjust the fuel quantity up or down in increments of 1 or .1 gallons. Your engine analyzer may also have an option to measure fuel flow, however most likely you will find its functionality less than complete. For example, with some analyzers, fuel remaining is not computed or displayed while others lack the ability to integrate the fuel and GPS information. More serious, however, is that the fuel-flow functions can’t be displayed continuously since they compete with the other analyzer functions for the limited display area. The FlightSaver’s generous display area overcomes these limitations. Another advantage of the FlightSaver’s fuel flow capability is the leaning chart. First each fuelflow/egt pair acquired during the leaning sequence is plotted as one of the fuzzy dots on the chart. Then a leastsquares polynomial fit is calculated and plotted for each cylinder, and finally the polynomial is used to determine the fuel flow at which each cylinder reaches its maximum temperature (shown in black box center left). The software automatically determines which cylinders peak first and last and computes the fuel flow difference between those two cylinders (shown in graph title – upper right). That difference is the best measure of how well the fuel injectors are matched. You may recognize this chart as similar to the well-known GAMI EGT charts – designed to determine if your injectors are matched well enough to permit the fuel-efficient LOP (lean of peak) operating mode. If they are not, the problem is easily fixed by using the GAMI injectors, and then with another simple five-minute test you can create a new leaning chart to verify the improved matching. GAMI can even use this chart to further fine-tune your injectors to optimize performance. Before the advent of the FlightSaver, recording all the data needed for such a chart required at least two people in the cockpit, both with the patience of a saint. Then after painstakingly plotting all the data, often you would find that a flight or recording anomaly invalidated the results, requiring a repeat of the procedure. For most pilots, such a performance chart is only practical if it can be automated as the FlightSaver does. These charts provide all the same trace selection, cursoring, peak finding, display expansion, window sizing, and hardcopy features as the main data analysis windows shown above. A final (and unique) fuel-flow function of the FlightSaver is that you can set it to display engine horsepower or percent of maximum rated power. This function is most accurate for LOP operation, however it can also be used ROP if you use a consistent temperature differential below peak EGT. IV. Air data and miscellaneous aircraft data Some of these functions may be displayed on the main data page (continuously, or rotating with other display selections). Others are displayed on the auxiliary data page: Outside air temperature Calibrated air speed / True air speed Wind speed and direction Pressure altitude / Density altitude System voltage Hobbs meter TIS meter (Time-in-service) Greenwich Mean Time (or may be set to any time zone you prefer) Also the air data (the first four in the list) are transmitted to your GPS, allowing it to display this data on its supplementary information pages. (Compatible with most modern aviation GPS equipment) Regardless which functions are selected for display, if the system voltage is less than 12V or greater than 15V it is always displayed (blinking) in the true air speed window. Because of the brightness of the display, this is a hard-to-miss warning sign. The Hobbs meter normally advances only when the engine is running (when the fuel flow is greater than .05 gal/hour.) If you prefer, you can set the Hobbs meter to run whenever the master switch is on, regardless of whether the engine is running. The TIS meter advances only when the CAS exceeds 27 mph. As defined by FAR Part 1, "Time in Service, with respect to maintenance time records, means the time from the moment an aircraft leaves the surface of the earth until it touches down at the next point of landing." Although you are allowed to use the tachometer for this purpose, the FlightSaver’s TIS meter more accurately tracks the measure of wear and tear intended by the regulations. On average the TIS meter shows about 12 to 15% less time then the tachometer since it is not running during taxiing, pre-flight checks, clearance copying, etc. This means that commercial operators can get more revenue hours between 100 hour inspections, AD mandated inspections, mandatory engine and prop TBOs, and replacements of other life limited components. Based on the TIS function alone, the FlightSaver will pay for itself in the first year of operation! If you don’t need a Hobbs or a TIS function, you can choose that either or both of these timers are reset to zero each time the master switch is turned on. This provides timers useful for flight logging purposes. The instructions to select any of the Hobbs or TIS options or to set the timer values are provided only to the owner at the time of the FlightSaver purchase to avoid unauthorized or accidental modification. As an additional protection, a password is also required to modify any of the timer settings. The FlightSaver uses a connection to the aircraft’s pitot-static system to compute and display CAS and pressure altitude. The CAS function can be used as a backup in the event your primary airspeed indicator fails and likewise the pressure altitude function can be used as a backup if your altimeter fails. Another use of the CAS function is to calibrate your primary airspeed indicator (notoriously inaccurate instruments). This is even better than using an airspeed calibrator for such a purpose. One reason is that an accurately calibrated airspeed calibrator is not always available. Also since an airspeed calibrator is used only on the ground, it can’t account for static system anomalies or pitot tube alignment. Since you can compare the FlightSaver’s CAS display with your IAS under actual flight conditions these errors are eliminated. The FlightSaver’s CAS function itself can be calibrated to within a fraction of a knot by using GPS data collected over several flights. For IFR flights you will find the altitude alert function invaluable. When you reach your assigned altitude, mark it by pressing ALT, MARK. Then if you deviate from that altitude by more than a preset amount (200 feet by default) you will see a blinking altitude warning on the display and you will hear a spoken warning through the headsets. By combining a measure of OAT (outside air temperature) with the pressure altitude and CAS data, the FlightSaver can also compute and display TAS (true air speed) and density altitude. And by combining this data with a measurement from a remote compass (if so equipped – typically included with an HSI) the FlightSaver can also compute wind speed and direction. The same calculation that calibrates the pitotstatic inputs is used to calibrate the remote compass. In fact after many hours of flying, the FlightSaver can provide a compass correction card for your remote compass – data that is surprisingly difficult to obtain accurately. Typically airframe and engine modifications mean that the cruise performance tables in your POH are no longer accurate. And sometimes those tables are more wish full thinking than reality. With the FlightSaver’s ability to measure TAS to sub-knot accuracy, you can create a much more complete and accurate charts. The FlightSaver comes with software that makes this easy. Your cruise performance is completely characterized by the two drag coefficients shown here, so the FlightSaver can determine these parameters (and the whole chart) after just two measurements at different power settings (at any altitude). For the highest accuracy and confidence however, about a dozen measurements should be used. Fortunately each measurement takes only a few minutes, and you don’t have to write anything down. The FlightSaver takes care of all that. The chart above shows true airspeed as a function of power. Another way of presenting essentially the same information is to graph fuel efficiency (or range) as a function of power. An example of this type of chart is shown below. The FlightSaver software can also generate these charts for you. You will find these charts much more useful than the typical cruise performance tables. For example, with this chart it is easy to see how your choice of altitude and power setting affect the range and efficiency. Also in a low fuel emergency situation you will want to know what power setting is best for your current altitude to maximize the chance that you will make it to your destination before the fuel supply is exhausted. For example, the cursor is on the peak of the 12,000 foot curve which shows that the maximum fuel efficiency at that altitude is 14.51 nm/gal achieved at a 36.6% power and a true airspeed of 106.2 knots. (We had to go back to the previous chart to find TAS.) Another parameter we can get from the range chart is the minimum power necessary for level flight. For instance the minimum power on the 20,000 foot curve above is 36.6% power which would achieve a true airspeed of 92.2 knots. This power setting/airspeed is known as “maximum endurance” and is the best power setting to use when you are going nowhere - holding patterns for example. (Notice how the max endurance power and airspeed increase with altitude.) Now that your cruise performance is so easily characterized, you can answer many often asked questions: How much speed do I really lose when I open the cowl flaps? Should I take my wheel pants off for the winter? What will the benefit be of moving or removing some of the antennas? Was $3000 really justified for this aerodynamic speed-up kit? What would the extra fuel cost be to cut down the 5 hour leg by 30 minutes? V. Bookmarking and voice recording Many events during a flight may cause you to be interested in looking at the recorded data. Since there is so much recorded data, there must be an easy way to find an event of interest. Since the data is timestamped, you could simply write down the time of the interesting event. There are a few disadvantages to that approach: You might mix up events if your watch or clock is off. You might not have time to write anything down, or paper/pencil may not be handy. You might lose that scrap of paper. All these problems can be solved using FlightSaver’s bookmarking function. Simply push the “mark” button and the display will show “Bookmark ALPHA saved”. (The next time you mark, bookmark BETA will be saved, etc.). Then after you load the data into your computer you can display a list of all bookmarks showing its letter code, Zulu time, Hobbs meter time, and the latitude and longitude where the bookmark was taken. To make identifying the bookmarks even easier you may also save the cockpit/ATC communication at the time (with the FlightSaver’s voice data option). The duration of the cockpit communication that is saved is controlled by the number of times the mark button is pressed: 1 time 2 times 3 times 4 times No voice data saved 40 seconds saved (from 20 seconds before the mark button is first pressed) 2 minutes saved (from 1 minute before the mark button is first pressed) Voice data is saved continuously (starting from 1 minute before the mark button is first pressed) until the mark button is pressed for the 5th time. Here are examples of phrases you might consider saying while pressing the mark button (just speak normally as you would for using the intercom): Replay this to include in my NASA safety report. Save this GPS track – how not to intercept an ILS. Looks like a landable spot 3 miles off my left wing. Get lat/long for flight next week and remember to bring along the compressor. Felt engine missing. Check power settings. Oops, forgot to enrichen for takeoff. Check temps later to assess damage. Climb seems anemic. Compare all parameters with my flight last week. Make GAMI chart of this leaning sequence. Cowl flaps were closed. Bad landing. Check for stabilized approach. Save this for the “funniest tower remarks” column. You can also replay the last 10 or 60 seconds of cockpit/ATC communication during flight. This is most often used to verify an ATC clearance without having to request a retransmission. Mapping Although the FlightSaver stores position data in a highly compressed form, the export function expands the data into the standard ASCII lat/long pairs compatible with all the common mapping programs. The picture above shows a flight from Lake Havasu City to Palo Alto airport, plotted with Delorme’s popular and inexpensive Street Atlas USA. To help you visualize the timeline, timestamps are inserted at regular intervals. Bookmarks are also shown as well as flags for the engine start and shutdown points. You can easily edit the gps data file to add additional notes. The picture on the right (using the same software) shows the initial taxi and takeoff routing from this flight at a greatly expanded scale. In addition to the street mapping software used here, you may also use flight simulation software, aeronautical charting software, surveying or geology mapping software, gps mapping software, or terrain/topological mapping software. (The last has 3 dimensional plotting capability, which is especially interesting for looking at your recorded aerobatic routines.) As we mentioned earlier, there are many practical uses for these plots. However FlightSaver owners report that their favorite use is to give their passengers a record of the flight. Firsttime passengers especially enjoy such a record to show their friends and to make the flight more memorable. This shows the plan and profile views of an approach to Stockton’s ILS29R during a training flight. The GPS data was exported from the FlightSaver into FlitePro (an inexpensive IFR simulator from Jeppesen). One nice thing about FlitePro from a training perspective is that the instructor and student can watch the flight progress (at 25, 50, or 100 times faster than actual time) while discussing all the successes and foibles of the flight. FlitePro makes it easy to pause or back up at any point. Competitive analysis The FlightSaver is somewhat similar to instruments generally known as air data computers, although the FlightSaver provides recording functions not found in any such instrument. Another difference is that most air data computers are marketed for turbine-equipped aircraft, both because of their high cost and because of the engine parameters that are recorded - things like NG (gas generator speed), Torque, ITT (inter-turbine temperature), and NP (power turbine speed). On the other hand the FlightSaver is tailored squarely at the general aviation market, recording things familiar to the reciprocating engine crowd, such as CHTs and EGTs – and priced low enough to appeal to private pilots. Another philosophical difference is that air data computers are designed with the idea that the pilot will constantly be fiddling with it. This is because they compute a great deal of useful information for the pilot but only display one or two items at a time. So to take advantage of all this data, the pilot must manually select the information most relevant at the time. While some pilots like to fiddle with their avionics, the FlightSaver designers feel that pilots are already busy enough (especially the single-pilot IFR folks). So the FlightSaver is pretty much a “set it up the way you like it, and then leave it alone” thing. The FlightSaver manages this by using a bright, easy-to-read vacuum fluorescent display with a high enough resolution to show all the most important information at the same time. The FlightSaver constantly displays the following information on the main data page: The hottest CHT (°F) Fuel flow (gal/hour) Fuel remaining (gal) Fuel reserve expected at the destination (hours) The CDI (course deviation indicator) The CCI (course correction indicator) The logic behind the choice of these items is flight safety. Engine problems (due to engine mismanagement, improper maintenance, or plain bad luck) certainly can prevent a safe arrival at your destination and at the very least can affect your pocketbook like no other aircraft component. The single number that is the best at signifying a need to pay closer attention to your engine is the temperature of the warmest cylinder. The next safety problem that we hope to nix is running out of gas. It’s a shockingly stupid “why does it happen?” kind of thing, yet many pilots manage it every year. With the FlightSaver display we aim to make such a mistake even more improbable. And then finally, at least for the IFR pilots, just plain flying the wrong way ranks high on the list of safety concerns. The combination of the constantly visible CDI in close proximity with the CCI makes it easier to verify at a glance that indeed we are still going the right way. In addition to the six items listed above, the main data page includes two more numeric fields that can display a variety of information of your choice. A single button push momentarily displays the other less urgent data in a single additional data page. (After all you don’t need to instantly and continuously monitor density altitude and Hobbs meter time.) A second philosophical difference is the FlightSaver’s focus on data recording and analysis. All GPS and sensor data is recorded for future analysis. Discarding such valuable data is silly given the incredibly low cost of today’s flash memory. Once this data is available coupled with easy-to-use tools for viewing and analyzing it, you will find many uses for it and will wonder how you lived without it. You will find no other instrument has such complete data recording capability. This data recording focus will especially appeal to flight schools, fleet operators, or any aircraft owner who shares his airplane with other pilots. The potential for abuse of the engine or airframe is so high that strict operating rules are usually specified. These rules are often broken because there is no way to enforce them. The FlightSaver changes that balance. Violations of almost any operating restriction are easily identified including landings off-airport or at unapproved airports, aerobatics, excessive cruise power settings, improper leaning procedures, unapproved touch and go operations, restricted airspace violations, curfew violations, excessive taxi speeds, improper starting, run-up or shutdown procedures, improper flight time accounting, buzzing and other reckless low level maneuvering and many others. Even of you never review the flight data, just the existence of the data will prevent most abuses and can significantly reduce your insurance rates and liability exposure. A few other instruments employ a removable data card to transfer data to the PC; however, they all use severely limited capacities such as 32 kBytes (8192 times smaller than the FlightSaver’s data card). Because of FlightSaver’s large memory capacity you won’t have to decide which parameters to record nor will you have to worry that new data will overwrite the old. The other area that sets the FlightSaver apart is its data viewing and analysis capabilities. If these tools were cumbersome, buggy or non-existent, you would be the one throwing away the recorded data. The FlightSaver doesn’t rely on the primitive plotting capabilities of Excel or other canned routines. Instead it includes a fully customized plotting program with extensive cursoring, display expansion, and trending capabilities. Each trace may be disabled or re-enabled by clicking on the trace name on the left – allowing you to trade off between detail and clutter. The cursor may be placed on any trace and dragged around to provide precise value readout when required. Peak and valley finders as well as delta cursors are available at the click of a button. Activate the extensive report generation capability simply by clicking on the blue “Print” button (lower left). It’s easy to select which flights are displayed in each graph, and as many graphs as you like may be shown on your screen at the same time. Each graph may be sized and positioned as you like using the usual Windows mouse and keystroke commands. Many other display features are provided - too numerous to mention here (see user’s manual). The final area where the FlightSaver differentiates itself from the competition is its voice recording capabilities. No flight data recorder should ignore the wealth of information contained in the aircraft’s audio system. FlightSaver’s sophisticated display and intelligent human interface design allows this extended capability without overtaxing the pilot. It’s actually simpler to use than competing products with far more limited capabilities. Just a few minutes experimenting with the buttons will allow you to access the full range of the FlightSaver’s options. Mennen Avionics 1452 Owen Sound Drive Sunnyvale, CA 94087 408-736-8192 www.mennen.org 9 Electronics Intl. FP5-L King KI202 vor/loc indicator AirCheck Cockpit Recorder Icarus AltAlert Icarus NavAlert II Pine Mtn Checklist Injector Adv. Controls Sys. ACS2002 Insight TAS 1000 $848 $1,525 $499 $995 $1,595 $595 $3,950 $3,500 9 9 9 9 9 Elec. Intl. Mux-8A /w DRS18 9 9 9 9 9 8 $985 Shadin AMS2000 $895 0 .1 9 9 Shadin Engine Trend Monitor Shadin ADC200 $3,000 16 .1 9 9 $17,000 Shadin Digidata $3,100 7 .1 9 9 Shadin Digiflo-L JPI FS 450 $699 Display, maximum number of characters 84 8 Fuel flow resolution (gph) .01 .1 Fuel on board 9 9 Fuel reserve at Waypoint 9 9 Simultaneous display of above 3 parameters 9 Calibrated airspeed 9 True airspeed 9 Pressure altitude 9 Density altitude 9 Vertical speed 9 Altitude alert buffer (resolution in feet) 10 GMT display (gps synchronized) 9 Hobbs meter 9 Time-in-service meter 9 Voltage display resolution .01 Continuous recording of engine data 9 Continuous recording of GPS data 9 Continuous recording of air data 9 Cockpit communications recording (minutes) 256 Cockpit communications playback 9 Checklist recording capacity (minutes) 60 Checklist playback 9 Size of removable data storage (Mbytes) 256 Recording duration (hr) with 5 sec sampling 3000 Display of hottest cylinder 9 Display of second hottest cylinder 9 Graphical course deviation indicator 9 Graphical course correction indicator 9 Voice warning - assigned altitude alert 9 Voice warning - low voltage 9 Voice warning - low gyro vacuum 9 # of engine related voice warnings 10 Simultaneous plotting of engine/air/gps data 9 Advanced data cursoring & display expansion 9 TAS estimation from GPS data 9 Plotting of injector matching charts (GAMI) 9 Advanced hardcopy and report generation 9 Automated logbook entry 9 Data exporting to popular mapping software 9 $2,000 Mennen Avionics FlightSaver Street price $1,350 FlightSaver's competition: Price/Features 0 4 .1 9 9 0 0 4 8 26 9 9 9 9 9 9 9 9 9 100 0 200 10 .1 .1 9 9 9 9 9 9 9 150 200 100 9 9 9 .1 9 9 .1 9 9 12 9 5 9 9 .03 50 5 9 9 9 3 .1