1
J.2. STARS
APPENDIX J. ASTRONOMICAL PHENOMENA
blue2 .
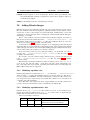
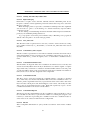
By splitting the light from a star using a prism attached to a telescope and measuring
the relative intensities of the colours of light the star emits—the spectra—a great deal of
interesting information can be discovered about a star including its surface temperature,
and the presence of various elements in its atmosphere.
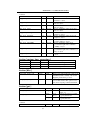
Spectral Type
O
B
A
F
G
K
M
Surface Temperature (◦ K)
28,000—50,000
10,000—28,000
7,500—10,000
6,000—7,500
4,900—6,000
3,500—4,900
2,000—3,500
Star Colour
Blue
Blue-white
White-blue
Yellow-white
Yellow
Orange
Red
Table J.2: Spectral Types
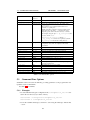
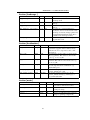
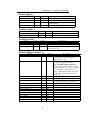
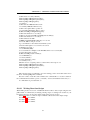
Astronomers groups stars with similar spectra into spectral types, denoted by one of the
following letters: O, B, A, F, G, K and M3 . Type O stars have a high surface temperature
(up to around 50,000◦ K) while the at other end of the scale, the M stars are red and have
a much cooler surface temperature, typically 3000◦ K. The Sun is a type G star with a
surface temperature of around 5,500◦ K. Spectral types may be further sub-divided using a
numerical suffixes ranging from 0-9 where 0 is the hottest and 9 is the coolest. Table J.2
shows the details of the various spectral types.
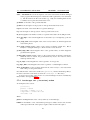
For about 90% of stars, the absolute magnitude increases as the spectral type tends to
the O (hot) end of the scale. Thus the whiter, hotter stars tend to have a greater luminosity.
These stars are called main sequence stars. There are however a number of stars that have
spectral type at the M end of the scale, and yet they have a high absolute magnitude. These
stars have a very large size, and consequently are known as giants, the largest of these
known as super-giants.
There are also stars whose absolute magnitude is very low regardless of the spectral
class. These are known as dwarf stars, among them white dwarfs and brown dwarfs.
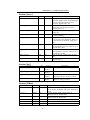
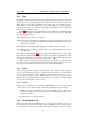
A luminosity class is an indication of the type of star—whether it is main sequence,
a giant or a dwarf. Luminosity classes are denoted by a number in roman numerals, as
described in table J.4.
Luminosity class
Ia, Ib
II
III
IV
V
VI
VII
Description
Super-giants
Bright giants
Normal giants
Sub-giants
Main sequence
Sub-dwarfs
White-dwarfs
Table J.4: Luminosity Class
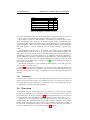
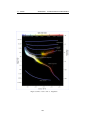
Plotting the luminosity of stars against their spectral type/surface temperature, gives
a diagram called a Hertzsprung-Russell diagram (after the two astronomers Ejnar Hertzsprung and Henry Norris Russell who devised it). A slight variation of this is see in figure
104