1
Manual
luafox Version 1.50
20th October 2012
2
Contents
Contents
1 Getting started.............................................................................7
1.1 Overview................................................................................... 7
1.2 History....................................................................................... 7
1.2.1 New features in luafox 1.50............................................... 7
1.2.2 New features in luafox 1.40............................................... 7
1.2.3 New features in luafox 1.30............................................... 7
1.2.4 New features in luafox 1.21............................................... 8
1.2.5 New features in luafox 1.20............................................... 8
1.3 Installing luafox.......................................................................... 8
1.3.1 Minimum specification....................................................... 8
1.3.2 Components...................................................................... 9
!lua..................................................................................9
!System............................................................................ 9
!ConfiX.......................................................................... 10
!luafox........................................................................... 10
!SpecialFX...................................................................... 10
!DrawPrint..................................................................... 10
1.4 Loading the program............................................................... 11
1.5 Configuration...........................................................................11
1.6 Virtual memory (introduced in luafox 1.40)...............................12
1.7 The Project Manager................................................................ 15
1.8 Undo & Redo (introduced in luafox 1.50)................................. 17
1.9 Objects.................................................................................... 18
1.9.1 Number........................................................................... 19
1.9.2 Constants.........................................................................19
1.9.3 Functions.........................................................................19
1.9.4 Scripts..............................................................................20
1.9.5 Tables.............................................................................. 20
1.9.6 Graphs.............................................................................21
1.10 Display options........................................................................ 23
1.11 Project Information...................................................................25
2.5.3 Clipboard................................................................................ 48
1.13 Multitasking............................................................................. 26
1.14 Loading luafox files.................................................................. 27
1.15 Importing data......................................................................... 27
1.15.1 Open document spreadsheets (ODS)..............................27
1.15.2 New Microsoft Excel Format (xlsx).................................. 28
1.15.3 CSV and TSV data files....................................................28
1.15.4 Batch import of CSV and TSV files...................................30
1.16 Drag & Drop............................................................................ 34
3
Contents
2 Table Windows......................................................................... 37
2.1 Table options........................................................................... 37
2.2 Table style................................................................................ 39
2.3 Changing values...................................................................... 41
2.4 Selections................................................................................. 41
2.5 Main toolbar............................................................................ 46
2.5.1 Saving............................................................................. 46
2.5.2 Printing (introduced in V1.20).......................................... 47
2.5.3 Clipboard.........................................................................48
2.5.4 Refresh............................................................................ 48
2.5.5 Insert sheets.....................................................................49
2.5.6 Copy sheet.......................................................................50
2.5.7 Delete sheet.....................................................................50
2.5.8 Split table.........................................................................50
2.5.9 Move sheet...................................................................... 51
2.5.10 Flip sheet....................................................................... 51
2.5.11 Transpose sheet............................................................. 51
2.5.12 Sort values..................................................................... 51
2.5.13 Apply a function............................................................ 52
2.5.14 Selection tool................................................................. 53
2.5.15 Invert Selection.............................................................. 57
2.5.16 Selection mode.............................................................. 57
2.5.17 Column and row buttons............................................... 57
2.5.18 Adding columns and rows............................................. 58
2.5.19 Copy columns and rows.................................................58
2.5.20 Delete columns and rows...............................................58
2.5.21 Reformat........................................................................58
2.5.22 Moving columns and rows............................................. 59
2.5.23 Flip column and row values........................................... 59
2.5.24 Clean table.................................................................... 60
2.5.25 Manual switching between column and row buttons..... 60
2.5.26 Line plot and bar chart...................................................61
2.6 Edit columns............................................................................ 61
2.6.1 Column tab......................................................................62
2.6.2 Format tab.......................................................................63
2.6.3 Header tab...................................................................... 64
2.6.4 Values..............................................................................64
2.7 Header.....................................................................................66
2.8 Search & Replace (introduced in luafox 1.50)............................70
2.8.1 Search............................................................................. 70
2.8.2 Replace............................................................................71
2.9 Table menu.............................................................................. 74
2.9.1 Sub menu: Table.............................................................. 74
2.9.2 Sub menu: Edit................................................................ 74
4
Contents
2.9.3 Sub menu: Selection........................................................ 75
2.9.4 Sub menu: Function.........................................................76
2.9.5 Sub menu: Mask.............................................................. 76
2.9.6 Sub menu: Plot................................................................ 77
2.9.7 Sub menu: Utilities........................................................... 77
2.9.8 Settings............................................................................77
3 Functions ................................................................................. 79
3.1 Applying functions................................................................... 79
3.2 Store results..............................................................................82
3.3 Data Manipulation....................................................................83
3.3.1 Count multiples (introduced in luafox 1.50)......................83
3.3.2 Data limits........................................................................83
3.3.3 Derive..............................................................................84
3.3.4 Integrate..........................................................................84
3.3.5 Normalize........................................................................ 85
3.3.6 Reciprocal........................................................................ 85
3.3.7 Round............................................................................. 85
3.3.8 Set................................................................................... 85
3.3.9 Subtract (introduced in luafox 1.21)................................. 87
3.4 Statistics................................................................................... 87
3.4.1 Cusum............................................................................. 87
3.4.2 Min, Max......................................................................... 87
3.4.3 Mean............................................................................... 87
3.4.4 Geometric mean.............................................................. 87
3.4.5 Median............................................................................ 87
3.4.6 Variance, Variance_empiric.............................................. 87
3.4.7 Standard deviation and Standard error, Skewness and Kurtosis
..................................................................................... 88
3.4.8 Sum................................................................................. 88
3.5 Fitting ..................................................................................... 88
3.5.1 Linear fitting.................................................................... 88
3.5.2 Polynomial fitting............................................................. 90
3.5.3 User defined functions..................................................... 90
4 Graphs... .................................................................................. 95
4.1 Save, Print and Refresh............................................................. 95
4.2 Curve and Bar style ................................................................. 96
4.3 Edit style.................................................................................. 97
4.3.1 Page settings................................................................... 99
4.3.2 Axis settings and limits................................................... 100
4.3.3 Ticks.............................................................................. 102
4.3.4 Additional lines, Zero line............................................... 105
4.3.5 Axis and tick labels......................................................... 106
5
Contents
4.3.6 Grid lines....................................................................... 111
4.3.7 Caption..........................................................................112
4.4 Line graph............................................................................. 114
4.4.1 Line and symbol style..................................................... 114
4.4.2 Filling............................................................................ 121
4.5 Waterfall................................................................................ 122
4.6 Error bars............................................................................... 124
4.7 Fitted data............................................................................. 125
4.8 Bar graph...............................................................................127
4.8.1 Alignment......................................................................127
4.8.2 Width............................................................................ 129
4.8.3 Bar order....................................................................... 129
4.8.4 Fill and outline style....................................................... 131
4.9 Quick switching of graph styles.............................................. 131
4.10 Edit curves........................................................................... 132
4.11 Graph menu........................................................................ 134
5 Lua expressions...................................................................... 135
5.1 Tables ................................................................................... 135
5.2 Numbers................................................................................ 136
5.3 AND, OR and NOT................................................................. 137
6 Credits... ................................................................................ 139
6
1.1 Overview
1 Getting started
1.1 Overview
luafox is an innovative software solution for efficient data analysis and presentation
under RISC OS. The graphical user interface makes it easy to learn and use the
program and allows performing complex analysis even without scripting knowledge.
luafox is based on the well-established programming language Lua and offers many
import and export formats, such as the OpenDokument format for tables. Lua is used
internally as scripting language of the program..
Comprehensive configuration allows you to adapt the software to your specific needs
and your work-flow. Self defined or default styles can be applied to graphs to change
their appearance with only a few mouse clicks.
1.2 History
1.2.1 New features in luafox 1.50
•
•
•
•
•
Multiple step Undo & Redo
Search & Replace
New function: Count multiples
Option to keep cell input field open
Improoved update of choices
1.2.2 New features in luafox 1.40
•
•
•
•
•
Support of vitual memory
File history
Reformat and Header dialog boxes offer to save settings as a script
New function: Set operations
Improoved user input handling
1.2.3 New features in luafox 1.30
• Import new MS Excel xlsx Format
• Batch import of csv files
• New function: Skewness and Kurtosis
7
1 Getting started
1.2.4 New features in luafox 1.21
• Choose a graph style before you plot the graph
• A new function allows you to subtract fix values or the minimum or
maximum value from a given data set
1.2.5 New features in luafox 1.20
•
•
•
•
•
•
•
•
•
•
•
a completely new graph type: Bar charts
support for printing
extended draw export
Extended automatic selections
fast switching between graph styles
add horizontal and vertical lines to your graph
support for the second x- and y-axis
add new curves to a graph or edit and delete them
invert selections
mask data
many bug fixes
The updated manual shows all new or extended features in this color so that you do
not need to search long for new features. This manual contains many screenshots
that belong to the description so that you can better follow the explanations and do
not need to sit in front of your computer while reading the manual (although it may
be a good idea to play around with luafox in parallel to get used to it more quickly).
Please note that not all screenshots have been adopted to the new version of luafox,
so don't get confused if there is an icon missiong on a toolbar which is present in the
program or on another screenshot of the same window. However, new screenshots
have been made at all places refering to a new feature.
1.3 Installing luafox
1.3.1 Minimum specification
luafox will run on RISC OS computers only. The minimum specifications are:
• RISC OS 4
• StrongARM processor (also in emulation)
• 8 MB RAM
• Screen resolution: 1024 x 768
• Latest freely available toolbox release (RISCOS Ltd. website)
Please note that the StrongARM processor is required not only because of its speed.
The program will not run on an ARM7 processor, real or emulated. If you are not sure
whether luafox will run on your machine please try the demo version first, which is
available from the luafox website. The program is 32 bit compatible and runs on the
Iyonix computer.
8
1.3 Installing luafox
1.3.2 Components
luafox requires some programs and modules to be installed before you can start using
it. All components are enclosed in the luafox archive; you do not need to download
other components than the toolbox modules, or, if you want to see anti-aliased
graphs, SpecialFX.
Before running luafox please install the following components:
!lua
!lua is a programming language which is needed to run luafox. Please make a
backup of your !Boot directory if you have installed a version of !lua before.
To install !lua, drag the !Boot directory on the system configuration for merging
the boot sequence.
This will install RiscLua 4.14 in !Boot.Resources. Please note that the core is
identical to RiscLua 4.14 from Gavin Wraith's website but the libraries have been
extended. luafox will not run with the version from the website. Please do not try
to use RiscLua 5.
You can also manually install !lua at another place but please make sure it has
been seen by the filer before trying to run luafox.
!System
Please use the system configuration to merge the !System directory. It looks very
similar to the configuration option for the !Boot directory. It will install two new
modules: TreeView and Tabs from Rik Griffin website.
9
1 Getting started
Drag the !Boot directory to the configuration window
!ConfiX
If you do not already have a recent version of ConfiX installed please add ConfiX to
your boot sequence. See the installation instructions inside ConfiX to find out how
to install it on your computer.
!luafox
To install luafox just drag it to a directory of your choice. Please make sure that the
path is not more than 200 characters long. The Data directory contains example
data files and can, together with this manual, be copied to any place on your
harddrive.
!SpecialFX
In order to display anti-aliased graphs and enable background blending of fonts
you can install SpecialFX.
!DrawPrint
To allow printing of tables and graphs luafox makes use of the !DrawPrint
applications which allows you to split large tables and print them on many sheets.
!DrawPrint needs to be seen by the filer before starting luafox. However, you do
not necessarily run !DrawPrint, it will be started and by luafox automatically and
closed afterwards.
10
1.4 Loading the program
Please note that !lua, !ConfiX, the TreeView and Tabs modules as well as the zip and
unzip applications and !DrawPrint are used by luafox with the kind permission of the
authors. Other than the !luafox application these components may be distributed
freely according to the license file of these components. When in doubt please
contact the authors of these components directly. Please also note that you did not
pay for the distribution of these packages.
1.4 Loading the program
After double clicking on the program icon in a filer window the Luafox icon
appears on the iconbar. Click with the left mouse button on the iconbar icon to
open the Project Manager on the left side of the screen. It is separated into
three main parts called Pinboard, Project and Favorites.
luafox will also starting up automatically if you double click a luafox or Open
Document Spreadsheet file.
1.5 Configuration
luafox allows you to adjust the behavior of the program to your needs. To configure
luafox use the iconbar menu:
Open Choices by using the iconbar menu
This will bring up the configuration window which is provided by the ConfiX tool,
which is not part of luafox itself.1 The configuration window should look like the
screen shot shown below.
The individual options are described in the relevant sections of this manual. All
options show a small help text when the mouse pointer is over them. Please note that
ConfiX allows a convenient way of saving profiles. These profiles allow you to change
all settings at once which might be useful if different task require different settings.
This is also useful if luafox is used by several users who prefer different settings2. To
save a profile use the menu and give it a name. To load a profile just click on the
"Profile" button of the configuration window.
1
2
The appearance of the configuration window depends on the settings you made for the
ConfiX tool. You can find the ConfiX tool in !Boot.Resources. Double clicking it will open
the ConfiX configuration window. It is recommended to use Graphical Tabs which is the
default setting.
If you are using RISC OS Select with several users the luafox choices are stored in individual
choices directories anyway.
11
1 Getting started
Configuration window
1.6 Virtual memory (introduced in luafox 1.40)
Since all versions of RISC OS except version 5 only allow applications to use 27MB of
memory and there is no system wide virtual memory there is the need to intruduce
virtual memory in luafox itself.
You can configure the use of virtual memory in the choices in section "more settings":
Set the options regarding the use of virtual memory
You can set whether or not luafox should use virtual memory. You should consider
using it if you are handling larger amounts of memory and you are not using a
computer with RISC OS 5 and a lot of RAM. You can set the path for the data files that
are stored by luafox if the memory limit is reached.
You can specify the maximum amount of memory luafox is allowed to use. If this limit
is reached luafox will start to store data on disc. Please note that this will slow down
luafox since access to a harddrive is much slower than accessing the RAM. So do not
12
1.6 Virtual memory (introduced in luafox 1.40)
set the value to low. On the other hand, since RISC OS allows only 27MB of
application space you should set it to value below 27 MB because the memory limit is
an estimation and not an exact value. So under certain circumstances luafox may use
a little bit more memory than specified in the configuration. So we recommend a
value between 10MB - 20MB.
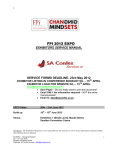
Overview of the virtual memory usage
Please note that you must restart luafox as soon as you changes this values.
Otherwise the memory management of luafox may be damaged which may lead to
loss of data.
The rest of this section is only interesting for advanced luafox users who would like to
know more about the virtual memory system luafox is using:
luafox will always store whole columns on disc. But one column can be split into
several data files if the column exceeds a certain size. Every file is called "Virtually
Memory Package" or short VMP. The size can be set in the field "Expected column
size", see the configuration window. If the data you are using always has the same
number of lines then you can optimise the virtual memory system by entering this
typical column size here.
From the iconbar window you can always have a look of the current memory state.
The first entry tells you how much memory the lua code it using. Please note that this
is only the size of the code itself and does not include the toolbox windows and
sprites used in the application. So this value will always be lower than the value
shown in the task manager. Also lua itself will optimise its memory usage
automatically. So if you are following the value (it only get's updated if you reopen
the window) you will see that it rises for some time and then drops to a low value
again. This is normal and should be nothing to worry about.
The VMP limit shows how many VMPs may be in memory at a time. This value is
influenced by the maximum memory to be used as specified in the main
configuration. If the column size is lower than the "expected column size" set in the
configuration than the number of VMPs is identical to the number of columns used by
luafox. In the above example a max. memory usage of 10MB and an expected
column size of 100 allow 1125 colums to be in memory at the same time.
The "VMP total" field contains the number of VMPs currently used by luafox. If this
value is lower than the limit then all data is held in memory. A higher value means
13
1 Getting started
that some data has been temporarily stored on disc. At the bottom of the window this
is also shown graphically. If the yellow bar is filled up completely luafox starts to use
virtual memory.
"VMP memory" shows how many VMPs are currently in memory. "VMP size" just
shows the configured value. "ID total" shows the number of columns that are used by
luafox.
14
1.7 The Project Manager
1.7 The Project Manager
The Project Manager is separated into three sections: Pinboard, Project and Favorites
The Project Manager holds all the different objects (Tables, Graphs,...) of a project. It
allows you to copy objects, rename and delete them. All objects can be moved and
copied between the three sections of the Project Manager: Pinboard, Project and
Favorites.
The Project window contains all the objects that belong to the current project. The
content is saved as luafox file if you press the disc symbol in the toolbar at the top.
Save the project as luafox file by clicking the disc
symbol in the toolbar at the top of the project
Manager
15
1 Getting started
The Pinboard is a place where objects can be stored temporarily. They are not saved
in the luafox file. The Pinboard can be used for items that are used only once. It helps
you to keep the project file clean. Do not forget to move important objects to the
Project window before closing the application, otherwise they will be lost.
The Favorites window contains objects which are often used. The contents of the
Favorites window is saved with the application and is always available again after
starting luafox. It is not saved with the Luafox file. Remember to copy all relevant
objects into the Project section before saving, if you intend to distribute the file to
other people or use it on another machine.
The window size can be changed by dragging the grey separator bars between the
three sections.
The file history gives an overview about all recently changed projects and allows you
to change quickly between projects and exchange data using the pinbaord.
The file history (introduced in luafox 1.40) lists all project files that have been saved
before. This makes it easy to continue working on a project without the need to open
its directory. Also it allows you to switch between a number of projects very quickly.
Since all the data of a project is always stored in the Project section you can place a
number of tables, numbers, scripts etc. in the Pinboard, switch to a new project and
copy the objects back from the Pinboard to the Project. This is a very easy way to
exchanges objects between different projects.
To open the filer window containing the current project click Adjust on the save
project icon.
In the main configuration you can set a few related settings. You can define the
maximum number of files in the history. You can also specify the number of days after
which the used files are forgotten so that you do not pile up a stack of old project
files.
The last option specifies whether changes in the current project are saved
automatically if you switch to another project file. It has the advantage that you are
not always ask whether you would like to save the data when you switch to another
project. On the other hand you may save a project in a state you do not want to be
saved.
16
1.8 Undo & Redo (introduced in luafox 1.50)
Configuration for the file history
1.8 Undo & Redo (introduced in luafox 1.50)
luafox supports multiple undo & redo, so that all unwanted or accidental operations
can be undone. To undo an operation just press on the left red arrow in the toolbar
of the Project Manager. If you want to redo the action click on the right green arrow.
It is also possible to undo more than one step at once. Just click on the undo list icon
bewteen the arrows to get a list with all previous operations. Please note that clicking
on an entry will undo all operations above the entry as well. All undone operations
will appear grey in the list and show you which operation will be redone when
clicking the green arrow.
Undo & redo buttons in the Project Manager
It is also possible to reach undo and redo from the project manager menu tree or by
pressing F8 (undo) or F9 (redo) when the table window has the input focus. The
maximum number of operations that can be undone is defined in the luafox main
choices dialog.
17
1 Getting started
Accessing the undo & redo function using the menu tree
Set the number of undo steps in the configuration
1.9 Objects
Objects are stored in the Project Manager. You can add an object by loading a file
(e.g. import a CSV file) or by using the menu of the Project Manager.
Project window showing different objects types
18
1.9 Objects
Some of the objects are described here only very briefly. A complete description can
be found in the chapters dedicated to some of the object types.
1.9.1 Number
An Number object simply holds a number that can be user defined or may be the
result of a calculation. Double click on a Number object to change the number or its
name. Click ok or drag the number icon to the Project Manager to add it there. In
some writeable fields you can access the number by using the variable name:
n.<name>, e.g. n.result.
Change the name or value of a number object
1.9.2 Constants
luafox contains a predefined set of often-used scientific constants. If you open the add
constant window you will find a menu which lets you choose between all the known
constants. If you choose a constant, the numeric value, its unit and a short description
are shown. Click ok or drag the constant icon to the Project Manager to add it there.
In writeable fields you can access constants by using the constant name c.<name>,
e.g. n.me for the electron mass.
Add a scientific constant by choosing it from a menu
1.9.3 Functions
luafox contains a number of scientific and mathematical functions which you can
choose from the list. It is also possible to define your own functions. You can add
Functions to the Project Manager using the menu. They can be dragged to Table
objects or Table windows to apply the function to the data. You can also define your
own functions and edit them later. Built-in functions cannot be accessed or edited by
19
1 Getting started
the user. Functions are described in detail in a separate chapter.
Use the menu structure to add a new function
1.9.4 Scripts
If you often want to perform the same operation, save the settings
in the form of a script file that can be applied to other objects
Some tools and functions need several settings to be made before they can be applied
to a table or selection of data. A script allows you to store these specific settings and
keep them as an object in the Project Manager. To add a script, just drag it to one of
the Project Manager windows. Dragging it from there onto a specific object in the
Project Manager will apply the script to it.
This is a very efficient way to perform often used tasks.
1.9.5 Tables
Table objects are used to store the data. A Table object can contain more than one
sheet. If you open the add table window a number of parameters can be set. All of
these parameters can be changed later. You need to specify how many sheets the
table has, how many columns and rows each sheet has and what values to fill in.
20
1.9 Objects
The value field can be left black. You can also enter a number here, or use one of the
following variables. The variable x contains the current column. If you enter x in the
value field the first column will be filled with the number 1, the second with 2 and so
on. Use y to insert the row number and z to insert the sheet number. Also strings can
be inserted by using quotes. Try e.g. the following: "Cell("..x..","..y..")".
Add a new table by specifying the name and the number of sheets, columns and
rows. The value field can contain a number or an expression using x,y,z.
The program is written in the programming language Lua and its internal scripting
language is also Lua. Therefore you will find the Lua syntax at different places in the
program. Here the two dots .. are used to concatenate a number of strings. Although
x and y are numbers they can be concatenated to strings - this is handled
automatically by Lua.
In this writeable value field you can also access numbers and constants. It is also
possible to access other table cells. To do this, use the syntax:
Tablename[sheet][column][row].
If you create a new Table object a new icon will be added to one of the Project
Manager windows. Whether the table window opens automatically depends on the
program settings.
Tables with more than one sheet appear in the Project Manager with a small + sign
next to them. If you click on the + sign the sheets of the table will also be shown in
the Project Manager. You can rename the sheets by using the Menu. One of the
sheets will be the active sheet of a table. This is the sheet which gets shown if you
double click on the table object icon to open the table window. A double click on one
of the sheet icons will set this sheet as the active sheet and show it. The active sheet
also plays an important role for drag & drop actions.
1.9.6 Graphs
Graph objects represent graphs. To create a graph you usually select some data
columns in a Table window and create the graph by clicking on the line or bar graph
button.
It is also possible to create a new graph from scratch. From the menu just select Add
new -> Graph... and a dialog box appears. Here you need to enter a name, a graph
style, the type of the graph, e.g. Line graph and its Sub type, for example "scatter".
Afterwards the x and y data needs to be added by the menu or manually. A click on
the OK button will open the graph.
21
1 Getting started
A detailed description of making graphs can be found in the dedicated chapter.
Dialog box to add a new graph
The Project Manager menu also contains an entry to change an object or a selection
of different objects:
Change a selection of objects by using the menu
If different object types are selected, objects can only be copied, moved and deleted.
It is also possible to move or copy objects to one of the other windows by drag&drop.
The left and right mouse buttons define whether the object is moved or copied. The
mouse button actions can be defined in the configuration.
Object menu showing information about a table
If a single object is selected it is possible to show more information. As shown above
the info field displays information about a table: The number of sheets and the x
22
1.10 Display options
(columns) and y (rows) dimension of the first sheet. Individual objects can also be
renamed. For certain object types more specific options become available, e.g. table
sheets can be set active or functions can be edited. Often this additional option can
also be reached by double clicking the object.
Menu item to select all objects or clear the selection
The Project Manager menu also offers the option quickly to select all objects or clear
the current selection.
1.10 Display options
luafox uses the treeview toolbox gadget to display all objects. You can set several
display options by using the first menu entry:
Use the menu to set display options for the Project Manager
You can specify which types should be shown. It is possible to display lines between
the objects to show their relationship. Objects can be ordered by name or type and
the order can be reversed. If you click on the option to expand or collapse all nodes
the display of table sheets is changed. If collapsed only the main table icon with a "+"
sign next to it is shown, otherwise all sheets are shown as in the screen shot above.
23
1 Getting started
Set some options that influence the display of table nodes
If you are working with several tables that contain more than one sheet it is useful to
set some active window options. The active window is the table window with the
input focus. It is possible to scroll the Project Manager window to a position that
shows the node that belongs to the active window. This is only necessary if there are
so many objects in the Project Manager window that it is not possible to show all. The
second option will expand the active window node so that its sheets become visible.
If the third option is ticked the sheet nodes of other table windows are hidden when
the input focus changes from one to another table window. All these options can also
be set in the main configuration:
Choices window to set the display options for the Project Manager windows
24
1.11 Project Information
1.11 Project Information
The project information window can be opened by clicking on the toolbar or using
the Project Manager menu.
Project information icon indicating that the information window is open
Use the project information window to change important settings of the current
project, such as the name of the current project. The path of the luafox file or the
default save path is shown in the second field. The third filed contains the name of
the creator; this is the initial author. The date field shows the date of the initial
creation of the file. In the author field you can specify the name of the current author.
You can save the author's name in the configuration. It is possible to save several
keywords inside the luafox file to provide further information. It is also possible to
leave a comment. This is especially useful if you save a lot of data files or exchange
the files with other persons.
Project information window
luafox configuration: Project information
25
1 Getting started
The name of the main author and of possible co-authors can be set in the
configuration. It is also possible to specify there a number of standard keywords there
which you would like to include in every luafox document.
1.12 Clipboard
Table columns, rows and blocks of data can be copied to the clipboard as described
in the table section. If there are some data in the clipboard it is possible to paste these
data into a new table by using the menu.
Use the clipboard menu to paste the data as a new table,
transpose the data or delete them
The menu also offers the option to transpose the data so that columns and rows are
exchanged. This might be useful if you copy a data column and you would like to
paste it into another table as a row. To save memory it is also possible to delete the
content of the current clipboard.
1.13 Multitasking
luafox supports internal multitasking. It can execute several operations at once. So
while a complicated calculation is running in the background it is still possible to
continue using luafox and to manipulate other data tables.
Project Manager toolbar indicating that the task window is open
You can open a task window that shows the progress of current tasks:
Task window with three tasks executing at once
In the top section, which is also visible if there are no current tasks, the total number
of tasks being executed is shown. Below, a list of tasks is shown and a small
description is given. Note that the total number of tasks can be higher than the
26
1.14 Loading luafox files
number of items in the list. This is because some functions may open a dialog box and
wait for the user to press the OK button. Here a progress bar makes no sense and so
it is not shown. The second display field in the top part shows the progress of a task,
if it reaches 100% then all tasks are done.
Current tasks are not only shown but they can also be influenced.
If one or several tasks are selected you have four options:
• Stop: Stop the selected tasks
• Pause: Pause the selected tasks. Usually the progress bar is shown in red. If a
tasks is paused then it turns to gray
• Play: Click to continue with any selected task. The progress bar will become
red again
• Fast Forward: If you select one task and click the fast forward button only
this task will be executed until it is finished. Then all other tasks continue
automatically. Note that it does not speed up the calculation of the task if
there is only one.
Please note that not all tasks use multitasking or show a status bar.
1.14 Loading luafox files
To load a luafox file (filetype &ab7) simply double click it or drag it to the
iconbar or the Project Manager. A luafox file is basically a compressed zip file
containing a number of directories and an index and meta file. This allows you
to recover data from a broken file or, for example, access the tables as ODS files or the
graphs as draw files (if luafox has been configured to save draw files) on machines
where luafox is not installed. The disadvantage is that it takes longer to open and
save luafox documents because all files need to be zipped or unzipped.
Inside a luafox file there are directories for every object type. The table directory just
contains a number of ODS files as used e.g. by Open Office. The number and
constants directory contains a text file with a list of all used numbers and constants.
The function directory contains a text file for every function, and for user defined
functions also the script. The graph directory contains a new directory for every
graph. Inside you can find the graph style, the plotted curves and further settings like
the zoom level. There may also be a draw file of the graph which makes loading
faster. Please note that a graph can only be loaded if the data file is also present. So if
you create a graph, and delete the table which contains the data, then the graph still
exists in the Project Manager. It is also saved inside the luafox file but it is not loaded
anymore because the data points are not saved within the graph, but only linked to a
data table, and so that the graph cannot be updated anymore.
1.15 Importing data
1.15.1 Open document spreadsheets (ODS)
luafox uses the open document format to save tables. The open document
format is an open and well documented format that is used by a variety of
applications. The best known is the freely available Open Office.
27
1 Getting started
If a luafox table is saved in the ODS format and loaded back into luafox, all settings,
headers and column expressions will be recovered. This information gets lost when
the table is opened with another package and saved again in the ODS format.
Tables saved by luafox can be read by Open Office without further steps. Some
additional information is saved in the table and shown by Open Office: The column
type (X,Y,...), Header values and expressions to calculate column values. These are
shown as part of the data table since Open Office does not have the header concept.
It is possible to import certain open document spreadsheets. The import is limited to
the capabilities of luafox. In particular some data types, styles and formulas cannot be
imported. luafox tries its best to import the data from spreadsheets.
1.15.2 New Microsoft Excel Format (xlsx)
(introduced in luafox 1.30)
Microsoft introduced a new file format for its office programs some time ago,
which is completely different from the old format. Like the ODS file format any
xlsx file is a zip directory containing a collection of files which describe data
tables as well as formulars, graphs etc. luafox will import the data of xlsx files, no
formulars, graphs etc are supported. To load an xlsx file just drag it to the Project
Manager. The RISC OS file type is &a7f. You may also be able to import files with the
DOS extension xlsm, which is basically an xlsx file including macros - of course the
macros themselfs are not supported.
1.15.3 CSV and TSV data files
Data can be imported from almost every data handling application in CSV format. It
can then be imported into luafox by dragging a CSV (comma separated value) file to
the Project Manager. An Import window will pop up which allows you to specify how
the CSV will be imported. At the top you can set whether all columns and rows
should be imported or only part of the file.
In the middle section you can define the header of the CSV file. Often CSV files
contain some information about the data before the actual data. If you choose no
header, then the whole file will be interpreted as data and every value will be put into
the table. You can also set a specific number of header lines, if you know how many
lines should be handled as header. Another option allows the program to recognize
the beginning of the data section by the first empty line. Everything above the line
will be treated as header, everything below as data. The default setting is the last
option which tries to recognize the data by comparing the character at the beginning
of the line. Often the header contains words and the data consists of numbers. So the
program starts to import the data when it finds the first line that starts with a number
(quotes are ignored). You can choose whether the header lines are imported and
shown in the Table window, or whether the header is ignored.
28
1.15 Importing data
Import of CSV files
The CSV file is analyzed before the options window appears. If the automatic
recognition is wrong you can specify which character is used to separate the values
from each other (comma, semicolon or tabs) and which is used for line feeds. Also
you can set an option to ignore empty lines that may appear in the file.
Some general settings can also be made in the main choices. The first option lets you
choose whether graphs are saved as draw files inside the luafox file. This will increase
the size of the luafox file but loading luafox files will be much faster since the graphs
do not have to be created again. Instead the draw file is loaded and used until the
refresh button is pressed.
Import and export settings
The default save path contains the place where you want to save the project file by
default. The buffer size specifies how much data is read at once when importing CSV
files. A large buffer will make loading faster but multitasking or responsiveness of
29
1 Getting started
luafox and the desktop will slow down. You can also set here the default CSV
separator, that is the sign that separates the values inside of a data file. You can use
this if the files you import always have the same structure. You can also set the default
number of header lines.
1.15.4 Batch import of CSV and TSV files
(introduced in luafox 1.30)
Often the data you would like to import is spread over several files. So there may be
50 files all containing one x and one y column. The batch import tool helps you to
load all the data files at once and merge it for example into a single table. If you have
only one data file there is no need to use this tool, just drag it to the Project Manager
as described in the paragraph above.
To open the batch import window click on the open directory icon just next to the
save icon. Drag all data files you would like to import on the scroll list, the total
number of files is shown towards the bottom of the window. The files will be
imported in the same order as they have been dragged onto the scroll list. In a
moment we will see how the order can be changed.
Below the scroll list there are two more options which determine how to import the
data files. You have the option to import them as individual tables. In our example
shown above you would end up with 35 tables. The second option will import them
as sheets of one table. So in the end there will be one table containing 35 sheets. The
third option will create only one sheet and import the data as columns. If every file
contains two data columns you will create a table with 70 columns. The default
choice can be set in the main configuration as shown in the configuration window
(previous paragraph).
Window for batch import of data files
The second option lets you choose where you would like to import the table, e.g. in
30
1.15 Importing data
the Project window. Finally, to import the files just click on the Import button. Details
are given below.
Please note that all files in the scroll list, not only the selected ones, will be imported.
The batch import dialog box allows you to manipulate the list in a few ways. First of
all, with the "Full path" option you can show the full path of the files. If all files are
stored in the same place only the file name may be important but if you wish to
display the full path just select this option.
There may be situations where you only need to import a special selection from a big
pool of data files. The filter function lets you select a subset of the entries in the scroll
list in a very flexible way.
There are two filter options, one simple and a more advanced one. In the simple
option you can just enter a phrase which should be part of the items to be selected.
You can also choose whether the string can be anywhere in the filename (or path,
see below) or just at the beginning or end of it.
Please note that the filter will work on the filename or path as currently shown in the
scroll list. So it will make a difference whether the "Full path" option is ticked or not.
Imagine that the you have a series of diretories which contain the date, e.g.
201108xx where xx is the day. If all directories now contains a data file with the same
name like 'info', you need to show the full path first and then apply the filter to it
since the filenames themselfs are do not differ.
Use the filter to select all items in the scroll list that match certain criteria
Use the second option to patch a given pattern. It uses the wildcards lua itself
provides. Please refer to a lua manual for the full options available. If you enlarge the
filter window the most commonly used wildcards are explained shortly. As an
example data%d%d will filter all files containing the sequence 'data' followed by two
digits. The list shows which wildcard will represent which group of letters or symbols,
for example %s for space characters. If you use a capital letter the complement will be
matched. So %D will fild any character except digits. For example to make sure only
numers with two digits are found you could change the pattern into 'data%d%d%D?'.
As you can see there is a question mark at the end of the pattern. That means that a
31
1 Getting started
character behind the two digits is optional. So the file 'data53' will be selected, but als
'data53B' but not 'data531'. Use '+' if the character may appear once or more in the
file name. So 'data%d+' will find all files containing 'data' followed by any number or
digits, but there must be at least one digit. Use '*' if the digit can also be missing.
Advanced filter options using pattern matching
If the wildcards are not precise enough you can also define your own subset by
setting square brakets around a given set or characters. So 'data[56]+' will only match
filenames that contain data followed by any sequence of the digits 5 and 6: 'data55',
'data6', 'data5565' etc.
Use a for loop to select files containing a certain number range
With the option to use a for loop you have an additional way to select a number of
files. You can specify a start number, an end number and a stepping. Shown here is a
way to select all files from 'data47' to 'data51'. Just place the wildcard '%k' at the
32
1.15 Importing data
place of the number given by the for loop.
The second button on the right hand side lets you sort the files shown in the scroll
list. Click with Select to sort the files in alphabetic order, click with Adjust to sort them
in descending order. If the file names of you data files are "data1", "data2", "data3" ...
"data10" then you encounter the problem that the files will be sorted in the wrong
numeric order: "data1", "data10", "data2", ... To avoid this tick the "Num sort" option.
You can select several files of the scroll list and remove them from the list by clicking
on the remove button. The invert button will invert the selection as expected.
Together with the filter option this is a powerfull tool. Click with Adjust on the invert
button to select or deselect all entries. The last button will remove all entries from the
list.
If the scroll list contains all the files you would like to import click on the import button
and the first file will by analysed and the CSV-import window will pop up. This
window is well known from the previous section about importing CSV files. You can
also use all options as described above. This dialog box will only appear once, for the
first file. All the option will be used for all the files in the list. That means that the
batch import function only works for files which have the same structure. All files
should have the same number of columns, rows and headerlines, otherwise the result
may not be as expected.
CSV-Import window for batch import
There is a new option regarding the batch import: Import the first column only of the
first file. Often data files contain one X and a number of Y columns. If they all belong
to the same series of measurements the X column will often be the same in all files. So
there is no need to import it more than once. The additional X columns are probably
unwanted. So when you tick this option the first column will be imported only when
the first file is processed. All following files will start with the second column.
33
1 Getting started
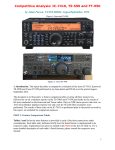
Result of batch importing three files as columns of one sheet
The screenshot contains the data window showing the result of batch importing
three CSV files. Each file contains two columns, one X and one Y column. It was
imported as columns of one sheet and the option to import the first column only of
the first file was ticked. You end up with a table containing only one X column which
is ideal to plot the data or further analyse the data.
1.16 Drag & Drop
luafox supports Drag & Drop operations to make the program more intuitive. You can
drag objects from one Project Manager window and drop in into another one. By
default, using the left mouse button (Select) will move the object, using the right
button (Adjust) will make a copy of the object at the destination position. The
behavior of the mouse buttons can be changed in the program settings ("Move
objects with").
Drag & Drop also works with the icons that indicate the sheets of a table. You can
drag a sheet of a table to a Project Manager window to move it from the initial Table
object to the new place. It will appear as a new table there. Note that if you move the
sheet with the left mouse button it will be missing in the initial or source table
afterwards. Use the right mouse button to create a copy of the sheet in the Project
Manager.
The other way also works: you can add two tables together. By default an options
window will open if you drag one table object (the source object) onto another one
(the destination object). There you can specify a lot of settings:
1. If you drag the icon of a table (the source table) and it has more than one sheet it
is not initially clear which sheet you would like to append, for example, to the
destination sheet. You can choose from the first, last or the active sheet or all sheets.
34
1.16 Drag & Drop
Settings for drag&drop operations
The default setting is to use the active sheet, which is the sheet currently shown in the
table window belonging to the source icon. If you drag a sheet instead of the table
icon, it is clear which sheet to use and so you cannot set any source options.
2. The current operation option shows whether the source table will be moved (it
disappears afterwards) or copied. Which option is preselected depends on the mouse
button used as described above.
3. If the destination table has more than one sheet you can also set which of the
sheets is used as destination sheet. Again you can choose from first, last, active or all.
If you drag the table to a sheet icon the destination options are grayed out because
the destination sheet is already fixed.
4. You can specify where the result is stored. The default setting is to append it to the
destination sheet. Alternatively you can replace the destination sheet with the result
or you can save it in the Pinboard.
Options window for table operations
35
1 Getting started
5. The operation can be set here. By default the source table is left as is but it is also
possible to add it to the destination sheet or subtract the source sheet from the
destination sheet. Use this option if you want to add or subtract the values of two
tables.
By default the source table will be appended to the destination table. You can change
the behavior in the program settings so that no option window will be opened but
the favorite operation will be executed instead. By holding down the Alt key the
option window will always be opened. This way you can configure a default
operation that will be applied in most of the cases. If there is an exception just hold
down the Alt key to open the options window which lets you handle the exception
easily.
The same is true for functions. They can be applied to whole tables by dragging the
function object onto a table object. Here too you can specify in the options window
to which sheet the function is applied and where to store the results.
36
2.1 Table options
2 Table Windows
A typical table window in luafox
To open the Table window double click on a table object. Above the data table there
is a toolbar which contains all the important functions to manipulate the table and its
values. At the bottom of the Table window there is a second toolbar which allows you
to switch between sheets. You can just go to the next and previous sheet by using
the arrow buttons or choose a sheet from the menu. You can also double click on
another sheet of the table in the Project Manager.
The current zoom can be set by the slider, the writeable field or the scale window
which opens if you click on the menu button.
2.1 Table options
You can configure the table size and appearance in the main configuration. The first
option defines whether the tablewindow opens as soon as you create or load a new
table. You can set the default zoom of a table and the window width and height. This
is the minimum value that becomes important if you have a table with only a few
columns or a low zoom factor and you still want to access the whole toolbar.
The cell width and heights define the default size of the data cells. The column width
can be set individually for every column of a table. The height can only be set at this
place.
In the second configuration section it is possible to set the default number of sheets,
columns and rows for a new table or a new sheet. Also a default value can be
specified here. You can use x,y and z to calculate the cell values or enter another
expression such as rnd(100) to fill the cells with random numbers.
37
2 Table Windows
Configure size and value settings of tables
You can specify whether you want to open a new dialog box when you insert new
sheets into an existing table:
This dialog box appears if you insert new sheets into an existing table and the
configuration option to open the dialog box is ticked.
If you insert a new sheet into an existing table there are two default settings for its
initial size: either it uses the default values as specified for new tables in the
configuration or the number of columns and rows of the current sheet is used. In the
dialog box you can switch between both options. Which one is the default setting
can also be defined in the configuration using the option "Size of new sheets".
38
2.2 Table style
If you tick the "Always use this setting" option this dialog box will no longer be
opened by default. This allows you to add sheets more quickly without the need to
confirm the settings every time. However, if you want to open the dialog box in one
case just hold down the Alt key while you press one of the buttons to insert a new
sheet.
In the last section of the configuration window you can choose the default selection
mode and specify whether you would like to lock this mode by default.
2.2 Table style
The appearance of the table can be configured in many ways.
Configure the table style
You can set a default column data type and the number format that defines how
numbers are shown in the table window. Using the main configuration also allows
you to set the font and font size. All tables will show the same font and font size; they
cannot be specified individually for different tables.
There is an option to redraw the toolbar icons. Some versions of the toolbox, which is
used to display icons and windows as well as other desktop objects, do not redraw
the icons correctly so this has to be done by luafox. These problems have been solved
in newer versions supplied with RISC OS Select. If the setting is set to "Auto detect"
luafox will not try to redraw the icons by itself on RISC OS 6. You can try to set it off
and see whether the orange background, which appears when a button is pressed,
will remain after releasing it.
39
2 Table Windows
Toolbar with and without faded background
The rest of the settings influence the coloring of the table window and toolboxes. You
can choose whether you want to display a faded background in toolboxes or use the
default background of the desktop.
Note that the faded background may slow down redrawing on older machines.
With the other settings you can adjust luafox to your desktop theme:
Use the table style settings to adjust the appearance of luafox to your preferences of
your favorite desktop theme.
Hint for advanced users using RISC OS Select who know how to use ResEdit: The
color of faded icons depends on the window background. If you change the
background of the toolbox windows of the Res file inside luafox (please make a
backup copy first) to a color that closely matches the colors used in the toolbox, faded
icons really look amazing.
40
2.3 Changing values
2.3 Changing values
To change the value of a cell just double click on it, and the toolbox at the top will
open a writeable field where you can enter an expression. Note that the expression is
always calculated immediately and not stored inside the field as in a spreadsheet. You
can access other objects (numbers, constants, tables) from here as well as entering a
number, string. Also x,y and z are defined as columns, rows and sheets respectively.
To accept a value press enter or click on the green tick next to the writeable field. If
enter is pressed the entry marker (red box) is moved to the field below the current
one.
Use tab to jump to the right instead, or shift-tab to go to the left. You can also use the
arrow keys if you keep the ctrl key pressed (up and down also works without ctrl key).
Change table values by double clicking them
Next to the writeable field there are three more icons. The red x can be used to omit
the changes. Pressing the Escape key has the same effect. There are also two
clipboard icons that can be used to copy the current value into the clipboard or paste
it from the clipboard. This can be used to copy a value quickly from one cell to
another. On the left hand side of the writeable field is a button to keep the writeable
field always open, even when no cell is selected (indtroduced in luafox 1.50).
2.4 Selections
You can select a column if you click with the left mouse button on the top of it. Select
a number of columns by pressing the mouse button on top of a column and move it
to the left or right while keeping the mouse button pressed. The window will move if
you drag beyond its edges. Alternatively you can use the right mouse button (or left +
ctrl key) to add individual columns or a number of columns. To select columns in a
large table select the first column by clicking on it. Use the window slider to move to
the last column you want to select and hold down the shift key by clicking with the
left mouse button on it.
41
2 Table Windows
Click a mouse button and drag to select columns, use Adjust to add more columns
1. Click and drag to select a number of columns you want to move
2. Click on one of these columns and drag it to move it inside the sheet
If you click and hold a column that is already selected you can move the data. If you
drag it to another position in the table the columns will be moved there. If you drag
to the Project Manager the data will either be moved or copied into a new table,
depending on the mouse buttons used. Note that you can specify a different mouse
button for moving data around from that given inside the Project Manager in the
program settings.
42
2.4 Selections
Define the mouse button for copying and moving selection in the configuration
You can also use the small table icon in the bottom toolbox to save a copy of the table
somewhere. You can also drag it to the four insert sheet buttons in the main toolbox,
e.g. to append a copy of the current sheet to the table. This is very useful if you want
to change the data in the table but want to keep a copy of the original data. Note
than you can also drag it to the insert sheet buttons of another table window to insert
the current sheet there.
Move the table icon to the Project Manager or one of the "Insert sheet" icons
Note that everything described above is also valid when dealing with rows. You can
select rows in the same way and also use drag & drop to move or copy them.
It is also possible to select a block of data if the drag starts in the main part of the
table. A block selection can also be copied to the Project Manager.
Click with the left mouse button in the corner of the table to select it as a whole. Click
with the right button to deselect the table. You can remove the current selection by
right clicking in the main table.
43
2 Table Windows
Use these buttons to set the selection mode
If you select columns, rows or blocks of data you will notice that the selection mode
changes. Usually the selection mode will be identical to the selection you made. If you
select a number of columns, the selection mode will be set to columns and change to
rows once you select rows. The selection mode does not show what you have
selected but instead defines how the selection will be treated when a function is
applied to it.
If the selection mode is not locked it will change according to the selection made
44
2.4 Selections
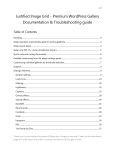
A good example is the sort function. Let's assume that there is a number of columns
selected and the selection mode is also set to columns. The sort function will now sort
the values of the columns individually. If the same columns are selected but now the
selection mode is set to "block", the sort function behaves differently. Now the data
values of the columns are treated as one block of data and sorting will also exchange
values between columns so that in the end e.g. the first selected column will contain
the lowest values of all previously selected columns. The sort function is described in
more detail in a separate section.
In all cases shown, five columns are selected. Depending on the setting of the
selection mode the sort function works differently
To avoid the automatic changing of the selection mode you can lock it. Now you can
change it only manually. Changes to the selection mode do not only affect the sort
function but also all mathematical functions applied to the table.
45
2 Table Windows
2.5 Main toolbar
Paste
Print
Copy
Refresh
Save
Cut
Selection mode
Delete sheet
Copy current sheet
Split table
Transpose
Flip vertically
Flip horizontally
Insert new sheet
Move sheet
Insert new column
Move column
Reformat sheet
Flip Selection
Invert Selection Toggle between Copy column
Columns/ Rows
Delete column
Delete empty columns
Selection tool
Sort values
Apply
function
Bar Chart
Line graph
Overview of the main table toolbox
The main toolbar contains several icons to change the table object or its values. The
colors in the icons have a special meaning. Blue will always add something. Yellow
will copy and red will change the table or the values and green will move or reorder
the values.
2.5.1 Saving
Use the save button to open the save dialog box and drag the icon to a filer
window to save it. The table will be saved in the open document spreadsheet
(ODS) format. Clicking Adjust will open a filer window of the current project
path. Use the Table menu to export data in the CSV, HTML or Draw format.
You can export tables as CSV, HTML or Draw file
The CSV and HTML export options will only save the data values. These formats do
not recover any styles and formulars used in the original table. The save dialog box
allows you to save only the selected data.
Exporting a table in draw format has been enhanced in luafox 1.2: The numbers of
rows and columns can be limited. It is also possible to in- or exclude x and y labels as
well as the currently shown header lines. Tables can be exported either in black and
while or with the colors defined in the current table style.
46
2.5 Main toolbar
Export a table as draw file
2.5.2 Printing (introduced in V1.20)
For printing luafox uses the excellent !DrawPrint application which is supplied
with it thanks to the kind permission of the author. When the print button is
pressed a dialog very similar to the draw export dialog is shown. This is
because a table is converted into a draw file which is then send to the !DrawPrint
application. !DrawPrint does not have to be started before you try to print but needs
to have been seen by the filer, otherwise the print icon is greyed out.
Main window of !DrawPrint showing a luafox table
!DrawPrint allows you to print large tables on many sheets as shown in the above
screenshot. You can choose the scale of the table, whether it will pe printed in Portrait
or Landscape mode and much more. !DrawPrint has been extended to cut tables
along horizontal or vertical lines, so that the content of one row or column is not split
47
2 Table Windows
over two tables. In the main configuration you can set options for !DrawPrint:
Main choices: Printer settings
The default setting is to show no iconbar icon and close the application automatically
when the print job is done. Also tables will be split at lines and the default orientation
is set to landscape. !DrawPrint offers many more options. Please refer to the manual
supplied with the application. The current version of !DrawPrint is 1.25, luafox
support was added in 1.21. If you have an older version of !DrawPrint installed please
update to the new version. It is expected that all upcoming versions of !DrawPrint will
also work together with luafox.
2.5.3 Clipboard
Use the three Clipboard icons to cut, copy and paste data to and
from the clipboard. To copy data to the clipboard make a selection
first and press the Copy button. Use the Cut button instead to
delete the content of the selected cells.
To copy the data to the clipboard but delete the selected cells use the Delete columns
or Delete rows button.
Use the Paste button to insert the clipboard to the current selection. Note that the
selected cells will be overwritten by the data from the clipboard. If the selection is
smaller than the data held in the clipboard, not all data from the clipboard are written
to the table. If the data in the clipboard are smaller than the selection, all other cells
will be empty.
To insert the full content of the clipboard into a table use the Paste entry of the Table
menu. This will insert the clipboard starting from the cell the mouse pointer was over
when the menu was opened. This will overwrite existing cells and add new columns
and rows as necessary.
Remember that the Project Manager menu provides a way to transpose the clipboard.
You can also delete the clipboards content there.
Alternatively you can use the keyboard: Use ctrl-x to cut, ctrl-c to copy and ctrl-v to
paste data.
2.5.4 Refresh
This button will refresh the window content. It is possible to set the column
values by using an expression. This expression can be stored in the table.
Using the refresh button will write the content of columns again if an
expression is stored for it. Since the expression can access other tables it can be used
48
2.5 Main toolbar
to synchronize data between tables. It is also possible to use an expression so that
e.g. column 3 is the sum of column 1 and 2. If you change the values in one of the
first two columns, the Refresh button will recalculate the third column.
2.5.5 Insert sheets
A Table object can contain more than one sheet. The group
of four icons is used to add a new sheet, either at the
beginning of the table, before the current sheet, after the
current sheet or at the end of the table. By default a dialog box appears that lets you
choose how many sheets you would like to insert and set the number of columns and
rows.
Set the number of sheets, columns and rows that you would like to insert
Choosing default will insert the number of columns and rows as defined in the
configuration. The option "As current sheet" will insert the number of columns and
rows of the current sheet. In both cases you can change the values of the number
fields. If you tick the option to always use this setting no dialog box will appear the
next time you insert a sheet but it will remember the current setting and use that
instead. This is valid until you start luafox the next time. To change it permanently
please use the configuration.
If you want to open the dialog box again just hold down the Alt key while clicking on
one of the insert sheet buttons.
Another way to insert more than one sheet at once is to use the Table menu.
As a special feature you can also drag a sheet or a table from the Project Manager
here to add/append it to the current table.
49
2 Table Windows
Set the default values for inserting new sheets
2.5.6 Copy sheet
This button will make a copy of the current sheet in the Pinboard of the
Project Manager.
2.5.7 Delete sheet
The button will delete the current sheet or the whole table if it is the last sheet.
2.5.8 Split table
This button will split a Table object with n sheets into n individual tables with
only one sheet each.
50
2.5 Main toolbar
2.5.9 Move sheet
The next group of four icons will move the current sheet in
the table to the beginning, up, down or to the end.
2.5.10 Flip sheet
The Flip buttons will flip the whole table horizontally or vertically.
2.5.11 Transpose sheet
The Transpose button exchanges x and y or rather columns and rows. Note
that the header values get lost if you apply this function and they do not
appear again if you transpose the table again. Use the undo function if you
accidently transposed the table to bring back the header values.
2.5.12 Sort values
Use the Sort function to sort the values of the current selection. If there is no
selection, the whole table is sorted. The classical way of sorting in rising or
falling order can be selected from the menu. There is also the possibility to
"sort" with random order; this is the opposite of the classical sort function and will desort the values.
Another option is to use a user defined criterion for sorting. Use "a" and "b" for the
two cell entries that need to be compared. An expression like "a < b" is equal to the
sort rising option. Use "tostring(a) < tostring(b)" to sort alphabetically.
Choose a method to sort a number of columns, rows or a block of data
By default every column and row will be sorted on its own. But it is often necessary to
sort a table by one column or row: e.g. a table containing the names of people in the
first column and their age in the second column. It makes no sense to sort both
columns by themselves because the link between names and ages will be lost. By
51
2 Table Windows
ticking the "Sort all columns according to" you can choose a column from the menu.
Only this column will be sorted, all other columns stay linked to this column.
This way it is easy to either sort the list either alphabetically or by the age of the
people. If the table has an header line "Label" the labels will be used in the menu to
make it easier to find the right column.
Sort all columns according to one
If the selection mode is set to "block", the sorting will take into account all values of
the selection, ignoring columns and rows. The sorted values will then be written
column or row wise, depending on user's choice.
When sorting a block you can choose if you
want to order the result column or row wise
The sort function demonstrates the idea of the selection mode very nicely. Only the
setting of the selection mode determines how the values will be sorted, not whether
you actually selected columns, rows or a block of data. It is possible to select a
number of columns, set the selection mode to rows and sort the data of the rows in
the selection.
2.5.13 Apply a function
Use this button to apply a function quickly to the current selection or the
whole sheet. To do that you can either choose an inbuilt function or define
your own one. How to create your own functions will be explained in the
52
2.5 Main toolbar
chapter about functions.
2.5.14 Selection tool
The first icon in the second row calls the Selection Tool. It will allow you to
make selections on rows and columns. Optionally you can add a start and end
point of the selection and set a criterion for which columns/rows will be
selected. Also, a length of the selection can be set, that defines how many columns or
rows will be selected.
The selection tool helps you to select a
number of columns and rows automatically
For example: If the table has twenty columns and you set a start of 3 and no end and
you choose to select every 5th column and a length of 2, then the following columns
will become selected: 3,4,8,9,13,14,18,19. The selection starts to count at the start
value, selects it and due to the length of 2 it also selects column 4. The next selection
is column 8, because every 5th column was to be selected, and so on.
53
2 Table Windows
The selection tool helps you to make selections
In luafox 1.2 there are now more options to define automatic selections.
The Selection Tool now allows you to select all X columns of the current sheet
Another new concept is to use the values in a data column for the selection of
columns in any table.
54
2.5 Main toolbar
Use the values in "SelData" to select columns in a table
The table "SelData" only contains 5 values: 4,7,2,2,9. In the SelTool window the
criterion is set to Column: SelData[1][1]. This means that the columns 2,4,7 and
9 get selected in the "Austin" table. Note that the number 2 appears twice but that
has no effect on the selection. Also note that fractional numbers are always rounded
to a smaller number, so a value of 11.7 will select column 11. This criterion may seem
a little bit strange at first but remember that you can do any calculations in a column
so you can use this feature to implement criteria which are not build into luafox.
There is one more new criterion for selecting columns based on header values. If a
table contains one or more header lines it is possible to select those columns of which
its header value is equal to a certain value. The comparison is not limited to "equal", in
the following example a header line showing the mean values of each column is
added to the table. The criterion is set to select all columns with a mean equal to or
above 20:
55
2 Table Windows
Select columns whose mean value is equal to or greater than 20
The selection tool not only allows you to make selections but also to combine an
action with it. Instead of just selecting columns or rows, it is also possible to insert
new ones, copy or move (separate) them to a new table, to mask or delete them.
So with this tool you could for example automatically delete all data columns which
standard deviation is above a certain value. Or you can extract them into a new table
(see below) for further analys. So you can use it as some kind of data filter.
Some more words are necessary to describe the copy and separate options. If you
choose to copy every second column then every second column of the current table
will be copied into a new one. This option can be used to copy only parts of a table.
The separate option will do the same but move the data, so that it disappears from
the current table. If either copy or separate options are chosen there is an additional
option to "Copy first column". Often data tables consist of x data in the first column
and y data in all the following. This option allows you to copy the first column, which
is probably the x column, to the new table, independent of the other criterion set.
The selection tool also offers to save the current settings as a script which can be
saved to the Project Manager. If you need to perform a certain operation very often
you can save it as script and just drag the script to a table to execute it.
56
2.5 Main toolbar
2.5.15 Invert Selection
(introduced in luafox 1.2)
This button just inverts the current selection. It can be used to select the whole
table quickly if there is no selection. It is also possible to use it together with
the selection tool to invert its criteria.
2.5.16 Selection mode
An example of using the selection mode has been given in
the sections about selecting and sorting values. The
selection mode determines how the selected data are
handled. There are three ways to make a selection: You can select columns, rows or
blocks of cells. Usually the selection mode is adjusted automatically so that functions
applied to a selection work in the expected way. But it can be a powerful tool to
change the way a function is applied to the data.
A good example is the sum function. If a number of columns are selected and also the
selection mode is set to "columns" and the sum function is applied, it will sum up the
values of the columns. If the selection mode is set to rows, instead the values of the
rows are summed up, but only the values inside the selected columns. If the selection
mode is set to block, all the values in the selection are summed up and the result is
only one number, the sum of all the values.
To avoid the automatic switching between the selection modes you can set the lock
and choose the selection mode you prefer. It will not change automatically anymore
unless you unlock it again.
2.5.17 Column and row buttons
If you select a number of columns then the column buttons are shown in the second
row of the toolbar; if you select rows the row buttons appear.
In the following sections the buttons are described in detail. Only the column buttons
are shown but the buttons work in a similar way also for rows. It is possible to switch
between column and row buttons manually, which enables you to perform some
extra operations, and this is especially useful if you select a block of data. This is
described in more detail at the end of this chapter.
Column buttons
Row buttons
Depending on the selection either column or row buttons are shown
57
2 Table Windows
2.5.18 Adding columns and rows
The next buttons to insert columns are similar to the sheet
buttons. Here you can insert columns (or rows, see below),
at the beginning, before the currently selected columns,
after the current selection and at the end. Note that if more than one column is
selected and you choose to insert a new column left or right of the selection than a
new column will be inserted left or right of every selected column. Use the table
menu to insert more than one column.
2.5.19 Copy columns and rows
Selecting a column and pressing the copy column button will insert a copy of
the column after the selected one. The same is true for rows. If you select a
block of data instead, a new table containing the selected data values will
appear in the Pinboard window.
2.5.20 Delete columns and rows
This button will delete all selected columns or rows. When a block is selected
there is a difference, whether you delete columns or rows. When columns are
deleted the values in the columns on the left of the selection will move into the
gap. If you use the Delete rows button then the values from below will move
upwards.
2.5.21 Reformat
If you want to change the number of columns and rows of the current sheet
you can use the reformat tool. Pressing the Reformat button will open a new
window, where the current number of columns and rows is shown. You can
change these values in the new format section. Please note that entering lower values
than those of the current sheet will lead to a loss of data. If you reduce the number of
rows e.g. from 10 to 8 then the content of the last two rows gets lost.
luafox also offers a way to reformat the data of a selection or whole table. This allows
you to change the format but keep the data by rearranging the values. If there is a
selection it will show the size of the selection as current format, otherwise the size of
the whole table will be shown. In the middle section of the window the new format
can be entered by altering the number of columns and rows. If the rearrange values
option is ticked changing the number of columns will in most cases influence the
number of rows and vice versa so that all values will fit in the new table.
In the bottom section you can choose how the values are written in the new table.
You can fill in the values columnwise or rowwise. The values are read from the source
table in the same way. If you want the values e.g. to be read rowwise but written
columnwise then transpose the table before. The new and reformatted table will be
appended to the current one.
As an example let's assume that you have the average temperature for every day of a
year. This is one column with 356 rows, one for every day. Now you want to analyze
58
2.5 Main toolbar
whether the average temperature on Mondays is different from that on Fridays. To do
that just reformat the table to 7 columns with 53 rows (fill rowwise) and each column
now contains the data for one weekday. The first column will be the weekday that
was the 1st January of that year. Then you can move the columns to bring Monday to
the front and calculate the mean value for all columns to see whether there is any
dependence.
Rearrange values
It is also possible to save a script of the current settings made in the dialog box
(introduced in luafox 1.40). This allows you to apply the same settings to other tables.
Just change the settings in the dialog box and drag the script to the Project Manager.
From there you can drag it to any other table to reformat the data in the same way.
This can be very usefull if you often need to import data files from the same source
which arranges the data in the wrong format. Using the script you need to define
how to reformat the data only once and then apply it as often as necessary.
2.5.22 Moving columns and rows
The next group of four icons will move the selected
columns to the beginning, one column to the left or right
or to the end. Rows will be moved to the top, one row
upwards or downwards or to the bottom. Also a selected block of data can be shifted
in the same way. Note that you can toggle between the column and row button set
manually to be able to move the block in all directions.
2.5.23 Flip column and row values
If a number of columns is selected the Flip buttons will only flip the
values of the selected columns or rows. The Flip buttons also works if
more than one column is selected, e.g. if columns 3,4,5 are selected the
59
2 Table Windows
values will be flipped to 5,4,3. If there is a gap in the selecting of columns, every block
of columns will be treated independently from each other, e.g. when you select the
following columns: 3,4,5 and 7,8,9, after pressing the Flip vertically the values will be
flipped to: 5,4,3 and 9,8,7.
This works analogously for a number of selected rows.
If a block of data is selected only the selected values will be flipped horizontally or
vertically.
2.5.24 Clean table
With this button you can quickly delete all empty columns or rows of the table
to clean it up. When using the left mouse button, only empty columns or rows
are deleted, depending on the button shown. Use the right button to clean
both, empty columns and rows.
2.5.25 Manual switching between column and row buttons
There are two small icons placed above each other. These can be used to switch
the icons in the second row. Even when a number of columns are selected the
row buttons can be displayed. This enables you to perform some extra
operations.
If a number of columns are selected and you switch to display row buttons then the
icon to move rows up and down will rotate the data inside the selected columns. That
means, a value on the top will be moved to the bottom, the second value in the
column will become the first one and so on, if the Move row upwards button is used.
If you select a number of columns and switch to show
row buttons you can perform some additional operations
Use the buttons for moving rows to rotate the values of selected columns
Also the buttons to insert rows are enabled. You can use them to insert new rows at
60
2.6 Edit columns
the beginning or end of the selected rows. A similar behavior can be found when
rows are selected and you use the column buttons.
Insert cells by selecting a block and using the insert row buttons
If a block of data is selected you can also switch between the row and column icons.
They all work in a similar way. Note that the move buttons will always move the
selected block. To rotate the values of a block use the menu.
2.5.26 Line plot and bar chart
Select at least one X-column and one Y-column to plot the values in a line plot
or bar chart. The graph is shown in a new window. The appearance of graphs
can be changed in many ways; they are described in chapter 4.
2.6 Edit columns
If you double click the head of the column you can change some of its settings. You
can change the width of column, the number format, an entry in the header or you
can enter an expression for calculating the column values. Choose the action from the
four tabs and note that only the currently shown tab is taken into account when the
OK button is pressed. Click the OK button with Adjust to keep the window open.
For all settings you can choose whether they are applied to a single column, all
selected columns or all columns. The single column will be the column you double
clicked to open the Edit columns window. Use the Previous and Next button to go to
another column or change the number directly.
61
2 Table Windows
2.6.1 Column tab
If the width of a cell is too small to show the number the cell is marked
with a red background. Increase the width to show all values
Edit the width of the column
In the column tab you can enter the width of the column. Tick the Auto-fit option to
adjust the column width to the data values automatically.
62
2.6 Edit columns
2.6.2 Format tab
Tick the Set type option to set the type for the column. By default the first column is
set as X column and all following columns are set as Y columns. The type setting of
the columns may influence the standard behavior of some program functions. E.g.
when plotting the X columns, are used as X values and the Y columns as data points
to be plotted. Type Y2 can be used to plot a curve on the second Y axis. This is usefull
if you want to display two curves in the same graph but the values of both data sets
are completely different. Use X2 it the values of the X axis differ to much between to
sets of curves. Another type is "Fit" that is automatically given to columns that contain
results of fitting functions. When displaying graphs, columns with a type of "Fit" are
shown in a different style. So it is e.g. easy to plot data points as dots and the fitted
function as a line. The types "Xerr" and "Yerr" can be set to keep a better overview of
the data. In future versions of luafox they may also be used for plotting error bars in
graphs automatically.
Tick the "Set number format" option to change the number format shown in that
column. Fix number of digits will always show a fixed number of significant digits.
This is best seen in an example. If you choose to show six digits, the number 123 will
be displayed as 123.000, the number 1234 will be displayed as 1234,00. So there are
always six digits shown, the number of decimal places shown depends on the
number. In the Example filed it is shown how the display of a number (1234.5678)
with the current setting looks like.
Fix number of decimal places will always show the same number of decimal places.
Scientific notation will always show the number with an exponent.
Change the data type of the column and set the number format
63
2 Table Windows
2.6.3 Header tab
Columns can have one or more header lines giving additional information about the
data (see next section). Using the header tab you can change the value of the header
entry on single columns, which is otherwise not possible.
Change the header value of individual columns
2.6.4 Values
Enter an expression here to calculate the values of a column. If you enter a number
here, all fields in the column will be filled with this number. Enter x to fill in the
number of the current column, y for the current row.
To access other data cells you can use a number of functions. There are two kinds of
functions, those that refer to the current selection in the sheet and those that don't.
The col(n) command accesses data in the nth selected column. If columns 3 and 4
are selected then col(1) will point to the data of column number 3, because this is
the first selected column. So using col(n) is a relative data link. If you want to access
a specific column, no matter which columns are selected, use tcol(n); this will
access the nth column of the table. So in the exampe above col(1) is equal to
tcol(3).
Instead of numbers you can also use x and y here. E.g. if you enter tcol(x-1) in
the values field, the current column copies the values of the column before. Of course
you could also use tcol(3) if you modify the values of column 4, which does the
same.
The advantage is that you can just copy and paste tcol(x-1) to another column
and it will do the same. Please note that the column values can also be applied to a
64
2.6 Edit columns
single column, a selection or all columns, depending on the radio button at the
bottom of the dialog box. In most cases you may only want to apply the value
expression to a single column, so it is worth keeping this in mind. Using relative
expressions and applying them to more than one column is a powerful tool but you
need to keep in mind two things:
First: It will lead to problems if you try to use an expression like tcol(x-1) on the
first column because there is no column zero.
Second: If you have selected all columns except the first one and you want e.g. to
add the columns together by entering an expression like tcol(x-1)+tcol(x) you
may think that it will add column 1 and 2, put the result in column 2 and then add
column 2 and 3, put the result in column 3 and so on. This is not the case. The order
in which the columns are calculated is random. So it might happen that column 2
and 3 are summed and the result is put into column 3 before column 1 and 2 are
summed. This leads to unpredictable results and such a use of commands is not
intended.
Instead of the col() command you can also use the row() and trow() to access
data rows and also cell(x,y) and tcell(x,y) to access individual cells.
Fill column 3 with the sum of column 1 and 2
Other tables can be accessed using Tablename[sheet][column][row], e.g. if
there is a table called data and you want to fill your column in another table with the
values of the data table from the third column of its second sheet, use:
data[2][3][y].
There is another way to change the values or columns or rows quickly, the quick
function, which can be accessed from the function menu which is described later in
the chapter about functions. The main difference is that the expression is saved within
the column and can be changed or reapplied later. It will also be executed when you
press the Refresh button and recalculate the column values.
65
2 Table Windows
Edit the values of a column
As an example try the following: Open a new table with 10 columns and fill it with
value x so that the first column contains number 1, the second number 2 and so on.
Now define the values for column 10 as col(1)-col(2). This will always fill column
10 with the difference between the first and second selected column. If you now
select column 2 and 5 and press the refresh button then column 10 will contain "-3",
if you select column 3 and 8 and refresh it will be filled with "-5" and so on.
2.7 Header
A header line may appear if you import data that contains additional information, see
the section about data import. In the header you can give columns a name or store
further information.
The header shows additional information about the data columns
66
2.7 Header
You can add additional header lines, change or delete them at any time. If you click
the menu over the column top you have access to the header lines.
Use the menu to add more header lines, change or delete them
If you choose to add a header line, you can give it a name and specify an expression.
The name must be unique; otherwise the line will not appear. The name "Label" has a
special meaning, it is used to label the curves in a graph, so use this name for a short
description of the column values.
Adding a new header line
Example header line showing the column number
The expression can simply be a piece of text. Use quotes to enter a text. Again the
variable x contains the column number. Try to use an expression like "Column "..x
including the quotes to add a header line that tells you what column it is. Use
string.char(64+x) to add a header line containing the ASCII characters from 65
upwards. If there are more than 26 columns you will notice that no upper case letters
67
2 Table Windows
are shown but other characters. You can repeat the alphabet by using the mod
operator which is implemented as %-sign in lua. Try changing the header line
expression to string.char(x%26+64). The expression x%26 will always output a
value between 0 and 25. This almost works in the example, just that instead of the Z
you find the @-Character. Change the expression again to: string.char((x1)%26+65) to get the desired result.
There is a special expression in Luafox to make labeling with repeating values easier.
Create a new table called "days" which has at least one column with seven rows.
Now enter the weekdays in the first column (do not forget to use quotes when you
enter text). In the field for the header expression you can now use the command
list("days",x) to fill in the weekdays. In the list command you need to specify
the name of the table and the element you want to read. It is just a short form for the
expression days[1][1][(x-1)%7+1]. It will access the first column of the first sheet
in the given table. When the element value is larger than the number of rows it will
jump back to the first row and starts counting again.
Individual header fields can be changed by using the Column edit window (as
described above).
There are also a few predefined header lines which can be accessed from the label
menu.
Use the menu to choose from predefined header lines
These allow you to show e.g. the mean of a column in the column head, or the
minimum and maximum value of a given column.
It is also possibe to save the header as a script (introduced in luafox 1.40) and apply
the same settings to other tables. It works in the same way as the SelTool and
Reformat scripts.
Once you add one or more header line you can hide them quickly by using
the icon in the top left corner of the table. Press this icon again to show the
header lines.
Using the menu you can also choose which header lines should be shown and which
should be hidden.
The first entry in the header menu allows you to show the header labels. They are
displayed in the header fields of the first column and allow you to see what the
header lines contain. Often the first column is used for X data and it makes no sense
to show the header data in the first column.
68
2.7 Header
You can display many header lines at once and quickly
hide them using the icon with the two triangles
Use the header menu to show or hide header lines
The default value can be set in the configuration:
Configuration of additional settings
69
2 Table Windows
2.8 Search & Replace (introduced in luafox 1.50)
Open the Search & Replace dialog by pressing F4 or use the utilities submenu of the
table menu.
2.8.1 Search
In the seach section of the dialog window you can enter a lua search expression or
simply a number you are looking for. The most commonly used wildcards are:
Pattern
.
%a
%d
%l
%u
%p
%w
%x
+
*
?
^
$
%
Meaning
all characters
letters
digits
lower case letters
upper case letters
punctuation characters
alphanumerical characters
hexadecimal characters
1 or more repetitions
0 or more repetitions
0 or 1 occurances
match at the beginning
match at the end
escape character,
e.g. %. to match a dot
f you enter an expression in the search field and choose the location to look for the
expression. This can be the current selection only (the whole sheet if there is no
selection), the current sheet or the whole table. Pressing the search button will always
start the search from the beginning. That means if you have opened sheet 3 and you
are searching the whole table the first match may be found on sheet 1. If a match is
found some information about the location is shown in the right hand corner of the
dialog box: The sheet number, the column (x) and row (y) as well as the counter
which shows how many matches have been found up to this cell. If you press the
next button the search is continued from the current location.
The search string as shown above: "%d+%.%d+" will find one or more digits followed
by a dot followed by one or more digits. It is important to keep in mind that the
search will look at the cell content and will not take into account the current format
settings. So if you configure the table not to show any decimal places the search
function will still find them.
The expression "%d" will match a single digit. To match a sequence of digits "%d+" is
used. The next part "%." will match a dot. We have to use the "%" escape character
here because the "." has a special meaning (see table above) and will match all
characters. Just using the dot ("%d+.%d+) would also match all numbers like "13.45"
because the dot is also a character but it would also match "13:45" and "13x45" and
so on. Also important to know is that the expression "%d%.%d+" (only one digit
before the dot) will also match with "23.82" because there is still one digit in front of
the dot. If you want to search for numbers < 10 only, you need to change the
70
2.8 Search & Replace (introduced in luafox 1.50)
expression to "^%d%.%d+", the "^" means that no other character is allowed in front
of the one digit.
Search & Replace dialog box
2.8.2 Replace
Searched expressions can also be replaced manually or by using a replace expression.
In the simples case you can just enter a fix number in the replace field. But in most
cases you will probably use a more advanced expression in the replacement field.
If you want to change the temperaturtes from the example data table "Temperatures"
into degree Fahrenheit you can do it with the search & replace dialog in the following
way:
The expression "?m" will automatically insert the found result into the replace field. So
here the cell matching the search expression contains the number 9.1. The search
result can now be used in the replacement expression by using "?m" (m like match).
You can then execute some calculations with the search result like we have done here
to convert the temperature from Celsius to Fahrenheit. There are a few more special
expressions: "?x" is the number of the column of the found cell, "?y" is the row
number and "?z" the number of the sheet. Additionally "?c" is the counter which is
increased by one for every cell found that matches the search expression. A click on
the blue info button shows the available expression in case you forgot them.
What happens if you have entered a replace expression and hit the search button is
that the selection, sheet or table is searched for the search expression. If a cell is
found the replacement expression is evaluated and the result written to the field
"Replace by:". In this field you can see the result of the search and replace operation
but it is not yet applied to the table. So no values have been changed, yet. This allows
71
2 Table Windows
you to change the replace expression until the result matches the expectations. The
replacement filed is also writeable, which allows you to make manual changes to the
result as well. Only if you hit the "Replace" button the content of the cell is replaced
and the next matching cell is searched. Pressing the "Replace all" button will replace
all further cells matching the search expression.
Entries to convert from Celsius into Fahrenheit
Some more examples will show you how you can use the Search & Replace dialog for
different purposes. If we take the Temperatures table again, you may want to add a
"°C" to every number. You can do this by the following replace expression:
?m:tostring().."°C"
Because the search result "?m" is a number we have to convert it into a string first,
before we can concatenate another string. If you try the expression you will notice
that there are a lot of decimal places and you get a result like "15.60000°C". To limit
the number of decimals, a string format can be defined which is the standard lua
string format and is identical to the standard C format of the printf command. Here
"%.2f" means that only 2 decimal places are used:
?m:tostring("%.2f").."°C"
As a result you should now get "15.60°C". Use the replace all button to convert the
whole table.
You can also access tables from the replace field. In the example shown in the
screenshot an expression was used to replace the number in the first column by the
month. This also works correctly if the values in the first column are not in order.
72
2.8 Search & Replace (introduced in luafox 1.50)
Access data from other tables from within the search & replace dialog
73
2 Table Windows
2.9 Table menu
The menu of the table window offers the same options as the toolbox buttons with
only very few exceptions. Therefore the submenus will be explained here only
partially since the functionality has been explained above.
Main menu of the table window
2.9.1 Sub menu: Table
Sub menu: Table
The Table sub menu lets you save and export the table or a selection in various
formats. You can also print a table.
2.9.2 Sub menu: Edit
The upper part of the Edit sub menu allows you to cut, copy, paste and delete the
selected data.
The next section allows you to insert cells at the beginning. Here you already see the
difference to the toolbox buttons because many cells can be inserted at once. Just
specify the number of cells you want to insert in the writeable field. This is shown in
the screenshot for the case of inserting sheets.
The Edit sub menu changes depending on the current selection. In this example
columns have been selected and so it offers many functions related to columns such
as inserting new ones or sort the values of a column.
Rotate columns means that you permutate the values in a column. If you choose to
rotate upwards then the value of the second cell is moved to the first, the thrid to the
second and so on. The content of the first cell is then filled in the last cell at the
bottom. Here is one difference to the toolbar: You can also rotate to the left or right.
74
2.9 Table menu
Sub menu: Edit
So, for example if you rotate to the right then the values of the first selected column
will move to the second selected column and so on until the content of the last
column will appear in the first one. So if you select only two columns this is a quick
way to exchanging two columns. Please note that this only works when all selected
cells form a block. So you can not select column 1 and 5 and try to rotate them. You
need to take columns 4 and 5 for example. But it is possible to use more than one
block. If you select column 1,2,4,5 and rotate the columns to right or left (this makes
no difference in this case) then the values will be rearranged like this: 2,1,3,5,4. So
columns 1 and 2 have changed its place as well as columns 4 and 5.
The last section deals with sheets and lets you insert, flip and delete them. Also here it
is possible to insert more than one sheet at a time.
2.9.3 Sub menu: Selection
Sub menu: Selection
The Selection sub menu lets you apply and clear a selection, invert it or define it using
the Selection Tool. Here you can also set the selection mode which defines how a
selection is treated when functions are applied. The way a selection is treated is
important to understand and has been explained above. If you should have missed
that section it is recommended to read it since it might produce confusing results if
75
2 Table Windows
you are not familar with this idea.
2.9.4 Sub menu: Function
Sub menu: Function
With this sub menu you can quickly apply a predefined function to the current
selection or the whole table. It is also possible to define your own function and apply
it. Again this menu item is identical to the function button on the toolbar, see next
chapter for a detailed description.
2.9.5 Sub menu: Mask
(introduced in luafox 1.2)
Sub menu: Mask
The mask function is only available from the table menu or using the Selection Tool. It
will mask out data values which are then not used for calculations and not shown in
plots. In the table they are greyed out.
When a mask is applied the number value is changed into a string value and handled
as text. So if you have imported a table and some numbers are greyed out they have
been interpreted as text and not numbers. Just use Mask -> Remove to change them
76
2.9 Table menu
into numbers.
2.9.6 Sub menu: Plot
Sub menu: Plot
The plot sub menu lets you plot the current selection as Line graph or Bar chart. It lets
you choose the type of graph you want to create, e.g. whether you want to plot a
line, scatter or scatter & line graph. Also this entry is identical to the toolbar buttons.
2.9.7 Sub menu: Utilities
Sub menu: Utilities
From the utilities submenu you can quickly open the search & replace dialog box
(introduced in luafox 1.50). You can also change the scale of the table display (this
can also be set in the extra toolbar at the bottom of each window). It also allows you
to go directly to a certain sheet or cell.
2.9.8 Settings...
This menu entry will open the Edit columns dialog box which lets you change the
column width, the display format and data type etc. It is the same dialog box that
opens when you double click on the coulmn number and has been explained in
detail above.
77
2 Table Windows
Change the data type of the column and set the number format
78
3.1 Applying functions
3 Functions
luafox offers many function that can be applied to a selection of data to process them.
The individual function will be described in the next sections. But there are some
points to note about using functions in luafox.
Choose a function from the menu to apply it to the data
3.1 Applying functions
There are several ways to apply functions to a table in luafox. As already mentioned in
the section about drag & drop it is possible to drag a function to the table node or
one of its sheet nodes or directly to an open table window.
Drag a function to a table or sheet node or an open table window to apply it
79
3 Functions
If you drag the function to an open table window it will be applied either to the
whole sheet or, in case there is one, only to the current selection. Dragging a
function to a sheet node will apply it to this sheet and dragging it to a table node will
bring up a dialog window where you can choose to which sheets the function will be
applied if you did not configure it otherwise. There you also have an option to apply
it to all sheets.
Apply a function to all sheets of a table
In a table window there is a special button in the top right corner of the toolbox to
apply functions. Clicking on it will show a menu with all functions currently available
in luafox.
Functions are applied to a selection of data. If there is no selection the function will be
applied to the whole table, so there is no need to select the whole table before
applying a function.
When applying a function the setting of the selection mode becomes very important.
This has been described in the sections about selections and sorting. If you did not
read this section please do so before continue reading here.
Block selection of data values
Especially when the selection mode is set to "block" it is important to note all the
selected data will be handled at once. E.g. if the selection mode is set to "block" and
you calculate the sum of the data the result will only be one number. Another
example is the cumulated sum of the data. Applying this with the selection mode set
80
3.1 Applying functions
to "block" will result in only one column or row of data containing the cumulated sum
of all the selected values. Especially when you choose to overwrite the selection with
the result (see below) then it might be irritating to see the result:
Selection mode set to "block" and result replaces selection
If you choose to overwrite the selection, only the previously selected area is changed
and hence the result of the calculation is one column with several rows and only part
of the result becomes visible in the table. To avoid this there are two possibilities
depending on what your intentions are. If you want to calculate the cumulated sum
of the block then it is better to append the result as a new sheet or create a new table
(see next section on how to do this):
Save the result as new table
If you want to calculate the cusum inside of the selected block but start new for every
row then select the block of data but set the data mode to "columns" and the result
will look as shown in the screenshot below.
These possibilities may sound confusing at the beginning but they allow you to apply
a function in many different ways. As a rule of thumb: if you select a number of
columns or a number of rows and you also set the selection mode accordingly you
81
3 Functions
should get the expected result (if the selection mode is not locked this should happen
automatically). But if you select a block of data it might be necessary to switch the
selection mode to cols or rows.
Select a block of data and set the selection mode to "columns" to get this result
3.2 Store results
If a function is applied to a data selection the question is where to save the result. The
default setting of luafox is to ask you every time you apply a function.
You can choose between lots of places to save the result
You can store the results at different places:
• The first option you have is to replace the current selection. This will
overwrite the initial data with the result and the initial data gets lost.
• It is also possible to append a sheet which will contain the results
• You can also append columns or rows to the current sheet
• Another option is to create a new table window containing the results and
open it either in the project or pinboard window
• The last option is to store the result in the clipboard. This way you can decide
later what to do with the data but keep in mind that the clipboard will be
overwritten once you execute another function. This is especially critical if
you apply more than one function at a time
82
3.3 Data Manipulation
The dialog box also allows you to specify a name when you create a new table.
If you tick the option to use this destination always the dialog box will not appear the
next time you apply a function and will always store it at the destination previously set
until you restart luafox. For a permanent setting use the configuration:
Configure whether you want to open the dialog box to set the destination everytime
you apply a function and the default destination
You can set your favorite destination and choose not to open the dialog box to work
faster. Remember that you can always force the dialog box to open by pressing the
Alt key while choosing the function from the menu. This, again, allows you to define
a default behavior while keeping all the options if a special case occurs.
3.3 Data Manipulation
Under data manipulation you will find many basic functions that change the values in
a variety of ways.
3.3.1 Count multiples (introduced in luafox 1.50)
This function allows you to count multiple occurances of a certain value. When
applying to a set of data the result is a two dimensional table with all values of the
data set listed only once and the number of their occurances. It can also be used as a
simple histogram function just that the ranges can not be set.
3.3.2 Data limits
Set a low and high limit for the data values
83
3 Functions
This function allows you to set a low and high data limit. Both limits are optional. If a
value is lower than the lower limit its value will be changed to the lower limit.
Similarly values higher than the high limit will be set to the high limit.
3.3.3 Derive
To calculate the derivation numerically the derive function requires you to select an x
axis first.
Choose an x axis for the derivation and optionally
include a new x axis in the result
The function calculates the slope of a line going through two neighboring data
points. Since the slope may not be defined at the data points, it is calculated in the
middle between the data points. Therefore the result contains a new x axis and has
one data point less than the original data. The function can handle unequally spaced
data points. In the dialog box there is an option to include the new x axis in the
results, which is highly recommended. This option can cause problems when you
have chosen to replace the current selection, because the result has one more column
than the initial data and so one column will be lost.
3.3.4 Integrate
The integrate function will integrate the area between the y axis and the data points.
Set the options for calculating the area below a curve
It will take into account the values of the X axis which need to be set by the user
before; they do not need to be equally spaced. You can choose whether the area
below the Y axis is treated as negative and hence subtracted from the area above the
Y axis or whether the sign should be ignored giving the absolute area below the
84
3.3 Data Manipulation
curve. Also here you can choose to include the X axis in the result.
3.3.5 Normalize
This function will scale the values in a column, row or block of data so that the lowest
value becomes 0 and the highest value becomes 1.
3.3.6 Reciprocal
This function calculates the reciprocal (1/x) of all values. Note that there is no
reciprocal for the value 0 so that some cells of the result may be empty.
3.3.7 Round
Use this function to round values to the nearest, up (away from zero) or down
(towards zero). It is also possible to round to another decimal place. E.g. set "Round
to nearest = 0.01" and a value "0.62577" will become "0.63". If you set "Round to
nearest = 100" then a value of "157.39" will become "200" and a value "44.82" will
become "0".
Round numbers to nearest, up or down
3.3.8 Set (introduced in luafox 1.40)
There are now four different set operations that can be applied to data:
Union, Intersection, Set difference and Symmetric difference.
85
3 Functions
Choose a set operation and a source column to compare the two data sets
The function works on the current selection and uses a data column as data source.
Union
The Union function will take all values of the currently selected column (A) and the
reference column (column B) and generate the result containing all values that are
either in column A or B.
Column 3 shows the union of the first two columns
It also makes sense to apply the Union operation to the column itself (A = B). In this
case you eliminate all double values in that column.
Intersection
The Intersection function will generate a result containing only those elements that
are found in both the selected and reference column.
Set difference
The Set difference function will output all values that are found in the selected column
but not in the reference column.
Symmetric difference
This function is similar to the Set difference but will output all values that are either in
the selected or the reference column.
86
3.4 Statistics
3.3.9 Subtract (introduced in luafox 1.21)
Subtract a fix value or the lowest or highest value from a given data selection. This
can be usefull if you want to subtract the background from a data set.
3.4 Statistics
luafox provides some basic statistical functions that can be applied to columns, rows
and blocks of data.
3.4.1 Cusum
Cusum calculates the cumulated sum. In a column of data the first cell will remain
unchanged, the second cell will contain the sum of cell 1 and 2, the third cell will
contain the sum of the first three cells and so on.
3.4.2 Min, Max
This function will just find the lowest or highest value of a column, row or in a block
of data.
3.4.3 Mean
Use this function to calculate the mean value. It is calculated by summing up all values
and dividing them by the number of values.
3.4.4 Geometric mean
To calculate the geometric mean use this function. It will multiply n data values and
calculate the nth root of the product. Remember that the geometric mean will be 0
only if one of the data values is 0.
3.4.5 Median
The median is just the middle value of a number of values that have been sorted
before, if the total number of values is odd. For even number of values the number
above the middle and below the middle are added and devided by 2 to calculate the
median.
3.4.6 Variance, Variance_empiric
There are two ways of calculating the variance of a given data set. The whole
statistical population can be used ( N1 ) or the corrected population ( N 1− 1 ). The Variance
87
3 Functions
function will always use ( N1 ) while Variance_empiric will use ( N 1− 1 ). These two funtions
are not influenced by the configuration setting described in the next paragraph.
3.4.7 Standard deviation and Standard error, Skewness and
Kurtosis
Calculates the standard deviation and the standard error of data values. Depending
on the setting of the main configuration the calculation of the standard deviation and
error will be based on the uncorrected or corrected variance. The same is true for the
skewness and kurtosis.
The Skewness, or third moment, calculates the asymmetry of a normal distribution. So
it indicates whether there is more data on the left or right side of the mean value than
you would expect from a normal distribution.
The Kurtosis indicates whether data is spread in wider or narrower than one would
expect from a normal distribution. So it indicates whether there is a sharp peak or a
"flat" maximum.
Main configuration to choose the (un-) corrected variance
3.4.8 Sum
Calculates the sum of the data values
3.5 Fitting
The fitting function provides a way of fitting data values to a curve by adjusting the
curve parameters. luafox supports linear and polynomial fitting.
3.5.1 Linear fitting
88
3.5 Fitting
The linear fitting function will fit a line (y = a + b*x) to the given data set.
There are several options that can be made for the fitting process. The first option
forces the linear fit to go through the origin by setting the parameter a to 0. The
second option allows you to include the x axis in the results.
Options for linear fitting
The fitting function calculates the parameters a and b and calculates the y values for
the given x axis. If you set the option to include the expression in the column value
you can recalculate the column by pressing the refresh key. This is especially useful if
you change or extend the x column.
The expression can be put into the column values
Another way to keep the fitting parameters is to save a parameter table to the
Pinboard window.
89
3 Functions
Parameter window showing the fitting parameters for all columns
3.5.2 Polynomial fitting
The polynomial fitting function is very similar to the linear fitting.
Dialog box to set the parameters for polynomial fits
You can set the order of the polynom that you would like to use for fitting. An order
of 3 will use the function: y = a + b*x + c*x2 + d*x3. The other options have already
been explained in the section about linear fitting.
3.5.3 User defined functions
luafox allows users to add their own functions. If you want to define a simple function
that quickly changes the cell values you can use the quick function:
The quick function is available from the function icon of all tables. It will execute the
function directly to the current data selection. You can enter values and expression
90
3.5 Fitting
which may use the cell values or refer to the data of other tables. When you call the
function menu of the Project Manager it is also possible to save the function as an
object and edit it if necessary.
Use the quick function to apply simple changes
On the function menu there is also a second entry opening the advanced function
dialog. Here you can see a lot of options. It is also possible to create a function here
very quickly without entering a lot of settings. The text of the function definition is
inserted by default. In the screenshot only the text 2* was added just before
cell(x,y). This function will just multiply all cell values by two and has therefore
been called "Double". You can then choose an existing categorie or define your own
one. Your function will then automatically added to the function menu available from
the project manager and every table. All you have to do is to press the create function
button now and the function will be added to the Project Manager.
Creating an advanced user function
Let's have a closer look at the function definition. This allows you to use the lua
programming language and to perform very complex operations.
If you want to use all of its power to write your own functions you should refer to the
lua programming manual.
91
3 Functions
Basic definitions
The expression local result defines the variable "result" as a local variable that
is only valid inside the user defined function. In the next line the variable result is
used as a function name. This is the function that will be called when the function
is dragged to a selection or applied otherwise. If you need to change the name of
this function change: 1. the variable name after local. 2. the variable name after
the function command and 3. the variable name in the writeable field on the
left hand side of the window. Here the function name is entered that will be called
when the function is applied. Usually you do not have to change the name but it
is possible to define more than one function in the Function definition text field
and it would be not clear which of these functions is the one to be called.
There are two arguments of the result function: x and y, which are the x (column)
and y (row) numbers of the selection. Try to change the line containing "return"
into return x. If you apply this function the first selected row will be filled with a
value of 1, the second with 2 and so on.
There are four lines starting with local function that define secondary
functions: col(), row(), tcol() and trow(). They are described in detail in the section
about editing column values. As a reminder: The col(n) function will access
values of the nth selected column. The tcol(n) function will access values of the
nth column of the current table, independent of the selection. Similar the cell
function: cell(x,y) will access only the selected values, tcell(x,y) the cells
of the table. The same is true for the row() and trow() functions. If you do not use
these secondary functions you can delete their definition. The cell() and tcell()
functions are defined by default and will also work if you delete the four local
function definitions.
It is also possible to use a variable as return value. E.g. the following function
definition will create a multiplication table:
local result
function result(x,y)
local value
if x == 1 and y == 1 then
value = "x * y"
elseif x == 1 then
value = "x = "..(y-1)
elseif y == 1 then
value = "y = "..(x-1)
else
value = (x-1)*(y-1)
end
return value
end
Here a local variable value is defined. Depending on the x and y values the
variable is filled with strings or numbers. In the top left corner (x = 1 and y = 1) the
expression "x * y" is written. The first column is then filled with the row number-1
92
3.5 Fitting
and the first row with the column number-1. The rest of the table is filled with x-1
and y-1 multiplied.
Multiplication table created by a user function
When writing a function you can quickly insert mathematical functions or
constants into the text area. On the left hand side of the window you will find two
menus which let you choose a mathematical function or constant. If you click on
the add button the expression will be inserted at the cursor position. In case of the
mathematical function there is also the option to select a piece of text first. In this
case the function will enclose the current selection.
Select a piece of text...
There are two more fields on the left hand side: x-dim and y-dim. These fields are
filled with the xdim and ydim variable. Both are predefined variables that can be
used inside a function. The variable xdim contains the number of selected
columns, ydim the number of selected rows. The fields on the left side tell luafox
how large the result is. In many cases the result will have the same size as the data
selection, so these variables are written in the field by default. But if you think
about a function like the sum() function then you will understand that it can be
helpful to set the size of the result.
93
3 Functions
...and click on the add button to enclose the
selected text in the mathematical function
There is one other predefined variable which is called mode. It can be "col", "row"
and "block" depending on the selection mode. You can use this inside your
function definition if you want to take the selection mode into account.
94
4.1 Save, Print and Refresh
4 Graphs
Main window of a graph
Every graph is shown in a new window containing two toolboxes. The toolbox at the
bottom can be used to change the zoom factor of the graph. The toolbox at the top
lets you save, print and refresh the graph, change its style and the data shown as
curves or bars.
4.1 Save, Print and Refresh
The meaning of the first buttons from the left is very similar to the table toolbar. The
disc icon lets you save the graph as a draw file. This allows you to export the graph to
almost all RISC OS applications that can deal with graphics.
The print button calls !DrawPrint, please refer to the table section for more
information about printing from luafox and also to the manual supplied with
!DrawPrint. Just one hint: It the icon is greyed out open a filer window containing
!DrawPrint, it has to be seen by the filer before you are able to use it.
The Refresh button is used to update the graph and plot it again. This is especially
useful if data values have been changed and need to be taken into account.
95
4 Graphs
4.2 Curve and Bar style (introduced in luafox 1.2, update: luafox 1.21)
The appearance of a graph depends on a huge number of settings. They can all be
changed in the Edit Style dialog described below. However, luafox 1.2 adds two
shortcuts for changing the appearance of a graph with only two mouse clicks.
Quickly change the curve style
A click on the curve style button opens a window showing three different styles you
can choose from: Scatter graph, line graph or scatter & line.
Temperatures of selected cities
Temperatures of selected cities
1
l
30
l
1
l
30
25
l
l
20
l
l
l
l
l
l
l
15
l
10
5
l
l
l
0
l
l
l
l
l
l
l
l
l
l
l
l
l
l
l
l
l
l
l
l
l
l
l
l
l
0.6
l
l
l
l
l
l
l
l
l
l
0.4
l
l
0.2
l
25
l
l
l
l
l
l
l
l
l
15
l
10
5
l
l
l
l
l
l
l
l
l
l
l
l
l
l
l
l
l
l
l
l
l
l
l
l
l
0
l
l
20
l
l
l
l
l
l
l
0.6
l
l
l
-5
0.2
4
5
6
7
Month
8
9
10
11
20
0.6
15
10
0.4
5
0
0.2
-5
l
0
3
0.4
l
l
l
l
1
l
l
l
0.8
25
l
l
l
2
1
30
0.8
l
l
-5
-10
35
l
0.8
Average temperature (°C)
Average temperature (°C)
l
l
Temperatures of selected cities
35
Average temperature (°C)
35
12
-10
l
1
l
2
3
4
5
6
7
8
9
10
11
12
0
-10
1
2
3
4
Month
5
6
7
8
9
10
11
12
0
Month
The same data displayed with different curve styles
The bar graph introduced in luafox 1.2 offers you similar options: You can choose
(from left to rigth) to plot the bars behind each other, on top of each other (stacked),
relatively stacked or next to each other. The styles will be discussed in more detail
later.
Quickly change the bar style
New in luafox 1.21 is the option to choose a style before you plot a graph. To see the
list of available styles just maximise the Bar style window as shown above and click on
a style.
96
4.3 Edit style
Temperatures of selected cities
Temperatures of selected cities
36
1
82.9
1
72.9
0.8
28
24
0.6
20
16
0.4
12
8
Average temperature (°C)
Average temperature (°C)
32
0.8
62.9
52.9
0.6
42.9
0.4
32.9
22.9
0.2
0.2
12.9
4
0
0
1
2
3
4
5
6
7
8
9
10
11
2.9
12
1
2
3
4
5
6
7
8
9
10
11
0
12
Month
Month
Temperatures of selected cities
Temperatures of selected cities
100
36
1
1
Average temperature (°C)
80
0.8
60
0.6
40
0.4
20
0.2
Average temperature (°C)
32
0.8
28
24
0.6
20
16
0.4
12
8
0.2
4
0
0
1
2
3
4
5
6
7
Month
8
9
10
11
12
0
1
2
3
4
5
6
7
8
9
10
11
12
0
Month
The same data displayed in four different bar styles
4.3 Edit style
The appearance of the graph is controlled by a graph style that defines all graph
settings. For editing the style ConfiX is used, a general configuration utility found also
in many other applications.
Configuration window with graphical tabs at the top and near the bottom of the
window. The lower tabs allow you to configure the graph in every detail
97
4 Graphs
The window to edit the graph style has a number of graphical tabs in the top part of
the window.3 If you move the mouse over the tabs you will see their meaning in the
help display field of the window.
Sometimes there are also some additional tabs near the bottom of the window (sub
tabs). Using these tabs you can set even more options.
The general problem when dealing with graphs is that there are so many options that
need to be set. If you just think about the ticks. These are the small lines that divide an
axis into smaller parts. They can be inside or outside of the graph. You can have only
major ticks or also minor ticks. All need to have their own line width and color. Also
you may want to have different tick settings for the different axis. The challenge when
dealing with graph options is to find a way that keeps setting the options simple but
still allows you to be very flexible. luafox tries to solve this by general and specific
styles.
Set individual options for singe a axis
On the first sub tab, which is often called "All" you can set the general settings, in this
example you can configure which axis you want to show and set a general axis style
consisting of the line width and color. Usually you want all axes in a graph to have
the same color and width so you only need to care about the general settings.
If you have special needs and you want to have differently colored axes you can
choose the axis from the sub tab and tick the option for individual settings. This will
overwrite the general settings and you can now specify the line width and color
specifically for one axis.
3
If it looks different on your computer please reconfigure ConfiX to show graphical tabs. The
ConfiX application can usually be found in !Boot.Resources.
98
4.3 Edit style
In the following sections all graph options are introduced and explained in details.
Additionally the effects on an example graph are directly shown.
Also note that in luafox 1.2 bar graphs have been added. All style files are valid for
line and bar graphs. This is much easier than to support different kinds of styles, for
line graphs, for bar graphs and probably also for other graphs that may be added in
future. Having only one style file for line and bar graphs also has the advantage that
both types share most of the features like the tick settings, background colours etc. So
you could define a "red" style which shows red curves and red bars and maybe a red
frame and a "blue" style replacing all red colours by blue ones. This way you just
change the style from red to blue or vice versa and you do not need to care whether
you have a line or bar graph. What might be confusing is that the edit style
configuration called from a line graph also contains settings for bars. They exist but
are just not applied to the line graph.
Please also note that a new graphical tab for bar styles has been added in version 1.2
which is not shown on all screenshots but just on the new ones and those actually
dealing with bars.
4.3.1 Page settings
Choose a paper size between DIN A0 and A5 for the graph and choose whether the
paper format is Landscape or Portrait.
You can add a header line by clicking the option. Enter the heading and choose a
font, the font size and a color. The offset defines the distance between the upper Y
axis and the heading.
There is also the option to show a frame around the graph and select its position,
dimension and colors as shown in the example:
Settings for the page, header line and the frame
99
4 Graphs
Randon data
31
l
l
l
27
l
23
l l
l l l
Counter
19
15
l
l
l
l
l
l
11
l
l
l l
7
l
l l
l
l
l
3
-1
l
l
l
l
l
0
5
10
15
20
25
30
Number
Graph with the style defined as shown above
4.3.2 Axis settings and limits
In the second tab you can control the axis settings and the data limits for the axis.
Axis offset X and Y defines the distance of the axis from the left and bottom border.
You can also set the width and height of the graph here, the data points will be
scaled accordingly.
Set the position and size of the graph. Configure which axis to show on the graph
and set the general axis style
The second section allows you to select which axis to show on the graph.
In the last section you can set the axis line width and color as well as the graph
background color.
100
4.3 Edit style
Randon data
31
l
l
l
l
l
l
27
23
ll l
lll l
Counter
19
15
l
7
3
ll
l l
ll
11
l
l ll
l l
l
l l
-1 l
0
5
10
15
20
25
30
Number
Set the axis limits and an individual axis style
On the sub tabs you can set the data limits of the individual axis by defining a lower
and upper limit. By default the limits are set automatically according to the data
values. The axis are scaled such as to show all selected data points. The scaling can
also be changed from Linear to Logarithmic.
If you select to show an individual X axis you can set an alternative line width and
color.
101
4 Graphs
Randon data
31
27
23
l l l
Counter
19
15
l
11
l
l
l l
7
l
l l
l
l
l
3
-1
-10
l
l
l
l
l
l
-5
0
5
10
15
20
Number
Data limits on the X axis set manually. Individually colored X axis.
Randon data
31
l
l
l l
l
l
27
23
lll
lll l
Counter
19
15
ll
l
l
l
ll
11
7
l
ll
l
3
-1 l
1
l
l
l
l
l
10
100
Number
Logarithmic scale on the X axis. Gridlines are shown to emphasize the scaling and will
be explained in one of the following sections
4.3.3 Ticks
Ticks are small lines that divide the axis into sections usually associated to specific
values. There can also be minor ticks that further divide those sections.
102
4.3 Edit style
General settings for the major and minor ticks
In the first sub tab you can define on which axis you want to display major or minor
ticks. Also you can set the tick length and line width as well as the color and whether
the ticks are shown inside the graph, outside or both.
Randon data
31
l
l
l
27
l
l
l
23
l l
l l l
Counter
19
15
l
l
l
l
l
l l
7
l
l l
l
l
l
3
-1
l
l
11
l
l
0
l
l
5
10
15
20
25
30
Number
Graph plotted with the settings as shown above
In the sub tabs the number of ticks to be shown can be defined. The setting for the
103
4 Graphs
major tick is a little bit special because the number of ticks shown might be different
from the number defined in the configuration if the enforce option is not ticked. This
is because in most cases values are plotted on the X axis as well and only steps of 1,2
and 5 are recommended to use for labelling the axis. The number specified is not
completely ignored because luafox will display a number of ticks that is close to the
number you specified in the configuration. As an example that plot above is set to
display 8 major ticks on the X axis but there are only 7 displayed. You can enforce
luafox to display 8 ticks no matter what as shown in the next example:
Set the number of major and minor ticks here
However, enforcing a number of ticks may lead to tick label values that are difficult to
handle and read.
l
3
-1
l
0
l
l
4.286
8.571
12.86
17.14
21.43
25.71
30
Number
Enforcing the number of ticks may lead to unhandy tick label values
The number of minor ticks will always be shown as specified. Still it is good practice to
choose them in a way that they represent numbers that can be understood easily.
You can also set the style of the ticks individually as shown below:
104
4.3 Edit style
Set the individual tick style for the Y axis
Randon data
32
l
28
l
24
l l
Counter
20
l l l
l
l
l
l
l
l
16
l
l
12
l
8
l
4
l
l
l
l l
l l
l
l
l
l
l
0
l
-4
0
5
10
15
20
25
30
Number
Different tick styles in comparison
Please note that the above example is of course not a good way to present the data.
It only shows what is possible with luafox.
4.3.4 Additional lines, Zero line (introduced in luafox 1.2)
In a graph that shows data from negative to positive values on either the X- or Y-axis it
may a good idea to plot an additional line at the value 0. This is possible with luafox.
105
4 Graphs
Additional horizontal and vertical lines can be shown in a graph, not only at value 0.
Also ticks can be added to the line so that it serves like a central axis.
Add additional horizontal or vertical lines to a graph that may also show ticks
Temperatures of selected cities
35
Average temperature (°C)
30
25
l
l
l
l
l
l
Berlin
London
Las Vegas
Moskau
Sydney
l
20
l
l
l
l
l
l
l
15
l
l
l
5
0
l
l
l
l
l
l
l
10
l
l
l
l
l
l
l
l
l
l
l
l
l
l
l
l
l
l
l
l
l
l
l
l
l
l
l
l
l
l
l
l
l
l
l
l
l
-5
l
-10
l
1
l
2
3
4
5
6
7
8
9
10
11
12
Month
Graph with an additional axis at Y-value = 0
4.3.5 Axis and tick labels
The next configuration tab allows you to set the axis and tick labels. The axis labels
are usually shown left of or below the axis. In the above example they are set to
"Number" and "Counter". Usually you will also find a unit in the axis label, e.g.
"Temperature (°C)". The tick labels are shown at the positions of the major ticks.
106
4.3 Edit style
Configuration of axis and tick labels
On the first sub tab you can again specify which labels are to be shown on the axis
and what style is used to display them. For the tick labels the number format can also
be specified. The offset value defines how far away from the axis the tick labels are
plotted. This value is valid for all axes and points away from the axis. Use negative
values to show the tick labels inside the graph.
On the sub tabs dedicated to the axes you can set the axis label and the position.
Angles of 0,90,-90 and 180 can be chosen to display the axis label.
Of course the axis and tick label style can be set here as well analogously to the other
settings described before.
107
4 Graphs
Define axis label, offset and angle
One important setting is the tick label setting which is set to numerical by default,
showing the numbers of the X values used to plot the data. Setting this option to user
allows you to define your own tick labels by using an expression. An example might
be "Point "..(5*(y-1)) to produce the following tick labels:
l
4
0
l
l
l
l
l
-4
Point 0
Point 5
Point 10
Point 15
Point 20
Point 25
Point 30
Number
Define the tick labels by an user expression
The variable y always starts with 1 at the first tick label and will be 2 at the second
and so on. Use the variable n to get the same values as the numeric setting. So
choosing "Numerical" from the menu or "User" with the expression n will produce the
same tick labels. But this setting enables you e.g. to show smaller values using an
expression like n/1000 and changing the units of the axis label.
It is also possible to access other tables. A nice addition is the special list command
which makes table access a little bit easier. Lets take a new data set showing the
average temperature of London over the year:
108
4.3 Edit style
Temperatures of selected cities
16.9
l
London
l
l
14.9
Average temperature (°C)
l
l
12.9
l
10.9
l
8.9
l
6.9
l
l
4.9
2.9
l
l
l
1
2
3
4
5
6
7
8
9
10
11
12
Month
Graph showing the average temperature of London over the year
If you create another table containing the month as string:
Table with months
If you now enter the expression list("Month",y) the content of the table called "Month"
is used to show the tick labels. The list command will always read the values of the
first column of the first sheet of a given table. The second argument takes the row
number. If the row number is higher than the number of rows it start from the
beginning.
109
4 Graphs
4.9
l
l
l
2.9
JanuaryFebruaryMarch April
May
June
July AugustSeptember
October
November
December
Month
It is possible to display the content of other tables as tick labels
Average temperature (°C)
The tick labels now show the content of the Month table. But as you can see the
characters overlap each other. You can now either reduce the number of major ticks
or use an individual tick label setting and set the alternate option to a value higher
than 0:
Set alternating tick labels if they are too long to be shown in one line. Note that also
the offset of the axis label was increased.
l
4.9
l
l
l
2.9
January
March
February
April
May
July
June
September
November
August
October
December
Month
Tick labels with an alternate value of 1
110
4.3 Edit style
l
4.9
l
l
l
2.9
January
April
February
July
May
March
August
June
October
November
September
December
Alternate set to a value of 2
The alternate option is only available on the X and X2 axis. Note that the offset
feature will also influence the vertical spacing between the labels. The maximum
number you can set is 5.
4.3.6 Grid lines
luafox allows you to show gridlines of different thickness, color and style. The
available styles are: solid, short dash, middle dash, long dash and dash dot as known
from draw. Additionally there are dots and spaced dots available. These dash patterns
are still fully compatible with the draw format and should display fine in every
application.
Display grid lines in X and Y direction
The grid lines are shown at the positions of the major and minor ticks even if they are
not shown. This also influences how many minor grid lines are shown.
111
4 Graphs
Randon data
32
l
28
l
24
l
l
l l
l l
l l
20
l l
l
Counter
l
16
l
l
12
l
l
8
l
l
l
l
l
l
4
l
l
l
l
l l
0
-4
0
5
10
15
20
25
30
Number
Graph with grid lines
4.3.7 Caption
A caption will show all lines plotted together with information about the curve being
shown. You can specify an X and Y offset from the top left corner of the graph. The v
space and h space values influence the distance between elements and between the
border of the caption. You can set a border and fill color as well as the line width of
the border.
You can define a font, font size and color for the descriptions in the caption. The
content of the caption can also be chosen. This can either be just the column number
or full info which shows the table and column number. It is recommended that you
use the Label field of the header and display this information in the caption.
Alternatively you can also show another header line by choosing "Header (Other)"
and entering the name of the header line into the writeable field.
Temperatures of selected cities
35
l
l
l
l
l
Average temperature (°C)
30
25
l
Berlin
London
Las Vegas
Moskau
Sydney
l
20
l
l
l
l
l
l
l
15
l
l
l
5
l
l
0l
l
l
l
l
l
10
l
l
l
l
l
l
l
l
l
l
l
l
l
l
l
l
l
l
l
l
l
l
l
l
l
l
l
l
l
l
l
l
l
l
l
l
-5
l
-10 l
1
l
2
3
4
5
6
7
8
9
10
11
12
Month
Caption shown in the top left corner of the graph
112
4.3 Edit style
The caption will show the curve symbol and line style next to the description, to make
identifying the curves easy. For the symbol the color of the first (leftmost) symbol in
the graph is taken because the symbol color may vary.
Configure the appearance of the caption
The temperature data shown in this example and in the following sections can be
found inside the data directory supplied together with luafox. It shows the average
temperature for every month of the year in Berlin, London, Las Vegas, Moscow and
Sydney.
113
4 Graphs
4.4 Line graph
The line graph tab has a number of sub tabs that will influence the style of the line
graph, You can define here the line and symbol style, configure a fill color and an
offset to arrange curves next to each other or on top of each other. You can also set
error bars and define a style for fits.
4.4.1 Line and symbol style
In the first sub tab you can define the line and symbol style. Let's have a look at the
line style first. From the menu you can choose a line width and a dash pattern. You
can choose a fixed value from the menu or take the last menu entry called
"dependent". This enables the writeable field to the right of the menu and you can
enter an expression.
Setting the line width and a dash pattern
Each curve belongs to a column in a table and hence you refer to the curves by the
variable x. For the first curve x will be 1, for the second 2 and so on. So you can use
an expression containing x to control the line style. Of course you can also control the
line color. The line color is defined by a RISC OS palette file. You can choose the
palette to be used for the line color. A palette file contains 256 colors and in the
expression field you can define which palette color is used as line color.
114
4.4 Line graph
Temperatures of selected cities
35
Berlin
London
Las Vegas
Moskau
Sydney
Average temperature (°C)
30
25
20
15
10
5
0
-5
-10
1
2
3
4
5
6
7
8
9
10
11
12
Month
Use an expression to set the line width and style
To view the available palettes click the open palette button and a filer window opens
that shows all available palette files. You can add more to this directory if you want.
Just drag a palette file to the writeable field left of the button or enter the name of the
file there.
Select a palette by drag & drop
115
4 Graphs
You can enter an expression in the field below. The settings as shown above will
produce a graph like this:
Temperatures of selected cities
35
Berlin
London
Las Vegas
Moskau
Sydney
Average temperature (°C)
30
25
20
15
10
5
0
-5
-10
1
2
3
4
5
6
7
8
9
10
11
12
Month
Setting line colors by using palette files
In this version of luafox it is not possible to set the color of lines individually. If you
want to do that either use !Draw or another vector package and import the draw file
into it to change the coloring or add text to the graph. Another possible way is to use
the expression field and the list command. Create a new table e.g. with the name
"Color" which contains just one column and insert the number of the palette color
you would like to use in every row. Now use the expression list("Color",x) and
the values are read from this table.
Let's have a look at the symbols representing data points. The symbols are defined by
a font which can be chosen freely from all installed fonts. In most cases a symbolic
font will be the best choice. luafox contains a special font for displaying data points
which is called MathPI.Bullets:
Chars application showing the MathPi.Bullets font
You choose the symbol by entering the ASCII code for the character. In the case of the
MathPI.Bullets font it may be a good idea to start with 65, an open circle. You can
also choose a size and an angle under which the symbol is shown. The symbol color
is defined like the line color described above. All fields allow you to use an expression
to display the graph.
116
4.4 Line graph
Setting the symbol and its style
Temperatures of selected cities
35
Average temperature (°C)
30
25
20
15
10
5
0
-5
-10
1
2
3
4
5
6
7
8
9
10
11
12
Month
Graph using the settings as above
The use of expressions makes the symbol style very powerful. In the following
examples a number of different expressions are used. The expressions are based on
the lua language and some examples are given in the next chapter. In the graph
shown above an expression x*8 has been used for the symbol color. This ensures
that every curve is colored differently. Here x is multiplied by 8 to increase the
117
4 Graphs
difference between colors because neighboring colors may be too similar, depending
on the palette used.
Temperatures of selected cities
35
Berlin
London
Las Vegas
Moskau
Sydney
Average temperature (°C)
30
25
20
15
10
5
0
-5
-10
1
2
3
4
5
6
7
8
9
10
11
12
Month
Here the expression y*8 is used where y represents the data rows of the data.
Temperatures of selected cities
35
Berlin
London
Las Vegas
Moskau
Sydney
Average temperature (°C)
30
25
20
15
10
5
0
-5
-10
1
2
3
4
5
6
7
8
9
10
11
12
Month
Another variable you can use is v which represents the data value. The above graph
uses the expression v*6+60 and the palette "temperature" which fades from blue to
red to represent temperature values.
118
4.4 Line graph
Temperatures of selected cities
35
Berlin
London
Las Vegas
Moskau
Sydney
Average temperature (°C)
30
25
20
15
10
5
0
-5
-10
1
2
3
4
5
6
7
8
9
10
11
12
Month
Here there are only three colors used: Below 0°C, below and above 20°C. This is
defined by the following expression:
v < 0.0 and 0 or v < 20.0 and 150 or 220.
Please note that you need to use floating point numbers when doing comparisons.
Using "20" instead of "20.0" does not work (see chapter about lua expressions).
Temperatures of selected cities
35
Berlin
London
Las Vegas
Moskau
Sydney
Average temperature (°C)
30
25
20
15
10
5
0
-5
-10
1
2
3
4
5
6
7
8
9
10
11
12
Month
In this example the symbol size is scaled with the value so that data symbols for high
values are larger than those of small values. This is done by using the expression 10+
v/3 in the size field.
119
4 Graphs
Configuration for displaying arrows indicating the temperature
Temperatures of selected cities
Ô
Ô
Ô
0Ô
5
Ô
Ô
Ô
Ô
ÔÔÔ
Ô
Ô
Ô
Ô
Ô
Ô
Ô
Ô
Ô
Ô
Ô
Ô
Ô
Ô
Ô
Ô
Ô
Ô
Ô
Ô
-5
Ô
ÔÔ
Ô
ÔÔ
Ô
Ô
Ô
Ô
Ô
Ô
Ô
10
ÔÔ
15
Ô
ÔÔ
20
Ô
Ô
Ô
Ô
Average temperature (°C)
25
Berlin
London
Las Vegas
Moskau
Sydney
Ô
Ô
Ô
Ô
Ô
30
ÔÔ
Ô
35
Ô
Ô
1
-10
Ô
2
3
4
5
6
7
8
9
10
11
12
Month
It is also possible to rotate the symbols to a given angle. This can be used to "create"
new symbols by rotating an existing one or to represent values like in this case where
the orientation of the arrows indicates the temperature.
120
4.4 Line graph
4.4.2 Filling
The second sub tab allows you to fill the area below the curve. Again you can choose
a palette for the fill color and use an expression. The fill color is independent of the
line color.
Configuring the fill color
Temperatures of selected cities
35
Berlin
London
Las Vegas
Moskau
Sydney
Average temperature (°C)
30
25
20
15
10
5
0
-5
-10
1
2
3
4
5
6
7
8
9
10
11
12
Month
Depending on the order of the data columns used to plot the graph the result may
not look as intended.
The graph above does not look good and some curves are not shown at all. You can
rearrange the data columns in the table and click on the refresh button on the toolbar
of the graph window to get a better result:
Temperatures of selected cities
35
Sydney
Las Vegas
Berlin
London
Moskau
Average temperature (°C)
30
25
20
15
10
5
0
-5
-10
1
2
3
4
5
6
7
8
9
10
11
12
Month
Rearrange the data columns in the table to show all curves
121
4 Graphs
If you own a vector graphics program that supports transparency, like e.g. ArtWorks,
you can further enhance the graph:
The same graph with transparency applied in an external application
Another possibility is to present the graphs on top of each other or next to each other
using the next sub tab: Waterfalls
4.5 Waterfall
You can apply an offset to the graphs by using the third sub tab. You have the option
to add an X or Y offset and give an expression to calculate the offset.
Applying an horizontal X offset
122
4.5 Waterfall
Temperatures of selected cities
35
Sydney
Las Vegas
Berlin
London
Moskau
Average temperature (°C)
30
25
20
15
10
5
0
-5
-10
0
12
12
12
12
12
Month
Showing the temperature curves next to each other. The tick labels need to be
adjusted to show the correct values on the X axis.
Average temperature (°C)
"Temperatures of selected cities"
1
2
3
4
5
6
7
8
9
10
11
12
Month
Applying a Y offset with the expression -20*(x-1).
123
4 Graphs
"Photoluminescence"
771
772
773
774
775
776
777
778
Wavelength (nm)
This graph has also been created by using a waterfall with Y offset.
4.6 Error bars
luafox can display X and Y error bars. Again the style of the error bars can be defined
according to your needs. The line width and the width of the cap can be defined as
well as the color of the bars. The value can be set in an expression field.
You can set a fixed value for the error or one relative to the value like shown above.
As in all other expression fields you can also access all table values. X error bars can be
defined in exactly the same way.
Configuration for the error bars
124
4.7 Fitted data
"Temperatures of selected cities"
35
l
30
l
l
Average temperature (°C)
l
25
l
l
l
l
l
l
l
l
10
l
l
5
l
l
l
l
15
l
0l
l
l
l
20
l
l
l
l
l
l
l
l
l
l
l
l
l
l
l
l
l
l
l
l
l
l
l
l
l
l
l
l
l
l
l
l
l
l
-5
l
-10 l
1
l
2
3
4
5
6
7
8
9
10
11
12
Month
Graph with Y error bars. The error is 10% of the value here.
4.7 Fitted data
If you fit data with luafox the data type is set to "Fit". In principle columns set to fit are
treated in the same way as Y data, but a different style is used to display the fitted
data.
Data points and a polynomial fit of them
In the default settings Y columns are shown by symbols only and a fit to this data is
shown by a red line. This is the default setting because in most cases experimental
data points should not be connected by lines because this suggest that unmeasured
points between two data points would be on this line which in general is not the
125
4 Graphs
case. The configuration allows you to define the line width, style and color of the
fitted line.
"Temperatures of selected cities"
16.9
l
l
14.9
Average temperature (°C)
l
l
12.9
l
10.9
l
8.9
l
6.9
l
l
4.9
2.9
l
l
l
1
2
3
4
5
6
7
8
9
10
11
12
Month
Experimental data is often shown as individual data points together with a fit
represented by a continues line.
Define the style for the fitting line
126
4.8 Bar graph
4.8 Bar graph
(introduced in luafox 1.2)
A new main graphical tab has been added to the graph style configuration allowing
you to change the appearance of bar graphs:
Settings for the bar graph
4.8.1 Alignment
luafox supports four different ways of displaying graphs. "Bottom" means that all bars
start from Value 0. This has the advantage the the top edge of a bar (or the bottom
one in case of negative numbers) corresponds directly to the value on the Y-axis.
However, if you have more than two data sets, then bars on the top may cover bars
further in the background.
Using the "bottom" alignment may cover bars further in the background (left) unless
the bars are made semi transparent in an external package like ArtWorks (right)
127
4 Graphs
You can try to change the plot order to bring another data set to the foreground but
it depends on the data values whether you will be able to show all information.
Another variant of the problem is to stack the bars on top of each other. Here the
advantage is that all graphs are fully shown but reading the absolute values is very
difficult. This type of graph is good to show relative differences between two or more
values or if only the topmost value is important (e.g. if you have three bars for
development, production and marketing costs which, put on top of each other, show
the total costs). Please note that this graph type is not recommended for data sets
which contain positive and negative values.
Temperatures of selected cities
90
1
London
Sydney
Las Vegas
Berlin
Average temperature (°C)
80
70
0.8
60
0.6
50
40
0.4
30
20
0.2
10
0
1
2
3
4
5
6
7
8
9
10
11
12
0
Month
Bars stacked on each other
Another option is to show bars stacked realtively so that the total value will be 100 %:
Product comparison
100
Development
Marketing
Human Resources
Production
Total costs (%)
80
60
40
20
0
Bikes
Furniture
Cars
Fashion
Computers
Relatively stacked bars
The fourth option is to display the bars next to each other. This allows you to show all
bars completely and to read the total value of each bar but the graph can get
confusing if there are to many bars shown at once.
128
Average temperature (°C)
4.8 Bar graph
Temperatures of selected cities
35
30
25
20
15
10
5
0
-5
-10
1
0.8
Berlin
London
Las Vegas
Moskau
Sydney
0.6
0.4
0.2
1
2
3
4
5
6
7
8
9
10
11
12
0
Month
Bars plotted next to each other
4.8.2 Width
The width of the bar is a relative number and the value 1 means that the width is
equal to the distance between to major ticks. With a width of 1 two bars next to each
other just touch each other, a value of 0.9 as shown in some of the above examples
shows th bars with a small white space left between them.
For graphs with bars plotted next to each other the width is interpreted as space
between each group of bars and not between each bar. In the graph above you see
that there are 12 groups of 5 bars each. The width setting in this case was 0.7.
4.8.3 Bar order
If the width is set to values above 1 bars start to overlap and there is an additional
style setting called the bar order which lets you define in what order the bars are
plotted. What this means is shown in the following graph with rising bars:
Temperatures of selected cities
16.9
1
London
14.9
0.6
10.9
8.9
0.4
6.9
0.2
Average temperature (°C)
Average temperature (°C)
0.8
12.9
4.9
2.9
1
2
3
4
5
6
7
8
9
10
11
12
0
Month
"Rising" bars
At the right side you can see that the bar belonging to december is placed on top of
november, that means in the foreground. Additionally the bars are sligtly different
coloured to enhance the effect. This graph was plotted with the following settings:
129
4 Graphs
The fill style used here works in a similar way like the style definitions of the line
graphs. A palette file defines the available 256 colors and the expression defines
which of the 256 colors to take. Here y is the number of the bar plotted, so the first
bar plotted has the value y = 1, the second bar y = 2 and so on. Because the palette
file starts with with a very dark green (or black to be precise) and ends with a light
green in the above graph the brightnes of the green bars increases from left to right.
There are four different alternative orders left: "Falling" which draws the bars from
right to left, "Concave" where the bar in the middle is in the foreground and "Convex"
where it is in the background as well as "Alternate" where every second bar is in the
foreground. The different orders are shown in the next graph:
Falling
Temperatures of selected cities
20
1
20
1
0.8
12
0.6
8
0.4
4
0.2
1
2
3
4
5
6
7
8
9
10
11
12
0
16
0.8
12
0.6
8
0.4
4
0.2
0
1
2
3
4
5
Month
Concave
Temperatures of selected cities
1
11
12
0
1
0.6
8
0.4
4
0.2
3
4
5
6
7
8
9
10
11
12
0
Average temperature (°C)
12
16
0.8
12
0.6
8
0.4
4
0.2
0
1
2
3
4
5
6
7
Month
Example of the other bar orders
8
9
10
11
12
0
Average temperature (°C)
0.8
Average temperature (°C)
Average temperature (°C)
10
20
Month
130
9
London
16
2
8
Temperatures of selected cities
Convex
London
1
7
Month
20
0
6
Average temperature (°C)
16
Average temperature (°C)
London
Average temperature (°C)
Average temperature (°C)
London
0
Temperatures of selected cities
Alternate
4.9 Quick switching of graph styles
4.8.4 Fill and outline style
As already mentioned in the previous paragraph the possibilities to fill the bars with a
color and the way its outline looks can be defined very similar to the style settings of
the line graph.
With the setting above the bars are not filled and the dash style of the outline
changes between the data sets (Style = dependent and Expression = x-1). Also the
color information is taken from palette file "BlackBody" and then the expression x*50
is used as value for the outline color.
Temperatures of selected cities
34.9
London
Las Vegas
Sydney
Average temperature (°C)
30.9
26.9
22.9
18.9
14.9
10.9
6.9
2.9
1
2
3
4
5
6
7
8
9
10
11
12
Month
Bars with different outlines: Changes in dash pattern and color
4.9 Quick switching of graph styles
(introduced in luafox 1.2)
To configure the graph style ConiX is used which lets you save all current settings as
profile which you can use in other graphs and which allows you to change between
styles.
luafox 1.2 introduces a shortcut if you just want to change between predefined styles.
Just click the Edit Style Button with the right mouse button and a menu pops up
which shows the currently predefined styles. Selecting an entry will apply your choice
131
4 Graphs
to the graph.
Click with Adjust on the Edit Style Button to open a menu with predefined styles to
choose from.
4.10 Edit curves
(introduced in luafox 1.2)
The Edit Curves Button opens a dialog listing all data sources shown in the graph and
lets you add, delete and edit curves or bars shown in the graph.
Dialog box for adding, editing and deleting curves
132
4.10 Edit curves
On the left side all data sources shown in the graph are listed in the format
Tablename[sheet][column] - Label. The label is only shown when it is defined. To add
a new curve to the graph just click on the add button to open a new dialog box:
Choose the data source using the menu structure
Press the menu button to browse through the available data stored in tables, sheets
and columns. The menu is dynamically created and shows all tables stored in the
Progam Manager.
Choose the x and y axis
You can also choose the the x and y axis for the new curve. In the same way you can
also edit an existing curve. Just select the curve to be changed in the list and click on
the edit button.
To delete curves you can also just select them and press the delete button. The
position of a curve can also be changed here. This will rearrange the list and therefore
the plotting order in the graph. This can be usefull if in a bar graph bars where bars
with higher values hide other, smaller bars. The result can directly be seen in the
graph.
It is also possible to create a new graph from the Project Manager Menu, see the
section about the Project Manager.
133
4 Graphs
4.11 Graph menu
The menu of the graph window is very similar to the toolbox buttons. You can save
the graph as draw file and print it.
Main graph menu
Click on the Edit... entry to open the dialog box which lets you add, edit and delete
curves or bars to or from the graph. The style submenu allows you to open the main
style configuration window already at the tab you want to edit:
Style sub menu
The Zoom submenu sets the current zoom level. Click refresh to recreate the graph.
This is usefull if you changed data points in the table which are shown in the graph.
134
5.1 Tables
5 Lua expressions
As you might guess, luafox is written in the programming language lua,
hence the name. It is planned that future versions of luafox will also allow
the user to write their own scripts to perform tasks automatically. In the
current version you only need to know a little bit about lua when dealing
with writeable fields and user defined formulas. A complete description
and user manual can be found online. There are good reasons to have a look at lua
as a general programming language under RISC OS since it as easy to use as BBC
Basic, but much more powerful. This section will describe a number of typical
situations where you have to deal with the lua syntax.
5.1 Tables
The dominant data structure in lua and also in luafox is a table. Tables are created
quite easily in lua:
Tablename = {23,642,54,7,0,66}
This command creates a table with the name "Tablename" containing the values in
brackets. To access the values you use square brackets, e.g. Tablename[3] will
have a value of 54 because this is the third table entry. Note that the first value of the
table definition will be associated with the element number 1 and not 0 as you might
expect. You can also set values by using an expression like Tablename[22] = 12.
You do not need to set a dimension for the table beforehand; you can always insert
elements anywhere in the table, e.g. in this example the elements 1-6 and 22 contain
a value. If you try to access Tablename[13] for example the value will be nil; this is a
special type in lua which is not zero and also not false. It just means that the value is
undefined. You can also use this to delete table entries. If you enter Tablename[22]
= nil the value will be set back to nil and the table only contains 6 elements again.
Unlike many other programming languages lua allows you not only to have numeric
indices (also called keys) but also other kinds of objects. You can use a string, for
example:
Tablename["info"] = "This is a string value"
So here the index or key is "info", a string, and the value is also a string in this case. It
is not necessary that key and value have the same type:
Tablename["counter"] = 1
is perfectly valid. There is a shortcut to read or write this value. Instead of
Tablename["counter"] you can simply use Tablename.counter. Both are
identical and can be used at will. In lua it is even possible to use functions as keys or
values which makes the table data type very powerfull.
A value of a table can also be another table. If you enter the expression:
Tablename[7] = {7,2,55,24,757,89}
Then the seventh element of the table Tablename will now contain another table. You
can read this with an expression like Tablename[7][3] which has a value of 55.
This structure is also used in luafox.
If you create a table in luafox it can have more than one sheet. Every sheet is stored in
135
5 Lua expressions
one element of the table you created. So if you create a new table called "Tablename"
in luafox then Tablename[1] will contain the first sheet, Tablename[2] the second
and so on. This "sheet" e.g. in Tablename[1] is another table with a number of
elements. These elements contain the columns of a table. So Tablename[1][1] will
be the first column of the first sheet, Tablename[2][4] will be the 4th column of
the second sheet. Again every column consists of a number of data elements. These
now contain the data values that are shown in a luafox table window. So
Tablename[1][1][1] will have the value of the first element of the first column of
the first sheet in table "Tablename". So in general you can access data values by an
expression like:
Tablename[sheet][column][row]
Use an expression like this to access data values from other tables or as part of any
expression.
5.2 Numbers
By default lua does not have different number types for integers, floats, doubles and
so on. This is different from RiscLua. There, a numeric variable may only contain
integer numbers. If you want to use floating point numbers you need to enter an
expression like:
floatnumber = @"23.45"
Here "floatnumber" is just a name and you can replace it by any valid variable name,
the important part is @"23.45" which defines a floating point value of that type. The
type of this number is "userdata" and not "float" as you might expect. Lua allows you
to define your own data types which have the type "userdata". If you have a variable
containing a string like: nstring = "23.45" you can use floatstring =
@(nstring). To convert it back use an expression like
intnumber = #(floatnumber)
Again, "intnumber" is just a name, the important part is #(variable).
All this is not usually important when using luafox because the transformation is done
in the background. Unfortunately it is not always clear whether you want to use an
integer or floating point variable. When comparing numbers, only integers or floats
can be compared with each other:
Expression
Result
5<7
true
6 > 12
false
4.6 > 3.2
true
12.1 < 4.9
false
11.8 > 4
- (undefined)
11.8 > 4.0
true
There is a problem in the second last row because we try to compare a floating point
number with an integer number. The easiest solution is to convert the integer number
into a floating point number by adding a ".0", so to convert "4" into "4.0". This might
136
5.3 AND, OR and NOT
not be as obvious when dealing with variables. If you enter an expression containing
"v < 5" it may fail because the variable v is most probably a floating point value and 5
is not. You can try v < 5.0 instead but this may fail if v is an integer. So the best way
is to use 1.0*v < 5.0, so to multiply an integer or float value (v) with a float value,
because the result will be a float value in any case. An alternative is to use integers:
#(v) < 5 to convert the value v into an integer value, if it is a float value, otherwise
this does not work. Use #(1.0*v) < 5 to be sure it works in any case. Note that the
#() operator always round down, so #(4.8) = 4!
5.3 AND, OR and NOT
The logic operators AND, OR and NOT can be very useful when dealing e.g. with
graph styles or other expressions. When programming in lua an often used expression
fordefining a variable is e.g.:
cellwidth = defaultwidth or 10
If defaultwidth is defined and does not have the value nil or the value false then
cellwidth is set to defaultwidth. If defaultwidth is not defined then it will be set to 10.
When using "and" it can be even more powerfull:
cellwidth = type(defaultwidth) == "number" and defaultwidth or 10
The type command will return the type of a variable as a string, e.g. "string",
"function", "number" or "table". The double equal sign is a comparison of two values
which will return true if they are the same and false if not. So if defaultwidth is a
number then type(defaultwidth) will return "number" and hence the expression
type(defaultwidth) == "number" becomes true. If the first expression is true
then the value after the "and" is taken, otherwise the value after the "or" is taken.
Use an expression to define the symbol color of a graph
Let's take another example: When, editing the style of a graph, you would like to
color the data points according to the value, you can enter an expression (see the
Chapter about graphs). In the simplest case you would enter e.g. Expression = v
where v is the value of the data point. If you plot some temperatures and you scale
the coloring, as in the example above, you might end up with blue colors for low
temperatures that fade into red colors for high temperatures. Now let's assume that
you do not want a smooth color fade between blue and red but you would like to
color all values below 0 blue, and all above red. You can do this with the following
expression:
v < 0.0 and 1 or 255
if v is smaller than zero the expression will become 1 (this is the blue color in the
temperature palette), otherwise it will be 255 (red color). You can also add more
conditions:
137
5 Lua expressions
v < 0.0 and 1 or v < 10.0 and 100 or 255
This will color everything below 0 blue (1), between 0 and 10 violet (100) and above
red (255). This expression is also shown in the following diagram:
v < 0.0 and 1 or v < 10.0 and 100 or 255
v < 0.0
false
true
v < 10.0 true
false
1
100
255
Interpretation of an expression
Note that if the first condition is true (v is below zero) the expression will become 1
and the rest of the expression is ignored.
So if you enter the following expression:
v < 10.0 and 100 or v < 1.0 and 1 or 255
There will be no blue data points. This is because all values smaller than 10 are also
smaller then 0. So one the first condition is true the expression becomes 100 (violet).
If it is false then also the second condition is false and the expression becomes 255
(red). So be carefull with the order of conditions.
You can also use brackets:
(v < 0.0 or v > 10.0) and 1 or 255
Now the expression will be 1 if the data point is below 0 or above 10, everything
between will return a value of 255.
Remember that you need to use the double equal sign when comparing two values:
v == 0.0 and 1 or 255
This will make all data points red, except those exactly 0.
There is also an expression for "unequal":
v ~= 0.0 and 1 or 255
This will make all blue except values that are zero.
Also you can use the not expression to invert expression:
v < 5.0 and not (v < 0.0) and 0 or 255
This will color all data points red except those between 0 and 5.
138
5.3 AND, OR and NOT
6 Credits
I would like to thank a number of people who have helped me to develop luafox.
First I would like to thank the developers of the programming language lua and the
people on the lua mailing list for their help with several questions. I am very grateful
to Gavin Wraith, who ported lua to RISC OS and has helped me a lot. He also
extended RiscLua based on my wishes. Thanks to Michael Lutz and David Manura for
luamatrix.
I would also like to say thanks to Rik Griffin who developed the TreeView and Tabs
module that is used extensively in luafox. He added a lot of features to the TreeView
module to enhance the usage of luafox further.
Paul Reuvers developed the excellent configuration utility that is used in luafox for the
main configuration and the graph settings - thanks a lot, it has speed up the
development of luafox a lot.
Hillary and Matthew Phillips kindly allowed me to use their !DrawPrint application for
printing from luafox and even enhanced the application in many ways to optimise the
interaction with luafox - thank you very much!
I would also like to thank the people on the comp.sys.acorn.programmer newsgroup
for their friendly help on many topics.
Thanks also to the EXIST Gründungsstipendium for financial support and help as well
as to Manfred Bayer and Sebastian Hanny of the TU Dortmund.
139