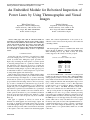
1
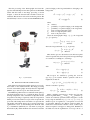
2nd International Conference on Applied Robotics for the Power
Industry, ETH Zurich, Switzerland, September 11-13, 2012
Tu3A.2
An Embedded Module for Robotized Inspection of
Power Lines by Using Thermographic and Visual
Images
Walter Fetter Lages
Vinı́cius Scheeren
Department of Electrical Engineering
Federal University of Rio Grande do Sul
Porto Alegre, RS, 90035-190 BRAZIL
E-mail: [email protected]
Department of Electrical Engineering
Federal University of Rio Grande do Sul
Porto Alegre, RS, 90035-190 BRAZIL
E-mail: [email protected]
Abstract—This paper deals with an embedded module for
automation of thermographic inspection. The module captures
video streams from an infrared camera and from a visible image
camera and performs an image processing to detect faults. The
protocols used to capture the image streams and the image
processing are discussed. The results, with the faults highlighted,
are sent through an synthetic image stream to a supervision
station.
I. I NTRODUCTION
Power lines can wear out because of several factors, which
can result in high power loss or even complete power faults
caused by broken lines. Emergency repair procedures are
high costly, motivating the development of systems capable
of detecting damaged lines in a predictive manner. Power
line inspection robots have been proposed to overcame the
problems associated to human inspection, such as the tedious
task and the resulting fatigue of operators. This paper proposes
an embedded module for robotized inspection of power lines
by using thermographic and visual images.
That module receives images from a thermographic camera
and from a visible image camera, process them to detect faults
and send the images and diagnostics to a remote monitoring
station. Robotic systems for power line inspections have been
proposed with research focusing on the locomotion system [1],
[2], as well as on methods for fault detection [3], [4]. As the
proposed module will be embedded in a robot, dimensional,
weight and power consumption requirements become very
important. It is a paradox, but even with the robot operating in
active lines, the power available to the robot is limited, since it
should operate from batteries or power obtained by induction
from the power line itself. However, the methods to obtain
power from the line itself can provide only about a hundred
Watts [5].
This paper is organized as follows: in section II, the
hardware for thermographic and visual image capture and
processing is described. Section III presents the processing
of the thermographic images to detect hot-spots and abnormal
conditions in the power line, while section IV shows the details
of the capture of the video streams from the thermographic
©2012 IEEE
camera. The software implementation of the system is described in section V and section VI presents some results and
concluding remarks.
II. H ARDWARE
The thermographic camera is a FLIR A320, which send
images through an Ethernet connection using RTSP (RealTime Streaming Protocol) [6]. Table I shows the stream
formats supported. All formats are 16 bits per pixel.
TABLE I
S TREAMS SUPPORTED BY FLIR A320 CAMERA .
Encoding
MPEG4
MPEG4
MPEG4
FCAM
FCAM
RAW
RAW
Resolution
640 × 480
320 × 240
160 × 120
320 × 240
160 × 120
320 × 240
160 × 120
Note that the MPEG4 640 × 480 format is an interpolated
resolution, as the sensor resolution is 320 × 240. The FCAM is
a Flir proprietary format for raw data. Streams in RAW format
can be either raw data from the camera sensor or a radiometric
image, calibrated in Kelvin. The measurement range is from
0o C to 350o C with an accuracy of ±2o C. The temperature
resolution can be set to be either 0.1 Kelvin or 0.01 Kelvin.
In this work, a 320 × 240 RAW radiometric stream with
resolution of 0.1 Kelvin was used. The frame rate is 9 Hz.
The processing module is a BeagleBoard-xM, which uses
an ARM processor due to its good ratio between processing
power and power consumption, which also motivates its use in
cell-phones, PDAs and tablets. Another important point is that
the ARM processor is well supported by the Linux operating
system, which can be easily customized for a low footprint
in memory and system resources. The OpenEmbedded crosscompilation framework [7] is used to generate a customized
version of the Linux Ångström distribution [8]. The visible
spectrum camera is a Logitech C2010, which uses an USB
connection.
58
After the processing of the thermographic and visual images, the embedded inspection module generates another RTSP
stream with the results of the image processing, as shown
in figure 1, where the detected faults and their locations are
evidenced. That stream is received in a monitoring station. The
Live555 library is used to receive and transmit RTSP streams.
pixels belonging to the foreground and those belonging to the
background:
2
σW
= ωb (µb − µt )2 + ωf (µf − µt )2
(1)
2
Tt∗ = arg max σW
(2)
Tt
where:
2
σW
: variance;
ωb :
probability of a pixel belonging to the background;
ωf : probability of a pixel belonging to the foreground;
µb :
mean of background pixel values;
µf : mean of foreground pixel values;
mean of all pixel values;
µt :
Given the thermographic image α(x, y), the foreground
γ(x, y) is given by:
(
α(x, y) if β(x, y) = 1
γ(x, y) =
(3)
0
otherwise
where the foreground mask β(x, y), is given by:
(
1 if α(x, y) ≥ Tt∗
β(x, y) =
0 otherwise
(4)
Then, the hot-spots are detected based on the hottest pixels
of the foreground. First, the hottest pixels in foreground image
are searched for, resulting in a seed image:
(
1 if α(x, y) = Tmax
Ω0 (x, y) =
(5)
0 otherwise
with
Tmax = max γ(x, y)
(6)
Tmin = min γ(x, y)
(7)
x,y
x,y
Fig. 1.
System hardware.
III. T HERMOGRAPHIC I MAGE P ROCESSING
Each frame from the thermographic camera is processed to
detect faults on the transmission line. The image processing
is based on the Thermography Anomaly Detection Algorithm
(ITADA) [9] to detect hot-spots and classify the fault.
The ITADA algorithm is based on statistical and morphological methods. The first step is to segment the image in lower
and high temperature areas, named the background and the
foreground of the image, respectively. Only the foreground is
further processed in search for hot-spots since it represents the
power line. The background is discarded as it represents the
surrounding environment and not the power line. The image
segmentation is done by thresholding. The threshold value
Tt∗ is determined dynamically for each frame by using the
Otsu method [10], which maximizes the variance between the
©2012 IEEE
The hot-spots are obtained by growing the seed image Ω0 (x, y) in recursive dilation operations with an 8neighborhood mask B:
Ωk (x, y) = (Ωk−1 (x, y) ⊕ B) ∩ C(x, y)
with the constraint C given by:
(
1 if Tmax − 0.6(Tmax − Tmin )
C(x, y) =
0 otherwise
(8)
(9)
Hence, a neighbor pixel belongs to the hot-spot if its temperature is greater than Tmax −0.6(Tmax −Tmin ). Dilation operations are recursively performed until convergence to stable
hot-spot regions such that Ωk (x, y) = Ωk−1 (x, y) = Ω∗ (x, y).
Small hot-spots are regarded as a consequence of noise and
are discarded. Therefore, the dilation operations makes the
method more robust and less sensitive to noise, as the hot-spot
detection requires local support of many pixels. Furthermore,
the dilation avoids the segmentation of a hot-spot in two or
59
more due to noise. Each connected region in Ω∗ (x, y) is a
hot-spot Ai (x, y), with i = 1 · · · Nh .
The mean temperature of each hot-spot Thoti is used to
detect faults in the cable and is given by:
Thoti =
1 XX
γ(x, y)∀(x, y) ∈ Ai (x, y)
Di x y
with
Di =
XX
x
Ai (x, y)
(10)
(11)
y
Each hot-spot temperature Thoti is compared to the mean
temperature of the foreground without the detected hot-spots
Tref , which represents the cable temperature under normal
conditions. The reference temperature is computed based on
the foreground without the hot-spots:
ρ(x, y) = β(x, y) ∩ Ω∗ (x, y)
IV. I MAGE R ECEPTION AND T RANSMISSION
The stream from the thermographic camera is in the format
defined by RFC4175 RTP Payload Format for Uncompressed
Video [11]. The uncompressed format is ideal for image
processing, as there are not distortions introduced by the
compression and there is no time spent decompressing the
image. After the image processing and fault detection, the
inspection module transmits the results using the MPEG4
format, which is a compressed format, in order to reduce
the required bandwidth and to enable the visualization in any
standard media player such as VLC or Mplayer. The results
from the inspection module are used just for visualization
and not for processing. Hence, there is no need to transmit
uncompressed video. However, in both cases, the stream is
transmitted as a RTP (Real Time Protocol) [12] frame. Figure
2 shows the protocol stack.
(12)
where ¯· denotes the complement of ·.
The reference temperature mask ρ(x, y) has a total number
of pixels given by:
XX
ρ(x, y)
(13)
Nref =
x
y
Then, the reference temperature can be computed as:
Tref =
1 XX
γ(x, y)if ρ(x, y) = 1
Nref x y
(14)
Hot-spots are classified according to table II based on the
percent raise of its average temperature Thot1 with respect to
the reference temperature Tref [9]:
∆T i =
Thoti − Tref
Tref
(15)
TABLE II
H OT- SPOT CLASSIFICATION .
Condition
Normal
Attention
Fault
∆T i
∆T i < 9%
9% ≤ ∆T i < 90%
90% ≤ ∆T i
The determination of the threshold value for image segmentation is the most demanding step in terms of computing
resources, as the optimization is performed by exhaustive
search. The variances should be computed by supposing that
the threshold value is each point in histogram of 16 bit data.
That means to compute the variances of the foreground and
background 65536 times for each frame. In order to reduce
the computing time, an auxiliary histogram is built by using
only the most significant byte of each data. That way, a
256 time smaller histogram is obtained, which is used to
compute an approximation of the optimal threshold value. This
approximate value is used as a initial point for a local search
for the optimal point in the full histogram.
©2012 IEEE
Fig. 2.
Protocol stack.
The Real Time Streaming Protocol (RTSP) [6], is used to
control the transmission of the streams through the commands:
• OPTIONS: list the supported optional commands
• DESCRIBE: list the streams available by the camera
• SETUP: set one RTP session using a specific stream
• GETPARAMETER: get parameters like frame rate and file
format
• PLAY: start to send the streams
• PAUSE: pause the sending of streams
• TEARDOWN: close the RTP session
Hence, the user can control the stream transmission much
like a DVD player. Figure 3 shows the state machine of the
RTSP protocol.
The Session Description Protocol (SDP) [13] is used
to describe the desired session parameters such as such
as session name, media name, address and connection
information. The SDP protocol is used in the setup phase.
In this phase, the server describes the available streams
to the client, which then configures the parameters for the
desired stream. Figure 4 shows the SDP description for
the RAW 320 × 240 stream used in this work. The SDP
session description begins at the line which starts with v=0.
60
Fig. 3.
RTSP state machine.
Notice the line starting with a=rtpmap: which starts the
description of the desired stream. The stream is described by
a=rtpmap:103 raw/90000,
a=framesize:103
320-240
and
a=fmtp:103 sampling=mono;
width=320; height=240; depth=16.
RTSP/1.0 200 OK
CSeq: 2
Date: 24 May 2012 12:58:17 GMT
Content-Type: application/sdp
Content-Length: 402
Content-Base: rtsp://10.1.32.1/
v=0
o=- 0 0 IN IP4 10.1.32.1
s=IR stream
i=Live infrared
t=nowc=IN IP4 10.1.32.1
m=video 13124 RTP/AVP 103
a=control:rtsp://10.1.32.1/sid=103
a=framerate:30
a=rtpmap:103 raw/90000
a=framesize:103 320-240
a=fmtp:103 sampling=mono; width=320; height=240; depth=16
Fig. 4.
SDP description for the RAW 320 × 240 stream.
Fig. 5.
Data flow.
V. S OFTWARE I MPLEMENTATION
The software executing in the inspection module is divided
in three modules running as daemons, as shown in figure 5:
• receiver: receives images from the thermographic
camera.
• detector: captures images from the visual camera,
acquires the images from the receiver and detects hostspots and faults, generating a synthetic images with the
hot-spots and fault data.
• transmitter: Transmits the stream of synthetic images generated by the detector.
There is not a specific daemon for the capture of visual
camera images because the camera supports the UVC format,
which has an available driver in the Linux kernel. However,
the camera image is represented in the YUV model. The image
is converted to the RGB model by (16)-(18).
R
=
1.164(Y − 16) + 1.596(V − 128)
G
=
1.164(Y − 16) − 0.813(V − 128)
B
=
©2012 IEEE
(16)
−0.391(U − 128)
(17)
1.164(Y − 16) + 2.018(U − 128)
(18)
The modular system architecture allows for an easy replacement of the receiver or transmitter modules, should
another stream format be more convenient. The communication and data transfer between the modules is done by shared
memory, thus avoiding to copy images. The read and write
operations are synchronized by semaphores.
The liveMedia library from the live555 project [14] is used
to decode the RTP (Real-Time Protocol) [12] received stream
and to encode the RTP stream to be transmitted. The architecture of this library defines the abstract FramedFileSource
and MediaSink classes, representing a generic source or
sink of streams. However, in the implementation of the live55
library, those classes are derived to implement only the
ByteStreamFileSource and FileSink classes. Those
classes implement stream read and write operations from
(magnetic media) files. Due to the low performance, limited
by the file system, that is not a good solution for sharing
streams between tightly coupled tasks as the implemented by
the inspection module daemons.
In order to use shared memory based communication, the
abstract classes of the liveMedia library were derived in
61
two new classes, ShmSink, to receive a stream through
shared memory and ByteStreamShmSource to send the
stream through shared memory. The ShmSink class is used
by the receiver daemon to receive streams from the
thermographic camera through shared memory, while the
ByteStreamShmSource class is used to to send the stream
to the transmitter daemon through shared memory. Note
that those new classes are extensions of the classes from the
liveMedia library which as not changed in any way, ensuring
the compatibility and correctness of the stream handling.
The receiver daemon receives a stream from the thermographic camera an sends the data to the detector daemon.
An RTSP session with the camera is initiated, then, the appropriate stream (RAW data without compression) is selected. The
received RTP frames are sent to the detector daemon. The
frames are sent with the headers defined by RFC4175 and there
is no direct correspondence between each RTP frame and each
image frame. The detector daemon should concatenate the
RTP frames to assembly an image frame to be processed.
The detector daemon, processes the image and generates
a stream with the results, which is transmitted by the remote
monitoring station by the transmitter daemon.
A requirement for the development of the inspection module
was that the monitoring station should be required to execute
any proprietary software, in order to enable any computer to be
used as a monitoring station. Therefore, the stream with results
is transmitted in MPEG4 format, which can be visualized by
using any conventional player such as VLC or Mplayer. The
conversion of the video stream to the MPEG4 format is done
by using the libavcodec library [15].
Even if the processed stream is transmitted to the remote
monitoring station, for debugging purposes it is convenient to
view the images while they are still in the processing module.
Hence the detector has a optional graphical interface based
on the GTK library [16], which can be used to see the
generated stream before transmission to the monitoring station.
Figure 6 shows such an interface. The upper left corner of the
figure shows the thermographic image, while the lower left
images shows the detected foreground. The upper right image
shows the detected hot-spot and the lower right image shows
an image in the visible spectrum. The text in the bottom of
the window shows the classification of the hot-spot.
Fig. 6.
Detector graphical interface.
Fig. 7.
Results seen in the VLC player.
VI. C ONCLUSION
Experimental results are shown in figure 7, where a the
screen of the monitoring computer running the VLC player
can be seen. A damage in the cable was mechanically forced,
thus reducing its section. A high current power source was
used to simulate the high currents seen in real power lines.
The system was able to efficiently detect faults, producing
a real time report for the operator where the detected faults
are highlighted. The requirements of low power consumption
and small dimensions were satisfied, as well.
ACKNOWLEDGMENT
The authors would like to thank the financial support
from Conselho Nacional de Desenvolvimento Cientı́fico e
©2012 IEEE
62
Tecnológico (CNPq), Coordenação de Aperfeiçoamento de
Pessoal de Nı́vel Superior (CAPES), Fundação de Apoio à
Pesquisa do Estado do Rio Grande do Sul (FAPERGS) and
Companhia Estadual de Energia Elétrica (CEEE).
R EFERENCES
[1] S. Montamblaut, “About the future of power line robotics,” in Proceedings of the 1st International Conference on Appied Robotics for the
Power Industry, Montréal, 2010.
[2] V. M. de Oliveira and W. F. Lages, “Control of a brachiation robot for
inspection of aerial power lines,” in Proceedings of the 1st International
Conference on Appied Robotics for the Power Industry, Montréal, 2010.
[3] H. Li and B. Wang, “Research on the infrared and visible powerequipment image fusion for inspection robots,” in Proceedings of the
1st International Conference on Appied Robotics for the Power Industry,
Montréal, 2010.
[4] J. H. E. de Oliveira and W. F. Lages, “Robotized inspection of power
lines with infrared vision,” in Proceedings of the 1st International
Conference on Appied Robotics for the Power Industry, Montréal, 2010.
[5] J. Caxias, F. A. Silva, and J. F. C. S. Sequeira, “Transmission line
inspection robots: Design of the power supply system,” in Proceedings
of the 1st International Conference on Appied Robotics for the Power
Industry, Montréal, 2010.
[6] H. Schulzrinne, A. Rao, and R. Lanphier, “Real time streaming protocol
(RTSP),” Network Working Group, RFC 2326, April 1998, available at
hftp://ftp.ietf.org/rfc/rfc2326.txti.
©2012 IEEE
[7] OpenEmbedded Team, OpenEmbedded User Manual, 2009, hhttp://docs/
openembeded.org/usermanual/usermanual.pdfi.
[8] L. Merciadri and K. Koën, Ångström Manual, Jun 2010,
hhttp://www.student.montefiore.ulg.ac.be/∼merciadri/angstrom/files/
angstrom-manual.pdfi.
[9] Y.-C. Chou and L. Yao, “Automatic diagnosis system of electrical
equipment using infrared thermography,” in Proceedings of the 2009
International Conference on Soft Computing and Pattern Recognition.
IEEE Computer Society, 2009, pp. 155–160.
[10] N. Otsu, “A threshold selection method from gray-level histograms,”
Systems, Man and Cybernetics, IEEE Transactions on, vol. 9, no. 1, pp.
62–66, jan. 1979.
[11] L. Gharai and C. Perkins, “RTP payload format for uncompressed
video,” Network Working Group, RFC 4175, September 2005, available
at hftp://ftp.ietf.org/rfc/rfc4175.txti.
[12] H. Schulzrinne, S. Casner, R. Frederick, and V. Jacobson, “RTP: A
transport protocol for real-time applications,” Network Working Group,
RFC 1889, January 1996, available at hftp://ftp.ietf.org/rfc/rfc1889.txti.
[13] M. Handley, V. Jacobson, and C. Perkins, “SDP: Session description
protocol,” Network Working Group, RFC 4566, July 2006, available at
hftp://ftp.ietf.org/rfc/rfc4566.txti.
[14] LIVE555 Streaming Media, Live Networks, Inc., Mointain View, CA,
2011, available at hhttp://www.live555.com/LiveMediai.
[15] Libav, Libav codec library, 2012, hhttp://www.libav.orgi.
[16] The GTK+ Team, “The GTK+ project,” 2012, hhttp://www.gtk.orgi.
63