1
Quicklook2 Users’ Manual
v2.2
3D Image Analysis Software for FITS images
Written by: Michael McElwain, Jason Weiss
& Marshall Perrin
UCLA Infrared Laboratory
March 20, 2008
Table of Contents
Table of Contents............................................................................................................ 2
I. Introduction .............................................................................................................. 2
• Purpose of Quicklook v2.2.............................................................................. 2
• History of Quicklook ...................................................................................... 2
• Usage at Keck: IQL2, SQL2, OQL2 ............................................................... 3
• FITS Files and Headers................................................................................... 3
• Image Manipulation and Data Analysis........................................................... 4
II. What’s New in Version 2.2?.................................................................................... 5
III. Using Quicklook v2.2 ............................................................................................ 8
• Starting Quicklook.......................................................................................... 8
• The Control Widget ........................................................................................ 8
• The Image Window Widget .......................................................................... 11
• The Plot Window Widget ............................................................................. 18
IV. Advanced Features............................................................................................... 19
• Configuration Files....................................................................................... 19
• Shortcuts ...................................................................................................... 21
V. Installing Local Versions of QL2 .......................................................................... 22
I.
Introduction
Purpose of Quicklook v2.2
The main purpose of Quicklook v2.2 (QL2) is to provide OSIRIS users with realtime data inspection and a simple means for cursory “quick look” data analysis. Of
course, QL2 can be used for post-observing analysis of 2 or 3-dimensional (2D/3D) .fits
as well. QL2 can read and visualize any standards-compliant 2D/3D FITS file. Files can
have multiple header/data units (HDUs), but the extensions must be of the same
dimension as the main file. QL2 is an object-oriented, configurable, Interactive Data
Language (IDL) software package that is compatible with the Keck instruments and
servers. It is platform independent program, and runs on UNIX, Linux, MacOS, and
Windows.
History of Quicklook
QL2 is an extension of the Quicklook v1.0 (QL) 2D image analysis software
package that was developed in 1995 for NIRSPEC (McLean et al. 1998) by James
Larkin, Tim Liu, and Harry Teplitz. The initial goal of QL was to provide simple image
analysis functions such as horizontal and vertical cut plotting, surface and contour
plotting, color stretching, photometry analysis, image arithmetic, and zoom. QL was
originally hard coded with specific NIRSPEC instrument properties and keywords. In
1999, Jason Weiss extended the hard coded keywords by making configuration files that
were used to set keyword parameters for any instrument. This enabled the QL software
to operate with NIRC2, KCAM, and other Adaptive Optics (AO) instruments on Mauna
Kea. Each instrument has its own configuration file with parameters for platescale, filter
information, telescope properties, and FITS header keywords. In addition, a set of AO
tools were incorporated by Jason Weiss, John Gathright, and Olivier Lai to calculate
Strehl ratios and execute reduction algorithms. The QL code is written according to
Keck standards and can poll any KTL-based RPC Keyword server. QL remains the Keck
AO image analysis software more than a decade since its inception.
QL2 combines the existing user-friendly features of QL with a package for 3D
data analysis. The name QL2 is somewhat of a misnomer considering its enhanced
analysis features, although the name was retained for traditional purposes and out of
respect for its namesake. Jason Weiss designed the initial QL2 structure with multiple
configurations and the ability to run efficiently using new versions of IDL. Michael
McElwain took over the QL2 project in 2002 and made considerable modifications and
extensions to the initial framework. With Mike’s departure for Princeton, the QL2
software is now maintained by Marshall Perrin, with help from Shelley Wright and Jason
Weiss.
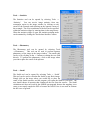
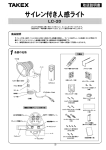
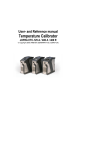
Usage at Keck: IQL2, SQL2, OQL2
OSIRIS has two detectors – one used as an imager, and
one used for the imaging spectrograph. When taking an
exposure, it is recommended to have three QL2 windows
– one for the raw imager frames (IQL2), one for the raw
spectral imaging data (SQL2), and one for the spectral
imaging data cube produced by the OSIRIS online DRP
(OQL2). It is often useful to inspect the counts and
relative positioning in the raw spectral imaging data, but to be honest, only James Larkin
is able to make out any of the spectral features and slopes before the OSIRIS DRP
reduction. When you start the night, you should select ‘Quicklook 2 Imager’, ‘Quicklook
2 Spec’, and ‘Quicklook 2 Online’ from the OSIRIS IDL start-up widget. Each version
of QL2 is set to enable polling of the proper directories to open the files as they are
written to their respective directories.
FITS Files and Headers
Quicklook v2.2 only supports FITS (Flexible Image Transport System) image formats.
For general purposes, such as viewing and simple analysis, only minimal header
keywords are required. In order to display wavelength information, the following header
keywords are also required:
•
•
•
•
CDELT1: This gives the linear dispersion in the wavelength direction.
CRVAL1: Pixel to which the starting wavelength is referenced
CRPIX1: Starting wavelength for the dispersion
CUNIT1: Wavelength units (e.g., nm – QL2 assumes µm)
These keywords are automatically added to the FITS header by the OSIRIS DRP as each
file is created. When this manual was written, QL2 assumes that the longest dimension of
the .fits array corresponds to the wavelength array. QL2 will read and interpret additional
WCS keywords such as for RA and Dec.; the above are merely the minimal set.
Image Manipulation and Data Analysis
QL2 is a comprehensive tool for 3D data analysis. It includes features for image
analysis, spectral analysis, and custom image creation. 2D image analysis tools are
available for image manipulation, including mathematical operations, zoom, statistics,
peak fitting (Gaussian, Lorentzian, or Moffat functions), photometry, AO routines, image
plots in multiple orientations, and editing FITS headers. Spectral analysis tools include
spectral plotting, line profile fitting, creating custom narrow band images, and custom
digital filters. QL2 has cursor location feedback, easy to locate buttons, a pointing mode
manager, and an interactive draw window. All of these features contribute to making this
software user-friendly. QL2 was designed to be independent of OSIRIS specific
keywords or algorithms, and a configuration file is maintained to set instrument specific
features upon start-up. For this reason, reconfiguration of QL2 for another instrument or
observatory is relatively easy. The Quicklook code is written according to Keck
standards, and it is able to poll any Keck server or readable directory.
II.
What’s New in Version 2.2?
The spring 2008 version of QL2 incorporates numerous bug fixes and new features. On
the next few pages are images showing some of the new features.
•
•
•
•
•
•
•
•
•
•
•
•
•
•
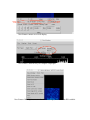
New Feature: If the FITS header contains WCS information (e.g. as produced by the
most recent OSIRIS pipeline), then as you mouse over the image it displays the
current {RA, Dec, wavelength}.
New Feature: The ‘Depth plot’ window now lets you select whether to plot the
Median, Average, or Total of the selected region.
New Feature: “Go to Slice” dialog lets you jump precisely to a desired wavelength
or slice number.
New Feature: “Scroll through all slices” automatically plays through the data cube
like a movie, using the current display settings.
New Feature: Menu options to save the currently displayed cube, image, or header
directly to an IDL variable, so that you can manipulate it on the command line.
Enhancement: Improved axes labeling and scaling for the plot window.
Enhancement: Keyboard shortcuts ‘-‘ or ‘+’ to scroll through slices.
Enhancement: Additional keyboard shortcuts for Previous & Next Slice and Go To
Slice.
Enhancement: QL2 now properly reads and displays data cubes from other IFSes as
well. Tested to work correctly for GMOS-IFS and SINFONI.
Bug Fix: The ‘Depth plot’ window previously displayed values that were an
incorrectly-computed average of the selected region.
Bug Fix: Switching between display ‘As Total DN’ or ‘As DN/s’ now works
correctly, and also rescales the display scaling min/max as appropriate.
Bug Fix: Fewer memory leaks.
Bug Fix: Additional safety checks on pointer arithmetic prevent crashes which used
to occasionally occur when opening new images while plots were displayed.
Bug fix: Correct axes labels for contour plots.
New Feature: mouse-over WCS display
New Feature: different ways to compute a depth plot
New Feature: Menu options to save the datacube, image, or header to an IDL variable.
New Features: “Go to Slice” and “Scroll through all Slices” menu options.
New Feature: “Go to Slice” dialog lets you jump to a certain wavelength. This
window can be invoked from the keyboard by pressing the capital ‘G’ shortcut key.
III. Using Quicklook v2.2
Starting Quicklook
To start QL2, you can launch it from the OSIRIS IDL start-up widget, a script, or
the IDL prompt.
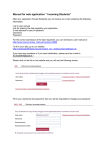
• To launch from the OSIRIS IDL startup widget at Keck: As described
above, simply select ‘Quicklook 2 Imager’, ‘Quicklook 2 Spec’, and
‘Quicklook 2 Online’ from the OSIRIS IDL start-up widget to start the
respective versions of QL2. Each version uses its own configuration file,
which sets certain start-up parameters for each version of QL2 (See Sec. 3.1).
• To launch QL2 from the command line, type the command run_ql2 from
the shell prompt. The OSIRIS versions of QL2 are launched using the scripts
run_iql2, run_sql2, run_oql2 for the imager, spectrograph, and online versions
of QL2, respectively. These scripts are virtually identical, but they each call a
different configuration files to set the defaults for each of the QL2 sessions. In
Windows, QL2 is started by typing run_wql2 from the IDL prompt.
• To launch QL2 from within IDL, simply type ‘ql’ at the IDL prompt
(assuming the QL2 code is within your IDL session’s $IDL_PATH.
QL2 will work properly “out of the box”—that is, with no configuration necessary. But
by loading a configuration file, or invoking it to read in a default configuration, you can
customize the functionality, e.g. by setting axes labels or custom color tables.
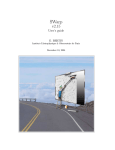
The Control Widget
QL2 can display many windows at once, including
image display, plots, and the control base. The control base
is responsible for handling all window objects and
controlling their general management. The control widget
is used to open files, load configuration files, select session
color tables, provide links to recent files, set options for
opening windows, set polling rates, perform a global closing
of all image windows, and exit the QL2 session. It is also
accountable for mathematical operations and evoking the
help directory. Furthermore, the control widget contains a
zoom window which shows a detailed zoom of the cursor
position in one of the draw windows (see Sec. 2.2). The
control widget is the core of QL2, and the entire session is
ended when it is killed. Although small in size, the control
widget is used to run and manage the entire QL2 session.
The control window has a menu providing several
options, as shown at right. In most cases, selecting one of
the menu items will open a dialog box allowing the user to
set parameters for the session. When the user selects the ‘Quit’ menu, QL2 will quit and
return the session to the IDL prompt. In general, each of these widgets should be selfexplanatory, but we will make a brief explanation of the widgets for completeness.
The most fundamental procedure in
QL2 operation is opening image files.
Selecting File → ‘Open…’ will open a file
browser, where you can browse directories
and select a FITS file to open. QL2 will save
the last directory where you open a file, and
it will return to this path the next time you
choose to open a file. The widget for loading
a configuration file is identical to the one
used for opening an image.
The
configuration file is an IDL function that has
specific parameters and an exact format (see
Sec. 3.1). The configuration file is validated
when it is loaded into the QL2 session, and
QL2 will issue an error message if the
configuration file is invalid.
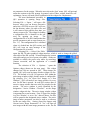
Selecting File → ‘Select Color Table’
opens the IDL XLoadct graphical widget interface, which is used to change the global
color table of the IDL session. XLoadct displays the current
color table and gives a list of preset color tables. Sliders are
available to modify the preset color tables by stretching,
Gamma correction, and the application of a transfer
function.
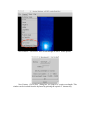
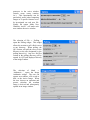
The selection of File → ‘Options…’ opens the
Options widget (shown on the next page). This widget
changes how files are opened in QL2. When images are
opened, QL2 will create an image window widget (see Sec.
2.2). The default is for QL2 to open new files within the
same image window widget, but this option is configurable.
By selecting ‘Yes’ for ‘Open New Images in a New
Window?’, QL2 will make a new image window for every
new .fits file that is opened. In each QL2 session, there is
an active image window that acts as the key window for the
session. The active window is easily identified by the
designation ‘*Active Window -Filename*’ on the image
window widget title bar. The active image window widget
is important for several reasons. First, if ‘Open New Images
in a New Window’ is set to ‘No’, then all future .fits files
will be opened in the designated active window. The active
image window parameters can also be used as a reference
for the new image files. Setting ‘Open New Images with
Current Active Image Parameters?’ to ‘Yes’ will open all
new images with the same image parameters as the .fits file
possesses in the active window
(stretch, zoom, center, rotation,
etc.). This functionality can be
particularly useful when comparing
images or if specific features are to
be investigated on each new file.
Finally, the option ‘Make New
Windows Active?’ will make each
new window the active window.
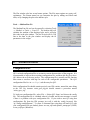
The selection of File → ‘Polling…’
opens the Polling widget. This widget
allows the session to poll a Keck server
or any directory. When polling, the
QL2 session will poll the server or the
directory at the rate designated by the
polling interval (s). Any new .fits files
written in the polling directory will be
opened by QL2 and displayed directly
to the image window.
The selection of Math →
‘Arithmetic…’ opens the Image
Arithmetic widget. The user can
operate on a number, a file saved to
disk, or the Active Image. When
the user chooses an operation and
presses calculate, the resultant
image is derived and subsequently
opened in an image window.
The Image Window
The Image Window is where images are displayed, analyzed, and manipulated. This
widget is where the actual image processing happens, and the user will spend the
majority of their time dealing with this window.
Display window
The display window shows the currently opened image. New images are automatically
scaled to fit the window such that no part of the image extends beyond the initial view of
the window. By default, the image is stretched to a scale with a maximum value of 5σ
above the image mean and a minimum value of 3σ below the image mean. The default
stretch scaling values can be set in the QL2 session configuration file (see Sec. 3.1).
X/Y Pixel Display
These boxes display the X (horizontal) and Y (vertical) pixel the cursor is currently over.
The pixel coordinates (0,0) occur in the lower left corner of the image.
Value
This box gives the data value of the pixel at the cursor location. QL2 will display the
default units for the .fits if it knows the instrument from the .fits header keyword
specified as inst_fitskw in the configuration file. For Keck instruments, the keyword that
designates the instrument is ‘CURRINST’. For example, the OSIRIS SPEC and IMAG
have default data units of DN/s.
WCS Display
If the currently-loaded image has a valid WCS header, then below the X/Y pixel and
Value displays will be a line showing the R.A., Declination, and wavelength for the pixel
the cursor is currently over. If you are viewing a single slice, then these values are exact
for that specific pixel. If you are viewing a collapsed cube, then the values displayed will
be the average over the collapsed dimension. (E.g. if you’re looking at a collapsed Hbb
cube, then the wavelength shown will be about 1.65 microns. )
X/Y Scale
These boxes display the X (horizontal) and Y (vertical) scale of the image, where scale is
given as the ratio of image pixel/display pixel.
Pointing Type
This box gives the current cursor pointing type. The pointing type controls the cursor
interactions on the draw window. As different analysis tools are opened, the QL2 session
keeps track of opened tools and their associated pointing types. QL2 will change the
cursor pointing mode dynamically to match the most recent tool selected, and this tag
will remind the user of the current QL2 pointing mode status. In order to change the
pointing mode to a previously opened analysis tool, reselect the tool from the menu or
close the widget associated with the current pointing mode tool.
-, +, 1:1, FIT Scale Buttons
These buttons are used to change the X/Y scale of the displayed image. The – button will
make the scale half as big, while the + button will make the scale twice as big. The 1:1
button makes each image pixel correspond to one display pixel. The FIT button will
change the scale to make the image fit the draw window, where the longest side is fit to
the exact size of the window.
More/Less button
The More/Less button will display an additional widget control panel with more
sophisticated controls.
Extension droplist
If the .fits file has .fits extensions, then these extensions will be listed as items in the
extension droplist. By default, QL2 opens the primary data unit (0th extension). In order
to open one of the other extensions, simply select the extension from the droplist.
Collapse droplist
3D cubes can be displayed in 2D by either displaying the average or median of the z
dimension.
Image Rotations
2D and 3D images can be rotated using the X and Y droplists. The displayed axis in the
droplist corresponds to the displayed axis in the X/Y coordinate system in the image
window. For 3D cubes, the Z axis is the axis not shown in the X/Y droplists.
X/Y Independent Scales (-,+,1:1, FIT)
These buttons perform as described above, but this set of buttons make zooms in only one
of the axes, thus changing the aspect ratio of the image.
Pan
Click the box next to Pan in order to turn on image panning. This will enable the Pan
pointing mode. Remember, the pointing mode is displayed as a tag for the Pointing Type
field. To pan, simply click inside the image window on the pixel you want to move to the
center of the image window.
Zoom Box
Click the box next to Zoom Box in order to enable image zooming. You can zoom to any
rectangular region in the image window by clicking on one corner of a box and releasing
on the opposite corner of the box. The image will be zoomed to fill the image window
with the image you selected with your box.
Recenter
The recenter button will recenter the displayed image in the image window.
Range controls
At the bottom of the Image Display Widget, there are tools for displaying partial
selections of the z axis in a 3D cube. The user can select a range of channels or a single
channel (a ‘slice’). The z axis size is displayed in the text widgets above the cube
controls. The slice slider can be used to choose a single slice. For fine tuning using the
slice slider, the user can use the left and right arrow keys on the keyboard. The “Boxcar”
field will make a boxcar average of the specified length with the slice slider value at the
center of the boxcar.
Tools available from the Image Window
There are many tools available from the dropdown menus at the top of the Image
Window Widget. Many of these tools are self explanatory, but there is a short
explanation of the tools which may need clarification.
File → FITS Header Editor
The FITS Header Editor is useful for
checking keyword values, editing keywords,
and changing the order of the keywords. To
edit a keyword, select the keyword field by
clicking on the keyword. The keyword
values can be changed by simply editing the
keyword fields, and the order of the
keywords can be changed by using the
buttons at the bottom of the widget. These
edits can be saved by clicking on the ‘Save’
or ‘Save as’ button at the top of the widget.
Finally, the ‘Find Keyword’ field can be used
to search for keywords. This feature will
only find keywords that uniquely match the
input keyword. For keywords that are used
more than once in the header (e.g.,
COMMENT), clicking on the ‘Find’ button
will search down the header keywords to find additional instances of the input keyword.
KNOWN BUG WARNING: The ‘Save’ and ‘Save As’ buttons do not preserve
FITS extensions, resulting in likely data loss.
Probably you should not use them!
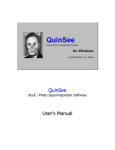
File → Make Movie
The Make Movie widget allows you to make an
.mpeg or .gif movie from the 3D data cube.
Although QL2 can display any set of channels in
the z direction, movies can be useful for
visualizing data in the z direction or when
presenting data to collaborators at conferences,
for example. Each of the input parameters is
described here.
Channel Start: Channel (z-pixel) where the
movie starts
Channel Stop: Channel where the movie stops
Magnification: Increases the magnification (image pixel/display pixel)
Spatial X Bin: Pixels to bin in the X direction – where 1 means no binning
Spatial Y Bin: Pixels to bin in the Y direction – where 1 means no binning
Z Bin Size: Pixels to bin in the Z direction.
Z Bin Step: Spacing between Z slices to be included in the movie
Minimum Value: Minimum value in image stretch
Maximum Value: Maximum value in image stretch
Normalize: Normalizes each frame by the maximum value in that frame
Smooth Type: Sets the smoothing type
Smooth Nearest Neighbors: Smooths over the Spatial X/Y Bin, and the Z Bin Size.
File type: Output file type, which will also be the extension in the filename
File → Save X as IDL Variable
These three menu options allow you to save the current image cube, displayed image
slice, or FITS header to a variable in the IDL session. It will display a dialog that lets you
set the variable name. This lets you easily take data from QL2 into IDL so that you can
manipulate it however your heart desires.
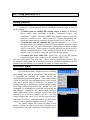
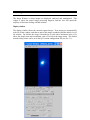
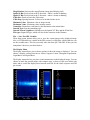
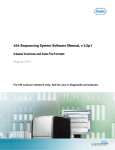
The Display Menu
The display menu allows you to choose options for how the image is displayed. You can
choose a display scaling from the set Linear, Negative Linear, Histogram Equalization,
Logarithmic, and Square Root.
The display menu also lets you place certain annotations on the displayed image. You can
choose to mark the position angle with compass axes, to draw or hide axes labels with
units, and to switch the display units between total DN for the whole exposure and DN
per second.
Examples of image displays with axes or the cardinal directions overplotted.
Tools → Statistics
The Statistics tool can be opened by selecting Tools →
‘Statistics’.
You can receive image statistics from any
rectangular region in the image window by clicking on one
corner of the rectangle and releasing on the opposite corner of
the rectangle. The exact coordinates of the box can be specified
within the statistics widget by entering them in the range boxes.
When the statistics widget is open, the statistics pointing mode
can be attained by clicking the ‘Recalculate Statistics’ button.
Tools → Photometry
The Photometry tool can be opened by selecting Tools
→‘Photometry’. This tool can be used to perform aperture
photometry on the image in the image window. The annuli radii
can be set by clicking on the +/- buttons or editing the text field
directly. To perform the photometry, click on the image where
you want to place the center of the aperture.
Tools → Strehl
The Strehl tool can be opened by selecting Tools → ‘Strehl’.
This tool can be used to calculate the Strehl on any Keck image.
Simply click on the image where you would like to place the
center of the Strehl aperture, and the program will return the Strehl to your data. The
user should choose an aperture that contains all the flux from the sources. The Strehl
calculation tool does not work for the OSIRIS spectrograph, because the sampling is too
coarse to accurately sample the PSF or because the field of view is too small to estimate
the full curve of growth.
Tools → Peak Fit
The Peak Fit tool can be opened by selecting Tools → ‘Peak
Fit’. The user can fit a 2D peak to the data in any rectangular
region in the image window by clicking on one corner of the
rectangle and releasing on the opposite corner of the rectangle.
The exact coordinates of the box can be specified within the
peak fit widget by entering them in the range boxes. When the
peak fit widget is open, the peak fit pointing mode can be
attained by clicking the ‘Recalculate Peak Fit’ button. The data
can be fit with a Gaussian, Lorentzian, or Moffat function. The
fit type is selected from the droplist on the widget.
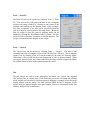
Tools → Unravel
The Unravel tool can be opened by selecting Tools → ‘Unravel’. The unravel tool
essentially unravels a rectangular region of the 3D cube into a 2D array. The rectangular
region is set by drawing a box in a similar manner to the other box drawing modes.
Unraveling a cube is useful for the visual comparison of lines in adjacent lenslets. When
viewing an unraveled cube, the cursor feedback on the image window widget will display
the original lenslet location of the spectrum under the cursor.
Plot
The plot options are used to create depth plots, horizontal cuts, vertical cuts, diagonal
cuts, surface plots, or contour plots. Each item in the plot menu will change the pointing
mode, and the user can draw a selection region by dragging a rectangle across the image
display window with the mouse. The data enclosed within the box or diagonal will be
used to make the appropriate plot in the plot window. Please see information on the Plot
Window Widget in the section below.
The Plot Window
The Plot Window is where data from the Image Window is plotted. The Plot Window
provides an interface for editing the plot parameters and analyzing plots. The graph
options can be customized by using menus to edit the line styles, axes, labels, and line
widths. Key areas of the plot window are as follows:
Plot Axes
The Plot fields can be used to change the range for the plot axes. The fix box will fix the
axis range, so all future plots will have the same range. The log box will plot the range as
a logarithm.
Input Data from Cube
The Input Data fields can be used to change the selection region for data from the image
window. When the ‘Set’ button is pressed, the highlighted box will update in the image
window, and the plot will be redrawn in the plot window.
The Plot window also has several menu options. The File menu options are pretty selfexplanatory. The Format menu lets you customize the plot by adding axes labels and
titles, or by changing the plot color and line style.
Tools → Median/Line Fit
The Median/Line Fit tool can be opened by selecting Tools
→ ‘Median’ or Tools → ‘Line Fit’. The median tool will
calculate the median of the displayed plot, and it will plot
this value in the plot window. The line fit tool will fit a 1D
line to the data in the plot window and display the fit
parameters in the widget.
IV. Advanced Features
Configuration Files
QL2 can load configuration files to customize certain characteristics of the program. It is
recommended to begin with an existing configuration file, and then edit the file to have
QL2 behave the way the user prefers. The configuration file is actually an IDL function
that returns a structure with tags for each of the configurable parameters. The QL2
configuration files live in configs/ sub-directory for QL2.
Each configuration file should contain precisely one IDL routine, named the same thing
as the file. For instance osiris_spec_cfg.pro should contain a procedure named
“osiris_spec_cfg”.
To load your configuration file, select File →‘Select QL2 Setup’ and choose the config
file. The configuration file is validated when it is loaded, and an error message is issued
if there is a problem with your configuration file. If you wish to start QL using that
configuration file from the IDL prompt, just call it with the config keyword, like
“ql, config=configfilename”. To create a command line script that will start QL2 with
your configuration file pre-loaded, please see run_sql2 and sqlook2_startup.pro (UNIX)
or run_wql2.pro (Windows).
Here is an example configuration file that can be copied and used to create your own
configuration file. Each of the tags has a short comment that explains the function in
QL2.
function osiris_spec_cfg, error
; set up a catch to make sure there isn't a problem when
; trying to poll the server
catch, error_status
;This statement begins the error handler:
if error_status ne 0 then begin
print, 'Error index: ', error_status
print, 'Error message: ', !ERROR_STATE.MSG
endif
axes_labels2d=ptr_new(['X', 'Y', 'Z'], /allocate_heap)
axes_labels3d=ptr_new(['Wavelength', 'Y', 'X'], /allocate_heap)
error=0
if (error_status eq 0) then begin
struct={ cconfigs, $
cfg_name:'OSIRIS SPEC', $ ; instrument configuration
inst_fitskw:'CURRINST', $ ; instrument fits keyword
itime_fitskw:'ITIME', $ ; integration time
coadds_fitskw:'COADDS', $ ; # of coadds
pa_fitskw:'ROTPOSN', $ ; rotator position
object_fitskw:'OBJECT', $ ; object kw
sampmode_fitskw:'SAMPMODE', $ ; detector sampling mode
numreads_fitskw:'NUMREADS', $ ; number of reads
platescale_fitskw:'SSCALE', $ ; platescale
array_index_fitskw:'CRPIX1', $ ; starting wavelength in dispersion
lin_disp_fitskw:'CDELT1', $ ; linear dispersion in z axis
reference_fitskw:'CRVAL1', $ ; reference pixel
unit_fitskw:'CUNIT1', $ ; units that accompany the starting wavelength
polling_rate:1.0, $ ; polling rate in seconds
testserver:'osiris_testserver', $ ; function checks to see if the
server is up
isframeready:'osiris_isframeready', $ ; function checks for frame
getfilename:'osiris_getfilename', $ ; function gets the filename
openfiles:'osiris_openfiles', $ ; function that opens new files
transition:1., $ ; get filename when transition changes from 0 -> 1
dir_polling_on:1., $ ; 0. directory polling off, 1. directory polling
on
poll_dir:'~/osiris/spec_raw', $ ; set the initial polling directory
server_polling_on:0., $ ; 0. server polling off, 1. server polling on
poll_server:'osiris', $ ; sets the polling server name
dir_arr:ptr_new('', /allocate_heap), $
new_files:ptr_new('', /allocate_heap), $
conbase_dir:'~/osiris/spec_raw', $ ; set the initial conbase directory
draw_xs:512., $ ; x size of the draw window
draw_ys:512., $ ; y size of the draw window
diagonal:2., $ ; diagonal width
color_table:1, $ ; loadct color table value
pointer_type:24, $ ; IDL pointer type value. 40, 24, 54
axes_labels2d:axes_labels2d, $
axes_labels3d:axes_labels3d, $
imscalemaxcon:5., $ ; default image stretch max imscalemaxcon*im_sigma
imscalemincon:-3.,
$
;
default
image
stretch
min
imscalemincon*im_sigma
displayasdn:'As DN/s', $ ; sets member variable as "As DN/s" or "As
Total DN", how the image is displayed
collapse:1, $ ; sets collapse member var to 'Median' (0) or 'Average'
(1)
pa_function:'osiris_calc_pa',
$
;
function
that
calculates
the
position angle
exit_question:0., $ ; 1 if you want QL2 to ask about keeping IDL
running when exiting
ParentBaseId:0L $
}
return, struct
endif else begin
print, 'There was an error loading the config file.'
; return the default array of member variables
error=-1
return, -1
endelse
end
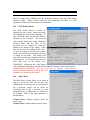
Keyboard Shortcuts
QL2 has keyboard shortcuts (IDL calls these accelerators) that work on all of the
supported operating systems. The shortcut events will only be received if the user has the
Image Window Widget selected and the cursor is in the draw window
Function
Pan
Recenter
Zoom box
zoom In
zoom Out
Go to Slice
go to previous slice
go to next slice
Redisplay image
Linear stretch
log stretch with minimum = Zero
Negative stretch
histogram eQualization stretch
Statistics
Aperture photometry
sTrehl
peak Fit
Unravel
Depth plot
Keyboard Shortcut
p
m
z
i
o
G
+ or =
r
l
Z
n
q
s
a
t
f
u
d
Horizontal Cut
Vertical Cut
Diagonal Cut
Surface Plot
Contour Plot
V.
h
v
g
e
c
Installing Local Versions of QL2
If you find QL2 useful, then you can download a local copy of QL2 for your OSIRIS 3D
visualization and analysis needs. QL2 is platform independent software, so it can run in
Unix, Linux, Mac OS, and Windows. All you need is a local version of IDL that is at
least IDL 5.4 or newer, and a copy of the Goddard IDL Astronomy Library.
To run QL2 on your own computer, simply download the tar file from the UCLA OSIRIS
site (http://www.astro.ucla.edu/~irlab/osiris/) or the Keck OSIRIS News webpage
(http://www2.keck.hawaii.edu/inst/osiris/news.html). Unpack the .tar file somewhere in
your IDL path. Then you can type ‘ql’ within IDL to start QL2.
If you wish to run QL2 directly from the command line, place the “run_ql2” script in a
directory in your shell’s $PATH. Within the run_ql2 file, edit the environment variable
'QL_FILEDIR' to match the directory path where you just unpacked the Quicklook2 .tar
file. Once this environment variable has the correct path, you can type 'run_ql2' at your
terminal prompt, and this script will launch Quicklook2 program and place the IDL xterm
in an icon. Many OSIRIS users have made an alias for the 'run_ql2' script in their .cshrc
file or put ‘run_ql2’ in their path, that way they can run Quicklook2 at any point during
their session. For Windows users, simply run IDL and type ‘run_wql2’ from the
command prompt.