1
Instruction
Manual
3436i
SF6 Detector
BE6039-11
Index
________________________________________________________________________
Index
Index ................................................................................................................................... 2
3436i SF6 Detector ................................................................................................................ 4
Safety Considerations. ...................................................................................................... 5
Warnings! ....................................................................................................................... 6
Applying Power ................................................................................................................ 7
Considérations de sécurité. ............................................................................................... 8
Avertissements! ............................................................................................................... 9
Mise sous tension .......................................................................................................... 10
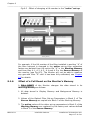
Chapter 1 Using this Manual ............................................................................................... 11
1.1 Introduction .......................................................................................................... 12
1.2 Online Monitoring .................................................................................................. 12
1.3 PC Use BZ7002 Calibration Software ........................................................................ 12
1.4 PC Use BZ7003 Offline Software .............................................................................. 12
1.5 Stand-alone Use .................................................................................................... 12
Chapter 2 Preliminary Tasks ............................................................................................... 15
2.1 Connecting the Monitor to the PC ............................................................................ 16
2.2 Checking /changing the Fuses in the Monitor. ........................................................... 17
2.3 Setting the USB Communication Parameters ............................................................. 20
2.4 Setting the RS-232 Communication Parameters ........................................................ 21
2.5 Setting the Ethernet Communication Parameters ....................................................... 22
2.6 Setting-up user Levels ........................................................................................... 26
2.7 Restoring of calibration data ................................................................................... 28
Chapter 3 Philosophy of Operation ....................................................................................... 29
3.1 PC Use – Online .................................................................................................... 30
3.2 Stand-alone Use .................................................................................................... 31
Chapter 4 Introduction to and Familiarization with the Monitor ............................................... 33
4.1 Special Terminology............................................................................................... 34
4.2 Attaching the Sampling Tube and External Filter........................................................ 37
4.3 Familiarization with the Monitor using the Front Panel ................................................ 38
Chapter 5 The Monitor ....................................................................................................... 59
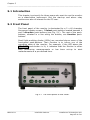
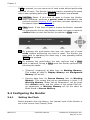
5.1 Introduction .......................................................................................................... 60
5.2 Front Panel ........................................................................................................... 60
5.3 Starting-up or Restarting the Monitor ....................................................................... 64
5.4 Configuring the Monitor .......................................................................................... 67
5.5 Alarm Relay .......................................................................................................... 70
5.6 Continuous Warm System ...................................................................................... 72
Chapter 6 Keying-in Parameters .......................................................................................... 73
6.1 Types of Parameters .............................................................................................. 74
Chapter 7 Setting-up and Starting a Monitoring Task ............................................................ 77
7.1 The Parameters’ Units ............................................................................................ 78
7.2 The Measurement Parameters ................................................................................. 80
7.3 Setting-up the Monitor’s Alarm Levels ...................................................................... 88
7.4 Starting a Monitoring Task ...................................................................................... 89
Chapter 8 Viewing Measurement Data – Using the Monitor .................................................... 93
8.1 Displayed Monitoring Task Data............................................................................... 94
8.2 Printed Monitoring Task Data .................................................................................. 99
8.3 Storage Space in the Display Memory ..................................................................... 102
Chapter 9 Storage of Data in the Monitor’s Memory .............................................................. 103
9.1 Types of Memory in the Monitor ............................................................................. 104
9.2 Storage of Measurement Results ............................................................................ 112
9.3 Management of Data in Background Memory ........................................................... 115
Chapter 10 Using a Printer with the Monitor ......................................................................... 119
10.1 Introduction ......................................................................................................... 120
10.2 Printer Cables ...................................................................................................... 120
10.3 Setting-up Communication Parameters ................................................................... 121
_____________________________________________________________________________
BE6039-11
3436i SF6 Detector
LumaSense Technologies A/S
Page 2 of 194
Index
________________________________________________________________________
10.4 Additional Parameters Required .............................................................................. 126
10.5 Data Logging Function .......................................................................................... 127
10.6 Error Logging Function .......................................................................................... 127
10.7 Printing-out Data from the Monitor ......................................................................... 128
Chapter 11 Maintenance of the 3436i .................................................................................. 129
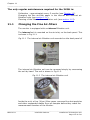
11.1 Changing the Fine Air-filters .................................................................................. 130
11.2 Cleaning the Filter in the Ventilation Unit ................................................................. 135
11.3 Cleaning the Instrument ........................................................................................ 136
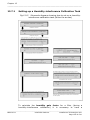
Chapter 12 Calibration of the Optical Filters ......................................................................... 137
12.1 About the Installed Optical Filters ........................................................................... 138
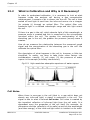
12.2 What is Calibration and Why is it Necessary? ........................................................... 139
12.3 Tasks Before Starting Any Calibration ..................................................................... 141
12.4 The Basic Calibration Set-up .................................................................................. 148
12.5 General Settings – Stand-alone Use ........................................................................ 151
12.6 Zero-point Calibration ........................................................................................... 154
12.7 Humidity-interference Calibrations – Stand-alone Use ............................................... 158
12.8 Span Calibration ................................................................................................... 162
12.9 Calibration of the Water-vapour Filter – Stand-alone Use ........................................... 170
12.10
Setting-up a Combined Zero-point and Humidity-interference Calibration – Standalone Use 176
12.11
Setting-up any Combined Calibration – Stand-alone Use ...................................... 178
Chapter 13 Messages Related to Calibration......................................................................... 180
13.1 “Successful” Calibration Messages .......................................................................... 181
13.2 “Successful *” Calibration Messages........................................................................ 181
13.3 “Invalid” Calibration Messages ............................................................................... 182
13.4 Error Messages Displayed when the INFO button is used ........................................... 182
Chapter 14 Warning and Error Messages ............................................................................. 188
_____________________________________________________________________________
BE6039-11
3436i SF6 Detector
LumaSense Technologies A/S
Page 3 of 194
Safety Considerations
________________________________________________________________________
3436i SF6 Detector
April 2015
_____________________________________________________________________________
BE6039-11
3436i SF6 Detector
LumaSense Technologies A/S
Page 4 of 194
Safety Considerations
______________________________________________________________________
Safety Considerations.
Throughout this manual Monitor is used for:
Photoacoustic Gas Monitor – INNOVA 3436i
The Monitor complies with:
•
•
EN/IEC 61010-1, 3rd Edition: Safety requirements for electrical
equipment for measurement, control and laboratory use.
•
Can/CSA-C22.2 No. 61010-1-04 - Safety Requirements for
Electrical Equipment for Measurement, Control, and Laboratory
Use.
•
UL Std. No. 61010A-1 (3rd Edition) - Safety Requirements for
Electrical Equipment for Measurement, Control, and Laboratory
Use.
SAFETY SYMBOL
The apparatus will be marked with this symbol when it is important
that the user refers to the associated warning statement given below.
To ensure safe operation and retain the Monitor in safe condition,
note the following:
Power Cord must be detached before removing the enclosure.
EXPLOSION HAZARD!
TO AVOID THE POSSIBILITY OF AN EXPLOSION; MONITORING
OF FLAMMABLE GASES IN EXPLOSIVE CONCENTRATIONS
MUST NEVER BE ATTEMPTED.
Never operate the 3436i Photoacoustic
potentially explosive environments.
Gas
Monitor
in
_____________________________________________________________________________
BE6039-11
3436i SF6 Detector
LumaSense Technologies A/S
Page 5 of 194
Safety Considerations
______________________________________________________________________
When monitoring potentially flammable or toxic gases it is essential
that:
•
The instrument itself is placed in a well-ventilated area outside the
potentially hazardous zone.
•
A sufficiently long tube is connected to the air-outlet on the back
panel so that the sampled gas is carried away to the open air or to
an extraction and/or filtration unit.
•
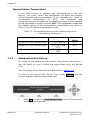
Environmental Conditions for transport and storage:
Temperature:
Relative Humidity:
Atmospheric Pressure:
-25 to +55ºC
0 to 80% RH
800 to 1060 hPa
Warnings!
•
Avoid water condensation in the instrument.
•
Switch off all equipment before connecting or disconnecting their
digital interface. Failure to do so could damage the equipment.
•
Do not position the equipment in a way preventing the ability to
unplug the cable on the back-panel.
•
Whenever it is likely that correct function or operating safety of
the apparatus has been impaired, the apparatus must be made
inoperative and secured against unintended operation.
•
Any adjustment, maintenance and repair of the open apparatus
under voltage must be avoided as far as possible and, if
unavoidable, must be carried out only by trained personnel.
•
If a fault is reported by the monitor that indicates correct function
of the instrument may be impaired, consult your local LumaSense
Technologies representative. Under no circumstances should repair
be attempted by persons not qualified in service of electronic
instrumentation.
•
Use of the Monitor in a manner not specified by the manufacturer
may impair the protection provided by the equipment
_____________________________________________________________________________
BE6039-11
3436i SF6 Detector
LumaSense Technologies A/S
Page 6 of 194
Safety Considerations
______________________________________________________________________
Applying Power
Connecting the mains supply.
The 3436i is operated from 50 to 60 Hz single phase AC mains
supply. Voltage 100 to 240 Vac.
Before using the 3436i check that the available mains voltage match
the specified voltage and frequency for the instrument.
Use the power Cord delivered with the 3436i. Or check that the Cord
used is rated minimum 10A/250V with protective earth.
SAFETY SYMBOLS
Frame or Chassis
Dangerous voltage
Protective earth
Copyright © 2015 LumaSense Technologies A/S
All rights reserved. No part of this publication may be reproduced or
distributed in any form or by any means without prior consent in
writing from LumaSense Technologies A/S, Denmark.
_____________________________________________________________________________
BE6039-11
3436i SF6 Detector
LumaSense Technologies A/S
Page 7 of 194
Considérations de sécurité
______________________________________________________________________
Considérations de sécurité.
Tout au long de ce manuel Moniteur est utilisé pour désigner:
Moniteur de Gaz Photoacoustique – INNOVA 3436i
Le Moniteur est compatible avec:
•
•
EN/CEI 61010-1, (3e édition): Exigences de sécurité pour appareils
électriques de mesure, de contrôle et de laboratoire.
•
CAN/CSA-C22.2 No. 61010-1-04 – Exigence de sécurité pour
appareils électriques de mesure, de contrôle et de laboratoire.
•
UL Std. No. 61010A-1 (3e édition) – Exigences de sécurité pour
appareils électriques de mesure, de contrôle et de laboratoire.
Symbole de sécurité
L’appareil sera marqué de ce symbole quand il est important que
l’utilisateur se réfère à la déclaration d’avertissements associés publiée
dans le guide d’utilisation
Pour assurer un fonctionnement sûr et garder le Moniteur dans un
état de sécurité, noter ce qui suit:
Le cordon d’alimentation doit être détaché avant de retirer le boîtier
Risque d’explosion
Pour éviter tout risque d’explosion; la mesure des gaz
inflammables à des concentrations explosives ne doit jamais
être tentée.
Ne jamais utiliser le 3436i Moniteur de Gaz Photoacoustique
dans des environnements potentiellement explosifs.
_____________________________________________________________________________
BE6039-11
3436i SF6 Detector
LumaSense Technologies A/S
Page 8 of 194
Considérations de sécurité
______________________________________________________________________
Lors de la mesure des gaz potentiellement inflammables ou toxiques,
il est essentiel que :
•
L’appareil soit placé dans un endroit bien ventilé hors de la zone
potentiellement dangereuse.
•
Un tube suffisamment long soit relié à la sortie d’air sur le
panneau arrière de sorte que le gaz prélevé soit emporté à l’air
libre ou dans une extraction et/ou unité de filtration.
Conditions environnementales pour le transport et le
stockage:
Température:
Humidité Relative:
Pression Atmosphérique:
-25 à +55 ̊C
0 à 80% HR
800 à 1060 hPa
Avertissements!
•
Eviter la condensation d’eau dans l’appareil.
•
Eteignez tous les appareils avant de brancher ou débrancher leur
interface numérique. Ne pas le faire pourrait endommager
l’appareil.
•
Ne placez pas l’appareil de manière à empêcher la possibilité de
débrancher le cordon d’alimentation sur le panneau arrière.
•
Chaque fois qu’il soit probable que le fonctionnement correct ou la
sécurité de fonctionnement de l’appareil a été altérée, l’appareil
doit être rendu inopérant et sécurisé contre toute manipulation
involontaire.
•
Tout ajustement, l’entretien et la réparation de l’appareil ouvert
sous tension doivent être évités autant que possible et, si
inévitables, doivent être effectués par un personnel qualifié.
•
Si une erreur est signalée par le moniteur qui indique qu’un
fonctionnement correct de l’appareil pourrait être diminué,
consulter votre représentant local de LumaSense Technologies. En
aucun cas les réparations ne doivent essayées par des personnes
non qualifiées en service de l’instrumentation électronique.
•
L’utilisation du moniteur d’une manière non spécifiée par le
fabricant pourrait compromettre la protection offerte par l’appareil.
_____________________________________________________________________________
BE6039-11
3436i SF6 Detector
LumaSense Technologies A/S
Page 9 of 194
Considérations de sécurité
______________________________________________________________________
Mise sous tension
Le raccordement sur secteur
Le 3436i est utilisé de 50 à 60 Hz courant alternatif secteur
monophasé. Tension 100 à 240 V courant alternatif.
Avant d’utiliser le 3436i vérifiez que la prise de tension secteur
disponible corresponde à la tension et la fréquence spécifiées pour
l’appareil.
Utilisez le cordon d’alimentation livré avec le 3436i. Ou vérifiez que le
cordon d’alimentation utilisé est classifié au minimum à 10A/250V
avec terre de protection.
SYMBOLES DE SECURITE
Cadre ou Châssis
protection
Tension dangereuse
Terre de
Copyright © 2015 LumaSense Technologies A/S
Tous droits réservés. Aucune partie de cette publication ne peut être
reproduite ou distribuée sous quelque forme que ce soit et par
n’importe quel moyen sans le consentement préalable écrit de
LumaSense Technologies A/S – Danemark.
_____________________________________________________________________________
BE6039-11
3436i SF6 Detector
LumaSense Technologies A/S
Page 10 of 194
Chapter 1
______________________________________________________________________
Chapter 1
Using this Manual
April 2015
_____________________________________________________________________________
BE6039-11
3436i SF6 Detector
LumaSense Technologies A/S
Page 11 of 194
Chapter 1
______________________________________________________________________
1.1 Introduction
This manual can be used in several ways. The first time users can
work their way through the examples in order to get to know this
monitoring system. The more experienced users can jump directly to
the relevant chapters in order to gain assistance, and experts can
use this manual as a reference book by using the index.
The monitor can be operated in different ways; Online Monitoring
using LumaSoft Gas Single point 7810, Online Calibration and backup using the Calibration Software BZ7002, Offline using the Offline
Software BZ7003 , and as a Stand-alone instrument. This manual
focuses on the Stand-alone use. For instruction in the use of BZ7002
and BZ7003 please refer to the User Manuals BE6034 and BE6035
respectively.
1.2 Online Monitoring
LumaSoft Gas Single Point 7810 is supplied with the instrument. This
is to be used for Online monitoring (PC use) please follow the
instructions in the BE6027 User Manual for online monitoring and
set-up.
1.3 PC Use BZ7002 Calibration Software
The BZ7002 Calibration Software is used for calibration of the gas
monitor from a PC. Please refer to the BZ7002 User Manual BE6034
and Chapter 12 of this Manual.
1.4 PC Use BZ7003 Offline Software
Data from the display memory can be copied to the background memory
after a measurement task is performed. The BZ7003 Offline Software is
used for upload of these measurement data from the monitor to the PC in
either excel format or text format files. Please refer to the User Manual
BE6035 and Chapter 9 of this manual for further instructions.
1.5 Stand-alone Use
In some situations, it may be necessary to set up without connecting
it to a PC. The procedure to do this are covered in this manual under
the Stand-alone use headings. The way these instructions are
presented is shown below:
_____________________________________________________________________________
BE6039-11
3436i SF6 Detector
LumaSense Technologies A/S
Page 12 of 194
Chapter 1
______________________________________________________________________
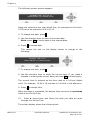
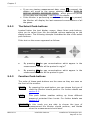
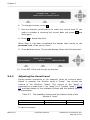
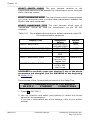
SELECT SET-UP BRANCH
MEASUREMENT
FORMAT
CONFIGURATION
The display above is used continuously through-out this manual. It
assists you displaying the text on screen and by indicating which of
the push-buttons can and should be pressed.
In general, the push-buttons shown above are used to navigate
through the various modes possible within the 3436i but are
described in more detail below:
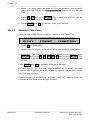
S1
S2
S3
These push-buttons are illustrated as S1, S2 and S3. On the 3436i
they correspond to the key and their position on the instrument.
These select push-buttons enable you to select one of the options
displayed.
This group of 5 push-buttons are referred to in this manual
collectively as the direction keys. The symbols below are used to
simplify the instruction in this manual.
▲ & ▼ enable you to increase & decrease numbers, respectively, or
to go to the Previous & Next Displays, respectively.
◄ & ► enable you to move across number fields or go to the
Previous & Next gases, respectively.
↵ , depending on the situations, acts as an “Enter” or “Go To Head”
key.
Memory
Function push-buttons are always represented with the name
of the push-button enclosed in a box which is shaded-in.
_____________________________________________________________________________
BE6039-11
3436i SF6 Detector
LumaSense Technologies A/S
Page 13 of 194
Chapter 1
______________________________________________________________________
SYSTEM
Text that appears on the display screen is shown in an open
shaded box, using UPPER case letters.
FORMAT
System
General
Clock
When referring to any part of the Set-up “tree”, the text is
shown in open shaded boxes with the same typeface as that
used in the “tree”.
_____________________________________________________________________________
BE6039-11
3436i SF6 Detector
LumaSense Technologies A/S
Page 14 of 194
Chapter 2
______________________________________________________________________
Chapter 2
Preliminary Tasks
April 2015
_____________________________________________________________________________
BE6039-11
3436i SF6 Detector
LumaSense Technologies A/S
Page 15 of 194
Chapter 2
______________________________________________________________________
When taking delivery of the 3436i SF6 Detector, five very important
and preliminary tasks must be completed before starting to operate
it:
Install the BZ7002 Calibration Software to enable operation Back-up
of the calibration file supplied with the instrument if calibrations are
performed by LumaSense Technologies A/S.
Connect the Monitor to a PC (see section 2.1).
Check/Change the fuses in the monitor (see section 2.2).
Set the Communication parameters. USB (see section 2.3), RS232
(see section 2.4), Ethernet (see section 2.5).
Set-up the password protected user levels (see section 2.6).
2.1 Connecting the Monitor to the PC
The monitor comes complete with a USB interface cable. The
maximum length of an USB cable is 5 meters. USB extension kits can
be used to extend the USB connection to 30 meters.
The gas monitor can also be connected to a PC using a 9-pin to 9-pin
null modem RS-232 interface cable (optional accessory WL950-003).
Finally the monitor can be connected to a PC using the Ethernet
network connection.
2.1.1
Fitting the RS-232 Cable.
Ensure that both the monitor and the PC are switched off at the
mains. Failure to do so may result in your equipment being
damaged.
Locate the serial port at the back of the PC; refer to your PC manual
if in doubt.
Push the connector on the RS-232 cable on to the serial port socket,
and secure it firmly using the securing screws.
Locate the output labelled “RS-232” at the back of the Monitor.
Push the connector at the other end of the RS-232 cable on to this
socket, and secure it firmly using the securing screws.
Turn on the PC. Wait for Windows to start up.
The instruments can be turned on at the mains now.
2.1.2
Fitting the USB Cable.
The gas monitor can be connected to an USB port on the PC in order
to make measurements using the LumaSoft Gas Single Point 7810 PC
application, which communicates using the USB interface
communication protocol.
_____________________________________________________________________________
BE6039-11
3436i SF6 Detector
LumaSense Technologies A/S
Page 16 of 194
Chapter 2
______________________________________________________________________
The USB interface cable can be connected while the gas monitor is
switched on.
Connect USB interface cable only to Class III equipment.
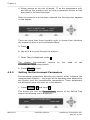
2.2.3
Fitting the Ethernet Cable.
The gas
order to
7810 PC
interface
standard
monitor can be connected to a local Ethernet network in
make measurements using the LumaSoft Gas Single Point
application, which communicates using the TCP/IP network
protocol or to view the homepage of the gas monitor in a
PC internet browser.
The Ethernet network cable can be connected while the gas monitor
is switched on.
Connect a standard Ethernet network cable to the Ethernet socket
connector on the back of the gas monitor. Connect the other end of
the Ethernet network cable to your local network. The yellow LED on
the Ethernet socket connector will lit, if a local network connection is
detected.
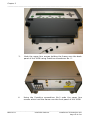
2.2 Checking /changing the Fuses in the Monitor.
Unplug the Monitor from the mains power supply and pull out the
plug in the AC Mains socket of the Monitor
If the fuses in the Monitor are blown it can indicate a serious fault in
the instrument, therefore it is advisable to contact your LumaSense
service representative before changing the fuse!
2.2.1
Checking/changing the Fuses in the 3436i
1.
2.
Turn the 3436i so that it stands on its back panel and remove
the rubber “shoes” mounted on the four “feet” of its baseplate.
Using Pozidrive screwdriver No. 1, undo and completely
remove the screws located under the rubber “shoes” which
have just been removed.
Note: these screws hold the upper and lower covers of the
3436i together. If the screws are not completely undone you
will not be able to remove the upper cover as explained in step
5.
_____________________________________________________________________________
BE6039-11
3436i SF6 Detector
LumaSense Technologies A/S
Page 17 of 194
Chapter 2
______________________________________________________________________
3.
Undo the upper four screws holding the frame over the backpanel of the 3436i using Pozidrive screwdriver No. 0.
4.
Using the Pozidrive screwdriver No.0 undo the upper four
screws which hold the frame over the front panel of the 3436i.
_____________________________________________________________________________
BE6039-11
3436i SF6 Detector
LumaSense Technologies A/S
Page 18 of 194
Chapter 2
______________________________________________________________________
5.
Gently lift off the upper cover of the 3436i by pulling it firmly
upward.
6.
Use a screwdriver to remove the fuse-holder:
7.
Remove the old fuse from the holder and replace it with a new.
Check that the fuse has the correct rating.
The fuse must be:
Certified Slow-blow (T) fuse with a rating of 2.5 AL, 250 VAC, 5x20
mm.
LumaSense order number: VF0102A
8.
Install the fuse-holder and re-assemble the 3436i again.
_____________________________________________________________________________
BE6039-11
3436i SF6 Detector
LumaSense Technologies A/S
Page 19 of 194
Chapter 2
______________________________________________________________________
The figure below shows the inside of the top cover of the 3436i. Note
that the front side of the cover has square flanges. Place the top
cover back in its correct position on top of the 3436i and screw in the
all screws.
2.3 Setting the USB Communication Parameters
The LumaSoft Gas 7810 application with USB communication is able
to communicate with the 3436i gas monitor through a USB cable.
BZ7002 and BZ7003 applications with USB communication are able
to communicate with the 3436i gas monitor through a USB cable .
No setup on the 3436i gas monitor is necessary in order to be able to
communicate with the 3436i gas monitor through an USB connection.
_____________________________________________________________________________
BE6039-11
3436i SF6 Detector
LumaSense Technologies A/S
Page 20 of 194
Chapter 2
______________________________________________________________________
2.4 Setting the RS-232 Communication Parameters
2.4.1
Default RS-232 Communication Parameters.
The Default RS-232 Communication parameters are shown in the
table below.
Baud rate
Stop bits
Data bits
Parity
Hardwire mode
Handshake type
Text Line
Terminator
9600
1
7
Even
Leased line
Hardwire
CR-LF
Performing a full reset will set all parameters to the default settings.
2.4.2
Checking/Changing the RS-232 Communication
Parameters
The communication parameters for the serial interface must be set
using the push-buttons on the front of the monitor.
1. Press SET-UP S3 S1 S3 S1 .The screen display now shows the
following text.
If the baud rate displayed is incorrect press ↵ and use ▲ and ▼ to
display the correct value. Press ↵ again to store the selection.
If the baud rate displayed is correct, then press ▼ to continue to the
next parameter.
Press S1 to select 1 STOP BIT.
Press S1 to select 7 DATA BITS
Press S2 to select EVEN PARITY
Press S3 to select LEASED-LINE
Press S3 to select HARD-WIRED HANDSHAKE.
Press SET-UP to exit the set-up mode
Press RESET and S1 in order that the new settings are enabled.
_____________________________________________________________________________
BE6039-11
3436i SF6 Detector
LumaSense Technologies A/S
Page 21 of 194
Chapter 2
______________________________________________________________________
2.4.3
Checking/Changing the Text line Terminator.
The Text line Terminator must be set using the push-buttons on the
front of the monitor.
Press SET-UP S2 ▼ ▼ ▼S3
Press SET-UP to exit the set-up mode
2.4.4
Checking/Changing the Data Log and Error Log
Options.
The Data Log and Error Log must be set using the push-buttons on
the front of the monitor.
Press SET-UP S3 S1 S1 S3 ▼S1 S1
Press SET-UP to exit the set-up mode
2.5 Setting the Ethernet Communication Parameters
The LumaSoft Gas 7810 application with Ethernet communication is
able to communicate with the 3436i gas monitor through a local
Ethernet network.
The homepage of the 3436i gas monitor can also be displayed in a
web browser, when the 3436i gas monitor is connected to a local
Ethernet network.
2.5.1
Checking/Changing the Ethernet Communication
Parameters
The communication parameters for the Ethernet interface can be set
by using the push-buttons on the front of the monitor.
1. Press SET-UP S3 S1 S3. The screen display now shows the
following text.
SELECT COMMUNICATION SET-UP BRANCH
RS232
Ethernet
Connections
2. Press S1 to enter the Ethernet setup. During this setup you can
also use the ▲ and ▼ keys to go back and forth between the
_____________________________________________________________________________
BE6039-11
3436i SF6 Detector
LumaSense Technologies A/S
Page 22 of 194
Chapter 2
______________________________________________________________________
available Ethernet settings. The screen display now shows the
following text.
IS 3436i'S IP ADDRESS SET BY DHCP ?
NO
YES
3. Here you can select whether the IP address of the 3436i gas
monitor is to be assigned by a DHCP server in the local network.
If you want the 3436i's IP address to be assigned by the DHCP
server press the S3 (Yes) key, where after you will proceed to the
below step 6 as the IP address is set by the DHCP server. If you
want yourself to set the IP address of the 3436i press the S1 (No)
key. The screen display now shows the following text.
3436i 'S IP ADDRESS 192.168.000.200
PRESS ENTER TO CHANGE VALUE
4. Here you can change the IP address of the 3436i gas monitor in
case the IP address is not set by a DHCP server in the local
network. If you want to change the IP address, press the ↵ key. If
the IP address does not need to be changed, press the ▼ key and
you will proceed to the below step 6.
If you selected to change the IP address, the screen display now
shows the following text.
3436i'S IP ADDRESS 192.168.000.200
CANCEL
DEFAULT
5. Here you can change the 4 individual numbers in the IP address
by using the ▲ and ▼ keys. Each of the 4 individual numbers can
be set in the range from 000 to 255.
You can step between the 4 individual numbers in the IP address
by using the ◄ and ► keys.
In case you want to return to the start value of the IP address
press the S1 (CANCEL) key. In case you want to return to the
default stored value of the IP address press the S3 (DEFAULT)
key.
When you have set the IP address, press the ↵ key. The screen
display now shows the following text.
3436i'S IP PORT NUMBER:
23
PRESS ENTER TO CHANGE VALUE
_____________________________________________________________________________
BE6039-11
3436i SF6 Detector
LumaSense Technologies A/S
Page 23 of 194
Chapter 2
______________________________________________________________________
6. Here you can set the IP port number for the Ethernet
communication. This normally does not need to be changed. If
you want to change the IP port number press the ↵ key. If the IP
port numbers does not need to be changed, press the ▼ key and
you will proceed to the below step 8. If you selected to change the
IP port number the screen display now shows the following text.
3436i'S IP PORT NUMBER:
23
CANCEL
DEFAULT
7. Here you can change the IP port number by using the ▲ and ▼
keys. The port number can be set in the range from 0 to 32767.
In case you want to return to the start value of the IP port
number press the S1 (CANCEL) key. In case you want to return to
the default stored value of the IP port number press the S3
(DEFAULT) key.
When you have set the IP port number, press the ↵ key. The
screen display now shows the following text.
PROTECTED IP ADDRESS 000.000.000.000
PRESS ENTER TO CHANGE VALUE
8. In case you want the 3436i gas monitor to be able to
communicate only with a certain PC on the local network, you can
set the IP address of this PC as the protected IP address. This can
be desired due to security reasons so no other PC is able to
communicate with the 3436i gas monitor.
If no protection is desired the protected IP address should be set
to a value of 000.000.000.000.
If you want to change the protected IP address, press the ↵ key.
If the protected IP address does not need to be changed, press
the ▼ key and you will proceed to the below step 10.
If you selected to change the protected IP address the screen
display now shows the following text.
PROTECTED IP ADDRESS 000.000.000.000
CANCEL
DEFAULT
9. Here you can change the 4 individual numbers in the protected IP
address by using the ▲ and ▼ keys. Each of the 4 individual
numbers can be set in the range from 000 to 255.
You can step between the 4 individual numbers in the protected IP
address by using the ◄ and ► keys.
In case you want to return to the start values of the protected IP
address press the S1 (CANCEL) key. In case you want to return to
_____________________________________________________________________________
BE6039-11
3436i SF6 Detector
LumaSense Technologies A/S
Page 24 of 194
Chapter 2
______________________________________________________________________
the default stored value of the protected IP address press the S3
(DEFAULT) key.
When you have set the protected IP address, press the ↵ key.
If you previously selected that the IP address was NOT to be set
by the DHCP server you will proceed to the below step 11.
If you instead selected that the IP address to be set by the DHCP
server, the screen display now shows the following text.
CURRENT DHCP ADDRESS 192.168.000.062
ACCEPT
10. Here the IP address of the 3436i, which has been assigned by the
DHCP server, is displayed. This IP address can be used to
manually set Ethernet communication in a PC application, which
accesses the 3436i gas monitor.
Press the S2 (ACCEPT) key to accept.
11. This concludes the setup of the Ethernet parameters of the 3436i
gas monitor.
Press the SET-UP key to leave the setup.
2.5.2
Display the Homepage of the Monitor
The homepage of the 3436i gas monitor can be displayed if the gas
monitor is connected to a Ethernet network.
In section 2.5.1 it is explained how to set-up the Ethernet
parameters in the 3436i gas monitor.
Any web browser can be used to display the homepage of the gas
monitor. The IP address obtained from the Ethernet set-up of the
3436i gas monitor, can be entered in the address field of the web
browser in order to display the homepage.
The last measured gas values are displayed together with
information about the gas monitor, like the device serial number, if
water compensation is performed.
Error and warning messages (see Chapter 14 for further details) will
also be displayed on the homepage.
The grey "Update Measurements" link can be used to update the
homepage with the last measurement results.
_____________________________________________________________________________
BE6039-11
3436i SF6 Detector
LumaSense Technologies A/S
Page 25 of 194
Chapter 2
______________________________________________________________________
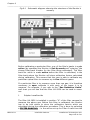
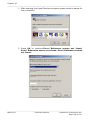
Fig.2.1 The 3436i gas monitor homepage
2.6 Setting-up user Levels
Press the Lock function push button on the front of the Monitor.
This enables setting up 3 different user levels, Level 1, Level 2 and
Level 3.
These user levels are password protected.
Level 1 is the Operator level, which enables start/stop and reading of
measurement results. Partial Reset is possible.
Level 2 is the Expert level, which in addition to Level 1 access
enables set up of parameters. Full Reset is possible.
Level 3 is the Super-User level, which allows all possible operations
including calibration.
2.6.1
Default settings for User Level and Password.
Before dispatch from the factory the User Level and the Password are
set to the following default setting.
User Level 3
And the default setting for the Password is:
Password: ***** (5 times *)
_____________________________________________________________________________
BE6039-11
3436i SF6 Detector
LumaSense Technologies A/S
Page 26 of 194
Chapter 2
______________________________________________________________________
These settings are to be used to change user level or password the
first time.
2.6.2
Changing the Password
In order to change the Password Press the Lock function push
button on the front of the Monitor.
The following text is displayed.
CURRENT USER LEVEL IS X
CHANGE USER LEVEL
CHANGE PASSWORD
Press S3 “CHANGE PASSWORD”
The following text appears.
ENTER PASSWORD "*****"
PRESS ENTER TO CHANGE VALUE
1. Press ↵ to change value.
The following text appears.
CANCEL
ENTER PASSWORD "*****"
DEFAULT
2. Enter the old Password using the ▲ and ▼ keys.
3. Press ↵ .
The following text appears.
PASSWORD IS "*****"
PRESS ENTER TO CHANGE VALUE
4. Type in the new Password using the ▲ and ▼ keys.
5. Press ↵ .
2.6.3
Changing the User Level
In order to change the User Level Press the Lock function push
button on the front of the Monitor
_____________________________________________________________________________
BE6039-11
3436i SF6 Detector
LumaSense Technologies A/S
Page 27 of 194
Chapter 2
______________________________________________________________________
The following text is displayed.
CURRENT USER LEVEL IS X
CHANGE USER LEVEL
CHANGE PASSWORD
1. Press S1 “CHANGE USER LEVEL”
The following text appears.
ENTER PASSWORD "*****"
PRESS ENTER TO CHANGE VALUE
2. Press ↵ .
3. Enter the current Password using the ▲ and ▼ keys.
4. Press ↵ .
The following text appears.
CURRENT USER LEVEL IS X
PRESS ENTER TO CHANGE VALUE
5. Press ↵ .
6. Use the ▲ and ▼ keys to change the User level.
7. Press ↵ .
8. Press the Lock function push button to exit.
2.7 Restoring of calibration data
If you have ordered a calibration from our calibration laboratory, you
will receive a CD with a backup of the calibration data. It is very
important that you store these data in your Calibration Software
BZ7002. Please store the data before using the Gas Monitor. Please
refer to the User Manual BE6034 regarding this procedure.
_____________________________________________________________________________
BE6039-11
3436i SF6 Detector
LumaSense Technologies A/S
Page 28 of 194
Chapter 3
______________________________________________________________________
Chapter 3
Philosophy of Operation
April 2015
_____________________________________________________________________________
BE6039-11
3436i SF6 Detector
LumaSense Technologies A/S
Page 29 of 194
Chapter 3
______________________________________________________________________
The monitor has several essential operational features, which enable
you to operate it without undue reference to this Instruction Manual.
The main features of the monitor which ensure its simple and easy
operation, are listed below:
•
•
•
•
•
The fully, comprehensive Software BZ7002 and BZ7003.
The LumaSoft Gas Single Point 7810 application software.
The short, self-explanatory texts, which appear in the monitor
display when the monitor is being used, give operational guidance
to the user.
The small light-emitting diodes at some of the push-buttons allow
the user to identify how the monitor is operating at any particular
time.
Audible warnings “beep” if any push-buttons are used in the
wrong way.
3.1 PC Use – Online
A monitoring system, where you use the PC environment to set-up
the monitor prior to measuring, display measurement data on the PC
screen while monitoring and store the measurement results directly
on the PC’s hard disc. The LumaSoft Gas Single Point 7810
application software is used for making online measurements. The
measurement results can be used by other programs that fetch data
from the SQL Server Express database server featured by the 7810
application. A manual BE6027 for the 7810 application is available
for reference.
Using the online mode (7810 Application Software) provides you with
a variety of Software Alarm options. Not only are the alarm trigger
levels definable, but the action resulting from an alarm being
triggered can also be defined here. This enables you to connect
external warning systems to the monitoring system.
The philosophy behind the 7810 Application Software is common to
almost all Windows programs. Access to the various levels of the
program is gained by use of the MENU BAR, PULL-DOWN MENUS,
NEW WINDOW options and INDEX-CARD separators. These familiar
procedures, together with the simple software structure, make the
instructions in the On-line sections of this manual understandable
and easy to implement.
_____________________________________________________________________________
BE6039-11
3436i SF6 Detector
LumaSense Technologies A/S
Page 30 of 194
Chapter 3
______________________________________________________________________
3.2 Stand-alone Use
This method of operation is available to those of you who wish to use
the monitor without connection it to a PC. The monitor is set-up and
the results are displayed via the monitor’s front panel.
The structure of the monitor set-up can be viewed like an inverted
tree. The main branches divide and separate into minor branches.
These in turn divide again and again.
To move through the tree, the branches are selected using the
“select” push-buttons (see section 1.5). Use the Set-up Tree,
supplied with the monitor and the example steps below to see how
the instructions progress. Starting from the initial screen display.
CURRENT TIME IS 2015-06-13 17:12
MONITOR IS READY FOR USE
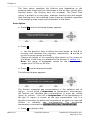
1 Press SET-UP, and the text changes to that displayed below.
MEASUREMENT
SELECT SET-UP BRANCH
FORMAT
CONFIGURATION
1. To select the MEASUREMENT branch, press S1. (Pressing either
of the other “select” push-buttons will take you along another
branch of the set-up tree. The following text is displayed.
SELECT SET-UP BRANCH
MONITORING TASK
ENVIRONMENT
To select the ENVIRONMENT branch, press S3. The text is
displayed.
_____________________________________________________________________________
BE6039-11
3436i SF6 Detector
LumaSense Technologies A/S
Page 31 of 194
Chapter 3
______________________________________________________________________
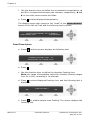
AUTO
SELECT FLUSHING MODE
FIXED TIME
2. To select the AUTO flushing mode, press S1. The following text is
displayed.
LENGTH OF SAMPLING TUBE 00.00 m
PRESS ENTER TO CHANGE VALUE
This branch does not divide again. At this stage you are able to
define the parameters in this branch of the tree using the direction
push-buttons.
If the branch had divided again, it is a simply process of using the
correct “select” push-button to continue down the desired branch.
Parameters that are already selected are displayed either with a
cursor under the current selection or the value is displayed on the
top line.
When the correct value or parameter is already selected, you can
continue on through the tree using the ▼direction push-button.
To exit SET-UP mode press SET-UP
Defining parameters is covered in section 6.1.
The procedures in the example above are common to all the
situations where the “select” push-buttons can be used to access the
different levels in the monitor.
_____________________________________________________________________________
BE6039-11
3436i SF6 Detector
LumaSense Technologies A/S
Page 32 of 194
Chapter 4
______________________________________________________________________
Chapter 4
Introduction to and Familiarization
with the Monitor
April 2015
_____________________________________________________________________________
BE6039-11
3436i SF6 Detector
LumaSense Technologies A/S
Page 33 of 194
Chapter 4
______________________________________________________________________
The Monitor is an extremely versatile measuring instrument, which
can be used to perform almost any kind of monitoring task. Its
versatility may appear overwhelming at first, but to avoid such a
reaction, we suggest that you read this chapter thoroughly, and
follow the practical exercises, which are included. These exercises
give you a “guided tour” through a number of different practical
procedures – monitoring task; performance of a monitoring task;
scrolling through data after completion of a monitoring task. By
following these different procedures the Monitor operating philosophy
will become apparent and you will be able to quickly familiarise
yourself with its operation and control.
4.1 Special Terminology
Certain terms are used to describe the operation of the Monitor and
it is necessary to fully understand what these terms mean before you
start any practical exercise with the Monitor.
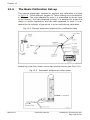
4.1.1
Measurement Cycle
A description of a measurement cycle is given on page 2 of the
Product Data Sheet (see boxed-in text and schematic diagram of the
measurement system of the Monitor). “Measurement Cycle” is the
term used to describe everything that takes place in the Monitor from
the time the pump starts to flush out the “old” gas sample in its
analysis cell, until the signal in the measurement chamber has been
measured using the last relevant optical filter.
The time taken to complete a measurement cycle is dependent upon
the following factors:
The sample integration time selected – longer measurement times
provide greater accuracy.
The flushing times selected for the measurement chamber and the
tube as well as the length of the sampling tube attached to the
Monitor’s air-inlet – the longer the tube, the more time is needed to
flush it out between measurement cycles.
The cleanliness of air-filters which filter the air drawn into the cell
(this affects the pumping time required to draw a fresh air sample
into the analysis cell).
The degree of fluctuation in the concentration of the gas measured in
consecutive measurement cycles (this affects the time required to
adjust the gain of the amplifier attached to the microphones).
Table 4.1 gives some indication to the measurement times depending
on the number of gases measured and the measurement times
selected. However, these times may vary from one measurement
_____________________________________________________________________________
BE6039-11
3436i SF6 Detector
LumaSense Technologies A/S
Page 34 of 194
Chapter 4
______________________________________________________________________
cycle to another due to the cleanliness of the filters and the degree
of fluctuation in the concentration of the various gases.
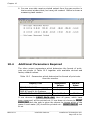
Table 4.1 Approximate measurement times
Monitor Setup
S.I.T.: “Normal” (5s)
SIT : “Low Noise”
(20s)
Volume of Air
Response Times
One gas: ~27s
One gas +water
~40s
140 cm3/sample
One gas +water
~70s
Flushing:
Auto, (tube 1m)
S.I.T.: “Fast” (1s)
Flushing:
Chamber 4s, Tube
“OFF”
4.1.2
20cm3/sample
One gas: ~13s
One gas + water
~22s
Monitoring Task
A monitoring task consists of a series of similar measurement cycles.
These cycles can either be repeated at regular intervals or be
continuous:
4.1.3
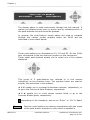
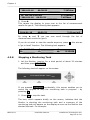
Sampling Interval
The sampling interval is a measure of the time between the start of
one measurement cycle and the start of the following measurement
cycle.
When the Monitor is not sampling continuously the sampling interval
has to be defined by the user and is a fixed period of time (see
Fig.4.1).
_____________________________________________________________________________
BE6039-11
3436i SF6 Detector
LumaSense Technologies A/S
Page 35 of 194
Chapter 4
______________________________________________________________________
Fig.4.1
4.1.4
An illustration of the fixed sampling intervals of the monitor
when it is not sampling continuously.
Continuous Sampling
The Monitor is said to be sampling continuously when each
measurement cycle is followed immediately by another similar
measurement cycle (see Fig.4.2).
Fig.4.2
4.1.5
An illustration of continuous sampling
Monitoring Period
The monitoring period is the time between the start of the first
measurement cycle in a monitoring task and the finish of the final
measurement cycle in a monitoring task.
The monitoring period can either be pre-set by the user – in which
case the Monitor automatically stops monitoring after the monitoring
period is over – or, not pre-set – in which case the Monitor will
continue to monitor until the user stops the monitoring task manually
(see section 4.3.8).
_____________________________________________________________________________
BE6039-11
3436i SF6 Detector
LumaSense Technologies A/S
Page 36 of 194
Chapter 4
______________________________________________________________________
The maximum time you can set a pre-set monitoring period to be is
7 days. If you try to enter a greater number of days, the Monitor will
automatically change the period to 7 days. However, if you do not
set a pre-defined monitoring period, the Monitor will just store as
much data as possible before starting to overwrite the “oldest” stored
measurement results.
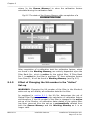
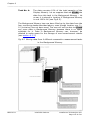
4.2 Attaching the Sampling Tube and External Filter
1
Cut a short section of sampling tube of Poly-Tetra-FluoroEthylene (Teflon) tubing, (optional accessory).
2
Using Fig.4.3 and the instructions below, attach one end of this
tube to the air-inlet stub on the back-panel of the Monitor.
Push one end of the Teflon tubing through the non-threaded end
of the nut.
Hold the end of the tubing between the fingers and gently push
the tubing over the end of the Monitor’s air-inlet stub as far as it
will go.
Note: if the tubing is bent/broken during this procedure, remove
the tubing from the stub and repeat this step using an
undamaged length of tubing.
Screw the threaded-nut firmly onto the end of the air-inlet stub.
Fig.4.3
Attaching tubing to the air-inlet stub and the external filter
_____________________________________________________________________________
BE6039-11
3436i SF6 Detector
LumaSense Technologies A/S
Page 37 of 194
Chapter 4
______________________________________________________________________
3. Attach the other end of the sampling tube to the external air-filter
which is provided as an optional accessory.
4.3 Familiarization with the Monitor using the Front
Panel
4.3.1
Setting the Internal Clock
Before dispatch from the factory, the internal clock of the Monitor is
set to the correct local (Danish) time. If the monitor is to be used as
a stand-alone instrument, then the clock can be adjusted to your
local time using the following instructions.
1. Switch on the AC Mains power switch on the back-panel of the
Monitor.
2. Press SET-UP.
Refer to the Set-Up Tree, supplied with the Monitor, so that you can
follow your movement through the various branches of this “tree” in
the following sequence of button presses.
3. Press S3
S1 S1 S1.
_____________________________________________________________________________
BE6039-11
3436i SF6 Detector
LumaSense Technologies A/S
Page 38 of 194
Chapter 4
______________________________________________________________________
The following screen picture appears:
CURRENT DATE 2015-04-19
PRESS ENTER TO CHANGE VALUE
Dates are entered as the Year-Month-Day, for example the 19th April,
2015 has to be entered as 2015-04-19.
4. To change the date, press ↵ .
5. Use the direction keys to enter the correct date.
Note: press S1 to revert back to the original date.
6. Press ↵ to accept date.
This causes the text on the display screen to change to the
following:
CURRENT TIME 12:00
PRESS ENTER TO CHANGE VALUE
7. To change the time, press ↵.
8. Use the direction keys to enter the correct time. If you make a
mistake in entering the correct date just press S1 and start again.
The current time is entered as the time read on a 24-hour digital
clock. For example, 13:45 is 15 minutes to 2 o’clock in the afternoon.
9. Press ↵ to accept time.
When this step is completed, the display then moves to the previous
head of the Set-Up Tree.
10. Press ▲ three times and follow the path you take en route
through the Set-Up Tree.
The screen display shows the following text:
_____________________________________________________________________________
BE6039-11
3436i SF6 Detector
LumaSense Technologies A/S
Page 39 of 194
Chapter 4
______________________________________________________________________
MEASUREMENT
11.
4.3.2
SELECT SET-UP BRANCH
FORMAT
CONFIGURATION
Press SET-UP to exit.
Setting Units
All data in the Monitor is stored as raw data. The different units,
which you can select here, enable you to enter gas concentrations
and to display temperatures, lengths and pressures in units, which
you are comfortable with. These units are also used to present
measurement data in a form that is most convenient for you.
The Monitor can display gas concentrations either in absolute units of
mg/m3 unit that is dependent on a particular temperature, termed
the normalization temperature, or in units of parts per million (by
volume) – which is independent of the temperature of the gas. You
can inform the monitor about the units you intend to use – for
example: the length of the sampling tube attached to the Monitor’s
inlet (in meters or feet) atmospheric pressure (kPa or mBar or
mmHg) and unit for humidity (ppm or Tdew or kPa or mg/m3).
The measurement units can be changed using the push-buttons on
the front of the monitor:
1. Press SET-UP.
2. Press S3 and then S2.
The following text appears on the screen display:
SELECT CONCENTRATION UNIT
mg/m3
ppm
The cursor appears under the unit which is presently in the active
set-up.
3. Press S1 to select mg/m3.
_____________________________________________________________________________
BE6039-11
3436i SF6 Detector
LumaSense Technologies A/S
Page 40 of 194
Chapter 4
______________________________________________________________________
4. Select metres as the unit of length, °C as the temperature unit,
and kPa as the pressure unit by using a procedure similar to that
described in the previous steps.
After the pressure unit has been selected the following text appears
on the display:
SELECT HUMIDITY UNIT
mg/m3
PRESS ENTER TO CHANGE VALUE
There are more than three humidity units to choose from therefore
the means by which a unit is selected differs:
5. Press ↵ .
6. Use ▲ & ▼ to scroll through the options.
7. When Tdew is displayed, press ↵ .
The display automatically returns
CONFIGURATION setup branch.
to
the
head
of
the
8. Press SET-UP to exit.
4.3.3
Setting the Environment Parameters
Environmental parameters describe the factors which influence the
measurement situation – the length of the sampling tube attached to
the Monitor and the normalization temperature. These parameters
are discussed more fully later on in this section.
1. Press SET-UP, S1 and then S3.
This brings you into the Environment branch of the Set-Up Tree
where the following text is displayed:
AUTO
SELECT FLUSHING MODE
FIXED TIME
_____________________________________________________________________________
BE6039-11
3436i SF6 Detector
LumaSense Technologies A/S
Page 41 of 194
Chapter 4
______________________________________________________________________
The Auto option regulates the flushing time depending on the
sampling tube length and the cleanliness of the air-filter (as the filter
become dirtier, the flushing time will increase). The Fixed Time
option is divided in to two parts; chamber flushing time and sample
tube flushing time. Once defined, these times are constant regardless
of the sampling tube length and cleanliness of the filters.
Auto Option
a. Press S1, and the following display appears.
LENGTH OF SAMPLING TUBE 0.00 m
PRESS ENTER TO CHANGE VALUE
b. Press ↵ .
c. Use the direction keys to define the tube length: ▲ and ▼ to
increase and decrease the numbers, respectively; and to
move the cursor across the fields.
Change the length of the sampling tube shown on the screen to
the length of the tube you attached to the Monitor in section 4.2.
Note: the range of acceptable values for the sampling tube
ranges from 00.00m to 99.00m.
d. Press ↵ to select displayed length.
The following display appears:
NORMALIZATION TEMPERATURE 20.0 º C
PRESS ENTER TO CHANGE VALUE
The Monitor measures gas concentrations in the absolute unit of
mg/m3 – a unit which is dependent on temperature. Alternatively,
the Monitor can calculate gas concentrations in parts per million
(ppm) by volume – this unit is independent of the temperature of
the gas. If mg/m3 is chosen as the gas concentration unit it is
therefore necessary to define the temperature at which you wish the
Monitor to calculate gas concentrations. This pre-defined
temperature is termed the NORMALIZATION TEMPERATURE.
e. Press ↵ to change value.
_____________________________________________________________________________
BE6039-11
3436i SF6 Detector
LumaSense Technologies A/S
Page 42 of 194
Chapter 4
______________________________________________________________________
f. Use the direction keys to define the normalization temperature: ▲
and ▼ to increase and decrease the numbers, respectively; and
to move the cursor across the fields.
g. Press ↵ to select displayed temperature.
The display screen then jumps to the “head” of the MEASUREMENT
branch of the Set-Up Tree and the following text is shown:
SELECT MEASUREMENT SET-UP BRANCH
MONITORING TASK
ENVIRONMENT
Fixed Time Option
a. Press S3, and the screen displays the following text.
CHAMBER FLUSHING TIME 8 s
PRESS ENTER TO CHANGE VALUE
b. Press ↵ .
c. Use the direction keys to define the chamber flushing time.
Note: the range of acceptable values for chamber flushing ranges
from 2s to 60s, increasing in 1s intervals.
d. Press ↵ to select displayed flushing time, and the following text is
displayed.
NO
TUBE FLUSHING ?
YES
e. Press S3 to enable sample tube flushing. The screen displays the
following text.
_____________________________________________________________________________
BE6039-11
3436i SF6 Detector
LumaSense Technologies A/S
Page 43 of 194
Chapter 4
______________________________________________________________________
TUBE FLUSHING TIME
3s
PRESS ENTER TO CHANGE VALUE
f. Press ↵ .
g. Use the direction keys to define the tube flushing time.
Note: the range of acceptable values for tube flushing ranges
from 3s to 120s, increasing in 1s steps.
h. Press ↵ to select displayed flushing time.
The following text is displayed.
NORMALIZATION TEMPERATURE
20.0°C
PRESS ENTER TO CHANGE VALUE
i. Press SET-UP
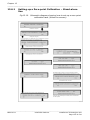
4.3.4
Setting up a Monitoring Task
The optical filter in the monitor has to be calibrated before it can be
used to measure gas concentrations. The user can only set-up a
monitoring task using the optical filters which has been installed. In
the 3436i gas A (that is, to measure gas A’s concentration using the
UA0936 optical filter installed in position “A” of the filter carousel)
and water vapour.
The parameters which describe the monitoring task we shall set-up,
are listed below:
_____________________________________________________________________________
BE6039-11
3436i SF6 Detector
LumaSense Technologies A/S
Page 44 of 194
Chapter 4
______________________________________________________________________
Stand-alone Settings
Monitoring Task Set-up Number = 1
Sampling = Continuous
Monitor for pre-set period = No
Compensate for Water Vapour
Interference = Yes
Compensate for cross-interference =
No
Measure Gas A: XXXXXX = Yes
Measure Water Vapour = Yes
Note: flushing is set in Environmental
Parameters, section 4.3.3, and the
S.I.T’s are set up in the Filters setup,
section 12.3.3
1. Press SET-UP, S1 and then S1.
This brings you into the Monitoring Task branch of the Set-Up Tree
where the following text is displayed:
MONITORING TASK SET-UP NUMBER
PRESS ENTER TO CHANGE VALUE
1
Up to 10 different monitoring tasks can be set-up while operating the
Monitor in Set-up mode. The parameters describing these tasks are
automatically stored in the memory of the Monitor.
2. If the number on the display is already “1” then press to
“accept” the value.
If the number is not “1”:
a.
Press ↵ and use the direction keys to change its value to “1”.
b.
Press ↵ to accept the value.
The text which appears on the display during the next step is really
self-explanatory and it is therefore possible for you to follow why the
_____________________________________________________________________________
BE6039-11
3436i SF6 Detector
LumaSense Technologies A/S
Page 45 of 194
Chapter 4
______________________________________________________________________
button-pushes listed in the next step will set-up the monitoring task
which is described at the beginning of section 4.3.4.
3. Press
S3
S1
S3
S1
S3, then press S1 until the text
MEASURE WATER
VAPOUR appears on the display.
4. Press the S3 button to answer “YES” to measure water vapour.
4.3.5
Store Measurement History.
The following screen is displayed.
NO
STORE MEASUREMENT HISTORY
YES
a.
If you select to answer No, then only the last measured
values are stored in the display memory.
b.
If you select to answer Yes all measured values are
stored in display memory.
5. Press the S3 button to answer “YES” to store the measurement
history.
Once this step is complete, monitoring task number 1 has been setup and the display moves to the previous head of the Set-Up Tree.
6. Press SET-UP to exit the Set-Up mode.
4.3.6
Starting a Monitoring Task
Note: before a monitoring task can be started, the Measurement
Units, Environment Parameters and Monitoring Task Settings must
be defined, see sections 4.3.2, 4.3.3 and 4.3.4.
This section will explain how to perform a monitoring task – for
example, monitoring task number 1 which was set-up in section
4.3.4.
1. Press MEASURE.
The following text appears on the screen:
_____________________________________________________________________________
BE6039-11
3436i SF6 Detector
LumaSense Technologies A/S
Page 46 of 194
Chapter 4
______________________________________________________________________
ACTIVE TASK: MONITORING TASK NUMBER 1
START TASK
DELAYED TASK
CHANGE TASK
Please note: if you do not use one of the “select” keys within a
short time after the above text appears, the Monitor will
automatically stop operating in Measure mode (the light-emitting
diode in the MEASURE key switches off).
If this happens just press MEASURE again.
The active monitoring task number is the number of the monitoring
task you wish the Monitor to perform.
2. If the number on the display is number 1 then go to step 5.
If the number on the display is not number 1 then press S3 to
change the task number to number 1.
This changes the display text to the following:
MONITORING TASK
SELECT TASK
CALIBRATION TASK
3. Press S1.
This causes the following text to appear on the display:
MONITORING TASK SET-UP NUMBER
PRESS ENTER TO CHANGE VALUE
1
The number appearing on the screen will be a number from 1 to 10.
4. Press ↵ and use the direction keys to change the monitoring task
number to 1.
Then press ↵ again to accept the task number.
The following text appears on the display screen:
_____________________________________________________________________________
BE6039-11
3436i SF6 Detector
LumaSense Technologies A/S
Page 47 of 194
Chapter 4
______________________________________________________________________
ACTIVE TASK: MONITORING TASK NUMBER 1
START TASK
DELAYED TASK
CHANGE TASK
5. Press S1 to start the monitoring task.
The following warning then appears on the display:
WARNING: DISPLAY MEMORY WILL BE DELETED
PROCEED
STOP
Display Memory is where the Monitor stores the results of all
measurements while it is performing a monitoring task. If the
monitoring task is stopped and then started again all the data
already collected will be deleted from Display Memory. However, the
data in Display Memory can be copied into and stored in the
Monitor’s Background Memory. This operation is described in section
9.2.
6. Press S1.
The following text then appears on the screen:
MEASUREMENT IN PROGRESS
RESULTS NOT YET AVAILABLE
7. When the first measurement cycle is complete the Monitor will
automatically display the results and update them every time a
new measurement cycle is completed. An example is shown
below:
This display gives the overview of the gas/vapour concentrations last
A: 14.5 E+00
D:________
B:________
E:________
C: ________
W: 8.25 E+00
measured – in this case the concentration of gas A and humidity of
the water vapour are in the units that were selected – that is mg/m3
for gas A and Tdew for water vapour (see section 4.3.2).
_____________________________________________________________________________
BE6039-11
3436i SF6 Detector
LumaSense Technologies A/S
Page 48 of 194
Chapter 4
______________________________________________________________________
4.3.7
Displaying Measurement Results while a Monitoring
Task is in Progress
If store measurement history is selected in the MEASUREMENT setup branch (see section 4.3.5) all measurement data collected during
a monitoring task is stored in Display Memory together with the
parameters which describe the task (see section 4.3.4).
Using the direction keys, you can scroll through this data.
1. After the monitoring task has been running for 10-15 minutes,
press .
An example of the text which appears on the screen is shown below:
DATA IN DISPLAY MEMORY RECORDED
FROM
2014-01-16 09:50 TO 2014-01-16 10:04
This screen text allows you to find out how long the monitoring task
has been running here from 9:50 to 10:04 on the same day. The
date on the right-hand side of the display indicates the time at which
the last measurement cycle was completed while a monitoring task is
in progress this date is, of course, constantly updated.
2. Press and then use & until the following text appears on
the display:
FILTER A USED TO MEASURE
(the name of the gas will appear here)
The displays which follow indicate the type of text which appears
each time is pressed:
GAS A:
MAX 14.5E+00
ALARM 1_____ MIN 7.42E+00
µ 8.03+00
2.36E+00
While a monitoring task is being performed a running statistical
analysis of the monitored gases/vapours is made and the results are
displayed as shown above, where:
MAX
=
MIN
=
maximum concentration of gas A measured during the
period of time the monitoring task has been performed.
minimum concentration of gas A measured during the
period of time the monitoring task has been performed.
_____________________________________________________________________________
BE6039-11
3436i SF6 Detector
LumaSense Technologies A/S
Page 49 of 194
Chapter 4
______________________________________________________________________
ALARM 1= the user-defined concentration of gas A which, if
measured by the Monitor, will trigger a switch in the
Monitor and activate an external alarm relay connected to
it.
µ
=
linear average, or mean value, of all the gas A
concentrations measured during the period of time the
monitoring task has been performed
σ
=
standard deviation of gas A’s concentrations from the
mean value () described above (see section 8.1 for
further details).
All numbers are written in the exponential form, for example:
14.5E+00 = 14.5 x 10+0 = 14.5
The concentration unit in this case is mg/m3 as this was chosen in
the active set-up (see section 4.3.2).
3. Press .
A: Sulphur Hexafluoride
972.06 mBar
7.42 mg/m3
A : Sulphur Hexafluoride
972.06 mBar
2014-01-16
7.42 mg/m3
2014-01-16
09:50:32 ___________
09:51:33 ___________
As you can see, the display provides the date and time at which the
measurement was made, and the concentration of gas A is given in
the units mg/m3 because this was the unit chosen for gas
concentration in the active set-up. The dashed lines, which appear
after the time will be replaced by a number as soon as the
monitoring task has been stopped (see section 4.3.8).
After scrolling through the list of individual measurement results for
gas A, the following text is displayed:
SAMPLING IS CONTINUOUS
MONITORING PERIOD IS NOT PRE-SET
COMPENSATION FOR WATER VAP. INTERFERENCE
MONITORING TASK STARTED
2011-01-16 09:50
_____________________________________________________________________________
BE6039-11
3436i SF6 Detector
LumaSense Technologies A/S
Page 50 of 194
Chapter 4
______________________________________________________________________
MEASUREMENT CHAMBER TEMPERATURE 29.6°C
SAMPLE INTEGRATION TIME
A: 5s
B:___s
C:___s
D:___s
W: 5s
E:___s
A:Sulphur hexaflouride B:________ C:___________
D: ___________
E:__________ W: WATER VAP
A: 7.42E+00
B: ________
D: ____________ E: ________
C:___________
W:
8.13+00
The last display above shows the up-dated overview of the gas
concentrations measured during the most recent measurement cycle.
This display does not appear, after the monitoring task has been
stopped.
Data collected during a monitoring task is stored in the Display
Memory of the Monitor and therefore, before a new monitoring task
is started, all data stored in this memory is deleted. Display Memory
has finite size, and therefore there is a limit to how much data can
be stored in it. Once this memory has been filled-up all subsequent
data collected during the task will start to overwrite the data already
collected during the start of the monitoring task. Only in this event
will the date displayed after the text MONITORING TASK STARTED
on the above screen be different from the earliest date on the
display (shown below) which give the most up-to-date overview of
the monitoring task:
DATA IN DISPLAY MEMORY RECORDED FROM
2014-01-16 09:50 TO 2011-01-16 10:04
4. Press .
This causes the following text to appear on the screen:
WATER VAPOUR MEASURED
Use to scroll through the following screen displays:
MONITORING PERIOD IS NOT PRE-SET
WATER:
MAX 8.55E+00
MIN 7.01E+00
µ 8.15+00
σ 816E-03
_____________________________________________________________________________
BE6039-11
3436i SF6 Detector
LumaSense Technologies A/S
Page 51 of 194
Chapter 4
______________________________________________________________________
W: WATER VAPOUR:
971.88mBar
2014-01-16
09:50:32 _________
7.39Tdew
W: WATER VAPOUR:
2014-01-16
09:51:33 ________
971.88mBar
7.49Tdew
5. Press .
This causes the display to jump over to the list of measurement
results for gas A. The following text appears:
A: Sulphur hexafluoride
2014-01-16
09:51:33 ___________
972.06 mBar
7.43 mg/m3
By using and you can now scroll through the list of
measurement results for gas A.
If you do not wish to view the results anymore, press ↵ , this acts as
a “go to head” function. The following text appears:
A: 7.42E+00
D: _________
4.3.8
B:__________
E:__________
C:___________
W:
8.13+00
Stopping a Monitoring Task
1. Let the Monitor, monitor for a total period of about 30 minutes
and then press MEASURE.
The following text will appear on the screen:
NO
STOP MONITORING TASK ?
YES
If you pressed MEASURE accidentally, this screen enables you to
cancel the request to stop the monitoring task in progress – by
pressing S1.
2. Press S3 to stop the task.
The text, which appears briefly on the screen, indicates that the
Monitor is aborting the monitoring task and a summary of the
monitoring task will appear on the display as soon as the Monitor has
aborted the task. For example:
_____________________________________________________________________________
BE6039-11
3436i SF6 Detector
LumaSense Technologies A/S
Page 52 of 194
Chapter 4
______________________________________________________________________
DATA IN DISPLAY MEMORY RECORDED FROM
2014-01-16 09:50 TO 2014-01-16 10:04
4.3.9
Scrolling through Measurement Results after
Completion of a Monitoring Task
All measurement data collected during a monitoring task, is stored in
Display Memory together with the parameters which describe the
task (a description of the task is given in section 4.3.4).
Using the direction push-buttons, you can scroll through the set-up
parameters as well as the individual gas concentration
measurements results as explained in section 4.3.7. The organisation
of data collected during a monitoring task is illustrated in Fig. 4.4.
This illustration also shows the function of the various direction keys.
For example, enables you to move from the measurement results
of one gas to the measurement results of another.
_____________________________________________________________________________
BE6039-11
3436i SF6 Detector
LumaSense Technologies A/S
Page 53 of 194
Chapter 4
______________________________________________________________________
Fig.4.4 Organisation of the data displayed on the Monitors screen
after completion of a monitoring task :
_____________________________________________________________________________
BE6039-11
3436i SF6 Detector
LumaSense Technologies A/S
Page 54 of 194
Chapter 4
______________________________________________________________________
1. Press and .
The following text appears on the display:
WATER VAPOUR MEASURED
The displays which follow indicate the type of text which appears
each time is pressed:
WATER:
ALARM 1
MAX 8.55E+00
MIN 7.01E+00
µ 8.15+00
σ 816E-03
This is the statistical report of the monitored gases/vapours
displayed when the monitoring task is complete. In this case where:
MAX
= maximum concentration of water vapour measured
during the whole monitoring task.
MIN
= minimum concentration of water measured during the
whole monitoring task.
ALARM 1
=
the user-defined concentration of water vapour
which, if measured by the Monitor, will trigger a switch
in the Monitor and activate an external alarm relay
connected to it.
µ
= linear average, or mean value, of all the water vapour
concentrations measured during the whole monitoring
task.
σ
= standard deviation of water-vapour’s concentrations
from the mean value () described above (see section
8.2.1 for further details).
The humidity unit in this case is Tdew because this is the unit chosen
in the active set-up (see section 4.3.2).
W: WATER VAPOUR:
2014-01-16
09:50:32
1
971.88mBar
7.49Tdew
W: WATER VAPOUR:
2014-01-16
09:51:33
2
971.88mBar
7.49Tdew
As you can see the measurement cycles are numbered sequentially
as soon as the monitoring task has been stopped for example, the
above measurement was made at 09:51:33 on the 16th of January
and it was the second measurement cycle of the monitoring task.
The concentration of water vapour is given in the units of Tdew
because this was the unit chosen for humidity in the active set-up.
_____________________________________________________________________________
BE6039-11
3436i SF6 Detector
LumaSense Technologies A/S
Page 55 of 194
Chapter 4
______________________________________________________________________
After scrolling through the list of individual measurement results for
water vapour the following screen displays appear:
SAMPLING IS CONTINUOUS
MONITORING PERIOD IS NOT PRE-SET
COMPENSATION FOR WATER VAP.
INTERFERENCE
MONITORING TASK STARTED
2014-01-16 09:50
MEASUREMENT CHAMBER TEMPERATURE 39.6°C
SAMPLE INTEGRATION TIME
A: 5s
B:___s
C:___s
D:___s
A: Sulphur hexafluoride B:_________
D: _________
E:__________
W: 5s
E:___s
C:___________
W: WATER VAP
DATA IN DISPLAY MEMORY RECORDED FROM
2014-01-16 09:50 TO 2014-01-16 10:04
Note that the screen showing the overview of gas concentrations
measured during any particular measurement cycle is no longer
shown when the monitoring task has been stopped.
2. Press .
This causes the following text to appear on the screen:
FILTER A USED TO MEASURE
Sulphur hexafluoride
3. Press to scroll through the following data displays:
GAS A:
ALARM 1________
MAX 14.5E+00
MIN 7.42E+00
µ 8.03+00
σ 2.36E+00
_____________________________________________________________________________
BE6039-11
3436i SF6 Detector
LumaSense Technologies A/S
Page 56 of 194
Chapter 4
______________________________________________________________________
A: Sulphur hexafluoride
972.06 mBar
7.42 mg/m3
A:Sulphur hexafluoride
972.06 mBar
7.43 mg/m3
2014-01-16
2014-01-16
09:50:32 ________
09:51:33 _________
Press so you can scroll through the list showing water-vapour’s
results.
If you do not wish to view the results anymore, press ↵ , this acts as
a “go to head” function.
4.3.10
Changing Gas-concentration Units after a Monitoring
Task
The unit mg/m3 was chosen for gas concentrations in the monitoring
task, which was set up in section 4.3.4. As long as mg/m3 is the
active concentration unit (that is, the unit selected while operating
in Set-Up mode), this is the unit which will be used to express gas
concentrations on the display screens of the PC and the Monitor. It is
also the unit when print-outs of monitoring task data are made from
the Monitor. However, the user can express the measured gas
concentrations in ppm:
1. Press SET-UP S3 S2 S3 and then SET-UP.
2. Use to scroll through the results of the monitoring task no. 1
displayed on the screen. Notice that the gas concentration units
have been changed to ppm.
In a similar way the humidity unit for water vapour and the pressure
unit can be changed.
4.3.11
Changing the Humidity Unit after a Monitoring Task
1. Press SET-UP
display:
S3
S2 and then to reach the following
HUMIDITY UNIT
Tdew
PRESS ENTER TO CHANGE VALUE
2. Press ↵ and use the direction keys to display ppm.
3. Press ↵ to accept the unit of ppm.
_____________________________________________________________________________
BE6039-11
3436i SF6 Detector
LumaSense Technologies A/S
Page 57 of 194
Chapter 4
______________________________________________________________________
4. Press SET-UP.
Use to scroll through the results of the monitoring task no. 1
displayed on the screen. Notice that the water vapour unit has been
changed to ppm.
4.3.12
Changing the Pressure Unit after a Monitoring Task
1. Press SET-UP
display:
kPa
S3
S2 and then to reach the following
SELECT PRESSURE UNIT
mBar
mmHg
2. Press S3 to accept the unit of mmHg.
3. Press SET-UP.
Use to scroll through the results of the monitoring task no. 1
displayed on the screen. Notice that the Pressure unit has been
changed to mmHg.
_____________________________________________________________________________
BE6039-11
3436i SF6 Detector
LumaSense Technologies A/S
Page 58 of 194
Chapter 5
______________________________________________________________________
Chapter 5
The Monitor
April 2015
_____________________________________________________________________________
BE6039-11
3436i SF6 Detector
LumaSense Technologies A/S
Page 59 of 194
Chapter 5
______________________________________________________________________
5.1 Introduction
This chapter is primarily for those users who want to use the monitor
as a stand-alone instrument. But the start-up and alarm relay
sections are also of interest for the PC user.
5.2 Front Panel
The front panel of the monitor is dominated by a 2 x 40 character
fluorescent display screen, 3 Select push-buttons located beneath it
and 5 direction push-buttons (see Fig. 5.1). The rest of the pushbuttons, situated in a line along the bottom, are function pushbuttons.
Small light-emitting diodes (LEDs) are mounted above some of the
front-panel push-buttons. Their function is to inform you of the
operating state of the monitor. For example, if the LED above the
MEASURE push-button is lit, it indicates that the Monitor is either
busy performing measurements or has been set-up to start
measurements at a pre-defined time.
Fig.5.1 The front panel of the 3436i.
_____________________________________________________________________________
BE6039-11
3436i SF6 Detector
LumaSense Technologies A/S
Page 60 of 194
Chapter 5
______________________________________________________________________
5.2.1
Direction Push-buttons
This group of 5 push-buttons is referred to in this manual as the
direction push-buttons.
▲ & ▼ have two uses: to increase & decrease numbers, respectively,
or to go to the Previous & Next Displays, respectively.
The number increase and decrease functions are used whenever
values, which can be changed manually, are displayed on screen,
for example, changing a parameter such as the length of sampling
tube.
The “Previous Display” and “Next Display” functions are used when
you want to view the previous or next screen texts. This can be
useful when setting up the monitor. By using these push-buttons,
you can scroll quickly through a branch of the Set-Up Tree. These
push-buttons can also be useful when viewing measurement data,
for example, if you are looking at gas A’s measurement result no.3
– by pressing ▲, gas A’s measurement result no.2 will be shown
on the screen. By pressing ▼, gas A’s measurement result no.4
will appear on the display screen.
◄ & ► enable you to move across number fields or go to the
Previous & Next gases, respectively.
When you are entering values or names in the monitor, for
example when setting up the monitor, you can use these pushbuttons to move the cursor across the entry fields.
“Previous Gas” & “Next Gas” functions are used primarily when
viewing measurement data. The display screen only displays the
measurement data for one gas at a time. These push-buttons
allow you to look at the measurement data for the gas and water
vapour (see Fig.4.4 and section 4.3.9).
↵ Depending on the situation, this push-button acts as either an
“Enter” or “Go To Top of Measurements” function.
The “Enter” function is used whenever measurement units are
selected or any text, for example filter names or gas names, are
being entered. The Monitor display will typically display a text
similar to PRESS ENTER TO CHANGE VALUE.
The “Go To Top of Measurements” function is used in the following
situations:
_____________________________________________________________________________
BE6039-11
3436i SF6 Detector
LumaSense Technologies A/S
Page 61 of 194
Chapter 5
______________________________________________________________________
•
•
5.2.2
If you are viewing measurement data, when ↵ is pressed, the
display will move to the screen showing the text DATA IN
DISPLAY MEMORY RECORDED FROM… which gives the period
of time data was recorded – see Fig.4.4 for details.
If the Monitor is performing measurements when ↵ is pressed,
the Monitor will display the last measured concentrations of all
the gases.
The Select Push-buttons
Located below the text display screen, these three push-buttons,
allow you to select from the pre-defined options appearing on the
display screen. The following example illustrates the use of the select
push-buttons:
If the text on the screen appeared as follows:
mg/m3
5.2.3
SELECT CONCENTRATION UNIT
ppm
a.
By pressing S1 the gas concentrations which appear in the
measurement results will be quoted in mg/m3.
b.
By pressing S3 the gas concentrations which appear in the
measurement results will be quoted in ppm.
Function Push-buttons
The order of these push-buttons are the same as they are seen on
the front of the monitor.
RESET
By pressing this push-button you can choose the type of
reset the Monitor should perform. For further details see
section 5.3.
LOCK
This push button enables setting up three different
password protected User Levels. For further details see
section 2.6.
MEASURE In this mode you are able to choose the type of
measurement the Monitor should perform, and decide
when the measurement should start.
_____________________________________________________________________________
BE6039-11
3436i SF6 Detector
LumaSense Technologies A/S
Page 62 of 194
Chapter 5
______________________________________________________________________
AVERAGE This push-button allows you to average measurement
data. The lamp in this push-button is lit when
measurement data is being averaged. You define the
averaging times using the set-up mode.
EVENT
(If an unusual or interesting event occurs during a
measurement period, you can mark the time such an
event took place by pressing this push-button. Each
event marker is given a serial number, which can be used
as a reference. Events are marked on print-outs of
measurement data.
MEMORY In this mode you are able to store measurement data in
the Background memory of the monitor, as well as recall
or delete data from the Background memory.
INFO
This push-button has two functions. It allows you to
perform the following two functions:
• Acknowledge any message, which may appear on the
display screen during operation of the Monitor.
• Obtain more detailed information about the condition
of the Monitor at any particular moment of time, if
such information exists.
PRINT
By pressing this push-button, measurement results in the
Display memory of the Monitor can be printed out. The
lamp above this push-button is lit, while measurements
are being printed and the display will show PRINTING
MEASUREMENT DATA until all data has been printed out.
SET-UP
In this mode you are able to enter the Set-Up Tree of the
Monitor. In set-up mode, the user is able to program the
Monitor to perform almost any kind of measurement, and
amongst other things; enter data about the optical
filter(s) which are installed in the Monitor; select different
measurement parameters; choose how measurement results should be formatted in print-outs; choose the
interface and communication codes which are necessary
to print data; set the internal clock of the Monitor and
choose the self-tests the Monitor should perform.
When the Talk/Listen LED is lit, this means that there is activity on
one of the interfaces.
_____________________________________________________________________________
BE6039-11
3436i SF6 Detector
LumaSense Technologies A/S
Page 63 of 194
Chapter 5
______________________________________________________________________
5.3 Starting-up or Restarting the Monitor
5.3.1
Introduction
When the monitor is started up in the normal way, that is, by
switching on the AC Mains power-switch on the back panel, the
monitor responds by performing a partial reset. A partial reset is
also performed if during operation the monitor is switched off and is
re-started in any of the following ways:
•
•
If the Monitor stops operating due to an AC mains power failure
and then re-starts itself (automatically) when power is restored to
it;
If the user stops operating the Monitor by switching it off using
the AC mains power switch on the back panel, and then re-starts
it by using the same switch:
Users can also “partially reset” the Monitor by using the RESET
push-button on the front panel (see section 5.2.3).
5.3.2
A Partial Reset of the Monitor
When the Monitor performs a partial reset a number of self-tests
are automatically performed. The types of tests performed depend
only upon the time, which has elapsed since the Monitor was last
switched on.
•
•
If more than 10 mins. have elapsed since the Monitor was
switched on it will perform the software, data-integrity, and
hardware tests when switched on again.
If less than 10 mins. have elapsed since the Monitor was switched
on it will perform only the data-integrity tests when switched on
again.
There are essentially 3 types of self-tests which can be performed
during a “partial reset” – a software test, a data-integrity test and
a hardware test.
It takes the Monitor only a few seconds to perform the dataintegrity tests; and about 3 minutes to perform both the software
and hardware test. The different tests are explained below.
Software test
This test checks the information in the Monitor’s software (ROM –
Read Only Memory.)
Data-integrity test
This test checks the integrity of the data stored in the Monitor’s
Source Memory (i.e. its EEPROM – Electrically Erasable
_____________________________________________________________________________
BE6039-11
3436i SF6 Detector
LumaSense Technologies A/S
Page 64 of 194
Chapter 5
______________________________________________________________________
Programmable Read Only Memory) and the integrity of the data
stored in the Monitor’s Working Memory (RAM).
Hardware test
This test checks that the electrical, mechanical and electronic
parts of the Monitor are functioning properly.
The following parts of the Monitor are checked: the pump; the
valves in the pneumatic system; the infra-red light source; the
power supply; the filter carousel; the motor which drives the
chopper wheel; the external vibration level (to make sure that it
does not contribute to the signal measured in the analysis cell);
the analogue circuitry and the microphones (to check that they
are functioning properly).
If you do not wish the Monitor to perform the hardware test
during a partial reset, you can disable it (see section 5.4.3). This
also disables the regular self-tests.
If any part of the Monitor is found to be functioning incorrectly a
message will appear in the display to inform the user of the problem.
For example:
OPERATING ERROR:
PUMP TEST FAILED
The user must acknowledge receipt of such a message by pressing
INFO. Operating errors and warning messages are listed in tableform in Chapter 14 at the end of this manual.
If a fault is found in any of the blocks of data stored in the Working
Memory, the Monitor will automatically set the parameters in the
relevant compartment(s) to their default values, and the Monitor will
send the following message on its display screen:
WARNING: MEMORY SET TO DEFAULT
ERROR DETECTED IN XXXXX MEMORY
Where XXXXX denotes the part of the memory that has been
affected. When such a message is received users must check the
contents of the relevant memory to find out which data has been
affected before continuing to operate the Monitor.
_____________________________________________________________________________
BE6039-11
3436i SF6 Detector
LumaSense Technologies A/S
Page 65 of 194
Chapter 5
______________________________________________________________________
5.3.3
Response of the Monitor after a Partial Reset
The way in which the Monitor responds after a partial reset is
dependent upon the way it was being operated at the time of the
partial reset (see Table 5.1). For example, if the Monitor was busy
taking a measurement when it was “partially reset” it will complete
the interrupted measurement after the partial reset, continue its
monitoring task and make a special “mark” alongside the first
complete measurement cycle it performs after the reset. These
“marks” are described in section 8.2.2 and section 8.2.3.
Table 5.1 Dependence of Monitor’s response, after a partial reset, to
its operating condition at the time of the partial reset.
Monitor last
used while in…
Measurement
mode
“Display”
Set-up mode
Memory mode
“Interface”
5.3.4
Task being
performed
Task started after a
PARTIAL RESET
Looking at measurement
results on the display
screen
Changing set-up
parameters which control
the operation of the
Monitor
Handling measurement
results which are stored
in Display Memory and
Background Memory
Obtaining hard-copies
(that is, print-outs of, for
example, measurement
data)
Measurement results are
shown on the display from the
beginning again
Measurement results are
shown in the display from the
beginning
A gas measurement
Completes the monitoring task
Completes any interrupted task
and then measurement results
are shown in the display from
the beginning
Print-out is stopped and
measurement results are
shown in the display from the
beginning
Full reset and/or Partial Reset of the Monitor via its
Front Panel
There are two well-defined levels of reset. By pressing RESET the
following text appears on the display screen:
SELECT RESET TYPE
PARTIEL
FULL
NONE
_____________________________________________________________________________
BE6039-11
3436i SF6 Detector
LumaSense Technologies A/S
Page 66 of 194
Chapter 5
______________________________________________________________________
If S3 is pressed, you can come out of reset mode without performing
any kind of reset. The Monitor just goes back to operating the same
way it was operating before the RESET push-button was pressed.
S1 PARTIAL Reset: If this level of reset is chosen the Monitor
stops operating, performs a partial reset as described in the
previous section (section 5.3.2) and then resumes operating in
the fashion described in Table 5.1.
S2 FULL Reset: If this level of reset is chosen the Monitor responds
by changing the text on the display so that you have a chance to
confirm that you wish the Monitor to perform a FULL reset:
NO
PERFORM FULL RESET ?
YES
S1 By pressing this push-button the user can come out of reset
mode without performing any kind of reset. The Monitor just
goes back to operating the same way it was operating before
RESET was pressed.
S3 By pressing this push-button the user confirms that a FULL
reset is required. During a FULL reset the Monitor performs the
following two tasks:
• “Clearing” (emptying) all data from its Working Memory.
This means all data in Display Memory and Background
Memory will be lost.
• Copying data from its Source Memory into its Working
Memory. This means that set-up parameters in block 3 of
Working Memory “Other Set-up Parameters” will be given
their default values, and the values of the optical filter setup parameters in Working Memory will be the same as
those found in Source Memory.
5.4 Configuring the Monitor
5.4.1
Setting the Clock
Before dispatch from the factory, the internal clock of the Monitor is
set to the correct local (Danish) time.
_____________________________________________________________________________
BE6039-11
3436i SF6 Detector
LumaSense Technologies A/S
Page 67 of 194
Chapter 5
______________________________________________________________________
The current date is entered as Year-Month-Day for example the
24th of July 2014 is entered as 2014-07-24.
The current time is entered as the time on the 24-hour clock for
example 14:05 is five minutes after two in the afternoon. Table
5.2 details the range of acceptable values and the default value of
the date and time.
Table 5.2
The range of acceptable values and the default value of
the date and time
Display Text
Acceptable Values
ENTER CURRENT DATE 0000-01-01
ENTER CURRENT TIME 12:47
0000-01-01 to 9999-12-31
00:00 to 23:59
Default
Value
2013-01-01
12:00
If the Monitor is to be used as a stand-alone instrument, then the
clock can be adjusted to your local time using the following
instructions.
1. Press SET-UP.
Refer to the Set-Up Tree diagram, so that you can follow your
progress through the various branches of this set-up.
2. Press S3 S1 S1 S1.
The following screen picture appears:
CURRENT DATE
2014 – 06 – 13
PRESS ENTER TO CHANGE VALUE
3. To change the date, press ↵ .
4. Use the direction push-buttons to enter the correct date. If you
make a mistake, press S1 to revert back to the original date.
5. Press ↵ to accept the date.
This causes the text on the display screen to change to the
following:
_____________________________________________________________________________
BE6039-11
3436i SF6 Detector
LumaSense Technologies A/S
Page 68 of 194
Chapter 5
______________________________________________________________________
CURRENT TIME
12:00
PRESS ENTER TO CHANGE VALUE
6. To change the time, press ↵ .
7. Use the direction push-buttons to enter the correct time. If you
make a mistake in entering the correct date just press S1 and
start again.
8. Press ↵ to accept the time.
When Step 8. has been completed the display then moves to the
previous head of the set-up “tree”.
9. Press three times. The screen display shows the following text:
MEASUREMENT
SELECT SET UP BRANCH
FORMAT
CONFIGURATION
10. Press SET-UP to exit the set-up function.
5.4.2
Adjusting the Sound Level
During certain operations or, for example, when an incorrect pushbutton is pressed, the Monitor emits a “beep”. You choose the
volume of the Monitor’s “beep”. The volume of the “beep” is
expressed on a scale from 0 (no “beep”) to 3 (loudest “beep”). Table
5.3 provides details of the available choices and the default value of
this parameter.
Table 5.3
The available choices and the default value of the
Monitor’s “beep”
Display Text
ENTER SOUND VOLUME 0
Available Choices
0, 1, 2, 3
Default Value
1
To set the volume:
_____________________________________________________________________________
BE6039-11
3436i SF6 Detector
LumaSense Technologies A/S
Page 69 of 194
Chapter 5
______________________________________________________________________
1. Press SET-UP.
2. Press S3 S1 S1 S2 .
The following screen picture appears:
SOUND VOLUME 1
PRESS ENTER TO CHANGE VALUE
3. To change the volume, press ↵ .
4. Use the direction push-buttons to enter the correct volume. If you
make a mistake, press S1 to revert back to the original volume.
5. Press ↵ to accept volume.
6. Press SET-UP to exit the set-up function.
5.4.3
Enabling/Disabling Self Tests
If you do not wish the Monitor to perform regular self-tests, including
the hardware test on power-up you can disable it.
1. Press SET-UP S3 S1 S1 S3
NO
REGULAR SELF - TESTS ?
YES
2. Press S1, the Monitor no longer performs the hardware test as
part of its self-testing procedure during any kind of reset.
3. Press SET-UP to exit the set-up function.
5.5 Alarm Relay
Two alarm relays are built into the alarm relay socket on the
back panel of the Monitor. The function of the pins in this female
connector are shown in Fig.5.2. The two alarm relays can be
connected to a variety of either audio (for example, a siren)
_____________________________________________________________________________
BE6039-11
3436i SF6 Detector
LumaSense Technologies A/S
Page 70 of 194
Chapter 5
______________________________________________________________________
and/or visual (for example a flashing light) alarm systems and
they are activated whenever a pre-defined concentration (alarm
level) of one (or more) of the gases being measured is exceeded.
Alarm signals are given by opening and closing the relay contacts.
Both relays are closed when the Monitor is switched off and when
the Monitor is switched on. This means that there is a direct
electrical connection between pins 1 & 2 and pins 4 & 5 at all
times except when the Monitor measures a gas concentration
which is greater than the corresponding alarm limit for the gas.
When this concentration is measured, the Monitor breaks the
connection between pins 1 & 2 or 4 & 5. The monitor will
furthermore activate the internal beeper and write the following
message on the display:
WARNING:
ALARM LIMIT EXCEEDED
The user can switch off the beeper and the message by pressing
INFO or RESET push-button on the front-panel of the Monitor.
The alarm relays will continue being activated until either (1) all
measured gas concentrations fall below their user-defined alarm
level(s); or (2) the monitoring task is stopped – this automatically
closes the alarm relays.
Alarm Relay 1:
Alarm Relay 1: correspond to High Alarm Limit 1.
Whenever one or more gases exceed their alarm level(s) for high
alarm limit 1, the Monitor breaks the electrical connection
between pins 1 & 2 and this activates the attached alarm system.
Alarm Relay 2:
Alarm Relay 2: correspond to High Alarm Limit 2.
Whenever one or more gases exceed their alarm level(s) for high
alarm limit 2, the Monitor breaks the electrical connection between
pins 4 & 5 and this activates the attached alarm system.
LumaSense supplies a 6-pin DIN plug (male) with a locking collar
JP0600 for connecting external alarm devices to the alarm relay.
Caution:
The DC voltage across the relay contacts must not exceed 25V. The
potential on the relay contacts must not be more than 25VDC above
chassis potential, as this will cause an excessive leakage current. The
_____________________________________________________________________________
BE6039-11
3436i SF6 Detector
LumaSense Technologies A/S
Page 71 of 194
Chapter 5
______________________________________________________________________
current through the contacts must not exceed 100mA. AC voltages
must not be connected to the Alarm Relay socket.
Fig.5.2
Configuration of the pins in the alarm relay socket
Alarm relay 1
Alarm Relay 2
5.6 Continuous Warm System
The Continuous Warm System ensures that the monitor is kept warm
at any time that is also when the Monitor is not measuring.
If the Monitor is powered up at all time you can save the warm up
time when starting a measurement.
5.6.1
Setting-up the Monitor to Continuous Warm System
The procedure to enable the Continuous Warm System is as follows:
1. Press the following push-button sequence: SET-UP S3 S1 S1,
and the following text is displayed:
SELECT GENERAL SET-UP BRANCH ?
CLOCK
SOUND
TESTS
2. Press S3 three times
continuous warm system.
S3
SET-UP. This selects the
3. Press RESET S1 (Partial Reset) in order to enable the continuous
warm system.
_____________________________________________________________________________
BE6039-11
3436i SF6 Detector
LumaSense Technologies A/S
Page 72 of 194
Chapter 6
______________________________________________________________________
Chapter 6
Keying-in Parameters
April 2015
_____________________________________________________________________________
BE6039-11
3436i SF6 Detector
LumaSense Technologies A/S
Page 73 of 194
Chapter 6
______________________________________________________________________
6.1 Types of Parameters
There are four types of parameters:
Numerical: you are free to enter the desired values. However, there
may in many instances be a range in which your values must lie.
These ranges can be found in the relevant sections of this manual.
Text: you are able to type user-defined text, for example, the names
of the gases you are measuring and when using the PC the names of
your databases.
The characters available to you when using the monitor on its own
are shown in the table below:
Fig.6.1 The characters which are available for gas names
Characters available for Gas Names
▲→
AaBbCcDdEeFfGgHhIiJjKkLlMmNnOoPpQqRrSs
TtUuVvXxYyZz_’ ”. , : ; &!?@ | ^ # $ \ % / + - ( ) { } [ ]
<>Ø
1 2 3 4 5 6 7 8 9 AaBbCc etc
←▼
Pre-defined: you are able to select a parameter using the “select”
push-buttons when there are three or less options, or by scrolling
through a pre-defined list using the direction push-keys. The
parameters in the lists are given in more detail in the relevant sections of this manual.
Current Time: in the monitor is synchronized to match the time and
date of the internal clock in the PC when the two are connected
together. However, it is possible to adjust the monitors date and
time using the front panel push-buttons. This is described in full in
section 5.4.1.
Stand-alone Use
Whenever you are choosing parameters and/or “entering” parameter
values via the front-panel push-keys, two options are available:
SELECT HUMIDITY UNIT
CANCEL
Tdew
DEFAULT
_____________________________________________________________________________
BE6039-11
3436i SF6 Detector
LumaSense Technologies A/S
Page 74 of 194
Chapter 6
______________________________________________________________________
CANCEL
This option appears over the S1 select push-button. If
you change the value of a parameter on the display
screen and then decide that the new value is not correct,
the original parameter can be brought back to the screen
by pressing S1.
Default
This option appears over the S3 select push-button. If
you wish the parameter appearing on the display screen
to be the same as the factory-defined value you can
press S3.
Some parameters do not have pre-defined default values, so that
when Default is used a blank line will appear instead of a number.
The default value of such a parameter is said to be “blank”. For
example:
GAS A’S HIGH ALARM LIMIT 1________ppm
CANCEL
DEFAULT
If the value of a chosen parameter lies outside the pre-defined
minimum and maximum values the value will be corrected and, at
the same time, a “beep” will sound. You will then have to “enter” the
correct value by pressing ↵ and repeating the process.
When you have to choose or change a parameter, and the text
PRESS ENTER TO CHANGE VALUE is displayed, use the direction
push-buttons and follow the procedure below. Details about the
direction keys are provided in section 5.2.
1. Press ↵ . A cursor will blink under one of the parameter’s numbers
or letters and the bottom line will display the soft-keys Cancel
and Default.
2. Use and to change the entry above the cursor to the desired
number, letter. For pre-defined parameters, these push-buttons
enable you to scroll through the list. Display the desired
parameter, then go to step 5.
3. Use and to move the cursor across the entry fields and
repeat step 2.
4. Repeat steps 2 and 3 until the entry fields show the desired value
or text.
5. Press ↵ .
_____________________________________________________________________________
BE6039-11
3436i SF6 Detector
LumaSense Technologies A/S
Page 75 of 194
Chapter 6
______________________________________________________________________
If the parameter you desire is already selected (i.e. a cursor is
displayed under it), then using enables you to move directly to the
next display.
These procedures are common for all the parameters in the Monitor.
_____________________________________________________________________________
BE6039-11
3436i SF6 Detector
LumaSense Technologies A/S
Page 76 of 194
Chapter 7
______________________________________________________________________
Chapter 7
Setting-up and Starting
a Monitoring Task
April 2015
_____________________________________________________________________________
BE6039-11
3436i SF6 Detector
LumaSense Technologies A/S
Page 77 of 194
Chapter 7
______________________________________________________________________
Before a measurement task can commence, there are a variety of
parameters that must be defined first. This is called “Setting up the
Monitor”.
This chapter instructs you on how to set up the monitoring system
before starting to measure. As mentioned previously in this manual,
the parameters can be defined using the PC Use instructions, i.e.
when using a PC, or the stand-alone Use instructions, i.e. when using
the front panel push-keys on the monitor.
Before leaving the factory, each of the parameters found in the setup “tree” (see the Quick Set-up Guide) are given factory values
(default values).
When setting-up the Monitor as a stand-alone instrument, those
values with a cursor underneath them are the active values. It is
the active values, which determine how the Monitor will operate.
Warning! Failure to define any parameter may result in the default
parameters being used. This can result in the monitor measuring
incorrectly or being unable to start the measurement task.
7.1 The Parameters’ Units
The Monitor works internally with measurement parameters in SI
units. These units can be converted and displayed as a variety of
other measurement units. Defining the units here has two uses. It
enables you to set-up the measurement parameters using familiar
units and displays the measurement results with the desired
concentration units.
These parameters are listed below.
Table 7.1 The possible parameter units and the default settings
Parameters
Humidity
Units
mg/m3,
ppm, Tdew, kPa
Default Unit
mg/m3
Pressure
mbar, mmHg, kPa
kPa
Temperature
°C, °F, K
°C
Gas Concentrations
mg/m3, ppm
mg/m3
Length
m, ft
m
The units for existing measurement results can also be changed
using these instructions.
_____________________________________________________________________________
BE6039-11
3436i SF6 Detector
LumaSense Technologies A/S
Page 78 of 194
Chapter 7
______________________________________________________________________
Normalization Temperature
If you have chosen to measure gas concentrations in the unit
mg/m3, you must “enter” the temperature at which the Monitor
should calculate gas concentrations. If, for example, you “enter” a
normalization
temperature
of
25°C,
the
measured
gas
concentrations, which appear on the display during a monitoring task
will be calculated in mg/m3 units at 25°C. The acceptable values and
the default values of the normalization temperature are given in
Table 7.2 in the different temperature units.
Table 7.2 The acceptable values and the default values of the
normalization temperature
Display Text
Acceptable Values
NORMALIZATION TEMPERATURE
0°C, 20°C and 25°C
NORMALIZATION TEMPERATURE
32°F, 68°F and
77°F
273K, 293K and
298K
NORMALIZATION TEMPERATURE
7.1.1
Default
Value
20°C
68°F
293K
Stand-alone Unit Set-up
For those of you setting up the monitor using these instructions, it
may be useful for you to follow the steps taken using the Set-Up
Tree.
The philosophy of the instructions is described in section 3.2.
To enter at the top of the Set-Up Tree, press SET-UP and the
monitor displays the following screen text.
MEASUREMENT
1.
SELECT SET-UP BRANCH
FORMAT
CONFIGURATION
Press S3 to enter the CONFIGURATION branch. The new text
displays three branches.
_____________________________________________________________________________
BE6039-11
3436i SF6 Detector
LumaSense Technologies A/S
Page 79 of 194
Chapter 7
______________________________________________________________________
SELECT CONFIGURATION SET-UP BRANCH
SYSTEM
UNIT
FILTERS
Units branch
2.
Press S2 to enter the Units branch.
3.
Use the select push-buttons to define the concentration unit.
4.
Use the select push-buttons to define the length unit.
5.
Use the select push-buttons to define the temperature unit.
6.
Use the select push-buttons to define the pressure unit.
7.
The humidity unit is displayed. Use the direction push-buttons
to change it to the correct value.
When step 7 is completed the display returns to the top of the Units
branch.
Press to go to the top of the Set-Up Tree, or press SET-UP to exit
the set-up mode.
7.2 The Measurement Parameters
Sampling:
Sampling mode: the manner in which the gases are sampled. There
are two possibilities here:
Continuous sampling: once the monitor is finished measuring it
starts again making the next measurement,
for a full explanation see section 4.1.
Interval Sampling:
this is the time from the start of one
measurement cycle to the start of the next
one, for a full explanation see section 4.1.
_____________________________________________________________________________
BE6039-11
3436i SF6 Detector
LumaSense Technologies A/S
Page 80 of 194
Chapter 7
______________________________________________________________________
Table 7.3 The range of acceptable values and the default value for the
Fixed interval sampling
Acceptable Values
hours:minutes
00:01 to 01:00
Interval
hours:minutes
00:01
Defalut Value
hours:minutes
00:02
Flushing: the length of time the monitor flushes the measurement
chamber and the sample tubing between measurements. There are
two options here:
Auto:
the monitoring system controls the flushing by
selecting the optimum flushing time. This time can
vary as this option takes into account the
cleanliness of the external air-filters and the
length of the sampling tube.
Therefore, the sample tube length must be defined.
Table 7.4 The acceptable values and the default values of the length of the
sampling tube
Monitor Display Text
Acceptable Values
LENGTH OF SAMPLING
TUBE
LENGTH OF SAMPLING
TUBE
0 – 99 metres
Default
Value
0.00
0 – 324.90 feet
0.00
Fixed Time:
there are two selections here: Chamber, which is
always selected with this option and Tube. See
Table 7.5 for the acceptable values.
Table 7.5 The range of acceptable values and the default values for the
chamber and sample tube flushing times
Acceptable Values
Interval
Chamber: 2 to 60 s
Tube: 0 (=off), 3 to 120 s
1s
1s
Default
Value
8s
3s
Water Interference: the Monitor is capable of measuring water’s
contribution to the signal measured in its analysis cell. The user can
decide whether or not the signal should be compensated for water’s
contribution. It is suggested that water should be compensated for in
all measuring situations except where extremely dry gases are being
measure.
_____________________________________________________________________________
BE6039-11
3436i SF6 Detector
LumaSense Technologies A/S
Page 81 of 194
Chapter 7
______________________________________________________________________
Gas Monitor Display / Averaging Period (3436i stand-alone use):
this enables you to decide if instantaneous values or averaged values
are displayed on the gas monitors screen.
If average values are desired, then the example below illustrates
how the values are calculated and displayed.
Let us suppose that the Monitor has been taking measurements
every 2.5 min., over a period of 30 min., of gas A Sulphur
hexafluoride and the following results (un-shaded area) were
obtained and recorded in the display memory, for stand-alone
users.
A: Sulphur hexafluoride
0
0
0
0
0
0
0
0
0
0
0
0
11:42:30
11:45:00
11:47:30
11:50:00
11:52:30
11:55:00
11:57:30
12:00:00
12:02:30
12:05:00
12:07:30
12:10:00
1
2
3
4
5
6
7
8
9
10
11
12
Averaged Values
66.72
154.90
271.30
415.90
588.70
789.70
1.019
1.276
1.562
1.876
2.218
2.589
mg/m3
mg/m3
mg/m3
mg/m3
mg/m3
mg/m3
g/m3
g/m3
g/m3
g/m3
g/m3
g/m3
66.72
110.9
164.3
227.2
299.5
444.1
616.9
817.9
1.047
1.304
1.159
1.904
mg/m3
mg/m3
mg/m3
mg/m3
mg/m3
mg/m3
mg/m3
mg/m3
g/m3
g/m3
g/m3
g/m3
Let us suppose that the averaging period was set to 10 min. When
the above measurement results are displayed on the screen and
the averaging function is activated then each measurement will be
averaged over the previous 10 min. and the averaged
measurement results will replace the individual measurement
results (averaged results are shown in the shaded area in the list
above). For example: measurement number 7 would be 616.9
mg/m3. This is the average of the 5 measurements taken in the
10 min. period ending at 11:57:30. Measurement number 12
would be 1.904 g/m3 which is the average of the 5 measurements
taken in the 10 min. period ending at 12:12:00.
The range of acceptable values and the default value of the
averaging period are shown in Table 7.6.
_____________________________________________________________________________
BE6039-11
3436i SF6 Detector
LumaSense Technologies A/S
Page 82 of 194
Chapter 7
______________________________________________________________________
Table 7.6 The range of acceptable values and the default value of the
averaging period
Display Text
ENTER AVERAGING PERIOD
00:10
Acceptable
Values
hours:minutes
00:10 to 12:00
Default Value
hours:minutes
00:10
Stand-alone Use
When the averaging function is active it will not only affect the
results displayed on the screen but also the measurement results
which are being printed out from the Display Memory (see Chapter
10). However, when the averaging function is deactivated – by
pressing AVERAGE again (the LED will switch off) – the original
results (un-shaded) will replace the averaged results on the screen.
Gas :
Gas Setup: there are up to six selections here: A,B, C, D, E and W.
These represent the filter positions in the monitor’s filter carousel.
When setting up a new monitoring task, you can choose freely
between the gases available for the filter (names entered when
calibrating the filter, see sections 12.3 and 12.5). Once a gas has
been selected for the filter and the measurement task started, you
can no longer change the gas for this filter in this measurement task.
However, you can still select gases for filters, which have not
previously been used in the measurement task.
Note: only one gas per filter can be selected at a time for
measuring. The W position always represents the water filter
installed in the monitor.
Sample Integration Time: this enables you to make a choice
between speed and accuracy. Generally, the longer the integration
time the more accurate the results. There are several selection
possibilities here:
Integration Type
Fast
Normal
Low Noise
Advanced
Integration Time
1s
5s
20 s
0.5s, 1s, 2s, 5s, 10s, 20s, 50s
Alarm set-up:
Select Gas: this option enables you to select any of the gases (one
per filter position) already defined in the set-up.
_____________________________________________________________________________
BE6039-11
3436i SF6 Detector
LumaSense Technologies A/S
Page 83 of 194
Chapter 7
______________________________________________________________________
Limit: enables you to define the gas concentration that will trigger
the alarms. The acceptable values are shown in Table 7.7.
Select limits: this defines the concentration level when the alarm
is triggered. This parameter must be defined.
Table 7.7 The range of acceptable values and default value of the alarm
limit for the gases
Display Text
Acceptable Values
GAS A HIGH ALARM LIMIT 1
n _____PPM
GAS A HIGH ALARM LIMIT 1
n _____mg/m3
0-1000000ppm
n = A to W
Depends on the molecular
weight of the gas
Default
Value
Blank
Blank
The Rolling Average option enables you to prevent the alarm
being triggered by sudden, small fluctuation in the gas
concentrations by using values, which are averaged over a defined
period of time. The averaging time is defined in minutes. The
acceptable values are: 1 to 999 mins, and the default value is 10
mins.
Action: this provides you with 3 ways to trigger the alarm. One or
more of the options can be selected simultaneously.
-Monitor Beep: when an alarm is triggered the monitor makes a
beeping noise.
Monitor Relay 1 & Monitor Relay 2: selecting these options
enable you to connect the alarms to a variety of either audio (for
example, a siren) and/or visual (for example a flashing light)
alarm systems.
Active Alarms: only the gases, which you have selected and
activated, are shown in this field.
7.2.1
Measurement Set-up – Stand-alone Use
The philosophy of the instructions is described in Chapter 3.
To enter the Set-Up Tree, press SET-UP and the monitor displays
the following screen text.
_____________________________________________________________________________
BE6039-11
3436i SF6 Detector
LumaSense Technologies A/S
Page 84 of 194
Chapter 7
______________________________________________________________________
MEASUREMENT
1.
SELECT SET_UP BRANCH
FORMAT
CONFIGURATION
Press S1 to enter the MEASUREMENT branch. The new text
displays two branches.
Monitoring Task branch
2.
Press S1 to enter the Monitoring Task branch.
The following text is displayed:
MONITORING TASK SET-UP NUMBER
PRESS ENTER TO CHANGE VALUE
1
3.
Up to 10 different monitoring tasks can be defined here. These
are labelled from 1 to 10. Use the direction push-buttons to
select the desired set-up number and move on to the next
display.
4.
Use the select push-buttons to define if you want to sample
continuously:
If you select No (S1), go to step 5.
If you select Yes (S3), go to step 6.
5.
The sampling interval is displayed. Use the direction pushbuttons to change it to the correct value.
6.
Use the select push-buttons to define if you want to monitor for
a pre-set period:
If you select Yes, go to step 7.
If you select No, go to step 8.
7.
The monitoring period is displayed. Use the direction pushbuttons to change it to the correct value.
The MONITORING PERIOD is entered as Days Hours: Minutes.
For example, if this particular measurement cycle needs to be
performed during 5 days, 14 hours and 30 minutes, the
“monitoring period” should be “entered” as 5 14:30. The Monitor
_____________________________________________________________________________
BE6039-11
3436i SF6 Detector
LumaSense Technologies A/S
Page 85 of 194
Chapter 7
______________________________________________________________________
will then automatically stop monitoring 5 days, 14 hours and 30
minutes after the measurement cycle with this particular set-up
number is started. The range of acceptable values and the default
value of the monitoring period is shown in Table 7.8.
Table 7.8 The range of acceptable values and the default value of the
monitoring period
Display Text
ENTER MONITORING
PERIOD
Acceptable Values
days
hours: minutes
0 00:01 to 7 00:00
Default Value
days
hours: minutes
0 01:00
The Monitor’s Display Memory has finite storage capacity. The
data storage time available depends upon the number of gases
being measured, as well as the frequency with which
measurements are performed (that is, the sampling interval).
Section 8.3 provides information about how you can roughly
calculate the length of time the data from a particular monitoring
task can be stored in the Display Memory.
It is important to realise that once the Display Memory has been
filled up by the results of a particular monitoring task, the results
of any further measurements in the same monitoring task will
start to overwrite the data already stored in the memory.
8.
Use the select push-buttons to define
compensate for water vapour interference.
if
you
want
to
9.
Use the select push-buttons to select the filters/gases you want
to measure.
10.
Use the select push-buttons to define if you want to measure
water vapour.
11.
Use the select push-button to define if you want to store the
measurement history.
When step 11 is completed the display returns to the top of the
branch.
SELECT MEASUREMENT SET-UP BRANCH
MONITORING TASK
ENVIRONMENT
_____________________________________________________________________________
BE6039-11
3436i SF6 Detector
LumaSense Technologies A/S
Page 86 of 194
Chapter 7
______________________________________________________________________
Environment branch
12.
Press S3 to enter the Environment branch.
13.
Use the select push-buttons to select the desired flushing
mode.
If you select Auto, go to step 16.
If you select Fixed Time, go to step 14.
14.
Use the direction push-buttons to define the Chamber Flushing
Time.
15.
Use the select push-buttons to select Tube Flushing.
If you don’t want tube flushing, select NO and go to step 17.
If you select tube flushing, use the direction push-buttons to
define the flushing time and go to step 17.
16.
Use the direction push-buttons to select the desired sample
tube length and move on to the next display.
17.
Use the direction push-buttons to select the desired
normalization temperature.
See section 7.1 for details about the normalization options.
When step 17 is completed, the display returns to the top of the
MEASUREMENT branch.
Press to go to the top of the Set-up Tree.
If you want measurement data presented as averaged concentration
values, then go to step 19. If you want your measurement data
presented as sample concentration values, then press SET-UP to
exit the set-up function.
Format branch
If you are starting here, press SET-UP:
18.
Press S2 to enter the FORMAT branch.
19.
Use the direction push-buttons to enter the correct averaging
period.
20.
Use the select push-buttons to choose if you want to print each
gas.
If you select Yes, go to step 21.
If you select No, go to step 22.
_____________________________________________________________________________
BE6039-11
3436i SF6 Detector
LumaSense Technologies A/S
Page 87 of 194
Chapter 7
______________________________________________________________________
21.
Use the select push-buttons to choose which individual
parameters should be printed. Each time one of the select
push-buttons is pressed, the next parameter is displayed. This
step can be repeated up to 7 times, depending on the number
of filters installed.
22.
Use the select push-buttons to select the Text line Terminator.
23.
The text screen returns to the top of the set-up tree. Press
SET-UP to exit the set-up tree.
If you want to set Alarm limits for the measured gases, go to section
7.3.
7.3 Setting-up the Monitor’s Alarm Levels
The alarm limits of a gas are those concentrations of gas which
should activate any alarm relay connected to the Monitor via its back
panel “Alarm Relay” socket. There are two different alarm relays,
which function slightly differently. Details of these relays and the way
in which they function is described fully in section 5.5. The alarm
level parameters are found in the Filters branch of the Set-Up Tree.
Warning! If the UA number for any filter is changed here, then all
the calibration data for that filter will be lost and the filter will need
to be recalibrated.
1.
Press SET-UP S3 S3. The following text is displayed
CHECK AND/OR CHANGE SET-UP FOR FILTER A
NO
YES
2.
Use the select push-buttons to ignore this filter or to select this
filter if alarms are to be set.
3.
Press 5 times until the following text is displayed.
GAS A HIGH ALARM LIMIT 1 _________mg/m3
PRESS ENTER TO CHANGE VALUE
4.
Use the direction push-buttons to set the alarm concentration.
If you do not wish to activate the alarm function for a particular
gas, select the DEFAULT. This will “blank out” the alarm level
value for the gas and deactivate the alarm for that gas.
_____________________________________________________________________________
BE6039-11
3436i SF6 Detector
LumaSense Technologies A/S
Page 88 of 194
Chapter 7
______________________________________________________________________
GAS A HIGH ALARM LIMIT 2 _________mg/m3
PRESS ENTER TO CHANGE VALUE
5.
Repeat steps 2 to 4 to set the alarms for the other filters.
6.
Press SET-UP to exit the alarm set-up.
7.4 Starting a Monitoring Task
Monitoring tasks can be started in two ways. They can be started
immediately, or set to start at a pre-set time. The duration of the
monitoring sequence can also be determined. A monitoring task can
continue until it is stopped manually, or at a pre-set time.
When using the PC and the Online option, there are no limits to the
duration of a monitoring task. However, if the measurement results
are being stored in the monitor’s memory, the duration of the
monitoring task should be considered as there is only a finite amount
of memory in the monitor. See section 8.3 for full details about the
storage capacity of the monitor.
7.4.1
PC Use – using the Online Program7810 Application
SW
Please refer to user manual BE6027 for Application Software 7810 for
assistance to set-up start and stop a monitoring task.
7.4.2
Stand-alone Use – using the Front Panel Pushbuttons
Before a monitoring task is started, the set-up, as described in
section 7.2, must be completed:
Before any monitoring task is started, all data stored in the Monitor’s
Display Memory is removed (cleared). The Display Memory is where
the Monitor stores the results of all measurements while it is
performing a monitoring task. However, the data in Display Memory
can be copied into and stored in the Monitor’s Background Memory.
This operation is described in section 9.2.
When you start a new monitoring task the following warning is
displayed WARNING: DISPLAY MEMORY WILL BE DELETED to
remind you to store any data that is presently stored in the Display
Memory. If a monitoring task is stopped, any data already stored in
Display Memory will be deleted when a monitoring task is started.
1.
Press MEASURE.
The following text appears on the screen:
_____________________________________________________________________________
BE6039-11
3436i SF6 Detector
LumaSense Technologies A/S
Page 89 of 194
Chapter 7
______________________________________________________________________
ACTIVE TASK : MONITORING TASK NUMBER 1
START TASK
DELAYED TASK
CHANGE TASK
Please note: if you do not use one of the “select” keys within a
short time after the above text appears, the Monitor will
automatically stop operating in Measure mode (the light-emitting
diode in the MEASURE key switches off). If this happens, just press
MEASURE again.
The active monitoring task number is the number of the monitoring
task you wish the Monitor to perform.
2.
If the monitoring task number displayed is correct, then go to
step 5.
If the number on the display is not correct then press S3 to
change the task number.
This changes the display text to the following:
MONITORING TASK
3.
SELECT TASK
CALIBRATION TASK
Press S1.
This causes the following text to appear on the display:
MONITORING TASK SET-UP NUMBER 1
PRESS ENTER TO CHANGE VALUES
The number appearing on the screen will be a number from 1 to
10.
4.
Press ↵ and use the direction keys to change the monitoring
task number to the desired value. Then press ↵ again to accept
the task number.
The following text appears on the display screen:
_____________________________________________________________________________
BE6039-11
3436i SF6 Detector
LumaSense Technologies A/S
Page 90 of 194
Chapter 7
______________________________________________________________________
ACTIVE TASK : MONITORING TASK NUMBER 1
START TASK
DELAYED TASK
CHANGE TASK
5.
To start the measurement immediately, press S1.
To delay the start, press S2.
The following warning then appears on the display:
WARNING : DISPLAY MEMORY WILL BE DELETED
PROCEED
STOP
1.
Press S1.
Delayed Start
If you selected a delayed start, the following text is displayed:
START TIME :
1 00 : 00
PRESS ENTER TO CHANGE VALUE
Use the direction push-buttons to enter the desired date and start
time, e.g. 10 16:25. The following text is displayed.
ACTIVE TASK : MONITORING TASK NUMBER 1
TASK WILL START AT : 10 16 : 25
TIME 16 : 00
When the monitoring task starts, the screen will change and
display the same messages as those displayed when a monitoring
task starts immediately.
_____________________________________________________________________________
BE6039-11
3436i SF6 Detector
LumaSense Technologies A/S
Page 91 of 194
Chapter 7
______________________________________________________________________
Immediate Start
If you selected an immediate start, the following text appears on
the screen:
MEASUREMENT IN PROGRESS
RESULTS NOT YET AVAILABLE
2.
When the first measurement cycle is complete the Monitor will
automatically display the results and update them every time a
new measurement cycle is completed. An example is shown
below:
A : 4.52 E + 01
D : __________
B :__________
E : __________
C : _________
W : 8.33 E + 00
This display gives the overview of the gas/vapour concentrations last
measured – in this case the concentration of gas A and humidity of
the water vapour are in the units that were selected – that is mg/m3
for gas A and Tdew for water vapour (see section 4.3.2).
If no pre-set monitoring period is defined, then to stop the
monitoring task, press MEASURE and S3.
_____________________________________________________________________________
BE6039-11
3436i SF6 Detector
LumaSense Technologies A/S
Page 92 of 194
Chapter 8
______________________________________________________________________
Chapter 8
Viewing Measurement Data –
Using the Monitor
April 2015
_____________________________________________________________________________
BE6039-11
3436i SF6 Detector
LumaSense Technologies A/S
Page 93 of 194
Chapter 8
______________________________________________________________________
8.1 Displayed Monitoring Task Data
When the Monitor is switched on, but not being operated in any
mode, the screen display text identifies the data stored in its Display
Memory, by displaying the day and time of the first stored
measurement cycle of the monitoring task, as well as the day and
time of the last measurement cycle of the monitoring task. For
example:
DATA IN DISPLAY MEMORY RECORDED FROM
2014-01-16 09:50 TO 2014-01-16 10:04
If the Monitor has just been fully reset then the display will just
show the current time and report that the monitor is ready for use.
The Set-up parameters describing a monitoring task and the
measurement data collected during the task are stored as a list in
the Display Memory. You can scroll through the set-up parameters as
well as the data collected during the task by using the direction
push-buttons, to scroll “vertically” downwards, and to scroll
“vertically” upwards through the list. Fig.8.1 illustrates how the data
is organised:
Identification of Measurements:
This screen provides the date and time of the first and last
measurement results, which are stored in Display Memory.
Identification of Each Monitored Gas:
This display identifies the gases monitored during the task. By using
the push-button, one can find the names of all the gases, which
were monitored during the displayed task.
Statistical Analysis of Measurement Results for Each Gas:
Using the individual measured gas concentration stored in Display
Memory, when Store Measurement History is selected, a statistical
analysis is performed which provides a summary of the stored
measurement results. The MAX (maximum), MIN (minimum) gas
concentrations are displayed, and the µ (Mean or Linear Average)
and σ (Standard Deviation) values are calculated and displayed. A
description of these statistical terms can be found in section 8.2.1.
During the performance of a monitoring task the statistical analysis is
updated constantly.
List of Individual Measurement Results:
Each of these displays provide the date and time each measurement
cycle was performed and the concentration of the gas whose name
appears on the screen. In some cases an asterisk (*) will be shown
alongside the gas/vapour concentration. When such an asterisk is
_____________________________________________________________________________
BE6039-11
3436i SF6 Detector
LumaSense Technologies A/S
Page 94 of 194
Chapter 8
______________________________________________________________________
shown, press the INFO button. Text will appear on the screen to
indicate why this particular measurement has been marked.
The number which is shown on the display – between time and
concentration – is only “filled-in” after completion of a monitoring
task. The number indicates the order in which the measurements
were made. The “oldest” stored measurement is always given the
number 1 and the following measurements are numbered sequentially.
Overview of the Monitoring Task:
These displays provide an overview of the monitoring task set-up
parameters.
Start of the Monitoring Task:
The Display Memory has a finite size and therefore, if a monitoring
task runs for a long period of time, it will fill up all available memory
space, and data collected after the memory has been filled-up will
start to overwrite the data collected during the start of the
monitoring task. Some measurement results will therefore be lost
from the memory. In such a situation the date and time appearing
after MONITORING TASK STARTED….. will not be the same as the
first date and time displayed on the screen labelled 1 in Fig.8.1.
Using the direction push-buttons and the average push-button, users
can scroll through each “page” of stored data and, in addition,
average gas concentrations over a pre-defined averaging period. The
functions of the push-buttons are described fully in Chapter 5 and
can be summarized as follows:
AVERAGE
When this push-button is pressed the 3436i will
average the measurement results which are stored
in its Display Memory over the period of time
Averaging Period specified in the FORMAT
branch of the Set-up “tree” (see section 7.2).
When the averaging function is operative (the LED
above the push-button is lit) only averaged
measurement results are shown on the 3436i’s
display. These averaged measurements may also
be printed out while the averaging function is
operative. It is important to realise that when the
averaging function is switched off the original
measurement results will be shown again on the
display. An example of averaged measurements is
given in section 7.2.
_____________________________________________________________________________
BE6039-11
3436i SF6 Detector
LumaSense Technologies A/S
Page 95 of 194
Chapter 8
______________________________________________________________________
Fig.8.1
Organisation of monitoring-task data displayed on the
monitor’s screen.
_____________________________________________________________________________
BE6039-11
3436i SF6 Detector
LumaSense Technologies A/S
Page 96 of 194
Chapter 8
______________________________________________________________________
&
Using these push-buttons users can scroll “horizontally”
through any vertical level of data. For example, if the statistical
analysis of the measurement results for water-vapour are displayed
on the screen, then by using you can read the statistical analysis
of the measurement results for gas A,W and then go back to the
original display (see Fig.8.1).
EVENT
This push-button can be used (pressed) to mark
the measurement being performed at the time at
which a special event occurred during a monitoring
task. Any such measurement will appear on the
display with an asterisk alongside it. By pressing
INFO when such a display is seen you can display
what the asterisk indicates. Section 8.2.2 shows
the display which appears when INFO is pressed
and explains all the symbols used. Marked events
are also shown on print-outs and of monitoring
task data (see section 8.2.3).
This push-button allows the user to scroll
“vertically” downwards through the list of
measurement results (see Fig.8.1).
This push-button allows the user to scroll
“vertically”
upwards
through
the
list
of
measurement results. The measurement list is a
closed loop.
The push-buttons and have a repetitive function, which means
that if they are pressed continuously they will allow the user to scroll
very quickly through a list.
8.1.1
Processing Measurement Data
Gas measurement data stored in Display Memory can be processed
in the following way:
•
8.1.2
It can be processed to produce Time-weighted Average (TWA)
concentrations of gases over any user-defined period of time.
Obtaining Time-weighted Average (TWA) Values
By
using
the
AVERAGE
button
Time-weighted
Average
concentrations (CTWA) of all the monitored gases can be obtained
over any user-defined period of time (T hours). The following steps
are involved:
1. Press SET-UP and S2.
_____________________________________________________________________________
BE6039-11
3436i SF6 Detector
LumaSense Technologies A/S
Page 97 of 194
Chapter 8
______________________________________________________________________
2. “Enter” the period of time required for averaging – this could for
example be 8 hours if you are interested in finding out whether
the 8 hour Time Weighted Average concentration of gases are in
compliance with National Occupational Exposure Limits; or,
alternatively, the averaging period could be 15 minute TimeWeighted Average if you are interested in finding out whether the
Short Term Exposure Limit (STEL) of the gases complies with
National Occupational Exposure Limits.
3. Press SET-UP and then AVERAGE.
When steps 1 to 3 are complete, scroll through the measurement
results displayed on the screen (Display Memory). Notice that all
measurements have been averaged over the chosen averaging
period. A detailed example is given in section 7.2.
8.1.3
How Time-weighted Averages are Calculated
In order to explain how the 3436i averages gas measurements over
a fixed user-defined “averaging period”, let us suppose that a
particular gas has been monitored continuously and that its
measured concentration was C1 during the first sampling interval T1
min, C2 during the second sampling interval T2 min…. Cn during the
nth sampling interval Tn min (see Fig.8.2). Suppose that you wished
the 3436i to calculate the Time-weighted average (TWA) over a
period of time = T min.
Fig.8.2 Illustration of a monitoring task
The Time-weighted average of these measurements over the
averaging period of T min is calculated using the following
mathematical equation:
_____________________________________________________________________________
BE6039-11
3436i SF6 Detector
LumaSense Technologies A/S
Page 98 of 194
Chapter 8
______________________________________________________________________
n= N
∑ (C )
n
= linear average of all the measurements made during
N
the averaging period.
CTWA =
n =1
Where:
Cn = constant concentration measured at time Tn;
N = the total number of measurements performed during
the averaging period T min.
In the situation where the total monitoring period is the same as the
averaging period then the averaged value of the last performed
measurement will be the same as the Mean Value (µ) shown on the
display screen (see 3 in Fig.8.1).
8.2 Printed Monitoring Task Data
Fig.8.1 illustrates how data from a monitoring task is displayed on
the Monitor’s screen. When monitoring task data appearing in Display
Memory is printed out, the same information appears but it is
presented in a different format. An example of a monitoring task
data print-out is shown in Fig.8.3 – Chapter 10 describes how this is
done.
Fig.8.3 Print-out of monitoring task data
_____________________________________________________________________________
BE6039-11
3436i SF6 Detector
LumaSense Technologies A/S
Page 99 of 194
Chapter 8
______________________________________________________________________
8.2.1
Statistical Analysis Terms
In the statistical analysis of the measurement results for each gas
(see 3 in Fig.8.1) the following statistics appear:
The Mean Value (µ) – this is the linear average of all
measurements of a gas taken during the total monitoring period.
The calculation of “the mean value” can be expressed
mathematically as follows:
n= N
The Mean Value = µ =
Where: N
=
cn
=
∑ (C )
n
n =1
N
measurement cycles performed during the
monitoring period (T) between the cursors.
gas concentrations (where n = 1 to N)
The Standard Deviation (σ) – this is the standard deviation of a
particular gas’s measurements from the mean value (µ) of this
gas. Standard deviation can be expressed mathematically as
follows:
n= N
The Standard Deviation = σ =
Where: µ=
Cn
=
N
=
8.2.2
∑ (Cn − µ )
2
n =1
N −1
the mean value
individual gas concentrations
total number of measurements
Symbols used in Displayed Measurement Data
If an asterisk (*) appears on the display alongside any gas
concentration, it indicates that something happened during the
measurement. You can find out what the asterisk indicates by
pressing the INFO button. The following display appears for a short
period of time:
GAS X: COMMON MARK: PEOW
EVENT NO: xxxx
GAS MARK: BFA
TIME: hh:mm
_____________________________________________________________________________
BE6039-11
3436i SF6 Detector
LumaSense Technologies A/S
Page 100 of 194
Chapter 8
______________________________________________________________________
“EVENT NO” will appear on the screen only if the Event Mark button
was used during the monitoring task. In this case the letter “E” will
also appear as a Common Mark. The symbols which can appear after
the text COMMON MARK and GAS MARK are listed below with a
short explanation of what they mean:
Common Marks:
“P”
(1) The Monitor stopped measuring due to a power
failure but has automatically re-started the
monitoring task again after regaining power;
(2) The Monitor has been “reset” either because of
a detected fault or because RESET was pressed.
“E”
The measurement has been marked by the User.
“O”
This symbol indicates that an operational error was
detected during this measurement. The accuracy of
such a measurement cannot always be guaranteed.
“W”
This symbol indicates that a warning was detected
during this measurement. The accuracy of such a
measurement cannot always be guaranteed.
Gas Marks:
8.2.3
“B”
The Monitor was incapable of calculating this gas
concentration.
“F”
After this measurement the filter carousel was
found to be out of alignment. If the carousel was
only slightly out of alignment then the accuracy of
the measurement has not been affected. The accuracy of such a measurement cannot always be
guaranteed.
“A”
The gas concentration measured during this
measurement cycle was found to exceed the userdefined alarm limit for this gas.
Symbols Used in Print-outs of Measurement Data
Displayed measurements marked with the COMMON MARKS “O”
and “W”, and the GAS MARKS “A” and ”F”, are printed-out with an
“X” symbol. However, any displayed measurements marked with the
COMMON MARKS “P” and/or “E”, and the GAS MARK “B” are not
printed-out with these symbols. These measurements are marked in
a different way:
_____________________________________________________________________________
BE6039-11
3436i SF6 Detector
LumaSense Technologies A/S
Page 101 of 194
Chapter 8
______________________________________________________________________
Common Marks:
The symbol “P” is replaced by the text “3436i Restarted”. This
indicates that the Monitor stopped and then started-up again
sometime between the previous sample time and the time which
appears alongside this message.
The symbol “E” is replaced by the text User Event NumberX: This
indicates that the EVENT button was pressed while this measurement
cycle was being performed. The number indicates the total number of
“events” which have been marked during this monitoring task, at the
time this sample was taken.
Gas Marks:
The symbol “B” is replaced by a straight line (_______) which
indicates that the Monitor was unable to calculate the concentration
of the named gas in this sample.
Other Marks Used:
……This symbol indicates either: (1) that this gas was not measured;
or (2) that this gas was not selected to be printed out (see section
10.5).
8.3 Storage Space in the Display Memory
The total space available in the Display Memory to store data is
131072 measurement cycles. Depending on the time for one
measurement cycle the capacity will be as follows.
If a measurement cycle in which gas A and water vapour are
measured with continuous sampling takes 15s, then the Display
memory space will be 546 hours = 22 days.
The Monitor will overwrite the oldest stored measurement data when
the Display memory is full. This is done by deleting data in blocks of
2048 measurement cycles.
For further information regarding measurement cycles see chapter 4.
_____________________________________________________________________________
BE6039-11
3436i SF6 Detector
LumaSense Technologies A/S
Page 102 of 194
Chapter 9
______________________________________________________________________
Chapter 9
Storage of Data in the Monitor’s Memory
April 2015
_____________________________________________________________________________
BE6039-11
3436i SF6 Detector
LumaSense Technologies A/S
Page 103 of 194
Chapter 9
______________________________________________________________________
In order to fully understand the functioning of the Monitor it is
necessary to know something about the different types of memory
the Monitor uses, the kind of data stored in each type of memory,
and how this data is affected by the various operations performed by
the Monitor.
Offline users may find the information in this chapter of interest as
their measurement data is stored in the Monitor’s memory before
being uploaded to the PC.
9.1 Types of Memory in the Monitor
The Monitor has three types of memory:
1. A Read Only Memory (ROM);
2. An Electrically Erasable Programmable Read Only Memory
(EEPROM), which we have named the Source Memory;
3. A Random Access Memory (RAM) which we have named the
Working Memory.
9.1.1
Read Only Memory (ROM)
Data stored in this memory cannot be changed by the user. The
Optical Filter Factors, which describe each of the optical filters,
which are available for installation in the Monitor, are stored in this
memory. These factors are listed in a print-out of the “Calibration
Data Block” (see section 10.7).
When optical filters are installed in the carousel wheel, the Monitor
must be informed about:
•
•
Which filters have been installed in its carousel (UA numbers of
the filters);
and
Where they have been installed (position “A” – “E” of the
carousel – see section 12.3.3).
This information allows the Monitor to read the correct optical filter
factors from its ROM memory when the filter is installed. As these
factors are used in the calculation of calibration factors, it is vitally
important that this information is correctly entered before
calibration is performed.
9.1.2
Source Memory (EEPROM)
The data stored in Source Memory is not lost if A.C. mains power is
removed from the Monitor. There are three blocks of data in the
Source Memory (see Fig.9.1):
_____________________________________________________________________________
BE6039-11
3436i SF6 Detector
LumaSense Technologies A/S
Page 104 of 194
Chapter 9
______________________________________________________________________
Block 1 – contains
calibration
factors
and
3
optical-filter
parameters
Block 2 – contains 3 of the 6 set-up parameters found under the
Filters branch of the set-up “tree”
Block 3 – contains all other parameters in the Set-Up Tree
Block 1 – Calibration Factors and 3 Optical-filter Parameters:
There are six different “data files” in this block. Each data file is
denoted by a letter, which indicates the position a particular optical
filter occupies in the Monitor’s carousel. Each file “A” to “E” is divided
into five sections called Filter Banks, which are numbered from 1 to
5. The water-vapour filter is only capable of measuring water-vapour
and therefore its data file (“W”) is not divided into different filter
banks.
Each Filter Bank contains the following data:
1. The name of the gas used during span calibration of the filter.
2. The molecular weight of the gas used during span calibration.
3. The alarm limits for the gas. (High Alarm Limit 1, High Alarm Limit
2).
4. A Concentration offset factor:
calibration of the filter.
obtained during zero-point
5. A Humidity gain factor:
obtained
interference calibration of the filter.
during
a
humidity-
6. A Conversion factor: obtained during the span calibration of the
filter with the gas named in point 1 above.
7. Cross-interference calibration factors: obtained during crossinterference calibration (not valid for 3436i only one optical filter
is installed).
_____________________________________________________________________________
BE6039-11
3436i SF6 Detector
LumaSense Technologies A/S
Page 105 of 194
Chapter 9
______________________________________________________________________
Fig.9.1
Schematic diagram showing the structure of the Monitor’s
memory
Before calibrating a particular filter, one of the filter’s banks is made
active (by operating the Monitor in Set-Up mode and “entering” the
chosen filter-bank number for the filter being calibrated). The filter
bank No. which is made active before the filter is calibrated, is the
filter bank where the Monitor will store calibration factors calculated
during calibration. This means that the user is able to calibrate any
particular optical filter to measure up to five different gases.
If a particular filter is to measure more than one gas, it is therefore
necessary to span calibrate it with each of the gases it is to
measure. For example, if you refer to the “Gas Detection Limits”
wall chart you will see that the filter UA 0936 can be used to measure
1
Sulphur hexafluoride
The filter UA 0936 is installed in position “A” of the filter carousel to
measure the above gas. Before this filter is calibrated, the Monitor
has to be told where to store the calibration factors which are
calculated during the calibration procedure. This is done by selecting
a FILTER BANK NO. – in the active set-up for Filter A each time the
_____________________________________________________________________________
BE6039-11
3436i SF6 Detector
LumaSense Technologies A/S
Page 106 of 194
Chapter 9
______________________________________________________________________
filter is calibrated. For example, Filter Bank No.”1” for storage of the
calibration factors for Sulphur hexafluoride.
After calibration of the filter UA 0936 the Monitor is able to
accurately monitor the gas mentioned. By selecting the correct
FILTER BANK NO. in the set-up of the Monitor before a monitoring
task is started, the user determines which calibration factors will be
used during the task. For example, when Filter Bank No.”1” is
entered in the active set-up for filter UA 0936 in position ”A”, the
Monitor reads the calibration factors from file “A1” into its Working
Memory .
Block 2 – Optical Filter Set-up Parameters:
This block contains 3 of the 6 parameters, which describe the optical
filter installed in each position of the filter carousel:
UA number of the filter;
Filter bank number;
S.I.T. information;
If any of the above-listed parameters are changed in the active setup they are also automatically changed in the Source Memory.
Block 3 – Other Set-Up Parameters:
This block of data contains all set-up parameters except the optical
filter parameters. Before leaving the factory the parameters in this
block are given factory-set values. These are the values obtained for
a parameter when the Default button is pressed.
9.1.3
Working Memory (RAM)
The Working Memory is a “volatile” memory, that is, data will be
lost from it if electric power is removed from the Monitor. When the
Monitor is not connected to a mains power supply a lithium battery in
the Monitor provides a back-up power supply to protect the data in
this memory. When this battery is no longer providing enough power
a warning BACK-UP BATTERY TOO LOW will appear on the
Monitor’s display to indicate that the battery needs to be replaced by
a new one.
There are four different blocks of data in the Working Memory (see
Fig. 9.1):
Block 1 – contains only calibration factors and 3 optical-filter
parameters from the active “Filter Bank”.
_____________________________________________________________________________
BE6039-11
3436i SF6 Detector
LumaSense Technologies A/S
Page 107 of 194
Chapter 9
______________________________________________________________________
Block 2 – contains 2 of the 5 optical filter parameters with values
which are the same as those found in Block 2 of the
Source Memory.
Block 3 – contains all other set-up parameters (i.e. excluding the
optical filter parameters) with active set-up values.
Block 4 – contains data collected during the performance of a
monitoring task. This data block is named the Display
Memory because this data is displayed on the Monitor’s
screen while a monitoring task is being performed.
Block 5 – this block contains measurement data, which was copied
into it from the Display Memory. This block is called
Background Memory because the data stored in it cannot
be accidentally deleted.
Block 1 – Calibration Factors and 3 Optical-filter Parameters
from the Active Filter Bank:
If, one optical filters are installed in the Monitor and the UA0936
have been entered in the active set-up and Filter Bank No.1 has
been selected for filter “A”; then only calibration factors from filter
banks A1 and W will be stored in this block of data (see Fig. 9.1).
The name, molecular weight and alarm limits of each gas will also be
stored in this block.
Block 2 – Optical Filter Set-up Parameters:
Whenever the optical filter’s active Filter Bank Number is changed,
the same values are automatically read into Block 2 of the Source
Memory.
Block 3 – Other Set-up Parameters:
The active set-up values are those values, which are underlined by a
cursor on the display screen of the Monitor when it is operated in
Set-Up mode.
Block 4 – Measurement Data:
Whenever the Monitor performs any operation, which results in data
occupying the Display Memory, the data already stored there will be
deleted. To reduce the risk of accidental losing data from Display
Memory, a warning "WARNING: DISPLAY MEMORY WILL BE
DELETED” is displayed whenever a user attempts to perform an
operation with the Monitor, which will result in the deletion of data
from Display Memory.
Data in Display Memory can be copied into the Monitor’s Background
Memory (see Block 5 below) to protect it against accidental deletion.
_____________________________________________________________________________
BE6039-11
3436i SF6 Detector
LumaSense Technologies A/S
Page 108 of 194
Chapter 9
______________________________________________________________________
Alternatively, the data in Display Memory can be printed out by
connecting a printer to the Monitor and transmitting data via the RS
232 interface port of the Monitor (see Chapter 10).
The storage space in Display Memory is finite. Once this memory has
been filled by data from a monitoring task any additional data
collected will start to overwrite some of the data already stored
there.
Block 5 – Stored Measurement Data:
By selecting to STORE data when the Monitor is operating in
Memory mode the user can copy data from Display Memory into
Background Memory to “protect” data against accidental deletion
from the Display Memory (see section 9.3.1 for further details).
The storage space in Background Memory is finite and is exactly the
same size as the storage space available in Display Memory (see
section 8.3 for further details).
Data which has been stored in Background Memory can be recalled
to the Display Memory. This is done by operating the Monitor in
Memory mode and selecting to RECALL data (see section 9.3.2).
When data is “recalled” to Display Memory it is not transferred from
Background Memory to Display Memory, it is only copied into
Display Memory so there is no risk of losing it. In Display Memory the
user can scroll through the data.
Data stored in Background Memory can be deleted by operating the
Monitor in Memory mode and selecting to DELETE data (see section
9.3.3).
9.1.4
Effect of a Calibration Task on the Monitor’s Memory
Before calibration of the optical filters in the Monitor the UA number
of the installed filter is “entered” into the active set-up of the
Monitor. This enables the Monitor to find a set of numerical
parameters, which describe the optical filter (this information is
found in the Read Only Memory of the Monitor). These numerical
parameters are called Optical Filter Factors.
During a CALIBRATION TASK the Monitor uses the Optical Filter
Factors to calculate the calibration factors for the installed optical
filter. As explained in section 9.1.2, by “entering” a Filter Bank No. in
the active set-up before calibration of the particular filter with the
particular gas, each filter can be calibrated to measure up to five
different gases and the filter bank number tells the Monitor exactly
_____________________________________________________________________________
BE6039-11
3436i SF6 Detector
LumaSense Technologies A/S
Page 109 of 194
Chapter 9
______________________________________________________________________
where (in the Source Memory) to store the calibration factors
calculated during the calibration task.
Fig.9.2 The state of the Source Memory after completion of a
CALIBRATION TASK
After completion of a calibration task the calibration factors, which
are found in the Working Memory, are entirely dependent upon the
Filter Bank No., which is active for the optical filter. If Filter Bank
No. 1 is active for the filter in positions “A” then calibration factors
from files A 1, W will be found in Working Memory (see Fig 9.2).
9.1.5
Effect of Changing the UA number in the “Active”
Set-up
WARNING!: Changing the UA number of the filter in the Monitor’s
active set-up will destroy all calibration data for the filter.
As explained in section 9.1.1, the UA No. determines the set of
Optical Filter Factors used during the calculation of calibration factors
and therefore, if the UA number of the filter is changed in the active
set-up of the Monitor, all calibration data related to the optical filter
has been removed from the set-up is automatically deleted from
both the Source Memory and the Working Memory as it is no
longer valid.
_____________________________________________________________________________
BE6039-11
3436i SF6 Detector
LumaSense Technologies A/S
Page 110 of 194
Chapter 9
______________________________________________________________________
Fig.9.3
Effect of changing a UA number in the “active” set-up
For example, if the UA number of the filter installed in position “A” of
the filter carousel is changed in the active set-up then calibration
factors are deleted from the active file “A” in the Working Memory
and from files A 1, A 2, A 3, A 4 and A 5 in the Source Memory of
the monitor (see Fig.9.3). The Monitor will not be able to measure
any gas with filter “A” until it has been fully calibrated, see Chapter
12 for details.
9.1.6
Effect of a Full Reset on the Monitor’s Memory
A FULL RESET of the Monitor changes the data stored in its
Working Memory as follows:
1. All data stored in Display Memory and Background Memory is
deleted.
2. Values of the Optical Filter Set-up Parameters in Block 2 of The
Source Memory are copied into Block 2 of the Working Memory.
3. The active values of the other set-up parameters in Block 3 of the
Working Memory are replaced by the factory-set values defined
in Block 3 of the Source Memory.
_____________________________________________________________________________
BE6039-11
3436i SF6 Detector
LumaSense Technologies A/S
Page 111 of 194
Chapter 9
______________________________________________________________________
4. The active values of the Optical Filter Parameters in Block 2 of
the Working Memory are replaced by the values of the optical
filter parameters in Block 2 of the Source Memory. Note that
under normal circumstances the data in these blocks is the same.
However, to ensure that the data in these blocks is the same,
data is read from Source memory into the Working Memory
during a FULL RESET of the Monitor.
5. Those Filter Bank Nos. which have been made active determine
the calibration factors which will be found in Block 1 of the
Working Memory after a FULL RESET of the Monitor. If, for
example the active Filter Bank No. chosen for all the filter “A” is
no. 1, then only the calibration data in files A 1; and W will be
found in the Monitor’s Working Memory after a FULL RESET.
This example is illustrated in Fig.9.4.
Fig.9.4
The state of the Working Memory after a FULL RESET
9.2 Storage of Measurement Results
While a monitoring task is being performed measurement data is
stored in the Monitor’s Display Memory. When the monitoring task is
complete the data in Display Memory is normally copied into the
_____________________________________________________________________________
BE6039-11
3436i SF6 Detector
LumaSense Technologies A/S
Page 112 of 194
Chapter 9
______________________________________________________________________
Monitor’s Background Memory to prevent it from being overwritten
(and therefore lost) by measurement data stored during the next
monitoring task. The same amount of data can be stored in both the
Background Memory and the Display Memory.
Structure of the Background Memory:
The data from a maximum of 10 monitoring tasks can be stored in
the Background Memory provided the total amount of data from the
10 tasks does not exceed the total capacity of the Background
Memory. Each monitoring task stored in the Background Memory is
given a “location number” (from no. 1 to no. 10). The size of each
location is flexible and is equal to the space required to store all the
data collected during a monitoring task. Each monitoring task stored
will occupy at least 2% of the total Memory capacity.
If data from a single monitoring task totally occupies the Display
Memory, then this data can be stored in Background Memory
provided that no data is already stored there. The data will occupy
only one location of Background Memory and fill all available storage
space. Therefore, it will not be possible to store any data from any
new monitoring task in Background Memory unless the data already
stored there is first deleted (see section 9.3.3).
To illustrate the variable size of each location let us suppose that the
following monitoring tasks are performed:
Task No. 1:
The data collected in Display Memory occupies 20%
of the total capacity of the Display Memory. The data
can be stored in Background Memory provided that
the data already stored there occupies less than
80% of the total capacity of the Background
Memory. However, let us suppose that the
Background Memory is empty and that we STORE
the data from this monitoring task in location 1 of
Background Memory. This means that Background
Memory is now 20% full (see Fig.9.5).
Task No. 2:
The collected data occupies 30% of the total capacity
of the Display Memory. Let us suppose that we
STORE the data in location 2 of Background
Memory. This means that Background Memory is
now 50% full (see Fig.9.5).
Task No. 3:
The data occupies 40% of the total capacity of the
Display Memory. Let us suppose that we STORE the
data from this task in location 3 of Background
Memory. Background Memory is now 90% full (see
Fig.9.5).
_____________________________________________________________________________
BE6039-11
3436i SF6 Detector
LumaSense Technologies A/S
Page 113 of 194
Chapter 9
______________________________________________________________________
Task No. 4:
The data occupies 10% of the total capacity of the
Display Memory. Let us suppose that we STORE the
data from this task in the Background Memory – let
us say it is stored in location 4. Background Memory
is now 100% full (see Fig.9.5).
The Background Memory has now been filled-up by the data from the
four monitoring tasks described above, even though location nos. 5 –
10 (inclusive) has not been used. The user will not be able to STORE
any more data in Background Memory because there is no space
available for it. Data in Background Memory can, however, be
deleted to make space for the storage of new measurement results
(see section 9.3.3).
Fig.9.5 Storing data from 4 different consecutive measurement tasks
in the Background Memory.
_____________________________________________________________________________
BE6039-11
3436i SF6 Detector
LumaSense Technologies A/S
Page 114 of 194
Chapter 9
______________________________________________________________________
Whenever the Monitor is operating in Memory mode the user can, by
pressing the INFO push-button, find out what percentage of the
Background Memory is occupied and which location numbers have
been used to store data. Fig.9.5 illustrates the status information one
can obtain from the Monitor during various stages of the four
monitoring tasks described above. Further information about the
INFO push-button can be found in section 9.3.4.
9.3 Management of Data in Background Memory
The monitor has to be operated in Memory mode by pressing the
MEMORY push-button. The following text appears on the screen:
STORE
9.3.1
SELECT MEMORY FUNCTION
RECALL
DELETE
Storing Data in Background Memory
When data is to be copied from Display Memory into Background
Memory:
Press S1
LOCATION NUMBER 1
PRESS ENTER TO CHANGE VALUE
If some data has already been stored in the Background Memory and
you cannot remember which locations have been occupied (used),
press the INFO push-button to find out which locations are occupied
and what percentage of the Background Memory has been used (see
section 9.3.4). Use the direction keys to select the desired location
number. When the chosen location number is on the screen, press
S2 to accept the position.
Press Memory to exit.
_____________________________________________________________________________
BE6039-11
3436i SF6 Detector
LumaSense Technologies A/S
Page 115 of 194
Chapter 9
______________________________________________________________________
9.3.2
Recalling Data from Background Memory
To recall data stored in Background Memory to Display Memory:
1. Press Memory S2.
LOCATION NUMBER 1
PRESS ENTER TO CHANGE VALUE
2. Use the direction keys to select the correct location number. The
following text is displayed.
WARNING : DISPLAY MEMORY WILL BE DELETED
PROCEED
STOP
3. If you want to continue, press S1, and the following text is
displayed.
LOCATION NUMBER 1
ACCEPT
RECALLED
If you want to Stop, press S3, this returns you to the original
display showing SELECT MEMORY FUNCTION so that you can
STORE any data which is stored in Display Memory as explained
in section 9.3.1.
4. Press S2. If data has not been stored in the chosen location, a
message will appear on the Monitor’s display to inform the user.
Otherwise, the data from the chosen location in Background
Memory will be copied into Display Memory.
5. Press MEMORY to exit.
_____________________________________________________________________________
BE6039-11
3436i SF6 Detector
LumaSense Technologies A/S
Page 116 of 194
Chapter 9
______________________________________________________________________
9.3.3
Deleting Data from Background Memory
To delete data which has been stored in Background Memory:
Press MEMORY S3.
LOCATION NUMBER 1
PRESS ENTER TO CHANGE VALUE
Use the direction keys to select the location number. After selecting
the chosen location number the display will show the starting-time of
the oldest data stored in the Background Memory:
If the starting-time of the oldest stored data to be deleted
corresponds with the starting-time shown on the display screen then
press S1 and then S2 to accept that the data will be deleted from
Background Memory.
9.3.4
Obtaining Information in Memory Mode
It is not necessary for the user to remember the numbers of the
locations in Background Memory which have been used to store data.
When the Monitor is operated in Memory mode, users can at any
time find out which locations are used, and what percentage of the
Background Memory’s total data capacity has been used by:
Pressing the INFO push-button:
LOCATION(S) USED : 1 - -3 –4 -5
-7 -9
53 % OF MEMORY USED
TIME 10 : 26
-10
The numbers appearing on the above display are those, which
contain stored data. The Monitor will show the above “Information
text” display for a short period of time and then automatically change
back to the text, which was showing on the display before the INFO
push-button was pressed
_____________________________________________________________________________
BE6039-11
3436i SF6 Detector
LumaSense Technologies A/S
Page 117 of 194
Chapter 9
______________________________________________________________________
9.3.5
Upload Memory data using the BZ7003 Offline
Software.
After recalling data stored in any of the background memories to the
display memory see section 9.3.2. The data now stored in the display
memory can be uploaded using the BZ7003 Offline Software and stored in
excel or text format files. Regarding the use of BZ7003 please refer to the
user manual BE6035.
_____________________________________________________________________________
BE6039-11
3436i SF6 Detector
LumaSense Technologies A/S
Page 118 of 194
Chapter 10
______________________________________________________________________
Chapter 10
Using a Printer with the Monitor
April 2015
_____________________________________________________________________________
BE6039-11
3436i SF6 Detector
LumaSense Technologies A/S
Page 119 of 194
Chapter 10
______________________________________________________________________
10.1
Introduction
This chapter informs you on how to obtain hard copies of data stored
in the memory of the monitor. This could, for example, be existing
calibration data, which you need prior to recalibrating.
For those of you who want to use the monitor as a stand-alone
instrument, this chapter enables you to print-out measurement data,
error-logs and data-logs. If any error occurs during any of these
operations, a warning will be displayed. All possible errors of this
kind are listed in Chapter 14.
The Monitor has four interface ports on its back panel, the RS-232,
port can be used for printing or the Ethernet port can be used to
print to a terminal program like HyperTerminal. This means that any
standard text printer with a RS232 interface can be used to print-out
data from the Monitor. Data can be printed out while the Monitor is
operating – using the Data-logging facility. This means that during
a monitoring task or during a calibration task the Monitor will
automatically send measurement results to the printer as soon as
they are available. Any operational errors or warnings that occur
during a monitoring task can also be automatically printed out using
the Error-logging facility. Alternatively, when the Monitor is not
being operated in any mode, data can be printed out using the
PRINT button. Data can be printed out in three different blocks:
1. Measurement: this block contains the measurement data
displayed on the Monitor screen during the printing operation – it
also provides the set-up parameters for the displayed monitoring
task (see section 8.2).
2. Set-Up: this block contains active set-up parameters.
3. Calibration: this block contains the optical filter factors,
calibration factors and all other information related to the
calibration of the optical filters installed in the Monitor.
10.2
Printer Cables
To connect the cables:
1. Ensure that both the Monitor and the printer are switched off at
the mains. Failure to do so may result in your equipment being
damaged.
2. Locate the desired port at the back of the monitor. The ports are
labelled “RS-232”.
3. Push the cable connector on to the correct socket, and secure it
firmly using the securing screws.
_____________________________________________________________________________
BE6039-11
3436i SF6 Detector
LumaSense Technologies A/S
Page 120 of 194
Chapter 10
______________________________________________________________________
4. Locate the input port on the printer.
5. Push the connector at the other end of the cable on to this socket,
and secure it firmly using the securing screws.
The instruments can be turned on at the mains now.
10.3
Setting-up Communication Parameters
WARNING!: You must perform a PARTIAL RESET of the Monitor
(press the RESET and S1 buttons) if the active value of any
parameter in this branch of the Set-Up Tree is changed. If the
Monitor is not partially reset, then, the Monitor will not up-date the
communication-parameter data which was used last time data was
transmitted via either of its interfaces. By performing a partial reset
you ensure that the Monitor has the parameters necessary to enable
it to transmit data to the attached printer.
Press SET-UP S3 S1 S3 and the following text is displayed:
SELECT COMMUNICATION SET-UP BRANCH
RS 232 C
ETHERNET
CONNECTIONS
If you are using the RS-232 interface, go to section 10.3.1.
10.3.1
RS-232 Interface
A brief description of the communication parameters is given below.
A list of the parameters, together with the values available and their
factory default values are shown in Table 10.1.
The parameters in this branch decide how the Monitor communicates
via the RS232 interface.
SELECT BAUD RATE gives the rate at which data should be
transmitted from the Monitor via its RS-232 interface.
SELECT NUMBER OF STOP BITS gives the number of stop bits,
which should be used when data is transmitted from the Monitor to
other equipment.
SELECT NUMBER OF DATA BITS gives the number of data bits,
which should be used when data is transmitted between the Monitor
and other equipment.
_____________________________________________________________________________
BE6039-11
3436i SF6 Detector
LumaSense Technologies A/S
Page 121 of 194
Chapter 10
______________________________________________________________________
SELECT PARITY CHECK The user chooses whether or not
transmitted data should be checked for transmission errors using the
parity checking system.
SELECT HARDWIRE MODE The user chooses which communication
line (wire) should be used to control data transmission between the
Monitor and other equipment.
SELECT HANDSHAKE TYPE The user chooses which type of
“handshake” should be used for transmission via the RS 232
interface.
Table 10.1 The available choices and the default values for each RS232 communication parameter
Display Text
SELECT BAUD RATE
SELECT NUMBER OF STOP BITS
SELECT NUMBER OF DATA BITS
SELECT PARITY CHECK
SELECT HARDWIRE MODE
SELECT HANDSHAKE TYPE
Acceptable
Values
300/600/1200/
2400/4800/9600
1 BIT, 2 BITS
7 BITS, 8 BITS
NONE, EVEN,
ODD
Three-wire,
Switched-line,
Leased-line
None,
X-ON/X-OFF,
Hard-wired
Default
Value
9600
1 BIT
7 BITS
EVEN
Leased-line
Hard-wired
REMEMBER to partially reset your Monitor if any of the above
parameters are changed! See the WARNING at the beginning
of section 10.3.
From the top of the Communication branch of the Setup Tree
SELECT COMMUNICATION SET-UP BRANCH
RS 232 C
ETHERNET
CONNECTIONS
1. Press S1. (RS 232 C)
2. Use the direction and select push-buttons to select the correct
values for the parameters.
If you are in doubt about any of the settings, refer to your printer
manual.
_____________________________________________________________________________
BE6039-11
3436i SF6 Detector
LumaSense Technologies A/S
Page 122 of 194
Chapter 10
______________________________________________________________________
3. When you have been through all the parameters, the monitor
returns to the top of the Communication branch of the Set-Up
Tree.
4. Press S3 S1 and then SET-UP. This selects the RS-232 port as
the communication port for the printer.
5. Press RESET and S1 to partially reset your Monitor.
10.3.2
Ethernet Interface
From the top of the Communication branch of the Setup Tree
SELECT COMMUNICATION SET-UP BRANCH
RS 232 C
ETHERNET
CONNECTIONS
1. Press S2. (ETHERNET)
2. Please refer to section 2.5 how to setup the Ethernet parameters.
3. When you have been through all the Ethernet parameters, press
SET-UP and then S3 S1 S3 S3 S3 and finally SET-UP. This
selects the Ethernet port as the communication port for the
printer.
Press RESET and S1 to partially reset your Monitor.
On the remote PC you can now prepare an Ethernet terminal
program like HyperTerminal to be able to receive the printed output
from the gas monitor.
HyperTerminal is a terminal program able to receive Ethernet
communication send from the gas monitor.
_____________________________________________________________________________
BE6039-11
3436i SF6 Detector
LumaSense Technologies A/S
Page 123 of 194
Chapter 10
______________________________________________________________________
1. After starting the HyperTerminal program please select a name for
the connection.
2. Press OK to continue.Error! Reference source not found.
Error! Reference source not found. Error! Reference source
not found.
_____________________________________________________________________________
BE6039-11
3436i SF6 Detector
LumaSense Technologies A/S
Page 124 of 194
Chapter 10
______________________________________________________________________
3. Press Cancel to continue.
4. Press Yes to continue.
5. Press OK to continue. Connect using ‘TCP/IP (Winsock)’ and
enter the IP Address of the gas monitor as the ‘Host address’.
Press OK to continue.
_____________________________________________________________________________
BE6039-11
3436i SF6 Detector
LumaSense Technologies A/S
Page 125 of 194
Chapter 10
______________________________________________________________________
6. You are now able receive printed output from the gas monitor in
the terminal window that you have just created. Below is shown a
measuring task session.
10.4
Additional Parameters Required
The other output parameters which determine the format of printouts are shown in Table 10.2 together with available choices and
factory default values.
Table 10.2
Parameters which determine the format of print-outs
from the monitor
Display Text
PRINT EACH GAS?
(if print each gas is no) PRINT
GAS N*?and/or Air Pressure
SELECT TEXT LINE TERMINATOR
Acceptable
Values
No, Yes
No, Yes
CR, LF, CR-LF
Default
Value
Yes
No
CR-LF
If one chooses to PRINT EACH GAS, then all gases, which have
been measured, will be printed out. If one does not choose to PRINT
EACH GAS then the user is given the chance to choose which of the
gases A and water (W) should be printed out – PRINT GAS A? and
so on.
_____________________________________________________________________________
BE6039-11
3436i SF6 Detector
LumaSense Technologies A/S
Page 126 of 194
Chapter 10
______________________________________________________________________
SELECT TEXT LINE TERMINATOR The user chooses which
character the Monitor should use as “end of text line” when data is
transmitted from the Monitor.
10.5
Data Logging Function
Setting-up the Monitor to Print a Data Log
If the Monitor is connected up to a printer, and it is set-up to
transmit data to the printer, this function enables measurement data
to be printed out, automatically, as soon as it becomes available
during a measurement or calibration.
The procedure is as follows:
1 Press the following sequence:
following text is displayed:
SET-UP
S3
S1
S1, and the
SELECT GENERAL SET-UP BRANCH ?
CLOCK
SOUND
TESTS
2 Press S3 S3 SET-UP. This activates the data logging
function.
10.6
Error Logging Function
Setting-up the Monitor to Print an Error Log
If the Monitor is connected up to a printer, and it is set-up to
transmit data to the printer, this function enables any warning or
error messages that are displayed, to be recorded in the printed
error log, automatically.
The procedure is as follows:
1. Press the following sequence:
following text is displayed:
SET-UP
S3
S1
S1, and the
SELECT GENERAL SET-UP BRANCH ?
CLOCK
SOUND
TESTS
2. Press S3
function.
S3
SET-UP. This activates the error logging
_____________________________________________________________________________
BE6039-11
3436i SF6 Detector
LumaSense Technologies A/S
Page 127 of 194
Chapter 10
______________________________________________________________________
10.7
Printing-out Data from the Monitor
Before data can be printed out from the Monitor, the communication
parameters must be checked/changed. This is explained in section
10.3.1 for RS-232 communication and in section 10.3.2 for the
Ethernet communication. The text line terminator must be set (see
section 10.4) before printing can proceed.
It is also necessary to define the averaging period if the AVERAGE
option is selected. Setting the Data Logging function is described in
section 10.5.
10.7.1
Starting a Print-out
Press PRINT and then one of select push-buttons S1
depending on which data block you wish to print-out.
10.7.2
S2 or
S3
Stopping a Print-out which is in Progress
If a print-out is in progress and you wish to stop it, then the
following steps need to be followed:
1. Press the PRINT button on the Monitor’s front panel.
The following text will appear on the display:
PRINT ABORTING
PLEASE WAIT
The printer will stop printing data.
2. Use the Line Feed function on the printer if the paper is not
ejected automatically.
_____________________________________________________________________________
BE6039-11
3436i SF6 Detector
LumaSense Technologies A/S
Page 128 of 194
Chapter 11
______________________________________________________________________
Chapter 11
Maintenance of the 3436i
April 2015
_____________________________________________________________________________
BE6039-11
3436i SF6 Detector
LumaSense Technologies A/S
Page 129 of 194
Chapter 11
______________________________________________________________________
The only regular maintenance required for the 3436i is:
Calibration – approximately every 3 months (see Chapter 12).
Changing the fine air-filter paper in the internal and external airfiltration units (see section 11.1).
Cleaning of the filter in the ventilation unit (see section 11.2).
11.1
Changing the Fine Air-filters
The monitor is equipped with an internal filtration unit.
The internal unit is mounted on the air-inlet, on the back panel. This
is shown in Fig.11.1.
Fig.11.1 The internal air-filtration unit mounted on the back panel of
the monitor.
The internal air-filtration unit can be removed simply by unscrewing
the unit by hand. The unit is shown in Fig.11.2.
Fig.11.2 The internal air-filtration unit
Inside the unit, a fine (10µm) filter-paper removes fine dust particles
and other suspended matter from air samples before they reach the
measurement chamber of the Monitor.
_____________________________________________________________________________
BE6039-11
3436i SF6 Detector
LumaSense Technologies A/S
Page 130 of 194
Chapter 11
______________________________________________________________________
Whenever the Monitor needs to be calibrated, we recommend that
the fine filter-paper in the internal air-filtration unit is changed
before you calibrate. The fine filter-paper in the internal air-filtration
unit must be changed at least twice a year; and more frequently if
the environment in which the monitor is working contains large
quantities of particulate material suspended in the air.
When the monitor is making measurements, we recommend that a
length of Teflon® tubing (of up to 50 metres in length) is always
attached to the stub of the air-inlet (see Fig.11.1) and that the
special external air-filtration unit UD 5023 (optional accessory),
shown in Fig.11.3, is always attached to the free-end of the sampling
tube, by means of the small stub. An external coarse metal air-filter
prevents large particles, insects etc. being drawn into the unit, while
inside the unit is a fine (10µm) filter-paper, which prevents any finer
particles from entering the Teflon® sampling tube. The fine filterpaper in this unit must also be changed regularly – at least as
frequently as the fine filter-paper in the internal fine air-filter.
Fig.11.3 The external air-filtration unit UD5023 used with the
Monitor, (optional accessory)
Changing the fine filter-paper in both the internal and external airfiltration units is explained step by step in the following two subsections.
11.1.1
Changing the
filtration Unit
Filter-paper
in
the
Internal
Air-
While you do this, we recommend that you wear clean, rubber
gloves.
Tools and equipment required:
_____________________________________________________________________________
BE6039-11
3436i SF6 Detector
LumaSense Technologies A/S
Page 131 of 194
Chapter 11
______________________________________________________________________
Acetone (analytically pure)
Spare fine filter-paper DS 0759
Tweezers with Teflon coating
Cotton buds
Clean rubber gloves
To change the filter-paper:
Switch the power to the monitor “Off” by using the AC mains power
switch on its back panel (press O), and then pull out the plug
connecting the monitor to the AC mains power supply.
Put a rubber glove on the hand, which is to hold the parts of the unit.
Unscrew the internal air-filtration unit from its mounting on the airinlet, see Fig.11.1. To do this, turn the unit anti-clockwise with your
fingers until the unit is free of the slot.
The unit is removed from the monitor. It is shown in Fig.11.2.
Use the tweezers to lift off the retaining disc and used filter-paper,
while holding the handle of the unit between your thumb and fingers.
Refer to Fig.11.4. The retaining disc has two tabs which “lock” it to
the filtration unit.
Fig.11.4 Removing the retaining disc and old filter-paper
Holding the disc with the tweezers, moisten a cotton bud with pure
acetone and use it to clean the surfaces of the disc. Place the disc on
a clean, dry surface.
Caution: Make sure that no cotton fibres remain on the mesh of the
retaining disc otherwise they could be sucked up into, and block the
measurement system when the Monitor is operated.
Hold the handle-end of the unit between your thumb and fingers.
Moisten a cotton bud with pure acetone and use it to clean the
surfaces of the unit. Refer to Fig.11.5. Place the unit, with its handleend downwards, on a clean, dry surface.
_____________________________________________________________________________
BE6039-11
3436i SF6 Detector
LumaSense Technologies A/S
Page 132 of 194
Chapter 11
______________________________________________________________________
Fig.11.5 Cleaning the surfaces of the internal air-filtration unit
Notes:
Only proceed to the next step when the acetone has completely
evaporated from the air-filter retaining disc and filtration unit.
Each of the fine filter-papers DS 0759 are packed between two
pieces of packing paper. The fine filter-paper is always white in
colour.
Remove a new fine filter-paper from its packaging using the
tweezers. Hold it by its edge. Refer to Fig.11.6. Lift the filter up and
place it inside the unit.
Fig.11.6 Placing a new filter-paper in the unit
Holding the handle-end of the unit between your thumb and fingers,
pick up the (dry) retaining disc and place it over the new filter-paper.
Refer to Fig.11.7. Gently press the disc down over the filter-paper,
making sure that the disc’s locking tabs fit properly into the groove
in the unit and that the filter-paper stays in position and is not
damaged in any way.
Holding the handle-end of the re-assembled unit between your
thumb and fingers, place it back into position in the air-inlet of the
Monitor. Screw it back into its mounting. To do this, turn the unit
clockwise with your fingers to tighten until it is in position.
_____________________________________________________________________________
BE6039-11
3436i SF6 Detector
LumaSense Technologies A/S
Page 133 of 194
Chapter 11
______________________________________________________________________
Fig.11.7 Refitting the retaining disc
11.1.2
Changing the
filtration Unit
Filter-paper
in
the
External
Air-
While you do this, we recommend that you wear clean, rubber
gloves.
Tools and equipment required:
Acetone (analytically pure)
Spare fine filter-paper DS 0759
Tweezers with Teflon coating
Cotton buds
Clean rubber gloves
To change the filter-paper:
Switch off the Monitor.
Put a rubber glove on the hand which is to hold the parts of the unit.
Pull the external fine air-filtration unit off the end of the Teflon®
sampling tube. Hold the stub-end of the external air-filter unit
between your thumb and fingers, and unscrew the coarse air filter
from the end of the unit. Refer to Fig.11.3.
Remove the used (old) filter-paper and the retaining disc from the
unit using the tweezers. Refer to Fig.11.8.
Fig.11.8
The parts of the external air-filtration unit UD 5023
_____________________________________________________________________________
BE6039-11
3436i SF6 Detector
LumaSense Technologies A/S
Page 134 of 194
Chapter 11
______________________________________________________________________
Moisten a cotton bud with pure acetone and use it to clean the
surfaces of the unit, the retaining disc and the coarse air-filter. Refer
to Fig.11.8. Place the stub-end of the unit downwards, on a clean,
dry surface; the coarse air-filter, with its screw-end downwards on a
clean, dry surface and rest the retaining disc against it.
Caution: Make sure that no cotton fibres remain on the mesh of the
retaining disc otherwise they could be sucked up into, and block the
measurement system when the analyzer is operated.
Notes:
Only proceed to the next step when the acetone has completely
evaporated from the cleaned surfaces.
Each of the fine filter-papers DS 0759 are packed between two
pieces of packing paper. The fine filter-paper is always white in
colour.
Hold the stub-end of the unit between your thumb and fingers. Lift
the retaining disc with the tweezers and place it back into position in
the unit. Refer to Fig.11.8.
Remove a new fine filter-paper from its packaging using the
tweezers. Hold it by its edge. Carefully place the filter-paper over the
top of the retaining disc so that it is held in position by the small “lip”
on the rim of the unit.
Screw the coarse air-filter over the end of the external air-filtration
unit. Make sure that the fine filter-paper remains in its correct
position directly over the retaining disc.
11.2
Cleaning the Filter in the Ventilation Unit
A small ventilation unit is mounted on the back panel of the Monitor
(see in Fig.11.9). The ventilating fan in this unit circulates air
through the Monitor to keep it cool. To ensure that the air being
drawn into the Monitor is free of particles a filter pad is placed between the fan and grid which covers it. This filter needs to be
periodically taken out and cleaned. We recommend that this task is
done at least as often as calibration, and more frequently if the
Monitor is working in a very dusty atmosphere or an atmosphere
containing high concentrations of other particulate matter.
Use a “pozidrive” screwdriver to unscrew the screw on the grid cover.
Remove the filter pad from inside the grid cover. Wash the filter pad
in warm water containing some liquid soap. Rinse all the soap out of
the filter, by running clean water through it, and let it dry
thoroughly.
Place the clean, thoroughly dry, filter pad inside the grid cover.
Screw the grid cover firmly back in place over the ventilation unit.
_____________________________________________________________________________
BE6039-11
3436i SF6 Detector
LumaSense Technologies A/S
Page 135 of 194
Chapter 11
______________________________________________________________________
Fig.11.9
11.3
Back panel of the 3436i showing the ventilation unit
Cleaning the Instrument
It is recommended to clean the instrument using a damped cloth.
_____________________________________________________________________________
BE6039-11
3436i SF6 Detector
LumaSense Technologies A/S
Page 136 of 194
Chapter 12
______________________________________________________________________
Chapter 12
Calibration of the Optical Filters
April 2015
_____________________________________________________________________________
BE6039-11
3436i SF6 Detector
LumaSense Technologies A/S
Page 137 of 194
Chapter 12
______________________________________________________________________
12.1
About the Installed Optical Filters
The optical filter UA0936 has been installed in the position marked
“A” of the filter carousel wheel in your Monitor. A special optical
filter, which is selective to water vapour, is always installed in
position “W”.
The optical filter has to be span calibrated with the gas it is to
measure. If this span calibration is not performed the Monitor is
unable to measure accurately.
Each filter in the carousel has to be fully calibrated before the
Monitor can perform accurate gas measurements. The practical
calibration procedure is fairly simple, it involves performing
measurements with the Monitor while various gas supplies are attached to its air-inlet.
A full calibration of the water-vapour filter SB 0527 involves:
•
•
Zero-point calibration (using a zero-gas *)
Span calibration (using a known concentration of water vapour)
A full calibration of the optical filter in position “A” involves:
•
•
•
Zero-point calibration (using a zero-gas*)
Humidity-interference calibration (using water-vapour)
Span calibration (using a known concentration of the gas ( SF6)
this filter is to measure)
The following sections explain what a calibration is and why it is
necessary. Some of the expressions used in this chapter are also
explained, to help you understand the process.
*
A zero-gas is a gas which does not absorb infra-red light e.g. pure Nitrogen.
_____________________________________________________________________________
BE6039-11
3436i SF6 Detector
LumaSense Technologies A/S
Page 138 of 194
Chapter 12
______________________________________________________________________
12.2
What is Calibration and Why is it Necessary?
In order to understand calibration, it is necessary to look at what
happens inside the analysis cell during a gas concentration
measurement. A sample of air is drawn into the cell. The cell is then
sealed off and light is sent from the infra-red source via a chopper
(to pulsate it) through an optical filter. The optical filter only
transmits light in a defined wavelength range and this light enters
the cell.
If there is a gas in the cell, which absorbs light of this wavelength, a
pressure wave is created and this is measured by the microphones
mounted within the cell. The greater the concentration of the
absorbing gas in the cell, the greater the pressure (sound) wave it
creates.
How do we measure the relationship between the measured sound
signal and the concentration of the absorbing gas in the cell? We
calibrate the optical filter.
Our description of what happens in the cell is, however, a little too
simplified. In reality, we have to take three other factors into
consideration: namely: (1) cell noise; (2) the presence of water
vapour in the sample (humidity interference).
Fig.12.1 High resolution absorption spectrum of water vapour
Cell Noise
When there is zero-gas in the cell (that is, a gas which does not
absorb any infra-red light) a signal is measured in the cell. This
signal is due to what is termed cell noise. Cell noise is created by
the imperfect reflection of infra-red light from the cell walls. It is
dependent upon the properties of the cell itself (for example, its
dimensions and the reflectivity of its walls) as well as the wavelength
(and thus energy) of the infra-red light which is incident on its walls.
_____________________________________________________________________________
BE6039-11
3436i SF6 Detector
LumaSense Technologies A/S
Page 139 of 194
Chapter 12
______________________________________________________________________
As it is the optical filter, which determines the wavelength of light,
cell noise will depend upon the optical filter being used.
The cell-noise signal is measured during the Zero-point Calibration
of each filter. A supply of dry, zero gas is attached to the air-inlet of
the Monitor and the signal in the cell is measured with the installed
optical filter (“A”). This signal is called the concentration offset
factor for the filter. Whenever the filter is used, this signal is
subtracted from the total measured signal as it is not related to the
concentration of any gas.
Presence of Water Vapour
Water vapour is nearly always present in ambient air and it absorbs
infra-red light, to a greater or lesser extent, at nearly all wavelengths
(see Fig.12.1). This means that no matter which optical filter is
transmitting light into the cell the water vapour in the cell will absorb
some of this light and create a signal. This signal is said to “interfere”
with the signal produced by the gas we wish to measure with this
filter.
Fig.12.2 Schematic diagram showing the relative absorption of water
vapour by different optical filters
How is this interference measured? A water-vapour optical filter,
which transmits light with a wavelength, which is absorbed by very
few gases, except water vapour, is always installed in position “W” of
the filter carousel. Using this filter, water-vapour’s interference is
measured during the Humidity Interference Calibration on the
installed filter. A supply of zero gas containing a constant
concentration of water vapour is attached to the air-inlet of the
_____________________________________________________________________________
BE6039-11
3436i SF6 Detector
LumaSense Technologies A/S
Page 140 of 194
Chapter 12
______________________________________________________________________
Monitor. The signal in the cell is measured with the water vapour
filter and with the installed optical filters.
The water vapour in the cell absorbs light from the water-vapour
filter and from the installed filter, producing signals which are related
to water-vapour’s relative absorption of the light at the wavelengths
transmitted by the optical filter (see Fig.12.2). We know, however,
that the ratio of the signal measured with any one filter (e.g. “A”)
and the signal measured with the water-vapour filter is a constant.
This ratio is related to the Humidity Gain Factor calculated during
the humidity-interference calibration of filter “A”. For example, if the
signal produced by water vapour when using the water-vapour filter,
is 160µV and using Filter “A” is 16µV, then, if the signal measured
with the water-vapour filter is found to be 80µV, we know that this
concentration of water vapour will produce a signal of 8µV when
Filter “A” is used. Measurements made during humidity-interference
calibration of the installed filters therefore enable the Monitor to
compensate any measured signal for water-vapour’s interference.
12.3
Tasks Before Starting Any Calibration
Before starting any kind of calibration task there are several
operations, which need to be performed:
12.3.1
Obtaining a Print-out of Calibration Data in the
Monitor
Whether the Monitor is to be used online or as a stand-alone
instrument, the Calibration Software BZ7002 can be used to check
the Monitor’s existing calibration. Please refer to User manual
BE6034.
Stand-alone Use
With the monitor connected to a printer (details are given in Chapter
10):
Press PRINT and then S3.
To stop printing, press PRINT again.
12.3.2
Checking the Calibration of Each Installed Optical
Filter
A print-out of the calibration data in the Monitor’s memory is useful
to have for reference. It also enables you to find out how “old”
_____________________________________________________________________________
BE6039-11
3436i SF6 Detector
LumaSense Technologies A/S
Page 141 of 194
Chapter 12
______________________________________________________________________
calibration factors compare with the “new” calibration factors
calculated during re-calibration tasks, see section 12.3.1.
Fig.12.3 illustrates only part of a typical calibration data print-out.
Note that there are five different filter banks, which contain
calibration data. These banks are numbered from 1 to 5. This
enables each filter to be calibrated to measure up to 5 different
gases. Before the filter is calibrated to measure any one particular
gas, you have to inform the Monitor about where you wish to store
the calibration data for this gas. The number of the filter bank chosen
when operating in Set-Up mode is called the active filter bank (see
Chapter 9).
When checking the optical filter using the front panel push-buttons,
Chapter 10 provides details of how to obtain a print-out of calibration
data using a printer with an RS 232 interface.
Note that calibration data in the active filter bank is always printed
out directly after the optical filter factors data and this data is also
shown under the heading CALIBRATION DATA IN FILTER BANK
: X, where X is the number of the filter bank.
Note: all calibration factors are expressed as exponential numbers.
For example: 104.05E-3, this is the same as the number 104.05 x
10-3 = 0.10405
1. Refer to your calibration data print-out and check the following
information:
a.
b.
c.
d.
Under
the
heading
GENERAL
CALIBRATION
INFORMATION FOR FILTER A: check that the UA number
of the installed optical filter is UA0936 the same as the UA
number appearing on the “Calibration Chart” for the optical
filter in position “A”.
Under the headings CALIBRATION DATA IN FILTER
BANK:1; CALIBRATION DATA IN FILTER BANK:2;
CALIBRATION DATA IN FILTER BANK:3; CALIBRATION
DATA IN FILTER BANK:4; and CALIBRATION DATA IN
FILTER BANK:5 check the following information:
Zero-point calibration performed: if a date appears here
(year-month-day) this is the last time the zero-point
calibration data in this filter bank was updated.
Concentration offset factor: if a number appears here this
means that this filter bank contains calibration data obtained
during a zero-point calibration of filter “A”.
Hum. Interference Calibration performed: if a date
appears here (year-month-day) this is the last time the
_____________________________________________________________________________
BE6039-11
3436i SF6 Detector
LumaSense Technologies A/S
Page 142 of 194
Chapter 12
______________________________________________________________________
e.
humidity-interference calibration data in this filter bank was
updated.
Humidity gain factor: if a number appears here this means
that this filter bank contains calibration data obtained during
the humidity-interference calibration of filter “A”.
f.
If the following three conditions are found in any filter bank:
• Gas name: if the name which appears here is the same
as the name of the gas you intend to measure with filter
“A”;
• Span Calibration performed: if a date appears here;
and
• Conversion factor: a number appears here;
Then this filter has been properly span calibrated with the
named gas. The filter bank containing this calibration data
is the filter bank, which has to be made active when filter
“A” is to measure this named gas.
g.
However, if the Gas name: is given as “Gas UA number”
then the filter has only been checked to see that it is
functioning correctly, it has not been span calibrated to
measure the gas you wish to measure.
2. Under the heading GENERAL INFORMATION FOR WATER
FILTER – ACTIVE CALIBRATION DATA : check the following
information:
a.
Zero-point Calibration performed: if a date appears here
this is the last time the water-vapour filter was zero-point
calibrated.
b.
Concentration offset factor: if a number appears here
this means that the water-vapour filter has been zero-point
calibrated.
c.
Span Calibration performed: if a date (year-monthday) appears here, this is the last time span calibration of
the water-vapour filter was performed.
d.
Conversion Factor: if a number appears here this means
that the water-vapour filter has been span calibrated.
When the water-vapour filter has been zero-point calibrated and
span calibrated it is able to measure the absolute concentration of
water vapour in any gas sample in the analysis cell of the Monitor,
and it requires no further calibration.
_____________________________________________________________________________
BE6039-11
3436i SF6 Detector
LumaSense Technologies A/S
Page 143 of 194
Chapter 12
______________________________________________________________________
When the installed optical filter has been zero-point, humidityinterference and span calibrated then the Monitor is able to perform
accurate measurements.
Fig.12.3
12.3.3
Part of a calibration data print-out
Checking and Changing Optical Filter Parameters
Before starting calibration it is always wise to check that information
about the installed optical filter has been “entered” correctly in the
active set-up of the Monitor. If the incorrect UA number is
“entered” for the optical filter, the incorrect optical filter factors will
be used in the calculation of the calibration factors, and calibration
will therefore be useless.
_____________________________________________________________________________
BE6039-11
3436i SF6 Detector
LumaSense Technologies A/S
Page 144 of 194
Chapter 12
______________________________________________________________________
The UA number can only be changed using the push-buttons on the
front panel of the monitor.
1. Press SET-UP S3 S3.
The following text appears on the screen display:
CHECK AND / OR CHANGE SET-UP FOR FILTER A
NO
YES
2. Press S3 and the following text appears on the screen display:
SELECT UA NUMBER FOR FILTER A 0988
PRESS ENTER TO CHANGE VALUE
The UA number of the filter installed in position “A” should have
already been checked (see section 12.3.2).
WARNING! If this number is changed all calibration data for this
filter – in all 5 filter banks – will be deleted (i.e. lost) and the filter
will have to be fully calibrated again before it can be used.
If the incorrect filter is selected, press ↵ and use and to
scroll through the UA numbers, until the correct UA number is
displayed.
The procedure divides here. PC users go to step 3. and Stand-alone
users go to step 4.
3. Only the Filter UA number need to be checked/changed using the
monitor’s push-buttons. All the other parameters are set when
setting up the calibration using the Calibration program.
Then exit the Calibration Set-up by pressing SET-UP.
4. Press ↵ .
The following text appears on the screen:
FILTER BANK NUMBER 1
PRESS ENTER TO CHANGE VALUE
5. Press ↵ , and use and to display the number of the filter bank
(1-5) where you wish the Monitor to store the calibration factors
calculated during the span calibration of this filter using this
particular gas.
6. Press ↵ .
The following text appears on the screen:
_____________________________________________________________________________
BE6039-11
3436i SF6 Detector
LumaSense Technologies A/S
Page 145 of 194
Chapter 12
______________________________________________________________________
GAS A IS “_
PRESS ENTER TO CHANGE VALUE
“
7. Press ↵ and use the direction push-buttons to enter the desired
name.
8. Press ↵ to “accept” the name you have “entered” on the display
screen. The following text then appears:
MOLECULAR WEIGHT OF GAS A 1.000
PRESS ENTER TO CHANGE VALUE
9. Press
↵ and use the direction push-buttons to “enter” the
molecular weight of the gas to be measured by filter A.
10. Press ↵ to “accept” the molecular weight you have “entered” on
the display screen. The following text appears on the screen:
FILTER A SAMPLE INTEGRATION TIME
PRESS ENTER TO CHANGE VALUE
5s
11. Press ↵ , and use and to display the desired Sample
Integration Time.
There are seven to choose from: 0.5s, 1s, 2s, 5s, 10s, 20s and
50s.
12. Press ↵ to “accept” the selected value.
The following text appears on the screen:
GAS A HIGH ALARM LIMIT 1 ___________mg/m3
PRESS ENTER TO CHANGE VALUE
13. Press ↵ and use the direction push-buttons to enter the desired
alarm level.
14. Press
↵ to accept the entered value. Following screen is
displayed:
GAS A HIGH ALARM LIMIT 2 ___________mg/m3
PRESS ENTER TO CHANGE VALUE
15. Repeat step 13 and 14 to enter the desired alarm level.
_____________________________________________________________________________
BE6039-11
3436i SF6 Detector
LumaSense Technologies A/S
Page 146 of 194
Chapter 12
______________________________________________________________________
16. All the parameters for Filter W are fixed except for the Sample
Integration Time and the two high Alarm limits.
17. Press ↵ and use and to display the desired Sample
Integration Time.
18. Repeat step 13 and 14 to enter the desired alarm levels.
19. Press ↵ , this returns you to the top of the Configuration Set-up
Tree.
12.3.4
Setting-up the Monitor to Print a Data Log
This is only necessary for those of you who do not use the Calibration
Software BZ7002 to calibrate the Monitor.
During calibration, the calibration gas is drawn into the cell and the
microphones measure the signal produced by the gas’s absorption of
light from the infra-red light source. As soon as a measurement is
made it is displayed on the Monitor’s screen. Measurement results
are constantly updated on the display, but only one set of measurement results are displayed at a time, and no scrolling facility is
available to look at previously-displayed results. Therefore, your
Monitor should be set-up to print a “Data log” This is described fully
in section 10.5.
12.3.5
Warming Up the Monitor
The infra-red light source is very hot and the temperature in the
analysis cell thus increases as calibration measurements proceed.
Conditions within the cell tend to stabilise more quickly once the
temperature inside the analysis cell is 15°C above the ambient room
temperature. We therefore suggest that you set-up the Monitor to
sample continuously, for a period of 30 – 40 min. to warm up the
analysis cell before a calibration task is started. This will reduce the
time required for calibration.
To warm-up the Monitor you need to set-up a monitoring task and
make the Monitor perform the task for a period of time. If you are
unsure about setting up and starting a monitoring task, full
instructions are provided together with an example in section 4.3 for
stand-alone use.
The Continuous warm function can also be used hence the warm up
starts on power on. (see section 5.6).
_____________________________________________________________________________
BE6039-11
3436i SF6 Detector
LumaSense Technologies A/S
Page 147 of 194
Chapter 12
______________________________________________________________________
12.4
The Basic Calibration Set-up
The general equipment required to perform the calibration is shown
in Fig.12.4. Three different lengths of Teflon tubing are connected to
a “Y”-piece. The tube attached to point 1 is connected to the air-inlet
of the Monitor; the tube attached to point 2 is attached to a gas flow
meter or similar apparatus; and the tube attached to point 3 is attached to the cylinder of gas which is to be used during calibration.
Fig.12.4 General equipment required for a calibration task
Attaching a gas flow meter serves two vital functions (see Fig.12.5):
Fig.12.5
Schematic diagram of a flow meter
_____________________________________________________________________________
BE6039-11
3436i SF6 Detector
LumaSense Technologies A/S
Page 148 of 194
Chapter 12
______________________________________________________________________
•
It allows you to have a visually check that there is a net flow of
gas out of the Teflon tube attached to it during the whole
calibration procedure. The “flow ball” can be seen to be bouncing
on the upward flow of air out of the meter.
If the pressure of the gas from the cylinder is too low at any time
then the “flow ball” will just remain seated at the bottom of its
tube. This condition must be avoided because atmospheric air will
be drawn into the Teflon tube system via the flow meter and
cause dilution of the calibration gas. This will affect the accuracy
of your calibration.
•
It functions as an escape valve. When the pressure of the gas in
the tubing becomes greater than atmospheric pressure, gas flows
out to the atmosphere via the flow meter. This ensures that the
gas entering the analysis cell is as close to atmospheric pressure
as possible, and this prevents damage to the very sensitive
microphones in the analysis cell.
WARNING!: The analysis cell of the monitor is equipped with
sensitive microphones, and therefore NO direct connection between
the Monitor’s air-inlet and the pressure-valve on a gas cylinder is
allowed. Under NO circumstances should the pressure of the air in
the analysis cell be allowed to exceed 0.1 bar above the ambient
pressure.
1. Attach the Teflon tubing to the Air Inlet Filter at the back of the
monitor. This is described in detail in section 4.2.
2.
a. Connect the free-end of the length of tubing attached to the
air-inlet to one of the branches of the “Y”-piece (see
attachment point no. 1 in Fig.12.4).
b. Cut off another 1m length of Teflon tubing and connect one
of its ends to attachment point no. 2 of the “Y”-piece (see
Fig.12.4) and its other end to a flow-meter.
3. Connect a 1m length of tubing to attachment point no. 3 of the
“Y”-piece (see Fig.12.4).
12.4.1
Producing a Supply of Clean, Wet Air
When humidity-interference calibrations are performed, clean, wet
air is required. This can be produced in the following manner.
We suggest that you bubble zero-gas (e.g. pure nitrogen) through a
thermostatically-controlled water-bath to produce a supply of clean,
wet air to the Monitor during humidity-interference calibration of the
filters (see Fig. 12.6). Notice that the thermostatically-controlled
_____________________________________________________________________________
BE6039-11
3436i SF6 Detector
LumaSense Technologies A/S
Page 149 of 194
Chapter 12
______________________________________________________________________
water bath is linked up to an extra “empty” flask. This is to prevent a
situation where the level of water in the controlled water-bath rises
and covers the outlet tube “A” and draws water, via the “Y”-piece,
directly into the Monitor’s analysis cell. Water will seriously damage
the cell. To avoid such a situation, we suggest that the wet air from
the water-bath outlet tube is fed into an extra empty flask before
being fed to the air-inlet of the Monitor. Note the length of the
respective tubes in the flasks. It is vitally important that any
water, which collects in the extra flask, does not cover the short
outlet tube “B”.
It is very important that the concentration of water vapour used is
below the saturated water-vapour pressure of the air in the room
where calibration is being performed, otherwise water vapour will
condense out in the analysis cell. In practical terms this means that:
•
•
The Monitor must have time to reach the ambient temperature of
the room before a calibration task is performed.
The temperature of the water bath you use should be at least 2°C
below the ambient temperature of the room where calibration is
to be performed. So, if your ambient temperature is 20°C, make
sure that the temperature of the water-bath you use is set at a
maximum of 18°C.
Fig.12.6
Schematic diagram of the equipment necessary to produce
a supply of clean, wet air.
_____________________________________________________________________________
BE6039-11
3436i SF6 Detector
LumaSense Technologies A/S
Page 150 of 194
Chapter 12
______________________________________________________________________
12.5
General Settings – Stand-alone Use
Before a practical calibration task can be started, the monitor has to
be informed about the kind of calibration task you wish it to perform.
This is done using the push-buttons on the front panel of the
Monitor.
The Calibration Task Set-Up Tree is illustrated in Fig.12.7. It should
be used to help you follow the path through the different levels of the
calibration set-up. The calibration tasks are set-up while operating in
Measure mode.
Notice the following:
1. Before starting to set-up a calibration task you must make sure
that you choose the correct FILTER BANK NO. to store the
calibration factors which will be calculated during calibration (see
section 12.3.3).
2. If you answer “YES” to PERFORM ZERO-POINT CALIBRATION
?, then the installed optical filters (“A”) will be zero-point
calibrated, and the concentration offset factor for the filter will
be stored in the filter bank no. which is active for that filter
during the practical calibration task.
3. If you answer “YES” to PERFORM HUM. INTERFERENCE
CALIBRATION ?, then the installed optical filters (“A”) will be
calibrated for humidity interference, and the humidity gain
factor for the filter will be stored in the filter bank no. which is
active for that filter during the practical calibration task.
4. If you answer “YES” to PERFORM GAS SPAN CALIBRATION ?,
then you can choose (1) whether this calibration should be a
single-point or a two-point span calibration. The concentration
conversion factor calculated during span calibration for a particular gas using a particular filter), is stored in the filter bank no.
which is active during the calibration procedure.
12.5.1
Retaining Existing Calibration Factors
In some case, you may wish to keep the calibration factors already
present in your monitor. If this is the case, use the following
instructions.
_____________________________________________________________________________
BE6039-11
3436i SF6 Detector
LumaSense Technologies A/S
Page 151 of 194
Chapter 12
______________________________________________________________________
Fig.12.7
Schematic diagram showing the calibration task Set-Up
Tree (general)
Before setting-up a calibration task, make sure that the filter bank
you make active for the filter which have already been calibrated
only contain calibration factors which need to be up-dated. In this
way you can prevent your original calibration factors being
overwritten by the new ones. To illustrate this, imagine that filter
_____________________________________________________________________________
BE6039-11
3436i SF6 Detector
LumaSense Technologies A/S
Page 152 of 194
Chapter 12
______________________________________________________________________
“A”,is installed in your Monitor and have been calibrated. Suppose
the calibration data block of your Monitor contains the information
shown in Fig.12.8 (notice no filter is installed in position “E”)
Suppose You now install an optical filter in position “E”. This filter has
to be fully calibrated . Before performing a zero-point and humidity
interference task one of the following filter banks must be made
active:
•
•
•
•
Filter
Filter
Filter
Filter
bank
bank
bank
bank
no.
no.
no.
no.
3,
2,
2,
2,
4 or
3 or
3 or
3, 4
5 for filter “A”;
5 for filter “B”;
4 for filter “C”;
or 5 for filter “D”.
Suppose you make filter bank no. 3 active for all the above filters
and filter bank no. 1 active for filter “E”. Then, after a zero-point
calibration the calibration data block would contain the information
shown in Fig.12.9. None of the original calibration data has been
overwritten by the newly-calculated calibration factors.
Note: 3436i only have an optical filter in position A
Fig.12.8 Illustration of the calibration data stored in the filter banks
of filters “A” to “D” before a zero-point calibration task
_____________________________________________________________________________
BE6039-11
3436i SF6 Detector
LumaSense Technologies A/S
Page 153 of 194
Chapter 12
______________________________________________________________________
Fig.12.9
12.6
Illustration of the calibration data stored in the filter banks
of filters “A” to “E” after a zero-point calibration task
Zero-point Calibration
To calculate the concentration offset factor for a filter (during a
zero-point calibration) it is necessary to have a humidity gain
factor for the filter, and vice versa. If a humidity gain factor is not
stored in each of the filter banks, which are active during a zeropoint calibration, then it is necessary to perform a combined zeropoint and humidity-interference calibration task. The set-up of this
combined task is discussed in section 12.11.
If it is only a newly-installed optical filter which needs to be
calibrated, then the same procedure used for an individual filter must
be used, see section 12.5.1. In this way you can protect your original
concentration offset factors.
_____________________________________________________________________________
BE6039-11
3436i SF6 Detector
LumaSense Technologies A/S
Page 154 of 194
Chapter 12
______________________________________________________________________
12.6.1
Setting-up a Zero-point Calibration – Stand-alone
Use
Fig.12.10
Schematic diagram showing how to set-up a zero-point
calibration task (follow the arrows)
_____________________________________________________________________________
BE6039-11
3436i SF6 Detector
LumaSense Technologies A/S
Page 155 of 194
Chapter 12
______________________________________________________________________
Use the Set-up Tree in Fig.12.10 to help you navigate through the
different screen displays.
Note: before starting a calibration, S.I.T (see section 12.3.3) and
Flushing Type (see section 7.2) need to be set so that they are the
same as those values used when monitoring.
1. For each installed filter, enter the no. of the filter bank where you
wish the Monitor to store the concentration offset factors
which will be calculated during the zero-point calibration task.
2. Press MEASURE
displayed:
S3
S3
S1. The following text will be
PERFORM ZERO-POINT CALIBRATION ?
NO
YES
3. Follow the set-up of a zero-point calibration task by following the
black arrows in the schematic diagram shown in Fig.12.10.
The following text will appear on the display:
ZERO-POINT CALIB. CONNECT CLEAN, DRY AIR
AND PRESS ENTER WHEN READY
12.6.2
Performing a Zero-point Calibration – Stand-alone
Use
The general equipment necessary to perform a calibration task is
described in section 12.4. Follow the procedure from step 1 to step 3
inclusive and then continue as follows:
1.
a. Connect the free-end of the Teflon tubing mentioned in step 3
to the pressure valve on a cylinder of zero gas (e.g. pure
nitrogen).
b. Gently open the pressure-valve on the gas cylinder.
c. Press ↵ .
d. Use the pressure-valve on the gas cylinder to regulate the flow
of gas so that when the Monitor’s pump is running there is a
positive flow of gas out of the flow meter. This will ensure that
the zero gas is not contaminated by atmospheric air.
The following text appears on the screen:
_____________________________________________________________________________
BE6039-11
3436i SF6 Detector
LumaSense Technologies A/S
Page 156 of 194
Chapter 12
______________________________________________________________________
RESULTS NOT YET AVAILABLE
PLEASE WAIT
Once the first measurement result is available the screen text
illustrated above is replaced by a screen displaying the
measurement results – for example the following:
W: µ
: 11.3µV σ --- V
1
38.6°C
PRESS ENTER WHEN RESULTS ARE STABLE
As soon as measurement results are available they not only
appear on the display (see Fig.12.11) but are automatically
printed out on the printer, if the Monitor has been set up to print a
data log, see section 10.5. Remember to turn off the data log
when the calibration is complete.
Fig.12.11
Example of data displayed during a calibration (the text
below the display describes the displayed data)
Each time a sample of gas is drawn into the analysis cell the
signal is measured using all the installed optical filters and the
water-vapour filter (“W”) but, due to lack of space on the display,
the Monitor only displays the signal measured using the watervapour filter. You cannot scroll through the measurements. The
data-log print-out, however, shows the signal measured using all
installed filters as well as the water-vapour filter.
A maximum of 6 measurements are stored in the Monitor during
any calibration. The number (n) indicates how many
measurements are stored. When 7 measurements have been
performed the number (n) will show the number 6 because the
very first measurement is overwritten by the 7th measurement so
that only 6 measurements are still stored. When 8 measurements
_____________________________________________________________________________
BE6039-11
3436i SF6 Detector
LumaSense Technologies A/S
Page 157 of 194
Chapter 12
______________________________________________________________________
have been completed the number (n) will also show 6 because the
results of the first and second measurements have been
overwritten by the 7th and 8th measurement results …and so on.
2. Let the Monitor continue measuring the zero gas until the
temperature in the cell is stable. Look at the print-out of the
average and standard deviation measurements for (1) the watervapour and (2) all the other filters. When all these values have
stabilised calibration measurements, do not need to continue.
Continue to the next step.
3. Press ↵ .
This causes the following text to appear on the screen:
A:
µ : 5.28 µV σ : 94 nV
6
38.4°C
PRESS ENTER WHEN RESULTS ARE STABLE
These results have been shown on the data-log print-out. If they
have stabilised continue to the next Step.
4. Repeat step 3 until the signals measured with all the filters have
been displayed, stabilised and been “accepted”.
The text CALCULATION. PLEASE WAIT appears on the screen.
The Monitor only uses the last six measurement results when
calculating any calibration factor. The concentration offset
factors calculated during zero-point calibration of the filters,
are related to the cell noise measured in the cell when each of the
filters is being used.
If any calibration data is uncertain or unacceptable an error
message (marked by an asterisk) will appear on the screen after
the calibration factors have been calculated. Whenever an asterisk
is shown on the screen further information about the condition of
the Monitor can be obtained by pressing INFO.
Chapter 13 lists all the error messages connected with uncertain
calibration results and gives an explanation of their significance so
that the user can ascertain what action to take if such messages
are displayed after calibration.
12.7
Humidity-interference Calibrations – Standalone Use
If it is only a newly-installed optical filter which needs to be
humidity-interference calibrated, then the same procedure used for a
zero-point calibration of the filter must be used, see section 12.5.1.
In this way you can protect your original humidity gain factors.
_____________________________________________________________________________
BE6039-11
3436i SF6 Detector
LumaSense Technologies A/S
Page 158 of 194
Chapter 12
______________________________________________________________________
12.7.1
Setting-up a Humidity-interference Calibration Task
Fig.12.12 Schematic diagram showing how to set-up a humidityinterference calibration task (follow the arrows)
To calculate the humidity gain factor for a filter (during a
humidity-interference calibration) it is necessary to have a
_____________________________________________________________________________
BE6039-11
3436i SF6 Detector
LumaSense Technologies A/S
Page 159 of 194
Chapter 12
______________________________________________________________________
concentration offset factor for the filter, and vice versa. Note: If
a concentration offset factor is not stored in each of the filter
banks which are active during a zero-point calibration, then it
is necessary to perform a combined zero-point and humidityinterference calibration task. The set-up of this combined task is
discussed in section 12.11.
If you only wish to set-up a humidity-interference calibration task the
procedure is as follows:
1.
For the installed filter, enter the no. of the filter bank where you
wish the Monitor to store the humidity gain factors which will
be calculated during the humidity-interference calibration task.
2.
Press MEASURE
displayed:
S3
S3
S1 then the following text will be
PERFORM ZERO-POINT CALIBRATION ?
NO
YES
3.
Follow the set-up of a humidity-interference calibration task by
following the black arrows in the schematic diagram shown in
Fig.12.12.
The following text will appear on the display:
HUM. INTERFERENCE. CONNECT CLEAN, WET AIR
AND PRESS ENTER WHEN READY
12.7.2
Performing a Humidity-interference Calibration
The general equipment necessary to perform a calibration task is
described in section 12.4 and illustrated in Fig.12.5.
The gas supply required during a humidity-interference calibration is
a supply of clean air containing a constant concentration of water
vapour.
1. Follow the procedure explained in section 12.4 from steps 1 to 3
inclusive and the continue as follows:
2.
a. Connect the outer end of the extra empty flask’s outlet tube
“B” to the Teflon tubing which is connected to attachment
point 3 of the “Y”-piece (see Fig.12.6).
Caution: the inner end of the empty-flask’s outlet tube “B” must
NEVER be covered by water.
b. Gently open the pressure-valve on the zero-gas cylinder.
_____________________________________________________________________________
BE6039-11
3436i SF6 Detector
LumaSense Technologies A/S
Page 160 of 194
Chapter 12
______________________________________________________________________
c. Press ↵ .
d. Use the pressure-valve on the zero-gas cylinder to regulate
the flow of gas so that when the Monitor’s pump is running
there is a positive flow of gas out of the flow meter. This will
ensure that the wet, zero gas is not contaminated by
atmospheric air.
The following text appears on the screen:
RESULTS NOT YET AVAILABLE
PLEASE WAIT
The Monitor draws in the clean, wet air and measures the signal in
the cell with the water-vapour filter as well as with all the other
installed filters. Once the first measurement result is available the
screen text illustrated above is replaced by a screen displaying
signal measured using the water-vapour filter – for example the
following:
W : µ : 340 µV σ :--- V
1
39.3°C
PRESS ENTER WHEN RESULTS ARE STABLE
As soon as measurement results are available they do not only
appear on the display but are automatically printed out on the
printer, if the monitor is set up to print a data-log. Remember to
turn off the data-log when the calibration is complete.
Each time a sample of gas is drawn into the analysis cell the
signal is measured using all the installed optical filters and the
water-vapour filter (“W”) but, due to lack of space on the display,
the Monitor first only displays the signal measured using the
water-vapour filter. The data-log print-out, however, shows the
signal measured using all installed filters as well as the watervapour filter.
A maximum of 6 measurements are stored in the Monitor during
any calibration. The number (n) indicates how many
measurements are stored. When 7 measurements have been
performed the number (n) will show the number 6 because the
very first measurement is overwritten by the 7th measurement so
that only 6 measurements are still stored. When 8 measurements
have been completed the number (n) will also show 6 because the
results of the first and second measurements have been
overwritten by the 7th and 8th measurement results …and so on.
3. Let the Monitor continue measuring the clean, wet air until the
temperature in the cell is stable. Look at the print-out of the
_____________________________________________________________________________
BE6039-11
3436i SF6 Detector
LumaSense Technologies A/S
Page 161 of 194
Chapter 12
______________________________________________________________________
average and standard deviation measurements for (1) the watervapour and (2) all the other filters. When all these values have
stabilised, calibration measurements do not need to continue.
Continue to the next Step.
4. Press ↵ .
This will cause the results of measurements made with all the
other installed filters to be displayed, for example:
A : µ : 19.34 µV σ : 212 nV
6
39.3°C
PRESS ENTER WHEN RESULTS ARE STABLE
These results have been printed out on the data-log printer. If
they have stabilised continue to the next Step.
5. Repeat step 4 until the signals measured with all the filters have
been displayed, stabilised and been “accepted”.
The text CALCULATING PLEASE WAIT appears on the screen.
The Monitor only uses the last six measurement results when
calculating any calibration factor. The humidity gain factors
calculated during humidity-interference calibration of the filters,
are a measure of the sensitivity of each filter to water-vapour interference.
If any calibration data is uncertain or unacceptable an error message
(marked by an asterisk) will appear on the screen after the
calibration factors have been calculated. Whenever an asterisk is
shown on the screen further information about the condition of the
Monitor can be obtained by pressing INFO.
Chapter 13 lists all the error messages connected with uncertain
calibration results and gives an explanation of their significance so
that you can ascertain what action to take if such messages are
displayed after calibration.
12.8
Span Calibration
Before calculating the conversion factor for a filter (during span
calibration) a concentration offset factor and a humidity gain
factor must be in the filter bank which is selected for the filter
during span calibration. Span calibration of a filter can therefore only
be done after the filter has already been zero-point and humidityinterference calibrated.
_____________________________________________________________________________
BE6039-11
3436i SF6 Detector
LumaSense Technologies A/S
Page 162 of 194
Chapter 12
______________________________________________________________________
During span calibration a supply of a particular gas (e.g. gas A1) of
known concentration is attached to the air-inlet of the Monitor and
the total signal in the cell is measured using the water-vapour filter
and the filter which is being span calibrated (for example “A”). As
filter “A” has already been calibrated for humidity interference, the
total signal (Vtotal) measured with filter “A” can be compensated for
any signal produced by water-vapour’s absorption of light from filter
“A” (VH2O) during the span calibration task. This means that your
span gas does not have to be perfectly dry. As the filter has already
been zero-point calibrated, the cell noise Voffset (when filter “A” is
used) is known, and therefore the span calibration curve can be
drawn (see Fig.12.13).
Fig.12.13
Curve showing a linear span-calibration curve
Choosing a filter bank
If a filter (e.g. “A”) has already been calibrated to measure a gas
(e.g. A1) and you wish to calibrate with gas A1 again, then select the
filter bank containing the gas conversion factor for gas A1. Online
users can do this when downloading the calibration factors. Standalone users should do this before setting-up and performing the span
calibration task. The gas conversion factor calculated during the
span calibration will then just overwrite the gas conversion factor
calculated during the previous span calibration of the filter with this
gas.
If you wish to span calibrate a filter to measure more than one gas,
then select a new filter bank each time you span calibrate with a
_____________________________________________________________________________
BE6039-11
3436i SF6 Detector
LumaSense Technologies A/S
Page 163 of 194
Chapter 12
______________________________________________________________________
different gas. In this way the conversion factor for each gas is
stored in separate filter banks (for stand-alone use see Fig.12.8).
The gas conversion factor stored in the selected filter bank during
a span calibration task will be overwritten by the new gas
conversion factor calculated during the span calibration of the
filter.
Gas to be Used During Span Calibration
The gas you need to use during span calibration must be the gas you
wish to measure with the filter.
Type of Span Calibration – Single-point or Two-point?
Fig.12.14a Graph showing a non- linear span-calibration curve which can
be plotted using the signals measured during a two-point span
calibration task
_____________________________________________________________________________
BE6039-11
3436i SF6 Detector
LumaSense Technologies A/S
Page 164 of 194
Chapter 12
______________________________________________________________________
Fig.12.14b Graph showing a non- linear measurement curve
The question about whether to perform a single- or a two-point span
calibration is difficult to answer, as it is dependent on how linear the
relationship is between a gas’s concentration and the signal it
produces in the cell (see Fig.12.13, Fig.12.14a and Fig.12.14b).
However, we can give you some guidelines on whether you have to
perform a single- or a two-point span-calibration.
•
Single-point calibration should be used when you wish to measure
in the linear range. We define the linear range as the dynamic
concentration range in which you can measure with an error of
5% of the real concentration (this is illustrated in Fig.12.14b). For
the most common gases, the linear range is from its detection
limit and up to 10 000 times its detection limit.
•
Two-point calibration is recommended to be used when you wish
to measure in the non-linear range and when you wish to
measure over a dynamic range of 100 000.
Gas Concentrations – Single-point Calibration
If a single-point span-calibration is performed then the span gas
should have a concentration which is at least 100 times its detection
limit and preferable not more than the highest concentration you
expect to measure.
For certain gases it can be inexpedient to use a concentration of at
least 100 times its detection limit, e.g. if you wish to measure a
poisonous gas with a high detection limit, it would be natural to use
a lower concentration. However, this means that the noise and
vibration will have a larger influence on the calibration. This must,
therefore, be taken into account when considering using a lower
concentration.
_____________________________________________________________________________
BE6039-11
3436i SF6 Detector
LumaSense Technologies A/S
Page 165 of 194
Chapter 12
______________________________________________________________________
Gas Concentrations – Two-point Calibration
During a two-point span calibration, the total signal in the cell (Vlow)
is measured first with a low concentration (Clow) of span gas, and
then the total signal in the cell (Vhigh) is measured with a high
concentration (Chigh) of span gas. This enables the Monitor to
compensate for any un-linearity in the relationship between the
signal measured in the cell and the concentration of the gas in the
cell (this is illustrated, for a gas A1, in Fig.12.14a).
Here are some guidelines about the concentration of gas you should
use during a two-point span calibration:
•
The Low Concentration should be 10 to 30% of the highest
concentration you expect to measure.
If the desired measurement range is mainly within the linear
range then the low concentration should be between 1000 and 10
000 times the detection limit.
If the desired measurement range is mainly above the linear
range then the low concentration should be more than 10 000
times the detection limit.
•
The High Concentration should be 75% to 100% of the highest
concentration you expect to measure, but no higher than this.
Simple Test to Determine the Linearity
Let us assume that you wish to measure a gas over a dynamic range
from 100 ppm and 3000 ppm of a gas that has a detection limit of
0.3 ppm.
In this case, the range in which you want to measure is from 333
times to 10 000 times the detection limit. With our general
guidelines, you’re not able to decide whether you have to perform a
single- or two-point calibration. Therefore, we advise you to perform
the following test:
1. Perform a single-point calibration with a low concentration of the
gas. Use 10% of the highest expected concentration level. In this
case, use 300 ppm (1000 times the detection limit).
2. Perform a measurement with a high concentration of the gas.
Use, for example, 90% of the highest expected concentration
level. In this case, use 2700 ppm.
If the measured gas concentration differs by more than 5% from the
real concentration, then a two-point calibration with 2 gas
concentrations is recommended.
_____________________________________________________________________________
BE6039-11
3436i SF6 Detector
LumaSense Technologies A/S
Page 166 of 194
Chapter 12
______________________________________________________________________
In the example in Fig.12.14b, we have measured 2400 ppm with
2700 ppm gas. This gives an error of 11% and an even greater error
at the highest concentration level.
12.8.1
Setting-up a Span Calibration – Stand-alone Use
Fig.12.15
Schematic diagram showing how to set-up a span
calibration task (follow the arrows)
_____________________________________________________________________________
BE6039-11
3436i SF6 Detector
LumaSense Technologies A/S
Page 167 of 194
Chapter 12
______________________________________________________________________
1. For each filter being span calibrated, enter the No. of the filter
bank where you wish the Monitor to store the conversion
factors which will be calculated during the span calibration task.
2. Press MEASURE
displayed:
S3
S3
S1 then the following text will be
PERFORM ZERO-POINT CALIBRATION?
NO
YES
3.
If you only wish to span calibrate filters, follow the set-up of a
span calibration task by following the black arrows in the
schematic diagram shown in Fig.12.15.
The following text will appear on the display:
CONNECT (the name of the gas appears here)
XXXXXXmg/m3
AND PRESS ENTER WHEN READY
Note: if the gas concentration on the “Analysis Certificate” is given in
ppm then the following formula can be used to convert from parts
per million units (ppm) to mg/m3:
For a gas at 20°C and at 1 atmosphere pressure:
Concentration (in mg/m3) =
12.8.2
Concentration (in ppm) x Molecular Weight (in g)
24,04
Performing a Span Calibration – Stand-alone Use
The general equipment necessary to perform a calibration task is
described in section 12.4. Follow the procedure from step 1 to step 3
inclusive and then continue as follows:
1.
a. Connect the free-end of the Teflon tubing mentioned in step 3
to the pressure valve on a cylinder of calibration gas.
b. Press ↵ .
c. Gently open the pressure-valve on the gas cylinder and
regulate the flow of gas so that when the Monitor’s pump is
_____________________________________________________________________________
BE6039-11
3436i SF6 Detector
LumaSense Technologies A/S
Page 168 of 194
Chapter 12
______________________________________________________________________
running there is a positive flow of gas out of the flow meter.
This will ensure that the calibration gas is not diluted by
atmospheric air.
The following text appears on the screen:
RESULTS NOT YET AVAILABLE
PLEASE WAIT
Once the first measurement result is available the screen text
illustrated above is replaced by a screen displaying the
measurement results – for example the following:
W : µ : 5.34 µV σ : 212 nV
3
40.4 °C
PRESS ENTER WHEN RESULTS ARE STABLE
As soon as measurement results are available, they not only
appear on the display (see Fig.12.11) but are automatically
printed out on the printer, if the Monitor has been set up to print
a data log, see section 10.5. Remember to turn off the data log
when the calibration is complete.
Each time a sample of gas is drawn into the analysis cell the
signal is measured using both optical filter “A” and the watervapour filter (“W”) but, due to lack of space on the display, the
Monitor only displays the signal measured using the water-vapour
filter. The data-log print-out, however, shows the signal measured
using both the water-vapour filter and filter “A”.
A maximum of 6 measurements are stored in the Monitor during
any calibration. The number (n) indicates how many
measurements are stored. When 7 measurements have been
performed the number (n) will show the number 6 because the
very first measurement is overwritten by the 7th measurement so
that only 6 measurements are still stored. When 8 measurements
have been completed the number (n) will also show 6 because the
results of the first and second measurements have been
overwritten by the 7th and 8th measurement results …and so on.
2. Let the Monitor continue measuring the span gas A until the
temperature is stable. Look at the print-put of the average and
standard deviation measurements for (1) the water-vapour and
(2) the filter “A”. When these values have stabilised for both
filters, span calibration measurements do not need to continue.
3. Press ↵ .
This causes the following text to appear on the screen:
_____________________________________________________________________________
BE6039-11
3436i SF6 Detector
LumaSense Technologies A/S
Page 169 of 194
Chapter 12
______________________________________________________________________
A : µ : 123.8 μV σ : 617 nV
6
40.4 °C
PRESS ENTER WHEN RESULTS ARE STABLE
These results have been shown on the data-log print-out. If they
have stabilised continue to the next Step.
4. Press ↵ .
The text CALCULATING CALIBRATION FACTORS – PLEASE
WAIT appears on the screen.
The Monitor only uses the last six measurement results when
calculating any calibration factor. The conversion factor (in mg/m3
per volt), which is calculated during a span calibration, is the factor
which allows the Monitor to relate the signal produced by the gas to
the concentration of gas in the cell.
If any calibration data is doubtful or unacceptable an error message
(marked by an asterisk) will appear on the screen after the
calibration factors have been calculated. Whenever an asterisk is
shown on the screen further information about the condition of the
Monitor can be obtained by pressing the INFO button.
Chapter 13 lists all the error messages connected with doubtful
calibration results and gives an explanation of their significance so
that the user can ascertain what action to take if such messages are
displayed after calibration.
12.9
Calibration of the Water-vapour Filter – Standalone Use
The water-vapour filter has two different functions. Its most
important function is to enable any measured signal to be
compensated for water-vapour interference. Its other function is to
measure the absolute concentration of water-vapour in air samples.
If you only wish to use the water-vapour filter to compensate for
water-vapour interference, then it only has to be zero-point
calibrated. If you wish to use it to measure the absolute
concentration of water vapour in air samples then it has to be zeropoint calibrated and span calibrated.
It is vitally important to accurately zero-point calibrate the watervapour filter as this influences the Monitor’s ability to compensate for
interference from water vapour. This demands that the zero-gas you
use during the zero-point calibration of the filter must be perfectly
dry.
_____________________________________________________________________________
BE6039-11
3436i SF6 Detector
LumaSense Technologies A/S
Page 170 of 194
Chapter 12
______________________________________________________________________
12.9.1
Setting-up a Zero-point Calibration of the Watervapour Filter
If you wish to zero-point calibrate the water-vapour filter you must
zero-point calibrate all installed optical filters. The concentration
offset factors calculated during zero-point calibration of the filter
“A” will be stored in the filter banks (the active during calibration).
Check, therefore, that you make the relevant filter bank active for
the filter before calibrating it. This is discussed in more detail in
section 12.3.3.
The procedure for setting-up a zero-point calibration of the watervapour filter is as follows:
1. Press Measure
displayed:
S3
S3
S1 then the following text will be
PERFORM ZERO-POINT CALIBRATION ?
NO
YES
2. Follow the set-up of a zero-point calibration of the water-vapour
filter by following the black arrows in the schematic diagram
shown in Fig.12.16.
The following text will appear:
ZERO-POINT CALIB. CONNECT CLEAN, WET AIR
AND PRESS ENTER WHEN READY
_____________________________________________________________________________
BE6039-11
3436i SF6 Detector
LumaSense Technologies A/S
Page 171 of 194
Chapter 12
______________________________________________________________________
Fig.12.16 Schematic diagram showing how to set-up a zero-point
calibration task for the water-vapour filter (follow the arrows)
_____________________________________________________________________________
BE6039-11
3436i SF6 Detector
LumaSense Technologies A/S
Page 172 of 194
Chapter 12
______________________________________________________________________
12.9.2
Performing a Zero-point Calibration of the Watervapour Filter
As explained in the previous section, a zero-point calibration of the
water-vapour filter has to be done together with the zero-point
calibration of the other installed optical filters. The latter task has
been fully described in section 12.6. It is worth-while to emphasise
again that it is vitally important to use perfectly dry zero-gas (that
is, zero-gas which contains 0% water-vapour) during this calibration.
Note that during the zero-point calibration of filter “A” (task 1,
shown below), and during the combined zero-point calibration of
filter “A” and the water-vapour filter (task 2, shown below), a zerogas supply is attached to the air-inlet of the Monitor. The Monitor
measures the signal in the cell using the water-vapour filter and the
other installed optical filter. Signals measured with filter “A” enable
the concentration offset factors for filter “A” to be stored in the
filter bank which is active during calibration. However, the signal
measured with the water-vapour filter is used differently:
In Task 1:
The signal measured with the water-vapour filter is used to
compensate all measured signals for any interference caused by the
presence of any residual water-vapour in the zero-gas supply.
In Task 2:
The signal measured with the water-vapour filter is used to update
the concentration offset factor for the water-vapour filter. This
means that the signals measured with filter “A” be compensated for
the presence of any water vapour present. This is why it is vitally
important to use perfectly dry zero-gas during this task.
Please refer to section 12.6.2 for details about how to perform a
zero-point calibration task.
12.9.3
Setting-up a Span Calibration of the Water-vapour
Filter
Remember that span calibration of the water-vapour filter is only
necessary if you wish to measure the absolute concentration of water
vapour in air samples. If the water-vapour filter is not span
calibrated you will not be able to measure the concentration of water
vapour in gas samples during a monitoring task.
Before the water-vapour filter can be span calibrated, it has to be
zero-point calibrated, that is, a concentration offset factor for the
_____________________________________________________________________________
BE6039-11
3436i SF6 Detector
LumaSense Technologies A/S
Page 173 of 194
Chapter 12
______________________________________________________________________
water-vapour filter must be stored in the Monitor’s calibration data
block.
During span calibration of the water-vapour filter it is necessary to
attach a supply of zero-gas containing a known concentration of
water vapour to the Monitor. As explained in the Humidityinterference Calibration (Section 12.7.2) it is important to use watervapour whose concentration is below the saturated vapour pressure
of water-vapour at the temperature of the room where calibration is
to be performed, otherwise water-vapour will condense out in the
analysis cell and damage it.
Before setting-up the span calibration of the water-vapour filter go
into Set-Up mode and select “Tdew” as a humidity unit. Then when
you have to enter the concentration of the water-vapour you will use
during calibration. Always use water concentrations at least 2°C
below the ambient room temperature. For example, if the ambient
room temperature is 20°C then you can ENTER WATER-VAPOUR
CONC as 18°Tdew.
The procedure for setting-up a span calibration of the water-vapour
filter is as follows:
1.
Press Measure
displayed:
S3
S3
S1 then the following text will be
PERFORM ZERO-POINT CALIBRATION ?
NO
YES
2.
Follow the set-up of a span calibration of the water-vapour filter
by following the black arrows in the schematic diagram shown
in Fig.12.17.
The following text will appear:
CONNECT WATER-VAPOUR
18.0 Tdew
AND PRESS ENTER WHEN READY
_____________________________________________________________________________
BE6039-11
3436i SF6 Detector
LumaSense Technologies A/S
Page 174 of 194
Chapter 12
______________________________________________________________________
Fig.12.17 Schematic diagram showing how to set-up a span
calibration task for the water-vapour filter (follow the arrows)
_____________________________________________________________________________
BE6039-11
3436i SF6 Detector
LumaSense Technologies A/S
Page 175 of 194
Chapter 12
______________________________________________________________________
12.9.4
Performing a Span Calibration of the Water-vapour
Filter
Section 12.4.1 describes a good method of producing water-vapour
of known concentration. The directions for performing a span
calibration of water-vapour filter are similar to those for performing a
humidity-interference calibration of the other installed filters is as
described in section 12.7.2. In both calibration tasks the signal in the
cell is measured when a supply of zero gas containing a constant
concentration of water vapour is attached to the Monitor. There are,
however, two differences:
1. During a humidity-interference calibration the signal is measured
using the installed filter (including the water-vapour filter),
whereas during the span calibration of the water-vapour filter the
signal is only measured with the water-vapour filter.
2. During a humidity-interference calibration, it is not necessary to
know the concentration of water-vapour supplied to the cell as it
is only necessary to measure the size of each signal (with filter
“A”) relative to the size of the signal measured with the watervapour filter. However, during a span calibration of the watervapour filter it is necessary to know the exact concentration of
water-vapour supplied to the cell, because during this calibration
the conversion factor is calculated. This factor relates the
measured signal to the concentration of water-vapour in the cell.
Follow the procedure described in section 12.7.2.
12.10
Setting-up
a
Combined
Zero-point
and
Humidity-interference Calibration – Standalone Use
We have explained in previous sections of this chapter (section 12.6
and section 12.7.1) that a zero-point calibration can only be
performed alone if a humidity gain factor is already stored in the
filter bank which are active during the zero-point calibration task.
Likewise, a humidity-interference calibration can only be performed
alone if a concentration offset factor is already stored in the filter
bank which is active during the humidity-interference calibration
task.
If the necessary calibration factors are not stored in the Monitor’s
memory, a zero-point calibration task has to be performed together
with a humidity-interference calibration task.
_____________________________________________________________________________
BE6039-11
3436i SF6 Detector
LumaSense Technologies A/S
Page 176 of 194
Chapter 12
______________________________________________________________________
The procedure for setting-up a combined zero-point and humidityinterference calibration task is as follows:
Fig.12.18 Schematic diagram showing how to set-up a combined
zero-point and humidity-interference calibration task (follow the
arrows)
_____________________________________________________________________________
BE6039-11
3436i SF6 Detector
LumaSense Technologies A/S
Page 177 of 194
Chapter 12
______________________________________________________________________
1. Press Measure
displayed:
S3
S3
S1 then the following text will be
PERFORM ZERO-POINT CALIBRATION ?
NO
YES
2. Follow the set-up of a combined zero-point and humidityinterference calibration by following the black arrows in the
schematic diagram shown in Fig.12.18.
The following text will appear:
ZERO-POINT CALIB. CONNECT CLEAN, DRY AIR
AND PRESS ENTER WHEN READY
3. Refer to section 12.6.2 for the practical details of a zero-point
calibration task.
When the zero-point calibration task is complete, the following text
appears on the screen:
HUM. INTERFERENCE. CONNECT CLEAN, DRY AIR
AND PRESS ENTER WHEN READY
4. Refer to Section 12.7.2 for the practical details of a humidityinterference calibration task.
12.11
Setting-up any Combined Calibration – Standalone Use
Although we have separated the various calibration tasks and
described how to set them up and perform them alone, it is, of
course possible to set-up any combination of calibration tasks, for
example, that combining the zero-point and humidity-interference
calibration tasks described in Section 12.11.
After setting-up any combined calibration task, the Monitor responds
by telling you about which gas supply is required for each calibration
task.
When the combined calibration task is complete,
CALCULATING. PLEASE WAIT appears on the screen.
the
text
If any calibration data is uncertain or unacceptable an error message
(marked by an asterisk) will appear on the screen after the
calibration factors have been calculated. Whenever an asterisk is
_____________________________________________________________________________
BE6039-11
3436i SF6 Detector
LumaSense Technologies A/S
Page 178 of 194
Chapter 12
______________________________________________________________________
shown on the screen further information about the condition of the
Monitor can be obtained by pressing INFO.
Chapter 13 lists all the error messages connected with uncertain
calibration results and gives an explanation of their significance so
that the user can ascertain what action to take if such messages are
displayed after calibration.
_____________________________________________________________________________
BE6039-11
3436i SF6 Detector
LumaSense Technologies A/S
Page 179 of 194
Chapter 13
______________________________________________________________________
Chapter 13
Messages Related to Calibration
April 2015
_____________________________________________________________________________
BE6039-11
3436i SF6 Detector
LumaSense Technologies A/S
Page 180 of 194
Chapter 13
______________________________________________________________________
All the possible error messages connected with calibration results are
discussed in this chapter. Messages fall into three calibration
categories: (1) successful; (2) uncertain and (3) invalid. An
explanation is given of each message and its significance so that the
user can ascertain what action to take if such messages are displayed
after calibration.
13.1
“Successful” Calibration Messages
The messages listed below indicate (1) that the calibration task you
have just performed has been successful, and (2) that the calibration
factor calculated during the calibration task has been stored in the
filter bank which was selected/active during the calibration task.
ZERO-POINT CALIBRATION SUCCESSFUL
HUM. INTERFERENCE CALIBRATION SUCCESSFUL
ZERO-POINT/HUM. INTERF. CALIB. SUCCESSFUL
GAS X* SINGLE-POINT CALIBRATION SUCCESSFUL
GAS X* TWO-POINT CALIBRATION SUCCESSFUL
Where Gas X is the gas used during the span calibration of the filter
installed in position “X” of the filter carousel (Where: X = “A” or “W”).
13.2
“Successful *” Calibration Messages
The messages listed below indicate (1) that the calibration task you
have just performed is perhaps not as good as can be expected; (2)
that the calibration factor which has just been calculated has been
stored in the filter bank which was active during the calibration task;
and (3) that you will have to judge the validity of the calibration. If
you judge it to be invalid then the task will have to be repeated so
that the calibration factor stored in the filter bank can be overwritten
by a new and valid factor.
You can find out why there is uncertainty about the validity of the
calibration factor by pressing INFO.
The messages displayed when INFO is used are discussed in section
13.4.
ZERO-POINT CALIBRATION SUCCESSFUL*
HUM. INTERFERENCE CALIBRATION SUCCESSFUL*
ZERO-POINT/HUM. INTERF. CALIB. SUCCESSFUL*
GAS X* SINGLE-POINT CALIB. SUCCESSFUL*
GAS X* TWO-POINT CALIBRATION SUCCESSFUL*
_____________________________________________________________________________
BE6039-11
3436i SF6 Detector
LumaSense Technologies A/S
Page 181 of 194
Chapter 13
______________________________________________________________________
13.3
“Invalid” Calibration Messages
The messages listed below indicate: (1) that the calibration factor
calculated during the calibration task you have just performed is not
valid and therefore has not been stored in any filter bank; and (2) that
the calibration task must therefore be repeated.
ZERO-POINT CALIBRATION INVALID*
HUM. INTERFERENCE CALIBRATION INVALID*
ZERO-POINT/HUM. INTERF. CALIB. INVALID*
GAS X* SINGLE-POINT CALIB. INVALID*
GAS X* TWO-POINT CALIBRATION INVALID*
13.4
Error Messages Displayed when the INFO
button is used
All “successful*” or “invalid” calibration messages are marked with an
asterisk (*) which tells you that more detailed information about the
calibration can be obtained by pressing INFO. The messages
displayed when INFO is pressed are listed and explained below.
13.4.1
“Invalid” Error Messages
MISSING MEASUREMENT DATA
This message indicates that the Monitor does not have the necessary
data to calculate absolutely valid calibration factors. This situation
could, for example, be caused by too much noise in the analysis
chamber. The calibration task will have to be repeated.
WATER VAPOUR MEASUREMENT < OFFSET
This message is associated with either (1) a span calibration of the
water-vapour filter, or (2) a humidity-interference calibration.
This message indicates that the signal measured with a particular
filter, when water-vapour of known concentration is in the analysis
cell, is less than the signal measured in the cell when zero-gas is in
the cell. This could indicate either:
•
•
That the gas used during the zero-point calibration of the filter was
not dry;
or
That the water vapour used during either the span calibration of the
water-vapour filter; or the humidity-interference calibration, was
not wet enough.
_____________________________________________________________________________
BE6039-11
3436i SF6 Detector
LumaSense Technologies A/S
Page 182 of 194
Chapter 13
______________________________________________________________________
WET MEAS. < DRY MEAS. FOR WATER FILTER
and
HUMIDITY INTERFERENCE FACTOR < 0
Both these messages are associated with a combined zero-point and
humidity-interference calibration task.
WET MEAS. < DRY MEAS. FOR WATER FILTER
HUMIDITY INTERFERENCE FACTOR < 0
During the zero-point calibration task the signal is measured when
dry, zero gas is in the cell – this is a measure of the noise in the cell
when a particular optical filter is used. This measurement allows the
concentration offset factor for the particular filter to be calculated.
During the humidity-interference calibration task the signal in the cell
when a particular optical filter is used is measured when wet, zero gas
is in the cell – this signal is compared with the signal measured with
the water-vapour filter to give the humidity gain factor. The above
message is given if the humidity gain factor is found to be less than
zero. This could indicate that the zero-gas you used during the zeropoint calibration was not dry, or alternatively that the concentration of
water-vapour you used during the humidity-interference calibration
was too low.
GAS X: CALIBRATION FACTOR LESS THAN 0
This message is associated with a single-point span calibration task.
The gas conversion factor calculated during the single-point span
calibration task is found to be less than zero. This could indicate that
the concentration of gas used during the calibration was too low.
GAS X: LOW MEAS. > HIGH MEAS.
GAS X: MEAS. INDICATES LINEAR COHERENCE
GAS X: MEAS. DOES NOT FIT NON-LINEAR CURVE
GAS X: CALIBRATION IMPOSSIBLE: MAX ITER.
All these messages are associated with a two-point span calibration
task.
During a two-point span calibration the signal (Vhigh) is measured
when the gas concentration Chigh is in the cell, and the signal (Vlow) is
measured when the gas concentration Clow is in the cell (see section
12.8).
_____________________________________________________________________________
BE6039-11
3436i SF6 Detector
LumaSense Technologies A/S
Page 183 of 194
Chapter 13
______________________________________________________________________
Fig.13.1
Curve illustrating the two points measured during a twopoint span calibration task
GAS X: LOW MEAS. > HIGH MEAS.
This message indicates that the signal measured in the cell when the
gas concentration was low is found to be greater than the signal when
the gas concentration was high.
The above message could indicate that the span gas concentrations
were incorrectly “entered” when the task was set-up (that is, the
“entered” low gas concentration was actually greater than the
“entered” high gas concentration). Alternatively, it could indicate that
the concentration of the gas supplied to the Monitor during the
measurement of Vlow was actually the high concentration (Chigh) and
vice versa.
The signals Vhigh and Vlow have to be corrected for water-vapour
interference and cell noise, that is:
Vhigh – Voffset – VH2O = Vh;
and:
Vlow – Voffset – VH2O = Vl
These two points (Vh, Ch) and Vl, Cl) can then be plotted on a graph
(see Fig.13.1).
_____________________________________________________________________________
BE6039-11
3436i SF6 Detector
LumaSense Technologies A/S
Page 184 of 194
Chapter 13
______________________________________________________________________
When the two signals have been measured, the Monitor then finds the
value δ = 1% of Vh and finds out the relationship between the
measured values:
If there is a perfectly linear relationship between the points Clow, Vlow
and Chigh, Vhigh then:
Vlin = ( Ch / Cl ) * Vl
GAS X: MEAS. INDICATES LINEAR COHERENCE
This message will be given in the status display if Vl lies between the
values Vlin – δ and Vlin + δ. This indicates that the two gas
concentrations you have chosen lie in the linear region of the
calibration curve. If the high concentration of gas you used (Chigh) is
equal to or greater than the highest concentration you expect to
measure, then it is not necessary to use a two-point span calibration,
a single-point span calibration using Chigh as the concentration of span
gas used will be sufficient to give you a good calibration result.
However, if the high concentration of gas you used is less than the
highest gas concentration you expect to measure, the two-point span
calibration task should be repeated using a high concentration which is
equal to or greater than the highest concentration you expect to
measure. There will therefore be a better chance to find a point in the
non-linear region of the span calibration curve so that any nonlinearity can be plotted.
GAS X: MEAS. DOES NOT FIT NON-LINEAR CURVE
This message will be given in the status display if Vl is less than Vlin –
δ. This message indicates that a two-point span calibration cannot be
performed.
If Vl is found to be greater than Vlin + δ then the Monitor will try to fit
the two measured points onto a curve, whose shape has been predetermined by LumaSense, by an iterative process. The iterative
process involves scaling on the concentration and signal axes until the
two points fit the curve within certain tolerances.
GAS X: CALIBRATION IMPOSSIBLE: MAX ITER.
If after 255 iterative processes, the two points cannot be fitted onto
the curve within tolerance limits, this message is displayed.
This could indicate that the wrong concentration has been “entered” in
the set-up of the span calibration task (which does not relate to the
measured signal). Alternatively, it could indicate that there is a linear
_____________________________________________________________________________
BE6039-11
3436i SF6 Detector
LumaSense Technologies A/S
Page 185 of 194
Chapter 13
______________________________________________________________________
relationship between the gas signal in the cell and the concentration of
the gas (in which case only a single-point span calibration is required).
SPAN CALIBRATION IMPOSSIBLE
This message is associated with the span calibration of the watervapour filter.
The above message indicates that the Monitor cannot calculate the
gas conversion factor. This could indicate that the concentration of
water-vapour used during the calibration was too low – this could
either be due to an incorrectly “entered” water-vapour concentration
in the set-up of the span calibration or that the concentration of
water-vapour used was not the same as that which was “entered” in
the set-up.
13.4.2
“Successful*” Error Messages
WATER VAP. MEAS. < OFFSET MEAS
This message is associated with one, or more, of the following
calibration tasks: (1) the one- or two-point span calibration of an
optical filter; ; (2) the zero-point calibration of all the installed optical
filter (“A” ).
During all the above-listed calibration tasks, the signal in the cell is
measured using the water-vapour filter: this enables the Monitor to
compensate for any interference signal produced by the presence of
any water-vapour in the span gas being used. If the signal in the cell
using the water-vapour filter is found to be less than the concentration offset factor for the water-vapour filter, the above message
is sent.
This could indicate that the zero gas you used, during the zero-point
calibration of the water-vapour filter, was not perfectly dry.
SPAN MEASUREMENT TOO LOW
This message is associated with the span calibration of one (or more)
of the filters.
The above message indicates that the signal measured in the cell
during span calibration is less than 3µV and therefore cannot be used
to obtain a good calibration. This means that the concentration of your
span gas is too low.
_____________________________________________________________________________
BE6039-11
3436i SF6 Detector
LumaSense Technologies A/S
Page 186 of 194
Chapter 13
______________________________________________________________________
SIGNIFICANT CHANGE IN CALIB. FACTORS
This message is associated with the span calibration of one (or more)
of the filters.
The above message indicates that the Conversion factor calculated
during span calibration of a particular filter deviates more than 15%
from the Conversion factor calculated during the last span
calibration of this filter. If you are absolutely sure that the previous
span calibration of this filter was correctly performed then this
message could indicate:
1. That you have “entered” the wrong concentration for the span-gas
in the span calibration set-up.
2. That the concentration of your span gas is not correctly quoted on
its “Analysis Certificate”.
3. That there is a leak in the tubing/fittings in your calibration
equipment, which alters the concentration of the span gas
reaching the cell.
HIGH CONC. SPAN MEASUREMENT TOO LOW
This message is associated with a two-point span calibration task.
The above message indicates that the signal measured during span
calibration, when the high concentration of span gas is in the cell, is
less than 15µV. This means that the “high” concentration of span gas
is too low.
LOW CONC. SPAN MEASUREMENT TOO LOW
This message is associated with a two-point span calibration task.
The above message indicates that the signal measured during span
calibration, when the low concentration of span gas is in the cell, is
less than 3µV. This means that the “low” concentration of span gas is
too low.
_____________________________________________________________________________
BE6039-11
3436i SF6 Detector
LumaSense Technologies A/S
Page 187 of 194
Chapter 14
____________________________________________________________________
Chapter 14
Warning and Error Messages
April 2015
_____________________________________________________________________________
BE6039-11
3436i SF6 Detector
LumaSense Technologies A/S
Page 188 of 194
Chapter 14
____________________________________________________________________
When the Monitor is switched on, and while it is being operated, the
Monitor regularly performs a series of self-tests, which check that the
various mechanical, electrical and electronic components of the
Monitor are functioning correctly. These self-tests are described in
more detail in Chapter 5. You can select to disable the regular selftests if desired (see section 5.4.3). If any component is found to be
functioning outside of its specifications either a “Warning” or a
“Operating-error” message will appear on the gas monitor’s screen.
Please note: A “Warning” and/or “Operating-error” message will
only be displayed once. If the fault is still found to be present during
the next regular self-test the message will not be displayed again.
Messages are only displayed when a fault is first detected. If the fault
corrects itself and then is later found to be faulty the message will be
displayed again. It is therefore important to note the message before
pressing the INFO button, which will cause the error message to be
removed from the display.
Although the message is removed from the screen, any gas
measurements performed while the fault is still present will be
marked with an asterisk (*). By pressing INFO when such a
measurement is displayed, the Common mark “O” and/or “W”,
and in some cases, the Gas Mark “F” and Gas Mark “A” will be
shown on the display.
On the following pages, all possible “Warning” messages are listed;
all possible “Operating-errors” messages are listed; and all possible
“Interface-error” messages are listed. There is a description of each
fault as well as the possible cause(s) of each fault. The user must
evaluate the significance of each message. As long as the fault is
detected, all measurements will be marked by an asterisk. Some
“faults” are easily corrected.
_____________________________________________________________________________
BE6039-11
3436i SF6 Detector
LumaSense Technologies A/S
Page 189 of 194
Chapter 14
____________________________________________________________________
Warning and Error Messages
The following table gives most of the error and warning messages
contained in the test Hierarchy of the Monitor. There is a description of
each fault as well as the possible cause of each fault. The user must
evaluate the significance of each message.
Warning Messages
AIR FLOW TOO LOW
AIRWAY-SYSTEM BLOCKED
ALARM LIMIT EXCEEDED
NO INDEX MARK FROM FILTER
CAROUSEL
Description of Fault
The air pressure difference
created by the pump in the
pneumatic (airway) system
(tubes and/or analysis cell)
is too low. This means that
the tubing and/or analysis
cell cannot be properly
flushed out and the sample
in the analysis cell is
therefore not necessarily
“new”
The air pressure difference
created by the pump in the
pneumatic ( airway)
system ( tubes and/or
analysis cell) is too high
Possible Cause
1. The length of
the sampling
tube attached to
the Monitor’s
inlet has been
incorrectly
entered.
2. Either the
external or
internal
pneumatic
system is not
air-tight
3. The pump is
defective
4. This might also
indicate a too
high inlet
pressure.
1. The Air inlet is
blocked.
2. Air Filter DS0759
blocked.
The Monitor has measured
a concentration of gas
greater than the alarm
limit concentration entered
The Monitor cannot
determine the position of
its filter carousel
1. The motor that
drives the filter
carousel is not
working
2. The optical
detector that
checks the
movement of
the carousel is
not working
3. The filter
carousel has not
been properly
mounted
_____________________________________________________________________________
BE6039-11
3436i SF6 Detector
LumaSense Technologies A/S
Page 190 of 194
Chapter 14
____________________________________________________________________
CLOCK SET TO DEFAULT ERROR
DETECTED IN CLOCK SETTINGS
FACTORS SET TO DEFAULT ERROR
DETECTED IN CALIBRATION
FACTORS
MEMORY SET TO DEFAULT ERROR
DETECTED IN BACKGROUND MEMORY
MEMORY SET TO DEFAULT ERROR
DETECTED IN DISPLAY MEMORY
MEMORY SET TO DEFAULT ERROR
DETECTED IN INTERNAL MEMORY
MEMORY SET TO DEFAULT ERROR
DETECTED IN SOURCE MEMORY
PARAMETERS SET TO DEFAULT
ERROR DETECTED IN
CONFIG:/FORMAT PARAMETER
PARAMETERS SET TO DEFAULT
ERROR DETECTED IN THE TASK
SET_UP PARAMETER
The Monitor’s internal
clock was found to be
incorrectly set so these
values have been set to
their default values
An error has been found in
the data stored in the
Calibration Factor part of
the Monitor’s memory, so
these factors have been
set to their default values
An error has been detected
in the Monitor’s
Background Memory, so
the Monitor automatically
deletes all data stored in
this Memory
An error has been detected
in the Monitor’s Display
Memory, so the Monitor
automatically deletes all
data stored in this
memory.
An error has been found in
the data stored in the
Monitor’s internal memory.
data stored in this memory
cannot be read or altered
by the user, so the Monitor
automatically corrects any
errors found in this
memory
An error has been found in
the data stored in the
Monitor’s source memory,
so the Monitor
automatically gives stored
parameters default values.
An error has been found in
the value parameters
stored in the Configuration
and/or Format branches of
the Monitor’s set-up tree,
and therefore the Monitor
has automatically given
these parameters default
values
An error has been found in
the value parameter stored
in the Monitoring Task
branch of the Monitor’s
set-up tree, and has
automatically given these
parameters default values.
A new battery has
been installed
1. A defective
back-up battery
2. A defective
Working Memory
(RAM) or Source
Memory
(EEPROM)
3. A Software fault
1. A defective
back-up battery
2. A defective
Working
memory ( RAM )
3. A software fault
1. A defective
back-up battery
2. A defective
Working Memory
( RAM )
3. A software fault
1. A defective
back-up battery
2. A defective
Working Memory
( RAM)
3. A software fault.
1. A defective
back-up battery
2. A defective
Source Memory
( EEPROM)
3. A software fault
1. A defective
back-up battery.
2. A defective
Working Memory
(RAM)
3. A software fault.
1. A defective
back-up battery
2. A defective
Working Memory
(RAM)
3. A software fault.
_____________________________________________________________________________
BE6039-11
3436i SF6 Detector
LumaSense Technologies A/S
Page 191 of 194
Chapter 14
____________________________________________________________________
X-ON/X-OFF HANDSHAKE CONFLICT
The Monitor receives the
handshake signal from the
RS232 CTS ( clear to send)
line, but it has not been
set-up to use this CTS line
TIMEOUT. DEVICE NOT CONNECTED
Monitor wishes to send
data
(data-log or
error-log) via the IEEE
interface, but there is no
response from the device
with the address entered
in the Monitor set-up
TIMEOUT. DEVICE NOT READY
Monitor wishes to send
data
(print, data-log or errorlog) but after the start of
data transmission, the
device stops receiving
data.
The Monitor and
RS232 device
(printer) do not
agree about which
handshake signal
they should use.
Perhaps the wrong
interface cable has
been used.
1 No device is connected to the
Monitor
2 The device
address has
been entered incorrectly in the
Monitor’s set-up.
1. The device is
“off-line“(it
cannot receive
data).
2. The device is not
able to receive
data fast
enough.
3. The device is no
longer
connected to
Monitor.
_____________________________________________________________________________
BE6039-11
3436i SF6 Detector
LumaSense Technologies A/S
Page 192 of 194
Chapter 14
____________________________________________________________________
Error Messages
AIR SHUNT BLOCKED. SAMPLE
ABORTED
CHOPPER FAILED
INTERNAL TEMPERATURE OUT OF
RANGE
IR-SOURCE TEMPERATURE OUT OF
RANGE
MICROPHONE TEST FAILED
PUMP TEST FAILED
MODULE STATUS ERROR DETECTED
Description of Fault
Possible Cause
The pressure of air in the
analysis cell is too high.
The microphones risk
being damaged by
exposed to such pressure.
The air shunt valve
is either defective or
blocked.
The chopper wheel is not
running.
The temperature in the
analysis cell is either too
high or too low. As the
Monitor is operating outside its temperature
specifications, accurate
measurements cannot be
guaranteed.
The temperature of the
infrared light source is
either too high or too low.
As the IR-source is operating outside its
temperature specifications
accurate measurements
cannot be guaranteed.
The signal received from
the microphone during the
self-testing procedure is
out of range.
The pump cannot build up
the necessary pressure
during the self-testing
procedure.
At least one of the
modules is not functioning
as expected.
1. The chopper
motor is not
working
2. The optical
sensor which
checks the
chopper´s
movement is not
working.
1. The ventilation
fan is defective.
2. The ambient air
temperature is
either too high
or too low.
3. The temperature
sensor is
defective.
The infra-red light
source is defective.
1. The analogue
card is defective
2. A microphone
(s) is defective.
1. The pump is
defective.
2. The internal
pneumatic
system is not
airtight.
1. Module
hardware error.
2. Fault in
communication
cable
3. Wrong module
version
4. Fault in the data
configuration of
the module
_____________________________________________________________________________
BE6039-11
3436i SF6 Detector
LumaSense Technologies A/S
Page 193 of 194
3436i
LumaSense Technologies A/S
Energivej 30
DK-2750 Ballerup, Denmark
Tel.:(+45) 44 20 01 00
Fax: (+45) 44 20 01 01
http://www.lumasenseinc.com