1
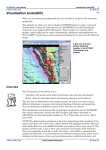
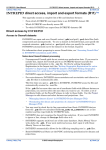
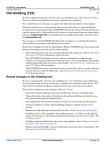
INTREPID User Manual
Library | Help | Top
Creating grids (old) (G07a)
1
| Back |
Creating grids (old) (G07a)
Top
Creating a grid from a set of line or point data is a fundamental operation with
geophysical data. The INTREPID Gridding tool is a powerful instrument for creating
grids. This guided tour conducts you through a simple gridding operation, deriving a
grid dataset from a set of line data.
The following illustration shows stages in a line data gridding process, and the final
result in the Gridding tool window.
Overview
The Gridding tool enables you to produce a grid (raster) dataset from a field of a line
or point (vector) dataset.
You can use the Gridding tool to produce grids from
•
Point data (eg., gravity),
•
Line data (eg., aeromagnetics)
including both
Library | Help | Top
•
Regularly spaced data (eg., aeromagnetics) and
•
Variable density data (eg., marine gravity).
© 2012 Intrepid Geophysics
| Back |
INTREPID User Manual
Library | Help | Top
Creating grids (old) (G07a)
2
| Back |
The INTREPID gridding tool can
•
Process datasets of unlimited size and
•
Create multiband grids from several line or point dataset fields.
Grid datasets form the basis for image-based enhancements such as:
•
Spectral domain (FFT) and convolution filtering,
•
Interpretation tools (Euler deconvolution, grid-based depth methods),
•
Image-based hard copy products.
Context of this guided tour
The data used in this tour is raw and contains noise, spikes and corrugations. In the
context of your data processing cycle, the tour represents an early examination
of a set of line data before it is refined by other INTREPID tools.
Location of sample data for Guided Tours
We provide two complete sets of sample datasets, one in INTREPID format and one
in Geosoft format. INTREPID works equally well with both formats. When you want
to open a dataset, navigate to the directory containing the required data format.
Where install_path is the path of your INTREPID installation, the project
directories for the Guided Tours sample data are
install_path\sample_data\guided_tours\intrepid_datasets and
install_path\sample_data\guided_tours\geosoft_datasets.
For example, if INTREPID is installed in
C:\Program Files\Intrepid\Intrepid4.5.nnn,
then you can find the INTREPID format sample data at
C:\Program Files\Intrepid\Intrepid4.5.nnn\sample_data\
guided_tours\intrepid_datasets
This is the default location for the sample data. If you have installed INTREPID
normally, the data resides there. If you have installed INTREPID elsewhere, the
exercises will work just as well. Just use the appropriate pathnames.
For more information about installing the sample data, see "Sample datasets—
installing, locating, naming" in INTREPID Guided Tours Introduction (G01)
For a more detailed description of INTREPID datasets, see Introduction to the
INTREPID database (G20). For even more detail, see INTREPID database, file and
data structures (R05).
Should you complete this guided tour?
This guided tour is intended for introductory level users and contains full detailed
instructions. The gridding process it demonstrates is a fundamental INTREPID
process. You should complete this tour as part of a thorough evaluation of
INTREPID. In later guided tours you can use the Gridding tool to produce grids from
the results of the exercises you complete.
Library | Help | Top
© 2012 Intrepid Geophysics
| Back |
INTREPID User Manual
Library | Help | Top
Creating grids (old) (G07a)
3
| Back |
What you will do
Flow Chart Summary
Inputs
Process
Line
dataset
Specify a "Z"
field to grid
Configure
gridding
parameters
Library | Help | Top
© 2012 Intrepid Geophysics
Outputs
Grid
dataset
| Back |
INTREPID User Manual
Library | Help | Top
Creating grids (old) (G07a)
4
| Back |
Steps to follow
Navigate to the
data and start
the tool
1
Start the Project Manager. Navigate to the directory
install_path\sample_data\guided_tours\intrepid_datasets. Start the
Gridding tool.
See Locating datasets, viewing statistics, launching tools (G02) for instructions
about navigating to different directories.
Choose Gridding from the Grid Menu.
INTREPID displays the Gridding Main window.
Library | Help | Top
© 2012 Intrepid Geophysics
| Back |
INTREPID User Manual
Library | Help | Top
Creating grids (old) (G07a)
5
| Back |
You can specify the input, output and parameters for the Gridding process in this
guided tour using the job file ch06_1.job. If you want, load it into the Gridding tool
as described in Section "Task specification (job) file short cuts" in INTREPID Guided
Tours Introduction (G01), then go to Step 6. Ensure that the directory which contains
the job file is the current directory for the Gridding Tool, otherwise the job file will not
load into the Tool.
Load the data
to be gridded
2
Specify the raw_mag field from the line dataset ebagoola_S as the input data.
From the File menu choose Load Z Field for Gridding. INTREPID displays the
Select Database dialog box.
Select the file ebagoola_S..DIR and choose Open.
INTREPID displays the fields of ebagoola_S in the Load Z dialog box
Select (click) the raw_mag field.
Choose OK.
Note: Do not choose Apply in the Gridding window until step 6.
Specify the
output grid
3
Specify raw_grid1 in the
install_path\sample_data\guided_tours\intrepid_datasets directory
as the output grid dataset.
From the File menu choose Specify Output Grid as. INTREPID displays the Save
Dataset dialog box. Ensure that the current directory is
install_path\sample_data\guided_tours\intrepid_datasets. Enter
raw_grid1 in the File Name text box. This will be the name of your output grid
dataset. If you want to output a grid in a different format other than Intrepid, you
must add the correct extension to the grid name.
Library | Help | Top
© 2012 Intrepid Geophysics
| Back |
INTREPID User Manual
Library | Help | Top
Creating grids (old) (G07a)
6
| Back |
For example, if you want a Geosoft grid you must type raw_grid1.grd in the File
Name text box.
Choose OK.
Tip: The grid dataset you are creating must be stored outside the line dataset
directory.
INTREPID displays the Enter band number dialog box.
Check the line
direction
Leave these settings unchanged. Click OK.
4
Use the Calculate Average Strike facility in the Report window to estimate the
bearing of the traverse lines.
From the Window menu choose Report.
INTREPID displays the Report window.
Library | Help | Top
© 2012 Intrepid Geophysics
| Back |
INTREPID User Manual
Library | Help | Top
Creating grids (old) (G07a)
7
| Back |
Choose Calculate Average Strike. INTREPID calculates the average bearing of
the traverse lines in the dataset and display the results in an Information dialog
box.
Note the Line Bearing value that INTREPID has reported (91°—East-West).
Choose OK.
Tip: INTREPID application windows often consist of a deck of window views.
You can select the view you require using the Window menu. The Gridding tool has
four window views: The Main window displays the gridding process and enables
you to set parameters.The Report window displays a list of all of the settings for
the current grid process.The Original Data window displays the line or point
data in its original form.The Tiling Control window enables you to coordinate
the process for very large datasets.
Set the
gridding
parameters
5
Set parameters for the process: Grid Cell Size = 80, Extrapolate Cell = 5, Nominal
Bearing = 90, Minimum Curvature On, Maximum Residual = .05, Smoothing On.
From the Windows menu choose Main Gridding.
Set Grid Cell Size to 80, Extrapolate Cell to 5 and Nominal Bearing to 90 by
typing these values in their respective text boxes.
Select the Minimum Curvature grid refinement option and turn on the Smoothing
check box.
Set Maximum Residual to .05 by typing the value into the corresponding text box.
Select the 2 Cell Option.
Select the Std (standard) Kernel for Minimum Curvature refinement.
Library | Help | Top
© 2012 Intrepid Geophysics
| Back |
INTREPID User Manual
Library | Help | Top
Creating grids (old) (G07a)
8
| Back |
Tip: We recommend that the grid cell size is about 1/5 the acquisition line spacing.
If you don’t know the acquisition line spacing you can measure it using the
Windows Visualisation Tool or UNIX Visualisation tool. The guided tours
introducing these tools each include a line spacing measurement activity (See The
Visualisation tool (G05). The line spacing for the ebagoola_S dataset is
approximately 400m.
Tip: Minimum Curvature is a smoothing process which INTREPID repeats
according to the number of iterations you specify. Each iteration produces a change
in some cell values. The changes become smaller with each iteration. When the
maximum change for any cell falls below the Maximum Residual or INTREPID
has completed the required number of iterations, the Minimum Curvature process
stops. Consult the reference manual for an explanation of the other parameters.
Perform the
gridding
operation
6
Perform the gridding operation.
Choose Apply. INTREPID creates and saves your new grid dataset as specified.
You can view the gridding process in the Main Gridding window.
Tip: You can view statistics for the gridding process in the Report window. Choose
Report from the Window menu to view it.
7
Exit from the tool.
To exit from the Gridding tool, choose Quit from the File menu.
Library | Help | Top
© 2012 Intrepid Geophysics
| Back |
INTREPID User Manual
Library | Help | Top
Creating grids (old) (G07a)
9
| Back |
For a better view of your grid
Examine the
grid with a
visualisation
tool
You can use the Visualisation Tool to examine your grid. Recall the instructions in
The Visualisation tool (G05).
Key points for this guided tour
In this guided tour you have used the Gridding tool to:
•
Transform a line dataset to a grid dataset.
The INTREPID Gridding tool:
•
Transforms line and point datasets to grid datasets;
•
Supports a range of gridding techniques for different data characteristics;
•
Supports the extensive range of grid based processing and enhancement
techniques offered by INTREPID.
Frequently Asked Questions
Q : How big can my datasets be?
A : The INTREPID Gridding tool supports extremely large grids - it is routinely used
to produce grids of 100,000,000 grid points. The tool offers a tiling system that allows
computers of modest size to grid very large datasets.
Q : Can I import or export my favourite grid format?
A : INTREPID native grid format is already compatible with ERMapper and ARC/
INFO raster formats. The INTREPID Export tool can output your data in a wide
range of formats including ASCII, Geosoft, ECS, Geosolutions, GEOPAK, NetCDF,
and AGSO formats.
Q : Does INTREPID support multiband grids?
A : Yes, both the INTREPID Gridding tool and other INTREPID grid processing tools
support multiband grids.
Q : Can INTREPID deal with ‘holes’ in the data?
A : Yes. Masking is supported.
Library | Help | Top
© 2012 Intrepid Geophysics
| Back |
INTREPID User Manual
Library | Help | Top
Creating grids (old) (G07a)
10
| Back |
Q : What gridding methods does INTREPID use?
A : The INTREPID Gridding tool has four gridding methods (as shown in the table
below) and additional grid refinement procedures. After the gridding process (no
matter which method you use), INTREPID can refine your new grid using LaPlace
smoothing and iterative Minimum Curvature.
Method
Purpose
Initial Grid methods
Nearest Neighbour
General purpose—suitable for all data types. The interpolation process
honours original data, which makes this method very accurate. Nearest
Neighbour is slower than other methods.
Bi-Cubic Spline
(Fast Grid)
This method is restricted to line datasets. It uses cell centroid values. The
Bi-Cubic Spline method is very fast.
Trend Spline
This method uses adaptive directions to ‘follow’ the geological strike of
the region surveyed.
Box Filter
General purpose—suitable for all data types. It uses cell centroids. The
Box Filter method is faster than the Nearest Neighbour method.
Variable Density
This method is designed to minimise grid artifacts for datasets which
have a variable data sampling, eg; land gravity, marine gravity and
bathymetry data.
Refinement methods
Minimum Curvature
Library | Help | Top
This iterative process smooths the grid points after the initial gridding.
Applies only to interpolated grid values, thus the original data points are
honoured.
© 2012 Intrepid Geophysics
| Back |