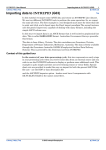
1
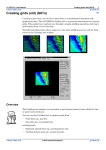
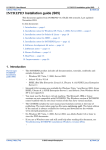
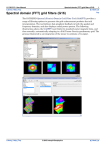
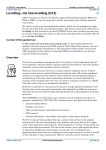
INTREPID User Manual
Library | Help | Top
Visualisation tools(G05)
1
| Back |
Visualisation tools(G05)
Top
When you are processing geophysical data you will find it useful to view your data
graphically.
This guided tour shows you how to display INTREPID datasets using a variety of
formats with a variety of visualisation tools. INTREPID have added thumbnail
visuals for every supported IO API formats. These renders are reusable JAVA
plugins, which might also be used in Geomodeller, JetStream web-applications etc.
The X11/MFC visual tools are also retained and supported, as shown in the following
image.
A grid, line and point
dataset displayed
together in the X11/MFC
Visualisation Tool
window.
Overview
The Visualisation Tool enables you to
•
Visualise a line and/or point and/or grid dataset, pan and zoom the display,
•
Query values for individual points and measure distances in the dataset
This tool may be distributed freely without charge. So that it can work in many
different situations, it operates with reduced checking of datums and projections.
You can download a standalone version of this tool from our website.
The Visualisation tool is historically the principal visualisation tool for INTREPID.
New visual components, based upon JAVA plugins and known internally as
GRAVITAS, are also being made available at V4.5. These show up in every JAVA
based GUI.
NOTE: The default grid visualization is for a Sun Angle Drape of the gradient of the
signal in the grid, over a false colour, linear stretch with clipping of outliers. This may
show subtle defects in your gridded data that you might not have been aware of. The
purpose of these tools, is not to show your associates nice images, with “bull-eyes”
that you immedately would like to drill, but rather, a best effort at enhancing the
geophysical field data, at various stages in its evolution and processing, with a view to
helping you find issues, so that you can minimize noise, avoid false positives, and
Library | Help | Top
© 2012 Intrepid Geophysics
| Back |
INTREPID User Manual
Library | Help | Top
Visualisation tools(G05)
2
| Back |
produce the best interpretation, after critical examination.
Our INTREPIDLynx product enables you to view INTREPID data in ESRI MapInfo
and ERMapper visualisation tools
Library | Help | Top
© 2012 Intrepid Geophysics
| Back |
INTREPID User Manual
Library | Help | Top
Visualisation tools(G05)
3
| Back |
Context of this guided tour
The data used in this tour is raw and contains noise, spikes and corrugations. In the
context of your data processing cycle, the tour represents an early examination
of data before other INTREPID tools refine it.
Location of sample data for Guided Tours
We provide two complete sets of sample datasets, one in INTREPID format and one
in Geosoft format. INTREPID works equally well with both formats. When you want
to open a dataset, navigate to the directory containing the required data format.
Where install_path is the path of your INTREPID installation, the project
directories for the Guided Tours sample data are
install_path\sample_data\guided_tours\intrepid_datasets and
install_path\sample_data\guided_tours\geosoft_datasets.
For example, if INTREPID is installed in
C:\Program Files\Intrepid\Intrepid4.5.nnn,
then you can find the INTREPID format sample data at
C:\Program Files\Intrepid\Intrepid4.5.nnn\sample_data\
guided_tours\intrepid_datasets
This is the default location for the sample data. If you have installed INTREPID
normally, the data resides there. If you have installed INTREPID elsewhere, the
exercises will work just as well. Just use the appropriate pathnames.
For more information about installing the sample data, see "Sample datasets—
installing, locating, naming" in INTREPID Guided Tours Introduction (G01)
For a more detailed description of INTREPID datasets, see Introduction to the
INTREPID database (G20). For even more detail, see INTREPID database, file and
data structures (R05).
Location of sample data for CookBooks
Right next to the Guided tours data, is a rich set of more exotic geophysics datasets
and grids, already prepared for the cookbook training sessions. A casual user might
also gain some trial and error insights into the capbilities of the software, just by
testing the Project Manger’s ability to preview and describe the attributes of each of
the cookbook datasets.
Should you complete this guided tour?
This guided tour is intended for introductory level users. It contains full detailed
instructions.
The Visualisation Tool is the main visualisation tool for INTREPID, so it is important
to know how to use it.
Library | Help | Top
© 2012 Intrepid Geophysics
| Back |
INTREPID User Manual
Library | Help | Top
Visualisation tools(G05)
4
| Back |
What you will do
Flowchart Summary
Inputs
Proce s s
Outputs
Launch
V i su a l i sa ti o n
tool
Grid
dataset
Load grid
dataset
View
and
enhancedataset
Line
dataset
Load Line
dataset
View
and enhance
dataset
Point
dataset
Load point
dataset
View
and enhance
dataset
Library | Help | Top
© 2012 Intrepid Geophysics
| Back |
INTREPID User Manual
Library | Help | Top
Visualisation tools(G05)
5
| Back |
Steps to follow
Viewing a grid dataset
Launch the
Visualisation
Tool
1
Start the Project Manager. Navigate to the directory
install_path\sample_data\guided_tours\intrepid_datasets. Launch
the Visualisation Tool. Choose File > Load Grid Dataset. When the Load Dataset
prompt appears, select the grid dataset raw_grid.
See Locating datasets, viewing, statistics, launching tools (G02) for instructions
about navigating to different directories and selecting datasets.
Choose Visualisation from the Display menu.
Library | Help | Top
© 2012 Intrepid Geophysics
| Back |
INTREPID User Manual
Library | Help | Top
Visualisation tools(G05)
6
| Back |
INTREPID launches the Visualisation Tool. After opening the dataset
raw_grid, it displays the dataset in sun angle drape mode. Note the corrugation
in the grid.
View a grid
dataset in grey
scale mode
Corrugation
View the grid
dataset in
pseudo-colour
mode
2
View the dataset in pseudocolour mode.
From the Grid Display menu, choose Pseudocolour. INTREPID displays the
Pseudocolour parameters dialog box.
Choose Reset, then OK.
INTREPID displays the raw_grid dataset in pseudocolour mode.
Corrugation
Tip: In a pseudocolour display INTREPID assigns colours to ranges of grid values.
For example, red or white represents a high value, and blue represents a low value.
Library | Help | Top
© 2012 Intrepid Geophysics
| Back |
INTREPID User Manual
Library | Help | Top
Equalise the
colour
distribution
3
Visualisation tools(G05)
7
| Back |
Perform a statistical colour equalisation on the pseudocolour display.
From the Grid Display menu, choose Histogram. INTREPID displays the
Histogram Options dialog box.
Choose OK. INTREPID displays the grid with equalised colour.
Tip: In an equalised colour display each of the 256 colours in the pseudocolour
range represents the same number of grid cells. This makes the best use of the
range of available colours to distinguish the range of values in the dataset.
View the grid
dataset in sun
angle mode
Library | Help | Top
4
View the dataset in sun angle mode and observe the small anomalies due to noise
and spikes.
From the Grid Display menu choose Sun Angle. INTREPID displays the Sun
Angle parameters dialog box.
© 2012 Intrepid Geophysics
| Back |
INTREPID User Manual
Library | Help | Top
Visualisation tools(G05)
8
| Back |
Choose OK to accept the default parameters.
INTREPID displays the raw_grid dataset in sun angle mode. The corrugation
and anomalies due to noise and spikes are much more apparent in this mode.
Query points
and distances
in the dataset
5
Choose Query mouse mode and click points on the grid display, noting the report of
the geographic coordinates (X and Y) and the grid cell values at each point. Drag
across part of the grid display holding down the left mouse button. INTREPID
reports the dataset distance you traversed.
Choose Query mouse mode.
Reporting individual points: Click points on the grid display. INTREPID
displays the geographic (X and Y) coordinates and the cell value for each point.
Report of X, Y and cell value
Point clicked
Library | Help | Top
© 2012 Intrepid Geophysics
| Back |
INTREPID User Manual
Library | Help | Top
Visualisation tools(G05)
9
| Back |
Reporting distances: Move the mouse pointer to a point in the display. Hold
down the left mouse button and drag to another point in the display. INTREPID
reports the distance between the two points.
Distance report.
This illustration
shows the width of
the whole display.
The grid dataset is
approximately
11.8km wide.
Distance
measured
Viewing a line dataset
6
Library | Help | Top
The thumbnail view, using the JAVA componets, is quite flexible here, so simply
choose the ebagoola_s..DIR dataset, then click on the thumbnail tab, and then
choose the raw_mag field in the drop down field chooser for the view. This is
illustrated below.
© 2012 Intrepid Geophysics
| Back |
INTREPID User Manual
Library | Help | Top
Load a line
dataset
7
Visualisation tools(G05)
10
| Back |
Exit from the Visualisation Tool, then launch the Visualisation Tool again. Load
the line dataset ebagoola_S into the Visualisation Tool.
Choose Quit from the File menu, or simply click on the red cross in the top right
hand corner.
INTREPID quits the Visualisation Tool.
From the Project Manager Display menu, choose Visualisation tool.
INTREPID launches the Visualisation Tool.
Choose File > Load Line Dataset, and select the ebagoola_S line dataset.
Library | Help | Top
© 2012 Intrepid Geophysics
| Back |
INTREPID User Manual
Library | Help | Top
Visualisation tools(G05)
11
| Back |
INTREPID displays a flight path of the dataset.
Tie line
Acquisition lines
Tip: Note: We have modified colours in some of the line dataset illustrations so
they print more clearly. The normal display colours for the Visualisation Tool are
white lines on a grey or yellow background.
Query points in
the dataset
8
Choose Query mouse mode and click points on the display. Each time you click a
point, Visualisation Tool finds the nearest data point on a line and report its
geographic coordinates (X and Y), line number and fiducial count.
Choose Query mouse mode. Click a point in the dataset display.
INTREPID reports values for the point as shown here.
Report of nearest data
point: X, Y, line
number, fiducial
count
Point clicked
Tip: When a line dataset is displayed, the Dist (m) report shows the distance from
the click point to the nearest data point.
Library | Help | Top
© 2012 Intrepid Geophysics
| Back |
INTREPID User Manual
Library | Help | Top
Query
distances in
the dataset
9
Visualisation tools(G05)
12
| Back |
Drag across the grid display with the left mouse button and note the report of the
distance between the start and end points of the drag operation.
(Optional:) Use this technique to estimate the average distance between the
acquisition lines and between the tie lines of the dataset. Note these values for use
in Gridding and in Decorrugation.
Move the mouse pointer to a point in the display. Hold down the left mouse button
and drag to another point in the display. INTREPID reports the distance between
the two points.
Distance report (in this
case for tie line spacing)
Distance
measured
Tip: When a line dataset is displayed INTREPID actually reports the distance
between the data points closest to the start and end points of your drag operation.
(Optional—Distances between tie lines:) Move the mouse pointer to a point on a
tie line. Hold down the left mouse button and drag to the nearest point on the
other tie line. INTREPID displays the distance between the tie lines. Repeat the
process a few times and use the results to calculate the average distance between
the tie lines. The illustration above shows a report of tie line spacing.
(Optional—Distances between acquisition lines:) Move the mouse pointer to a
point on an acquisition line. Hold down the left mouse button and drag to the
nearest point on an adjacent acquisition line. INTREPID displays the distance
between the acquisition lines. Repeat the process a few times and use the results
to calculate the average distance between the acquisition lines. You could perform
this more accurately if you zoomed in.
Acquisition
line spacing
Tie line spacing
The average acquisition line spacing is 400m and tie line spacing is 8000m. You
will use these values in Creating grids (G07).
Library | Help | Top
© 2012 Intrepid Geophysics
| Back |
INTREPID User Manual
Library | Help | Top
Enhance the
dataset with
Signal field
colour
Visualisation tools(G05)
13
| Back |
10 Display the values of the Z field raw_mag along the lines using pseudocolour.
Tip: A Signal field is simply a field of the dataset that contains one of the
quantities measured in the survey, such as magnetic or gravity readings or
altitude. It is called a Signal field because if you represented the values in a threedimensional graph the X and Y directions would show geographic location and the
Z direction would show the measurements.
From the Line Display menu choose Load Signal field. INTREPID displays the
Optional signal field for line dataset dialog box. Select raw_mag from the list.
Choose OK.
From the Line Display menu choose Signal value as Line Colour.
INTREPID displays values of the field raw_mag along the lines in pseudocolour.
Library | Help | Top
© 2012 Intrepid Geophysics
| Back |
INTREPID User Manual
Library | Help | Top
Overlay the
grid with a line
dataset
Visualisation tools(G05)
14
| Back |
Overlaying grid and point datasets
11 Overlay the grid dataset raw_grid on your line dataset display and view it in sun
angle mode.
Choose Load Grid Dataset from the File menu. INTREPID displays the Load Grid
Band dialog box. Select raw_grid from the directory
install_path\sample_data\guided_tours\intrepid_datasets.
Choose Open. INTREPID displays the grid data in sun angle drape mode overlaid
on the existing line dataset.
Choose Sun Angle from the Grid Display menu. INTREPID displays the Sun
Angle parameters dialog box.
Choose OK to accept the default parameters.
Library | Help | Top
© 2012 Intrepid Geophysics
| Back |
INTREPID User Manual
Library | Help | Top
Visualisation tools(G05)
15
| Back |
INTREPID displays the grid dataset in sun angle mode overlaid on the existing
line dataset.
Tip: If you are querying points in a display with a grid and a line dataset, note
that the X and Y data reported refers to the nearest data point on a traverse line,
but the Value reported refers to the grid cell value at the point that you click.
Examine where
two lines cross
over
12 (Optional– zooming in on a problem area:) Zoom in on the area where lines 3012
and 3013 overlap. There is a small anomaly here which is the result of line data
spikes. Examine the colours of line 3012 and 3013 in the overlap region. Zoom back
out to the full view when you have finished.
Note the small anomaly in the region where lines 3012 and 3013 overlap.
Line 3013
overlaps line
3012
Library | Help | Top
© 2012 Intrepid Geophysics
| Back |
INTREPID User Manual
Library | Help | Top
Visualisation tools(G05)
16
| Back |
Select Zoom or Trace mouse mode. Zoom in by defining a square around the
crossover region. Move the mouse pointer to the top left corner of the region you
wish to magnify. Hold down the left mouse button and drag to the lower right
corner of the region required. INTREPID displays a rectangle to show the area
you have defined. (This is called a ‘rubber band stretch’.) Release the mouse
button.
INTREPID zooms in to this region.
Note the anomaly in the grid and the colours of the two lines in the crossover area.
In the Flight Path Editor exercise (See Editing with the Flight Path Editor (G10))
you will correct this problem.
Zoom out to the whole dataset when you have finished examining the region.
Choose the Zoom Previous button in the Visualisation Tool window. INTREPID
displays the whole dataset again.
Overlay a point
dataset
Library | Help | Top
13 (Optional– overlaying a point dataset:) Overlay the euler_s point dataset on your
display. Specify the Depth field to be represented by point colour and the Reliability
field to be represented by point size.
Choose Load Point Dataset from the File menu. INTREPID displays the Load
Point Dataset dialog box. Select euler_s from outside the euler_s dataset
directory.
© 2012 Intrepid Geophysics
| Back |
INTREPID User Manual
Library | Help | Top
Visualisation tools(G05)
17
| Back |
Choose Open.
INTREPID displays the Optional color Signal field dialog box. Select depth from
the list.
Choose OK.
INTREPID displays the Optional size Signal field dialog box. Select
reliability from the list.
Choose OK.
INTREPID displays the Optional angle field for pointer and Optional Label field
for point data dialog boxes. Choose Skip on each one.
INTREPID overlays the point dataset on the existing line and grid display.
Under the Point Display Menu, you can choose Set Subsample Interval to show
more or less points.
Library | Help | Top
© 2012 Intrepid Geophysics
| Back |
INTREPID User Manual
Library | Help | Top
Library | Help | Top
Visualisation tools(G05)
18
| Back |
© 2012 Intrepid Geophysics
| Back |
INTREPID User Manual
Library | Help | Top
Visualisation tools(G05)
19
| Back |
Tip: The Point Display menu shows a tick next to the attributes on display.
To turn the display off or on, select the corresponding menu option.
The Marker Angle attribute displays each point as a line segment pointing in a
direction indicating the data assigned to it. The Text attribute labels each point
with the field value assigned to it.
To exit
To exit from the Visualisation Tool, choose Quit from the File menu.
Key points for this guided tour
In this guided tour you have used the Visualisation Tool. It enables you to:
•
•
•
Visualise INTREPID geophysical datasets:
•
Line
•
Point
•
Grid
Visually enhance data:
•
Integration of line, point and raster data
•
Pseudocolour, sun-angle, line colour, equalisation
Measure distances and report values of points in a dataset.
Frequently Asked Questions
Q : Can the datasets be in different projections?
A : Yes. The Visualisation Tool performs on the fly projection conversions. However,
the standalone version of the Visualisation Tool only performs a light-weight check of
projections and data.
Q : Can I get hard copy from this tool?
A : No. For hard copy, you need to use the The INTREPID Map Composition tool (see
Map composition (G17)).
Q : Is there a way of quickly viewing datasets with the Visualisation Tool in
Windows?
A : Yes, in Windows you can associate the dataset files with the Visualisation tool.
When you double click the dataset in Windows Explorer or My Computer, it opens in
the Visualisation tool. This also works with the free stand-alone version of the
Visualisation tool. See "Associating datasets with the Visualisation tool in Windows"
in INTREPID Installation guide (S05)
Library | Help | Top
© 2012 Intrepid Geophysics
| Back |
INTREPID User Manual
Library | Help | Top
Library | Help | Top
Visualisation tools(G05)
20
| Back |
© 2012 Intrepid Geophysics
| Back |