1
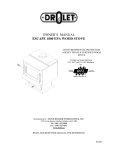
FKT Series Flow Measurement And Pressure Acquisition System User's Manual CONTACT INFORMATION Email: [email protected] Web: www.flowkinetics.com Mail: FlowKinetics LLC 528 Helena Street Bryan, Texas 77801 USA Telephone: (979) 680-0659 / (888) 670-1927 Fax: (979) 680-0659 / (979) 846-2808 IMPORTANT Read all instructions and precautions in this manual before use. Keep this manual for future reference. April 24, 2015 FKT Series User Manual, Copyright 2002-2015 FlowKinetics LLC Table of Contents Page LIMITATIONS OF USAGE AND CAUTIONS ........................................................................ 4 WARRANTY................................................................................................................................. 4 A. INTRODUCTION................................................................................................................. 5 1. Overview 5 2. Features 5 3. Power Supply & Batteries 6 4. Tubing Connections 7 5. Accessories 7 6. Pressure Measurement 8 7. Temperature/Humidity Measurement 9 8. Data Logging 9 B. OPERATION OF THE FKT SERIES .............................................................................. 10 1. Overview 10 2. Power Connection 10 3. Controls 10 4. Power up 15 5. Power down 15 6. Pressure/Velocity ranges 15 7. Temperature and Relative Humidity measurement 15 8. Damping 16 9. Zeroing 16 10. Standard deviation, s1 16 11. Humidity Ratio, W 18 C. USING A PITOT STATIC TUBE FOR VELOCITY MEASUREMENT .................... 19 1. Overview 19 2. Measurement of Velocity 19 3. Pitot Static tube duct surveys 23 4. Using the FKT 1DP1A-SV for Surveys 24 D. MAINTENANCE ................................................................................................................ 27 1. Operational maintenance 27 2 FKT Series User Manual, Copyright 2002-2015 FlowKinetics LLC 2. Battery maintenance 27 3. User Calibration 27 E. SPECIFICATIONS............................................................................................................. 30 F. UNIT CONVERSIONS ...................................................................................................... 32 3 FKT Series User Manual, Copyright 2002-2015 FlowKinetics LLC LIMITATIONS OF USAGE AND CAUTIONS The FKT series of instruments are not intrinsically safe, and must not be used in dangerous or hazardous areas. Servicing of these instruments incorporating battery changing must only occur in a safe area. Use of the FKT series may require working in a hazardous environment. Necessary safety precautions must be followed. FlowKinetics™ LLC’s products (including the FKT series) are not authorized for use as any component in a life support system or device or as component of an aircraft’s on board flight system. Life support systems or devices are defined as any system that can sustain, monitor or support life. The pressure transducers used by the FKT system are compatible with most clean non-corrosive gases, however toxic gases are not suitable, nor are liquid pressure measurements. Measuring flows with high particulate content requires filtering to prevent damage to the instrument. Any attempts to service or modify or alter the product in any way, will void the warranty and will negate any right of claim against FlowKinetics™ LLC, relating to any liability in respect of the product. WARRANTY All of FlowKinetics™ LLC's instruments have been assembled using strictly defined and controlled procedures and tests, and are warranted against any faults in workmanship and materials for one year from the date of purchase. Liability under this warranty is limited to repair or replacement F.O.B. factory of any parts which prove to be defective within that time or repayment of the purchase price at the Seller's option provided the product has been returned, transportation prepaid, within one year from date of purchase. In no case is the Seller liable beyond replacement of product F.O.B. factory or the full purchase price. This warranty does not apply if the product or equipment is abused, altered, used at ratings above the maximum specified, used with disregard of instructions and specified operating procedures, or otherwise misused in any way. All technical advice, recommendations and services are based on technical data and information which the Seller believes to be reliable and are intended for use by persons having skill and knowledge of the application, on their own judgment. There are no implied warranties of merchantability or of fitness for a particular purpose for goods covered hereunder. In no event will the manufacturer be responsible for consequential, incidental or special damages resulting from the use of this product. Buyer's Remedies: The buyer’s exclusive and sole remedy on account of or in respect to the furnishing of non-conforming or defective material shall be to secure replacement thereof as said above. The seller shall not in any event be liable for the cost of any labor expended on any such material or for any special, direct, indirect, consequential or incidental damages to anyone or any property by reason of the fact that it shall have been non-conforming or defective. Repairs: Authorization must be obtained before shipping items to FlowKinetics™ LLC for repairs. When requesting a repair please include a detailed description of the problem with the item, date of purchase, your P.O. or reference number and our invoice number if available. In the interest of product improvement, FlowKinetics™ LLC, reserves the right to change the design features without any prior notice. 4 FKT Series User Manual, Copyright 2002-2015 FlowKinetics LLC A. INTRODUCTION 1. Overview The FKT series of instruments are portable, self-contained micro-processor based process/pressure acquisition systems. The FKT series allow for the simultaneous measurement and display of one (FKT 1DP1A-SV), two (FKT 2DP1A-C ) or three (FKT 3DP1A) independent differential pressures as well as concurrent measurement and display of atmospheric pressure, target gas temperature and relative humidity (RH). The last three parameters are used to calculate density, which is also displayed. In conjunction with a Pitot Static tube, the series can display measured velocity accounting for true gas density, , (all models) and compressibility i.e. constant, (FKT 2DP1A-C series). The FKT 1DP1A-SV can be used to perform surveys of ducts as well as estimate the standard deviations of measured pressures and velocities. The instruments interface with a PC allowing data logging functions and can configure as a component of a data acquisition system. Figure A1 identifies the components of the series. Pressure Ports Sensor Storage LCD Screen Controls Battery Compartment Power Adapter PC Port Relative Humidity Sensor Temperature sensor (K-Type thermocouple) Pitot Probe (optional) Silicone Tubing Fig. A1 FKT series components 2. Features Simultaneous measurement and display of: o One to three independent differential pressures. This allows excellent flexibility in that multiple pressures may be measured simultaneously, or the transducer yielding optimum accuracy for a particular application may be selected. o Gas temperature. o Gas Relative Humidity. 5 FKT Series User Manual, Copyright 2002-2015 FlowKinetics LLC o Atmospheric pressure (or absolute pressure). o Real time true gas density including effects of temperature and water vapor. o Humidity ratio (FKT 1DP1A-SV only) o Standard deviations of differential pressure and velocity (FKT 1DP1ASV only). Extreme ease of use. The series was specifically designed to avoid menu driven operation, as this usually proves cumbersome and requires continual reference to the manual. Almost all required information is displayed concurrently through the use of a large 4 line LCD display. Pressures displayed in four user selectable ranges and 3 velocity ranges. In conjunction with a Pitot Static tube (or multiple tubes), up to three velocities based on true gas density are displayed in three user selectable units. It is not necessary to post-process the measured dynamic pressures to calculate the true gas velocity nor estimate the gas density. The FKT 2DP1A-C series present velocities corrected for compressibility effects and allow variable specific heat ratios to match that of the target gas. The FKT 1DP1A-SV model simplifies duct survey measurements and calculates standard deviations of measured velocity. Variable damping for measurements involving pulsating flows. Auto-zeroing without disconnecting from the pressure source (through the use of internal solenoids) every six minutes reduces zero-drift errors and simplifies operation. The auto-zero function can also be implemented by depressing the zero button. This is particularly useful when measuring in conditions with large ambient temperature fluctuations. Auto-zeroing is indicated by two to three (depending on the series) sequential clicks, approximately 3 seconds apart. Simultaneously, the screen will display the differential pressure transducer in the process of being zeroed. Auto-protection: If the applied differential pressure exceeds the transducer rating, the instrument will automatically enter the auto-zero cycle which will equalize pressure across the differential transducers reducing the possibility of damaging the transducer. Data logging with optional FlowScan™ Software Suite. 3. Power Supply & Batteries The instrument may be powered using either: 1. 8 AA-sized pen cell batteries (1.5V each). Use dry Alkaline leak-proof types. If the FKT series is stored, or not used for over a week, the batteries must be removed. 2. An AC adaptor power supply, supplied with the instrument. The adaptor can operate from 100VAC to 240VAC 50-60Hz supplies and provides 1100mA at 9VDC. The adaptor has the facility for easy interchange between US, European, English and Australian plugs. Note: when the adaptor is plugged into the unit, there is no need to remove the batteries, they are automatically disconnected. CAUTION: Use of any power adaptor other than that supplied with the instrument will remove any rights of claim against FlowKinetics™ LLC, relating to product liability or consequential damage against a third party and will void the warranty. If an alternative adaptor is used, its output voltage range must be regulated and within 9VDC V ADAPTOR 12VDC . 6 FKT Series User Manual, Copyright 2002-2015 FlowKinetics LLC 4. Tubing Connections The instrument is supplied with 1/4 by 1/8 inch silicone tubing. During measurement ensure that: The tubing is of approximately equal length. The tubing is un-kinked and non-constricted. Use the full length of the supplied tubing when measuring dirty or saturated air streams to avoid any contaminants draining into the pressure ports. Do not moisten the tubing to attach to the port barbs. The moisture can block the tubes and interfere with the transmission of pressure. The FKT series must not be left in direct sunlight for any long time periods. Pressures greater than 2.5 times the differential transducer’s range must not be applied to either of the transducers input ports. The common mode pressure limit for each port is ±10 psig. CAUTION: The FKT series are not suitable for use with toxic or corrosive gases or for liquid pressure measurement. The FKT series are not approved for use in any life support application. CAUTION: When removing tubing from the barbs, ensure that the face of the instrument is supported before pulling on the tubing (i.e. place two fingers on the surface adjacent to the barb). DO NOT PULL ON THE TUBING WITHOUT SUPPORTING THE PLATE. Remove the tubing individually. CAUTION: If the FKT series instrument is used in a flow with high-particulate content filters must be installed on the tubing between the probe and the instrument. Any unused ports should be covered if the ambient around the instrument is also dirty. CAUTION: Always connect the tubing and probe to the instrument first before inserting the probe into the flow or connecting the tubing to the pressure source. This prevents from too many contaminants filling the tubing. 5. Accessories The instrument is supplied complete with all required accessories for pressure measurement. These include: 1. A carrying case with shoulder strap. The case accommodates the instrument and most required accessories. 2. Lengths of silicone pressure tubing rated to 20psi. 3. AC wall adaptor, with desired plug (US, European, English or Australian). 4. Temperature and relative humidity sensors Optional Accessories 1. A velocity probe can be supplied. Available probes are Pitot-static for general velocity measurements. S-type Pitot probes suitable for dirty flows and RAP probes designed to quickly determine flow rates in ducts. 2. FlowScan™ software suite and cable to access the instrument readings from a computer. 7 FKT Series User Manual, Copyright 2002-2015 FlowKinetics LLC 6. Pressure Measurement The FKT series allow for the simultaneous measurement of one (FKT 1DP1A-SV), two (FKT 2DP1A-C) or three (FKT 3DP1A) differential and one absolute pressure. Table 1 shows available pressure ranges (and corresponding velocity ranges) with 2p displayed screen resolution. The velocity ranges were calculated using v , where v is velocity, p is the differential pressure and is the density, assumed to be 1.2kg/m3. Any combination of these ranges can be ordered prior to instrument assembly. The pressure transducers are true differential sensors; positive pressures can be applied to either port. The absolute pressure transducer, if left unconnected, displays local atmospheric pressure, or if connected to a duct system the duct absolute pressure which is then used for density calculation. The absolute transducer has a range of vacuum to 120kPa (17.4psi), and in no circumstances should a pressure greater than twice the maximum be applied. Over pressure will be indicated by the appearance of PA:=Overload! on the LCD display. Table 1 Transducer pressure and velocity ranges Pressure Range ±0.25inH2O (±60Pa) ±0.5inH2O (±124Pa) ±1.0inH2O (±249Pa) ±5inH2O (±1.2kPa) ±12inH2O (±3kPa) +20inH2O (+4.98kPa) +30inH2O (+7.5kPa) ±60inH2O (±15kPa) ±130inH2O (+32.3kPa) ±200inH2O (±49.8kPa) ±400inH2O (±99.5kPa) Velocity Range FKT 3DP1A FKT 2DP1A-C FKT 1DP1A-SV 100 - 2000 ft/min 100 - 2000 ft/min (0.5- 10.2 m/sec) (0.5- 10.2 m/sec) 141 - 2829 ft/min 141 - 2829 ft/min (0.7- 14.4 m/sec) (0.7- 14.4 m/sec) 200 - 4001 ft/min 200 - 4001 ft/min (1 - 20.3 m/sec) (1 - 20.3 m/sec) 447 - 8946 ft/min 447 - 8911 ft/min (2.3 - 45.4 m/sec) (2.3 - 45.3 m/sec) 693 - 13859 ft/min 693 - 13730 ft/min (3.5 - 70.4 m/sec) (3.5 – 69.7 m/sec) 895 - 17892 ft/min 895 - 17618 ft/min (4.5 – 90.9 m/sec) (4.5 – 89.5 m/sec) 1096 – 21913 ft/min 1096 – 21416 ft/min (5.6 – 111.3 m/sec) (5.6 – 108.8 m/sec) 1550 - 24992 ft/min* 1550 - 29640 ft/min (7.9 - 127 m/sec)* (7.9 – 150.6 m/sec) 2281 - 24992 ft/min* 2281 - 41668 ft/min (11.6 - 127.0 m/sec)* (11.6 – 211.7 m/sec) 2829 - 24992 ft/min* 2829 - 49609 ft/min (14.4 - 127 m/sec)* (14.4 - 252 m/sec) 4001 - 24992 ft/min* 4001 - 49646 ft/min** (20.3 - 127 m/sec) * (20.3 – 252.2 m/sec)** Display Resolution 0.0001inH2O (0.00001kPa) 1ft/min (0.01m/s) 0.0001inH2O (0.0001kPa) 1ft/min (0.01m/s) 0.001inH2O (0.0001kPa) 1ft/min (0.01m/s) 0.001inH2O (0.001kPa) 1ft/min (0.01m/s) 0.01inH2O (0.001kPa) 1ft/min (0.1m/s) 0.01inH2O (0.001kPa) 1ft/min (0.1m/s) 0.01inH2O (0.001kPa) 1ft/min (0.1m/s) 0.01inH2O (0.01kPa) 1ft/min (0.1m/s) 0.1inH2O (0.01kPa) 1ft/min (0.1m/s) 0.1inH2O (0.01kPa) 1ft/min (0.1m/s) 0.1inH2O (0.01kPa) 1ft/min (0.1m/s) * Compressible flow. Reduced air velocity accuracy for V > 100m/s (328ft/s) if using FKT 3DP1A or FKT 1DP1A-SV meters. The FKT 2DP1A-C is recommended for this velocity range. ** Air velocity range limited by supersonic flow forming a shock wave on the nose of the Pitot Static tube. Units of inH2O are defined at 16°C (60°F) 8 FKT Series User Manual, Copyright 2002-2015 FlowKinetics LLC CAUTION: Although the unit possesses auto-protection, which significantly reduces the possibility of differential transducer damage due to overload, under no circumstances should differential pressures greater than 2.5 times the maximum rating be applied. 7. Temperature/Humidity Measurement The instrument has two detachable probes that allow for the measurement of test point temperature and humidity. The relative humidity probe’s range is from 0 to 99%. For insertion of the humidity probe into airstreams, it is necessary that the gas be clean and free of contaminants. The relative humidity probe is designed to operate in a temperature range of -40oF (-40oC) to 185oF (85oC). If the temperature recorded by the meter is outside these limits the humidity reading will default to 0%. The relative humidity probe comes with a three prong copper connector. The included temperature probe is a K-type wire thermocouple with a range of -73oC (100oF) to 482oC (900oF). The FKT instrument can work with other K-type thermocouples and can display temperatures from -200oC (-328oF) to 777oC (1430oF) depending on the thermocouple materials. The included thermocouple comes with a quick disconnect miniature connector. 8. Data Logging Using the optional FlowScan Software Suite logging or recording instrument outputs is fully automated and greatly simplified. FlowScan™ also includes computational features, and can calculate volumetric and mass flow rates for surveyed ducts. The suite includes the FlowScan™ stand-alone application, FlowScan Excel Add-In, and the libraries such as the LabVIEW Virtual Instrument. The data logging facility also allows the instrument to function as a component of an external data acquisition program. Refer to the FlowScan manual for more details. 9 FKT Series User Manual, Copyright 2002-2015 FlowKinetics LLC B. OPERATION OF THE FKT SERIES 1. Overview In this section, the operation of the instrument will be detailed. It will be evident that a strong emphasis in the design of the FKT series is on simplicity of use. Operation is straightforward and unambiguous. 2. Power Connection Plug the Power Adaptor into a suitable AC outlet. Connect the Power Adaptor output plug into the POWER socket on the instrument. For battery connection and maintenance, see section D2. 3. Controls The controls on the face plate of the FKT 3DP1A, Figs. B1 and B2, and FKT 2DP1A-C, Figs. B3 and B4, and FKT 1DP1A-SV, Figs, B5 and B6 are as follows: {information particular to the FKT 2DP1A-C series is shown in italics and is underlined for the FKT 1DP1A-SV} ON/OFF This button turns the instrument on or off through sequential depression. When in the ON position, the button remains semi-depressed. RANGE The instrument has four available pressure ranges and three velocity ranges. Range selection is accomplished by rotating the switch to the desired position indicated by the indicator mark. ZERO Depressing the ZERO button initiates the auto-zero cycle. Automatic rezeroing will continue every six minutes after key depression. The ZERO button also serves to store the user set molecular weight, calibration factor (Section D3), Pitot tube correction factor (Section C). This button is also used to store duct shape and store survey readings. CONTR This controls the screen contrast and backlight to best suit the ambient light conditions. The backlight will turn on when the control is turned fully clockwise. Please note that turning the backlight on will consume significantly more power. Batteries will be drained faster if the backlight is on. The CONTR control also sets the target gas molecular weight, the calibration factor (Section D3) and the Pitot tube correction factor (Section C). DAMP Rotating the control varies the damping from a 1 to 8 as indicated by 1 to 8 on the upper right hand portion of the display, see Fig. B2. The damping feature is used when measuring unsteady or pulsating pressures. Damping is achieved through averaging of collected data. The number of averages varies with the square of the indicated numerical post-fix or 1 to 8 value, e.g. a setting of 4 indicates that the pressures or velocities presented on the screen comprises 16 averaged data values, while 8 would indicate that the data represents 64 averages. Increasing the number of averages will slow down the screen update intervals as the microprocessor processes the data. Turning this control fully clockwise initiates calculation of the standard deviation (see section B11). PC This serial port allows connection of the instrument to a PC for data logging. P(13)+ These pressure port barb connections are for the typical positive pressure of the differential transducers, such that a greater pressure at this port then 10 FKT Series User Manual, Copyright 2002-2015 FlowKinetics LLC P(13)Pabs Display the corresponding P– port will result in an indicated positive pressure. These pressure port barb connection are for the typical reference pressure of the differential transducers, such that a greater pressure at this port then the corresponding P+ port will result in an indicated negative pressure. This barb connection is for the absolute pressure transducer. If the true density in a duct or similar element is desired, a tube should be connected from this port to a static port on the duct or the static port of a Pitot Static tube inserted into the duct, see Section C. Information presented on the screen is as follows (see Figs. B1 to B6): The pressure or velocity units selected are shown on the first row of the display. If a velocity range is selected, appropriate units are displayed for the atmospheric (absolute) pressure. The displayed units are applicable to all installed differential transducers. The temperature as measured by the thermocouple. Temperature units are displayed so as to be compatible with the pressure/velocity range selected. The Relative Humidity percentage as measured by the relative humidity probe. If the measured temperature exceeds 480C (896F), the unit of temperature, i.e. C or F, will be replaced by the ! symbol. RH exceeding 99% will also be indicated by the appearance of the ! symbol. The damping level selected. The ambient or test point density. The temperature and relative humidity measured in combination with the absolute pressure transducer are used to calculate the density. The density is displayed in kg/m3 for the FKT 2DP1A-C and FKT 3DP1A series. Density appropriate for the RANGE selection is shown by the FKT 1DP1A-SV series (in either kg/m3 or lb/ft3). The specific heat ratio, , and gas molecular weight, M, in grams/mol. LO Low battery will be indicated by the appearance of on the top right hand side of the display, indicating that the supply battery voltage under load has dropped below approximately 8V. At this point the batteries should be replaced, or the instrument may begin to malfunction during auto-zero. If the batteries are too depleted, when the meter is started, the message Battery Depleted will show and the meter will not continue until new batteries are installed or the wall power supply is used The molecular weight, M, in grams/mol and Humidity ratio, W, in kg/kg or lb/lb (water vapor to dry air). Units for these parameters are not displayed on the LCD. 11 FKT Series User Manual, Copyright 2002-2015 FlowKinetics LLC Fig. B1 FKT 3DP1A series face plate differential pressure units damping, P 1 P 8 LO differential pressures low battery probe temperature density absolute or atmospheric pressure relative humidity Fig. B2 FKT 3DP1A series LCD presentation 12 FKT Series User Manual, Copyright 2002-2015 FlowKinetics LLC Fig. B3 FKT 2DP1A-C series face plate differential pressure units damping, P 1 P 8 LO differential pressures specific heat ratio low battery probe temperature density relative humidity absolute or atmospheric pressure molecular weight Fig. B4 FKT 2DP1A-C series LCD presentation 13 FKT Series User Manual, Copyright 2002-2015 FlowKinetics LLC Fig. B5 FKT 1DP1A-SV series face plate differential pressure units differential pressure density damping, P 1 P 8 LO low battery humidity ratio probe temperature relative humidity absolute or atmospheric pressure molecular weight Fig. B6 FKT 1DP1A-SV series LCD presentation 14 FKT Series User Manual, Copyright 2002-2015 FlowKinetics LLC 4. Power up To switch the unit on, the ON/OFF button is depressed. The screen will indicate the instrument series, followed by a prompt to calibrate the differential pressure transducers (if necessary, see section D3). Subsequently, the screen will show indications that the analog/digital (a/d) converters are being initialized. Following calibration, the screen will indicate that the Gas Molecular Weight can be changed. The calculation of density requires this value. The default value is for air (M = 28.97g/mol). If the test medium is another gas then press the ZERO button to edit the value. M can be set by rotation of the CONTR control until the desired value is displayed. In the FKT 2DP1A-C model, the value of the ratio of specific heats () can also be changed by rotating DAMP only if M is not the default (air). The default value of is 1.4 for air. After these values have been set, they can be stored by pressing the ZERO button again. It may be necessary to reset the LCD screen contrast (using the CONTR control) to its center position afterwards. Values of M can range up to 150g/mol. Ratio of specific heats can vary from 1.1 to 1.8. Subsequently, the unit will perform an initial auto-zero and be ready for operation. Autozeroing will occur every six minutes afterwards, unless initiated by the user. 5. Power down The unit is switched off by depressing the ON/OFF button. 6. Pressure/Velocity ranges Range selection is accomplished by rotating the switch to the desired position shown by the indicator mark. The initial selection of any of the velocity ranges (m/s, ft/s and ft/m) will cause the instrument to prompt for the Pitot correction factor, K, which is set using the CONTR control. This prompt is only displayed during the initial selection of the desired velocity range. See section C for details. If the velocity ranges are being used to measure velocity of gas exiting a nozzle, then K can be left at the default value of one. If the nozzles discharge coefficient is known, then the square root of this coefficient may be entered as K (provided it ranges from 0.75 to 1.00). Selection of a velocity range for the FKT1DP1A-SV model will show the prompt For Flow Survey Press ZERO Wait to Bypass. If velocity measurements are desired, wait approximately 3 seconds to enter this option. To perform a duct (flow) survey, press the ZERO button. See section C for details on duct surveys. 7. Temperature and Relative Humidity measurement Temperature is measured by the K-type thermocouple that can be inserted into a duct or attached to a velocity probe while testing. For accurate measurements the tip of the thermocouple should be exposed to the flow directly so it can measure the stagnation temperature. The exposed tip of the thermocouple is ideal for measuring in gases. Care should be taken to avoid direct contact of the tip with metal or liquids. If the instrument is operated with the thermocouple disconnected then the meter will display a standard temperature of 70F (21.1C). The relative humidity is measured by the plastic detachable probe shown in Fig. B7. If measuring relative humidity in a location such as a duct, the probe tip is inserted into the duct. For insertion of the relative humidity probe into gas streams, it is necessary that the gas is clean and free of contaminants. If the relative humidity sensor is disconnected the 15 FKT Series User Manual, Copyright 2002-2015 FlowKinetics LLC instrument will assume a value of 0% relative humidity. Fig. B7 Relative Humidity probe CAUTION: The maximum immersion temperature of the RH probe is 85C (185F). The relative humidity probe must only be inserted into clean, uncontaminated gas streams. CAUTION: Turn off the instrument before connecting or disconnecting the temperature or RH probe. 8. Damping Rotating the control varies the damping from a 1 to 8 as indicated by 1 to 8 on the upper right hand portion of the display, see Figs. B1 – B4. Damping is achieved through repeated data averaging. The numeric following the symbol represents the square root of the number of averages, i.e. 3 would indicate that the information presented on the display has been averaged 9 times. 1 is minimum damping, 8 the maximum. The damping feature is used when measuring unsteady or pulsating pressures. For the FKT1DP1A-SV model, rotating the DAMP control fully clockwise selects the statistical calculation of the standard deviation for pressure or velocity (depending on the RANGE setting). See point 11 below. 9. Zeroing The FKT series has fully autonomous auto-zeroing without the need to disconnect from the pressure source. This feature activates every 6 minutes. However, the user can initiate the auto-zero cycle at any instant by depressing the ZERO button. It is necessary to keep this button depressed until the display indicates that the instrument has entered the autozero cycle. The display will indicate that the analog to digital converters are calibrating, followed sequentially by each differential pressure transducer (as installed). If the range of a differential transducer is exceeded, the FKT series will automatically enter the autozero cycle to equalize pressures across the differential pressure transducers, so lessening the possibility of permanent damage to the transducers. When performing a duct survey, the auto-zero function is suspended, FKT1DP1A-SV model only. 10. Standard deviation, s1 The FKT 1DP1A-SV model allows calculation of the standard deviation of measured differential pressures or calculated velocities. Turning the DAMP control fully clockwise enables real time calculation of the sample standard deviation (Sx) for sequential series of sampled data. The calculation is indicated by the replacement of the symbol by s1 on the top right of the LCD screen. Additionally, depending on the RANGE selected, P will be replaced by sP or V by sV. The sample standard deviation is a measure of the precision or dispersion of the readings about the mean. The FKT 1DP1A-SV calculates it using sequences of 36 samples (N=36) using the formula: 16 FKT Series User Manual, Copyright 2002-2015 FlowKinetics LLC Sx 1 N ( xi x ) 2 . N 1 i 1 The uncertainty interval (the region in which we estimate the true value to lie) for a given uncertainty (e.g. 90%, 95%, etc) may be written as: xi x t v , p Sx where xi is the estimated interval of value P%. For the Sx value calculated by the FKT 1DP1A-SV, the estimated interval xi can be calculated using: xi x Sx xi x 2Sx xi x 3Sx (68.3% probability) (95.5% probability) (99.7% probability) Thus to a 95.5% confidence interval it may be expected that the measurement will lie within the interval given by xi x 2Sx , similarly for the other probability intervals. The variance of the distribution of the mean values for a single finite data set can be estimated by calculating the standard deviation of the means, S x , which is simply calculated using: Sx Sx N Sx 6 (for N=36 samples) The estimate of the true mean value (x’)is now stated as: x' x t v, p Sx where xi is the estimated interval of value P%. For the Sx value calculated by the FKT 1DP1A-SV, the estimated interval xi can be calculated using: x' x Sx x' x 2Sx x' x 3Sx (68.3% probability) (95.5% probability) (99.7% probability) The use of these expressions is best illustrated by example. Pressure measurements are taken. The FKT 1DP1A-SV displays a sample standard deviation of sP=0.082kPa (= Sx) (note that the instrument will continually display new estimates for Sx as sequences of 36 samples are acquired). Measurement of the pressure has indicated a value of P=10.375kPa (= x ). When estimating pressures or velocities to be used in conjunction with standard deviation estimates, the DAMPing should be set to 6; the number of samples used to calculate the pressure or velocity should be the same as the number of samples use to calculate the standard deviation. If performing a duct survey, the average volumetric flow rate flux (i.e. the volumetric flow rate per unit area) will be displayed (see Section C4) followed by the standard deviation (if this function has been enabled, Section C4). So we may estimate 17 FKT Series User Manual, Copyright 2002-2015 FlowKinetics LLC xi 10.375kPa 0.082 kPa (68.3% probability) xi 10.375kPa 2 0.082 kPa 10.375kPa 0.164 kPa (95.5% probability) xi 10.375kPa 3 0.082 kPa 10.375kPa 0.246 kPa (99.7% probability) and 0.082 k Pa 10.375k Pa 0.0136 k Pa (68.3% probability) 6 0.082 x' 10.375k Pa 2 k Pa 10.375k Pa 0.0273k Pa(95.5% probability) 6 0.082 x' 10.375k Pa 3 k Pa 10.375k Pa 0.0410 k Pa (99.7% probability) 6 x' 10.375k Pa The data may be interpreted as follows: For the measurements above, the true mean value (x’) of the 36 data points should lie between 10.347kPa and 10.402kPa with a 95.5% probability, similarly for the other probabilities. If an additional data point was recorded (i.e. a 37th sample) it should, within a 95.5% probability lie within 10.211kPa and 10.539kPa (xi). Note that xi is an estimate of the uncertainty of each sample, and x’ is an estimate of the uncertainty of the true mean value of the measurement (it defines the interval in which the average of the 36 samples should lie). For most engineering applications, x’ has more significance. When in survey mode (Section C4), the sample standard deviation of each survey point can be recorded. These standard deviations are then statistically summed (by the FKT 1DP1A-SV) to yield the sample standard deviation, Sx, for the entire survey, see sketch below. Sx The pooled standard deviation of the means (x’) may then be calculated using the equations above. 11. Humidity Ratio, W The FKT 1DP1A-SV model calculates the humidity ratio. The humidity ratio, W, (also referred to as moisture content or mixing ratio) is the mass of water vapor per unit mass of dry air. The ratio is calculated and displayed in kg of water vapor/kg dry air or lb of water vapor/lb dry air (the value is the same). Units for this measurement are not displayed on the LCD screen. 18 FKT Series User Manual, Copyright 2002-2015 FlowKinetics LLC C. USING A PITOT STATIC TUBE FOR VELOCITY MEASUREMENT 1. Overview In this section, use of a Pitot Static tube, in conjunction with the FKT series instrument will be explained. The Pitot Static tube allows the direct measurement of dynamic pressure allowing calculation of the gas velocity in ducts, pipes wind tunnels etc. 2. Measurement of Velocity A Pitot Static tube is shown in Fig. C1. Static pressure ports Total pressure port Stem Static pressure barb (P-) Total pressure barb (P+) Fig. C1 Generic Pitot Static tube configuration. The Pitot Static tube measures the total pressure (or impact pressure) at the nose of the Pitot tube and the static pressure of the gas stream at side ports. The difference of these pressures, i.e. the dynamic or velocity pressure (Pdynamic) varies with the square of the gas velocity. Thus the gas velocity may be expressed as: 2 Pdynamic Vgas K (1) where is the gas density and K is a correction factor dependent on the design of the Pitot Static tube. NOTE: This equation is typically valid for incompressible (constant density) flow. High velocities (V) will lead to increasing errors as shown in Table 2. 19 FKT Series User Manual, Copyright 2002-2015 FlowKinetics LLC Table 2 Velocity error due to compressibility (Tstatic=constant) V, m/s (ft/s) Error, % 25 (82) +0.07 50 (164) +0.27 75 (246) +0.59 100 (328) +1.06 125 (410) +1.66 150 (492) +2.40 200 (656) +4.28 250 (820) +6.74 If data for a particular Pitot tube is not available, the factor K may be estimated. This factor is dependent on the spacing of the Pitot tubes’ static pressure ports (see Fig. C1) from the base of the Pitot tube’s tip and the stem’s center line. Prandtl type Pitot tubes Standard Round Junction Pitot Static Tube Static Pressure Error, % of dynamic pressure 4 2 0 -2 0 4 8 12 16 Distance from Pitot Static Tube base of tip, or centre-line of vertical stem to static holes, Diameters (xD) Fig. C2 Effect of static pressure hole location from Pitot Static Tube stem or tip typically have factors K close to 1. Figure C2 shows the effect and error of the location of the static pressure tappings on the static pressure error. The lower line gives the static pressure error associated with the distance of the static ports from the base of the tip, expressed in diameters. The upper line presents the static pressure error due to the distance of the static ports (expressed in diameters) from the stem center-line. The use of Fig. C2 to find the factor K for a given Pitot Static tube will be illustrated with an example. Example: A standard round nose Pitot Static tube has static orifices located 2D from the base of the tip and 10D from the stem’s center-line. What is the correction factor K? From Fig. C2, the tip error is –1.4% and the stem error is +0.8%. The net error is –0.6%. Thus the indicated dynamic pressure will be too high. The correct 20 FKT Series User Manual, Copyright 2002-2015 FlowKinetics LLC dynamic pressure and velocity is then: Pdynamic-correct=(1-0.6%/100%)=0.994 and Vcorrect = 0.994 Vindicated = 0.997Vindicated Thus by inspection, for this tube, K = 0.997. To simplify determination of the factor K, Table 3 may also be used, which shows the factors for various Pitot tube geometric variations (for a standard round junction tube). Table 3 Pitot Static tube correction factor K Dist from Tip, xD Dist from Stem, xD 2 4 6 8 10 12 14 16 18 20 2 2.5 3 3.5 4 6 8 10 12 14 16 1.023 1.006 1.001 0.998 0.997 0.996 0.996 0.995 0.995 0.995 1.025 1.007 1.002 1.000 0.999 0.998 0.997 0.997 0.996 0.996 1.026 1.009 1.004 1.001 1.000 0.999 0.999 0.998 0.998 0.998 1.028 1.010 1.005 1.003 1.002 1.001 1.000 1.000 1.000 0.999 1.029 1.012 1.007 1.005 1.003 1.002 1.002 1.001 1.001 1.001 1.030 1.013 1.008 1.005 1.004 1.003 1.003 1.002 1.002 1.002 1.030 1.013 1.008 1.005 1.004 1.003 1.003 1.002 1.002 1.002 1.030 1.013 1.008 1.005 1.004 1.003 1.003 1.002 1.002 1.002 1.030 1.013 1.008 1.005 1.004 1.003 1.003 1.002 1.002 1.002 1.030 1.013 1.008 1.005 1.004 1.003 1.003 1.002 1.002 1.002 1.030 1.013 1.008 1.005 1.004 1.003 1.003 1.002 1.002 1.002 The velocity indicated by the FKT series instrument would then be corrected by multiplication by K (for a non-unity Pitot Static tube). This correction is automatically performed by the instrument after storage of the factor K, see below. Storing the Pitot tube Correction factor, K The first time (after power up) that a velocity range is selected will cause the FKT to enter the Probe correction interface. It defaults to K=1.00. If a probe with a non-unity value is used (such as an S-type probe) press ZERO to edit the value. To set K, rotate the CONTR control until the desired value is displayed. To store this value, press the ZERO button again. Values of from 0.75 to 1.00 can be stored, representative of most Pitot tubes. Subsequent selection of any velocity range will not cause the instrument to enter the Probe correction interface. All velocities displayed by the instrument will incorporate the correction factor K. After setting K, it may be necessary to reset the LCD screen contrast (using the CONTR control). Taking Measurements with the FKT Series To measure velocity with the instrument with the greatest accuracy, it is necessary to measure the target gases absolute pressure and temperature as well as Relative Humidity, to allow the FKT series to calculate the correct gas density. This is achieved by connecting a length of silicone or Tygon tubing from the Pabs port to a wall static pressure tap (or averaging ring) at the measurement point location. Alternatively, the Pabs port may be connected to the static port of a Pitot Static tube, provided K 1 for the tube. RH is measured by partially inserting the RH probe into the duct/wind tunnel etc. NOTE: to avoid errors when using the FKT 2DP1A-C series for compressible velocity measurement, it is necessary for the tip of the thermocouple to be directly exposed to the 21 FKT Series User Manual, Copyright 2002-2015 FlowKinetics LLC flow. The thermocouple and RH probe should be as close as possible to the Pitot probe taking the speed measurements. Only one velocity should be measured at any instant using the FKT 2DP1A-C series (i.e. although both differential transducers may be used to read two different velocities simultaneously, this may cause potential errors in the displayed value of T and RH) for speeds above 80m/s (262ft/s). CAUTION: The maximum immersion temperature of the RH probe is 85C (185F). The relative humidity probe must only be inserted into clean, uncontaminated gas streams. CAUTION: The FKT series are not suitable for use with toxic or corrosive gases or for liquid pressure measurement. CAUTION: If the FKT series instrument is used in a flow with high-particulate content filters must be installed on the tubing between the probe and the instrument. Any unused ports should be covered if the ambient around the instrument is also dirty. CAUTION: Always connect the tubing and probe to the instrument first before inserting the probe into the flow. This prevents contaminants from filling the tubing. Measurement starts with attachment of silicone or Tygon tubing to the Pitot Static tube and the pressure transducer of choice. The P+ connection barb of the transducer is connected to the Total pressure port of the Pitot tube, and the Static pressure port of the Pitot tube is connected to the transducers P- barb connection, see Fig. C1. The appropriate transducer for the expected velocity range should be used for maximum accuracy. However, if in doubt as to the expected velocities, use the largest pressure range available to avoid overloading. If using the FKT 2DP1A-C series, the ratio of the specific heats, , must be set. If the target gas is Air, the value of (= 1.40) is automatically stored during the initialization sequence. FLOW The Pitot Static tube can then be carefully inserted into the gas flow. It may be necessary to drill holes into the ducting for insertion. The Pitot absolute pressure, temperature and RH must be Pabs measured simultaneously with the differential pressure measured by the Pitot Static tube for best accuracy. The supplied T-barb splitter can be used to connect the static port of the Pitot Static tube to the P- port of the differential Ppressure transducer as well as the Pabs absolute T barb pressure transducer, see the sketch below. A Splitter Pitot Static tube with K of approximately unity should be used when this type of connection is P+ employed. 22 FKT Series User Manual, Copyright 2002-2015 FlowKinetics LLC In many applications, the ambient density may be close to the target gas density. This can readily be determined using the FKT series by recording the ambient density (displayed continuously), followed by the target gases density. The density will be calculated and autonomously presented by the FKT series through measurement of absolute pressure, temperature and RH. If the density is comparable, then simultaneous measurement of target flow density is unnecessary, i.e. the thermocouple and RH probe can be left out of the test area. 3. Pitot Static tube duct surveys* If average duct velocities, or mass or volumetric flow rates are required, it is necessary to perform a Pitot traverse of the duct. This involves taking measurements at various positions across the duct. Before a traverse is conducted, it is necessary to select a suitable location to perform the survey. If possible, avoid traverses close to fans, dampers pipe bends, expansions etc. Try to survey at least 8 duct diameters downstream of the aforementioned elements and 2 duct diameters upstream of these elements. The survey is performed with the aid of Fig. C3. Either the Centroids of Equal Areas or LogTchebycheff point distribution may be used. A survey proceeds as follows: 1. Decide on the number of survey points and then mark these on the Pitot tube using a marker or adjustable spring clips (present on some Pitot Static tubes). 2. At the selected survey location, drill two perpendicular holes in the duct (for a round duct) or the desired number of holes for a rectangular duct, ensuring sufficient hole clearance to safely insert the Pitot Static tube. 3. Partially insert the thermocouple and RH probe in an additional hole located close to the previously drilled holes. You can attach them to the Pitot if desired. 4. Connect Pabs to a static pressure tap/ring close to the survey location, or use a T-barb to connect to the static Pitot tube port, see sketch above. 5. Carefully insert the Pitot Static tube into the duct and position at the first traverse location. Ensure that the Pitot Static tube is aligned with the axis of the duct using the alignment guide on the tube as a reference. 6. Wait for the readout on the display to stabilize. If the readout continues to oscillate increase the damping (DAMP). If the magnitude of the oscillations is greater than 25%, then another measuring point should be considered as the results may not be representative. 7. When stabilized, record the desired reading(s). 8. Move the Pitot Static tube to the next traversing point and repeat 5 and 7 until the traverse is complete. 9. Repeat points 5–8 for the other traverse locations. Once the traverse has been completed, the volumetric and mass flow rate through the duct can be calculated as follows: Volumetric flow rate (Q): 1 n Q Aduct Vi n i 1 * For specifics regarding validation of surveys, etc, the following references are suggested: (1) ASHRAE. 1988. Practices for measurement, testing, adjusting and balancing of building heating, ventilation, air-conditioning and refrigeration systems. Standard 111-1988, Atlanta, GA and (2) AABC. 1989. National standards, 5th ed., volume measurements. Washington, D.C. 23 FKT Series User Manual, Copyright 2002-2015 FlowKinetics LLC where: Aduct is the duct cross sectional area. n is the number of points (total number of points surveyed). Vi is the indicated velocity at each measurement point. Thus, using a Centroids of Equal Areas or Log-Tchebycheff point distribution allows the velocity measurements to simply be summed and averaged. ): Mass flow rate ( m 1 n Vi n i 1 where: is the density of the gas in the duct. Q Aduct m NOTE: Assuming fully developed turbulent flow with low air swirl (rotation), i.e. after a long section of duct, the average duct velocity may be estimated using a single Pitot reading at the center of the duct. The average velocity is then approximately 0.9 of this reading with an accuracy of 5%. Guidelines(1),(2) suggest that for a velocity distribution to be acceptable, 75% or more of the velocity measurements must be greater than 10% of the maximum measured velocity of the survey. 4. Using the FKT 1DP1A-SV for Surveys The FKT 1DP1A-SV can be used independently to perform surveys of ducts. The instrument performs the integration of the data and presents the volumetric and mass flux for the duct surveyed in real time. To determine the volumetric or mass flow rate it is only necessary to multiply the indicated value on the display by the duct cross sectional area (at the measurement station) in the appropriate units (m2 or ft2). See section 3 above for details on performing the survey. To select the survey mode; a) if the RANGE control is set on either kPa, inH2O, mmHg or psi, then turn the RANGE control to the desired velocity or flow rate unit or b) if the RANGE control is set to either m/s, ft/s or ft/m, turn the range control to any pressure unit, then turn it back to the desired velocity or flow rate unit. The screen will display the prompt For Flow Survey Press ZERO Wait to Bypass. To perform a survey, press the ZERO button within approximately 3 seconds of the initial display of the prompt. The screen will prompt Duct Shape Rectangular or Round CONTR Set ZERO Store Shape:Round (or Rectangular). Rotate the CONTR control clockwise to select a round duct or anticlockwise to select a rectangular duct. Press ZERO. The subsequent screen will prompt Number of Points in One Survey Row CONTR Set ZERO Store N=? Points. A value of N ranging from 3 to 12 points will be displayed depending on the CONTR pre-set. For a rectangular duct N is the number of Points/Row. For a round duct, N is 2xPoints/Radius (i.e. the total number of points along one diameter). Set N using the CONTR control. Press ZERO to store N. The instrument will display the number of points stored. The survey screen will then be displayed; Flow Survey p1 Press ZERO to Store Point (1,1) V=?.? units. The survey index, Point (x,y) indicates row x, point y. For a rectangular duct surveyed with a 4 x 4 grid, Point (2,3) would indicate that the 24 FKT Series User Manual, Copyright 2002-2015 FlowKinetics LLC Pitot should be positioned at the 2nd row, and the 3rd point along the row. If the flow appears unsteady, the DAMPing can be increased until the reading stabilizes. If the standard deviation of the survey is required, turn the DAMP control fully clockwise. The symbol on the top right of the screen will be replaced by s indicating that statistical analysis has been selected. The damping can still be adjusted. The FKT 1DP1A-SV will calculate the standard deviation for each survey point until completion. For each survey point, the calculated standard deviation of the measurement will be displayed followed by the measured velocity. These parameters are continuously calculated. To store the value, press the ZERO button. It may be necessary to keep it depressed for a few seconds until the point index increases (showing the value has been stored). Note; the standard deviation will not be calculated if this option is not selected initially (i.e. Point (1,1)) to avoid erroneous computation. Continue the survey until all points have been recorded. The results will then be displayed. A sample screen is sketched below To determine the volumetric flow rate multiply the indicated Q/A value by the duct cross sectional area at the measurement station in corresponding units (e.g. m2 or ft2). Similarly, to determine the mass flow rate multiply the displayed m/A value by the duct cross sectional area at the measurement station in corresponding units (e.g. m2 or ft2). If the ft3/m RANGE has been selected, the results will show the volumetric flux (Q/A) in both standard ft/m (e.g. Q/A=186sft/m) and actual ft/m (e.g. Q/A=190ft/m), multiplication by the cross sectional area of the duct in ft2 will give the SCFM and ACFM for the surveyed duct. If the standard deviation option has not been selected, pressing the ZERO button will clear the display and show the FKT resuming to display velocity in the units determined by the RANGE setting. If standard deviation option is selected, the standard deviation for the volumetric flow rate (Q/A) will be displayed (see Section B11 for use of this data). If the ft3/m RANGE has been selected, the results will show the standard deviation in both standard ft/m (e.g. s=98sft/m) and actual ft/m (e.g. s=100ft/m), multiplication by the cross sectional area of the duct in ft2 will give the standard deviation in both SCFM and ACFM for the surveyed duct. A sample screen is sketched below To resume functioning, press ZERO. The instrument will prompt if the CONTR has been reset. 25 FKT Series User Manual, Copyright 2002-2015 FlowKinetics LLC (6) (5) (4) H y (4) (3) (2,3) (2) (1) D (1) (2) (3) x (3) x (1) (2) (4) (4) (3) (2,3) (2) y (5) (6) (1) W 4-Point Example Points 4 5 6 7 Points 6 8 10 12 0.043 0.032 0.026 0.021 Points 5 6 7 Points 6 8 10 0.125 0.100 0.083 0.071 0.147 0.105 0.082 0.067 0.074 0.061 0.053 0.032 0.024 0.019 6-Point Example Rectangular Ducts – Centroids of Equal Areas Distance from wall, x/W or y/H 0.375 0.625 0.875 0.300 0.500 0.700 0.900 0.250 0.417 0.583 0.750 0.214 0.357 0.500 0.643 0.917 0.786 Circular ducts – Centroids of Equal Areas Distance from wall, x/D or y/D 0.296 0.704 0.853 0.957 0.194 0.323 0.677 0.806 0.895 0.968 0.146 0.226 0.342 0.658 0.774 0.854 0.918 0.118 0.177 0.250 0.356 0.644 0.750 0.823 Rectangular Ducts – Log-Tchebycheff Distance from wall, x/W o y/H 0.288 0.500 0.712 0.926 0.235 0.437 0.563 0.765 0.203 0.366 0.500 0.634 0.138 0.100 0.076 Circular ducts – Log-Tchebycheff Distance from wall, x/D o y/D 0.312 0.688 0.862 0.968 0.194 0.334 0.666 0.806 0.900 0.155 0.205 0.357 0.643 0.795 0.974 0.882 0.939 0.797 0.976 0.845 0.924 0.929 0.933 0.979 0.947 0.981 Fig. C3 Traverse point for rectangular and circular ducts. Either Centroids of Equal Areas or Log-Tchebycheff point distributions can be used. 26 FKT Series User Manual, Copyright 2002-2015 FlowKinetics LLC D. MAINTENANCE 1. Operational maintenance Ensure that the FKT series are kept clean, dry and do not come into contact with any corrosive elements. Do not spill any liquids onto the instrument when the unit’s lid is open. Do not use any solvents for cleaning purposes. To clean surfaces, wipe with a clean dry cloth. When used in a dusty environment, the unconnected pressure barbs should be covered. LO When the low battery warning appears on the display, , the battery pack should be replaced. The FKT series should be returned to FlowKinetics™ LLC, for calibration annually. 2. Battery maintenance The battery of the FKT series is changed as follows: Check to ensure that the instrument is turned off. Remove the battery compartment cover plate. Carefully lift the battery pack out of the compartment. DO NOT PULL ON THE BATTERY LEADS. Remove the battery snap (connector). Remove the old batteries out of the holder. Replace all the batteries with fresh batteries. Be careful to ensure the correct battery polarity as indicated on the battery holder. Do not mix batteries of different age, brands or types. Re-connect the battery snap to the battery pack. Check to ensure a positive connection. Carefully insert the pack into the battery compartment Replace the compartment cover plate. Hand-tighten the lid anchor screws. 3. User Calibration Caution: altering the factory calibration may affect the calibrated accuracy of the FKT series instruments, and thereby may remove any rights of claim against FlowKinetics™ LLC relating to product liability or to any consequential damage to any third party. If in doubt, return the instrument to FlowKinetics™ LLC for calibration. The differential transducers in all FKT instruments are factory calibrated against a primary standard, a ±0.05% of reading, dead weight tester, prior to shipment. This dead weight is referenced to standard gravity (980.665cm/s2) and corrected to local gravity (979.343cm/s2). It is suggested that any user calibration should use a similar type of primary standard to ensure accuracy. If desired, the unit can be user calibrated. As will be seen, calibration is easily accomplished. Calibration is achieved by storing a correction factor, Kcal, for each differential transducer. This factor can change the factorydetermined span of each transducer by up to ±1%. If it is determined that a correction greater than this is required, then the instrument must be returned to FlowKinetics™ LLC for factory recalibration and maintenance. The following sequence is suggested for calibrating the instrument. Ensure that the FKT instrument has been powered up for at least 10 minutes. Check that your primary calibration standard is within operation 27 FKT Series User Manual, Copyright 2002-2015 FlowKinetics LLC specifications and is functioning correctly. Correct for any differences between reference temperature (60F) and ambient temperature if using inH2O or mmHg. Also correct for any differences in gravity between where the calibration is being performed and that of the standard gravity of the dead weight tester. Standard gravity is 980.665cm/s2. To perform the calibration: 1. Check the range of the differential transducers (P1, P2 and P3 - depending on the model) in your FKT instrument. 2. For each differential transducer, or the transducer(s) you wish to calibrate, break up the pressure range into uniform intervals, e.g. for a 0.5psi (3.5kPa) (= FS, full scale) transducer you could apply pressure in 0.5kPa intervals (larger intervals could also be used – a standard 4 point calibration consisting of loading at 0.5FS and 0.9FS will suffice). If using a dead weight, your weight set will determine the intervals that may be used. For this example, pressures would then be applied from –3.5kPa, -3kPa, -2.5kPa .. 0kPa, 0.5kPa to 3.5kPa. Positive pressures are applied by connecting your pressure reference to the + barb, while negative pressures are applied by connecting to the – barb. 3. Connect your pressure reference to the transducer on the FKT instrument which is to be calibrated. Ensure that all tubing is firmly attached. 4. Apply pressures. For each applied pressure (as measured or imposed by your pressure reference – e.g. a dead weight) record the indicated pressure from the FKT instrument. You can either copy this down from the LCD screen, or use FlowScan™ to record the instrument outputs. 5. You will then have data of the form (for example for P1): Note that the units of Pref and Pman must be the same. Pressures can be applied in either kPA, inH2O (@60F), mmHg (@60F) or psi. Note the temperature reference, 60F, for the inH2O and mmHg units. Pref, kPa These are the pressures you apply or measure using your primary reference -3.5 -3.0 -2.5 -2.0 -1.5 -1.0 -0.5 0.0 0.5 1.0 1.5 2.0 2.5 3.0 3.5 Pman, kPa These are the displayed pressures from the FKT instrument -3.480 -2.990 -2.501 -2.000 -1.496 -0.999 -0.498 0.000 0.502 1.004 1.507 2.010 2.501 3.021 3.509 28 FKT Series User Manual, Copyright 2002-2015 FlowKinetics LLC 6. For each transducer, plot this data as shown below, data for P1 presented: 4 3 2 Pref, kPa 1 0 -1 Pref = 1.0004Pman + 0.006 R2 = 1 -2 -3 -4 -4 -3 -2 -1 0 1 2 3 4 Pman, kPa The solid circles represent the plotted data. For each plot, fit a linear regression to the data points. In the example above, this form of curve fit yielded, Pref=1.0004Pman+0.006 with a correlation coefficient (R2) of 1, indicating a good fit. The slope of this curve, or the multiplier of Pman, i.e. 1.0004 is then the value which is inputted into the instrument, i.e. Kcal, for this transducer. Repeat this procedure for all additional transducers that you wish to calibrate. To input the corrections: 1. After powering up the FKT instrument, press the ZERO button when prompted with the following: For Transducer Calib Press ZERO. 2. The correction, Kcal, for transducer P1 can be set by rotation of the CONTR control. When you have set Kcal to your calculated value for this transducer press the ZERO button. The stored value will then be shown in the next screen. 3. The display will then prompt for the user to set the correction for the next transducer. Two correction factors will be inputted for the FKT 2DP1A-C model and three for the FKT 3DP1A. After setting the final Kcal, it may be necessary to reset the LCD screen contrast (using the CONTR control). 4. TO RESTORE FACTORY DEFAULTS: When in the Calibration Interface, a default Kcal value of Kcal=1.0000 is always shown initially for each transducer. Simply store this value by pressing the ZERO button for each transducer. This will reset the instrument to its factory calibration. 29 FKT Series User Manual, Copyright 2002-2015 FlowKinetics LLC E. SPECIFICATIONS Enclosure UV protected, water resistant and virtually unbreakable Dimensions Length: 8.7 in (220.9 mm) Width: 7.5 in (190.5 mm) Height: 3.9 in ( 99.1 mm) Weight 2.93 lb (1.33 kg) Working Temperatures Operating: 32°F to 158°F (0°C to 60°C) Storage: 14°F to 140°F (-10°C to 60°C) Power Supply 8 x 1.5V AA Alkaline batteries, field replaceable (batteries not included) 100V-240V AC auto-switching power supply (included) Battery life 30hrs approx. with screen backlight off. Pressure Connectors 1/8 in barb, 0.41 in (10.45 mm) long by 0.19 in (4.9 mm) diameter. Accepts 1/8 in ID rubber tubing Differential Pressure For available pressure ranges see Table 1. Number of independent differential pressure sensors: FKT 3DP1A: 1 to 3 FKT 2DP1A-C: 1 or 2 FKT 1DP1A-SV: 1 Zero offset and zero temperature shift: eliminated through auto-zero without disconnect. Accuracy at 25°C: Typically within ±0.1% of full scale pressure (±0.22% max) User recalibration procedure available Maximum simultaneous pressure on both ports for each sensor (above ambient): 10 psi for sensors with a range of ±5inH2O or below. 15 psi for sensors with a range of ±12inH2O or above. Velocity For available velocity ranges see Table 1. Corrected for gas density and humidity Determined using a velocity probe with user selectable flow coefficient Accuracy at 25°C: Typically within ±0.24% of full scale velocity (±0.3% max) Absolute Pressure Range: 2.2 -16.7 psi (15 - 115 kPa). Can be upgraded to a 30 psi (206 kPa) range. Accuracy (0 to 85°C): ±0.5% of Full Scale typical. Includes effects of linearity, temperature and pressure hysteresis, zero temperature shift and span temperature shift. 30 FKT Series User Manual, Copyright 2002-2015 FlowKinetics LLC Temperature The instrument uses a K-type thermocouple and can display temperatures from -328°F to 1430°F (-200°C to 777°C) The included K-Type wire thermocouple has a range of -100°F to 900°F (73°C to 482°C). Accuracy: ±1.8°F (±1°C) Quick disconnect miniature size connector Cable length: 60 in (150 cm) Relative Humidity Range: 0 - 99% Relative Humidity, non-condensing Accuracy: ±2% typical at 25°C, non-condensing Response time (1/e): 15s in slow moving air at 25°C Working temperature: -40°F to 185°F (-40°C to 85°C) Storage: 0 to 90% Relative Humidity, non-condensing Cable length: 60 in (150 cm) Probe size: Cylinder 4 in (100 mm) long with a diameter of 0.5 in (13 mm). Density Range: 0.05 - 10 kg/m3 Calculated using the absolute pressure, temperature and relative humidity readings as well as the molecular weight and, for the FKT 2DP1A-C, the ratio of specific heats set by the user. Accuracy: ±0.8% of reading from -200 to 0°C (average) ±0.5% of reading from 0 to 777°C (average) Damping User selectable from 1 to 64 data averages available. K factor Probe coefficient set by user. Range: 0.75 to 1.00 Display 4-line large character variable contrast alphanumeric LCD with LED backlight. Viewing area: 4.02 in (102 mm) by 1.63 in (41.5 mm) Pressure units: kPa, inH2O, mmHg and psi Velocity units: m/s, ft/s and ft/min Temperature units: °C and °F Density units: kg/m3 Humidity units: percent For FKT 1DP1A-SV: Humidity: mass ratio (kg of water vapor / kg dry air) Volumetric flux units: m/s, ft/s, ft/m, sft/m (scfm) Mass flux units: kg/m2s, lb/ft2s, lb/ft2m Compatible Mediums Clean, dry, non-corrosive, non-flammable gases Output RS232 serial port interface, 9-pin connector. USB adapter (USBA or USBA2) available as an accessory. Warranty One year parts and labor. 31 FKT Series User Manual, Copyright 2002-2015 FlowKinetics LLC F. UNIT CONVERSIONS Rows: units converting to Columns: units converting from PRESSURE CONVERSION TABLE to from inH2O mH2O psi inHg mmHg mbar Pa inH2O mH2O psi inHg mmHg mbar Pa 1 39.409 27.708 13.609 0.536 0.402 0.004019 0.025375 0.0361 0.07348 1.866 2.488 248.84 1 0.70307 0.34532 0.01359 0.01019 0.000102 1.42233 1 0.49115 0.01934 0.0145 0.00015 2.8959 2.03602 1 0.03937 0.02953 0.000295 73.55592 51.71493 25.4 1 0.75006 0.0075 98.0665 68.9476 33.8639 1.3332 1 0.01 9806.65 6894.757 3386.388 133.322 100 1 VELOCITY CONVERSION TABLE to from cm/s ft/s m/s km/hr knots mph cm/s 1 30.48 100 27.78 51.48 44.7 ft/s 0.03281 1 3.281 0.9113 1.688 1.467 m/s 0.01 0.3048 1 0.2778 0.5148 0.447 km/hr 0.036 1.097 3.6 1 1.852 1.609 knots mph 0.01943 0.02237 0.5925 0.6818 1.943 2.237 0.5399 0.6214 1 1.151 0.869 1 FORCE CONVERSION TABLE to N poundal N 1 7.233 poundal 0.138 1 ozf 0.278 2.012 lbf 4.448 32.258 kip 4545.45 32154.3 kgf 9.806 71.428 from ozf 3.597 0.497 1 16 16000 35.714 lbf kip kgf 0.225 0.00022 0.102 0.031 3.11x10⁻⁵ 0.014 0.0625 6.25x10⁻⁵ 0.028 1 0.001 0.454 1000 1 453.594 2.2 0.002 1 DENSITY CONVERSION TABLE to from kg/m3 slugs/ft3 lb/ft3 kg/m3 slugs/ft3 lb/ft3 1 515.3788 16.02 0.00194 1 0.03108 0.0624 32.17096 1 MASS CONVERSION TABLE to from kg g slug lb kg 1 0.001 14.594 0.454 g slug lb 1000 0.0685 2.205 1 6.85x10⁻⁵ 0.0022 14593.9 1 32.174 453.59 0.031 1 32 FKT Series User Manual, Copyright 2002-2015 FlowKinetics LLC TEMPERATURE CONVERSION TABLE CONVERT FROM CONVERT TO FORMULA Fahrenheit Celsius (F - 32) / 1.8 Fahrenheit Kelvin (F + 459.67) / 1.8 Fahrenheit Rankine F + 459.67 Rankine Kelvin R / 1.8 Rankine Celsius (R - 491.67) / 1.8 Rankine Fahrenheit R - 459.67 Celsius Fahrenheit (1.8 x C) + 32 Celsius Rankine (1.8 x C) + 491.67 Celsius Kelvin C + 273.15 Kelvin Rankine 1.8 x K Kelvin Fahrenheit (1.8 x K) - 459.67 Kelvin Celsius K - 273.15 LENGTH CONVERSION TABLE to from m mm mile yard ft in m 1 0.001 1609.3 0.9146 0.3048 0.0254 mm mile yard 1000 0.0006 1.0934 1 6.21x10⁻⁷ 0.0011 6 1.61x10 1 1760 914.4 0.0006 1 304.8 0.0002 0.333 25.4 1.58x10⁻⁵ 0.0278 ft 3.281 0.0033 5280 3 1 0.0833 in 39.37 0.039 63360 36 12 1 SI PREFIXES Prefix multiplying factor tera (T) 1 000 000 000 000 giga (G) 1 000 000 000 mega (M) 1 000 000 kilo (k) 1 000 milli (m) 0.001 0.000 001 micro () nano (n) 0.000 000 001 pico (p) 0.000 000 000 001 33