1
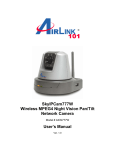
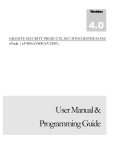
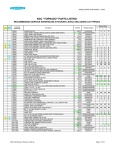
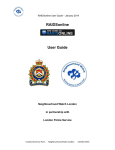
A ppendix Recommended Citation: Caplan, J. M., Kennedy, L. W., & Piza, E. L. (2013). Risk Terrain Modeling Diagnostics Utility User Manual Appendix (Rev. 1). Newark, NJ: Rutgers Center on Public Security. Available at www.rutgerscps.org/software Updated 2/6/15. Rev. 8 Appendix A: Multipart polygon shapefiles To combine existing features to make a multipart feature in ArcMap®, use either the Merge or Union tools. Merge allows you to combine features within the same layer, while Union works with features in different layers. Appendix B: Use NN analysis to strategically select Density or Proximity Want to reduce “run time” by purposefully selecting “Density” or “Proximity” for each risk factor (i.e., instead of “Both”)? Then consider running a Nearest Neighbor (NN) Analysis on each risk factor’s points prior to inputting them into the RTMDx Utility. Set the RTMDx “Operationalization” to “Proximity” if the points are not significantly clustered, or if the “Observed Mean Distance” (OMD) of the point features is greater than the “Max Spatial Influence” distance that you will set (e.g., 4 blocks). Set the “Operationalization” to “Density” if the points are significantly clustered and/or if they have an OMD less than or equal to the “Max Spatial Influence” distance that you intend to set as a parameter in the RTMDx Utility. Appendix C: Why only 30 risk factors? Memory issues may arise: Runtime is a function of the Number of Cells * the Number of Factors * the Number of Analysis Bands * the Number of Operationalization Types. So if a model uses 15 risk factors (e.g., 14 operationalized as “Both” and 1 as “Proximity”) evaluated for 6 Analysis Bands each (i.e., 3 Blocks, Half), it generates 174 variables (each represented by a separate raster map). This, multiplied by 104,733 cells of 250ft-‐x-‐250ft in a fairly large jurisdiction, generates a matrix with 18,223,542 values in it. In order to serialize this matrix into a CSV file for statistical analysis, the computer will hold all of the raster maps (174) in memory. The RTMDx Utility was developed in a way that increases the amount of memory available for this process. However, models can quickly get into the realm where a single computer cannot process so much data. The amount of memory on a computer is going to be a limiting factor in many cases. Memory usage is directly dependent on the number of Cells and the number of Variables generated. For these reasons, the risk factor inputs have been capped at 30 in order to limit the size of the analysis matrix and prevent errors. Appendix D: Error message: "Too few events within the study area: 0 events found." 1) Make sure all inputs are properly projected. Projections for shapefiles and values/formats for XY coordinates (in CSV files) must be exactly the same. 1 2) When the software encounters multi-‐feature polygons, it chooses the first polygon. If the chosen polygon includes none of the outcome events, then this error will occur. To solve the problem, merge the multiple features into one multi-‐part polygon. Appendix E: Internal data preparation The data preparation component of the RTMDx Utility forms a grid that covers the entire study area (plus a buffer). The processing of spatial influence occurs across this whole raster before cells are masked via the study area boundary. This process is also designed to include risk factors that are outside of the study area which could influence cells within the study area. Only cells that are included within the mask (cells that intersect the study area boundary by at least a small amount) are passed to the R script for statistical analysis. Additionally, as the study area polygon becomes more complex, the calculation of which cells to include in the mask takes longer. Resulting GeoTiffs will only include risk values for cells in the mask. The mask is filtered for modeling to only include the minimum number of cells necessary to completely cover the study area polygon. For instance, if the polygon includes a hole, the cells completely contained within the hole will not be included. When the Utility completes processing and generates GeoTIFFs, these GeoTIFFs only contain values for the cells that were included in the modeling process. In this example, they would not include values for the cells within the hole. Appendix F: Convert GeoTiff to a GRID with ArcGIS® From ArcMap®, right click on the GeoTiff in the Table of Contents > Data > Export Data. The “Export Raster Data” dialog box will appear. Specify a Name and Location for the new file and select “GRID” from the “Format” drop down menu. Click the “Save” button to create a new GRID raster layer. 2 Appendix G: Guide to RTM Step 5 when using RTMDx The product of Step 5 is to compile a comprehensive list of risk factors related to the outcome event, generally. Specifically, however, you want to include risk factors that make sense for your particular study area. Here is how we have come to prepare risk terrain models for our own work at Rutgers when using the RTMDx Utility. Following a review of the empirical literature, and informed by practitioner insights, we obtain data sets (e.g., shapefiles) of all potential risk factors. These data, as well as outcome event data, are added to ArcMap for visual exploration. First, we varify that the data makes sense (e.g., If we know there to be 5 gorcery stores within the study area boundary, are there 5 point features). Then, by turning on and off risk factor layers (one at a time) on top of the outcome event layer we visually inspect the intersection (or lack thereof) of risk factor points and outcome event points. We look for some evidence of a spatial relationship between the outcome event points/clusters and each risk factor feature set. We choose to include factors that appear to be visually spatially related to the outcome event locations, and exclude the factors that appear otherwise. If in doubt, keep it. Note that the RTMDx Utility can only accept up to 30 risk factor inputs. After the pool of possible risk factors are selected via visual inspection within a particular study area, they will have to be inputted into the RTMDx Utility for final selection by way of statistical testing. One parameter that has to be set in the Utility is the “Operationalizion.” The options are “Proximity,” “Density,” or “Both.” You can reduce the Utility’s “run time” by making this parameter choice strategically and objectively for each risk factor by setting “Proximity” for risk factors whose mean distance between point features is larger than the distance of the “Max Spatial Influence.” This information can be obtained from the output of the “Nearest Neighbor Analysis” tool in ArcGIS. Using this tool, you can also set “Proximity” for risk factors whose features do not significantly cluster. So for example, if the block length is 500, and the “Max Spatial Influence” is set to “3 blocks” in the Utility, then point features that are farther than 1,500ft on average from each other are not likely to be found to have a meaningful “Density” spatial influence, so testing for only “Proximity” is reasonable and will reduce the computational run time. To be on the safe side, we often double the “NN Threshold”. So in this case, it would be 1,500ft * 2 = 3,000ft. Features that are significantly clustered and whose mean observed distances are below the NN Threshold can be set to “Both” to let the Utlity decide which is better if both options are reasonable. 3 Appendix H: Converting polygons to point features (Using the RTMDx “Polygon-‐to-‐Points” Tool in ArcMap®) Currently, the RTMDx Utility only accepts risk factors as point shapefiles. Since risk factors may be represented as polygon features (i.e. public housing complexes or parks), these files must be converted to point features in order for them to be utilized within the Utility. ESRI’s ArcMap® platform provides a number of tools that convert polygon features to points. Each of these tools has its own process for the conversion, meaning that parameters such as the number of points that represent the polygon and the precise location of points differ across tools. Therefore, to ensure that this conversion occurs in a manner that is both appropriate for Risk Terrain Modeling analysis and consistent across users, researchers at the Rutgers Center on Public Security have created a (ModelBuilder®) tool for ArcMap® (version 10.1) that automates the process of converting polygon features to points. The tool separates the polygon layer into two separate components, and then converts each of these components to a point file. First, the border of the polygon is converted to a point file, with the user specifying the distance between the individual points. Second, the polygon is converted into a raster, with the cell size specified by the user. The raster is then converted into a point file, with points representing the center of each raster cell. These two separate point files are then merged into a final point layer. This multi-‐step process ensures that the entire area of the polygon (both the perimeter and interior) is represented in the newly created point feature shapefile. The polygon-‐to-‐point tool can be run from within ArcCatalog® or ArcMap®. In ArcCatalog®, simply navigate to the tool within the Catalog Tree and double click to open it (see Figure 1). In ArcMap, you first must import the model into ArcToolbox® (see Figure 2). Right-‐click within the ArcToolbox® window and select “add toolbox.” Navigate to the “RTMDx_Poly_to_Points_v10.1.tbx” file on your computer; click on the file and then click the “open” button. The toolbox then appears within the ArcToolbox® window in ArcMap®. Figure 1: Opening the model in ArcCatalog® 4 Figure 2: Importing the model into ArcMap® Double click on the “RTMDx_Poly_Points” tool to open. Load the polygon shapefile into the first text box by clicking the folder icon and navigate to the shapefile on your computer (In ArcMap®, dragging the layer from the table-‐of-‐contents to this text box is not supported). In the next two text fields, enter the desired spatial influence distance (in feet) for this risk layer. This value should match the spatial influence specified in the RTMDx Utility so that it is consistent with the other risk factors. For example, if the average block length of your study area is 500 feet and the spatial influence was set to “half-‐a-‐block” in RTMDx, then “250 feet” should be entered into this model. In the text field titled “SAVE THE POINT LAYER” specify a name and save location for the new points file by clicking the folder icon. By default, layers are saved with the name “PTS_FROM_POLY_FINAL” in a newly created folder on the C:\ drive. Leaving this setting as-‐is the first time the tool is run will not create any problems, but also doing so on subsequent runs will result in an error message stating that the output layer already exists. Thus, it is recommended that you always select a different save folder and specify a name for the final point layer. After the model runs, the newly created point shapefile is added to the main map window in ArcMap®. Figure 3: RTMDx Polygon Conversion Tool Window 5 Figure 4: Final point shapefile and the polygon layer it was created from. In conclusion, there are a few things that you should keep in mind regarding this tool. First, it was created using ArcMap® 10.1, and will not work on earlier versions. Second, the model creates two new folders directly on your C:\ drive for the purpose of saving the necessary temporary files (The model checks to see if the folders exist before creating them, so on subsequent runs the model skips the folder creation if they are already present). Therefore, you will need sufficient administrative privileges to write directly to the C:\ drive in order to run the model. Lastly, the model only supports shapefiles. Polygon layers saved in geodatabase format must first be converted into shapefiles before being utilized in the model. Appendix I: “ERROR while trying to put something into our datatable” This error message was investigated during the software's development. What's happening is that the shapefile inputs are being validated by a .NET library that interprets geometry slightly differently than Esri®. So while ArcGIS® might not complain about a shapefile object, the validator does. In the Utility, the shapefile is validated on a row-‐by-‐row basis, and when an error is produced, the validation and loading continues. These errors should not compromise the results significantly if there are a lot of records in the file. A possible fix would be to run a shapefile cleaner in ArcGIS® or QGIS, if you are worried about it. Otherwise, it's probably OK to ignore the error messages, as the Utility will still run. Appendix J: The range of Relative Risk Values differ from RTMDx output when I manually recreate the “best” model in ArcMap. See page 25 of the User Manual. It says something to the effect of: Several types of kernel functions are used by geographic information systems (GIS) to produce density maps. The RTMDx Utility uses the Epanechnikov kernel function which closely matches native ArcMap® kernel density calculations, though not exactly. Tolerances for Join or Clip operations in different software or on different computers may also vary. This means that manually producing (density or proximity) risk map layers in ArcMap® or other GIS software could yield maps and relative risk scores that do not exactly match the RTMDx Utility’s output. The differences, if any, should be slight. This is generally OK and should not be of any concern for most users’ intents and purposes. 6 As an example, in one of our Beta test models, the Utility identified relative risk scores to cells ranging from 1 for the lowest risk cell to 298.0 for the highest risk cell for 2010 Robberies. But, when we used the formula in Raster Calculator it produced a relative risk score between 1 and 698. To understand the problem, we converted the raster RTM map to vector and found 6 cells with a relative risk value of 326; 2 cells with a risk value of 427, and 2 cells with a risk value of 698. So there are 10 cells that were outliers. The rest of the 21,302 cells were within the 1-‐298 risk value range. This is likely what you are experiencing as well. Appendix K: American Decimals and European Commas. If the RTMDx Utility runs but fails to build GeoTiffs, or if the Relative Risk Values just don’t seem correct, it may be due to the language package you are using in Windows. A CSV file produced by the RTMDx Utility is generated by the R script, which then gets written as a GeoTiff. American English uses periods as decimal points (e.g., 100.01) while European and some other languages use commas (e.g., 100,01). The Utility was coded using American English, and requires the (American) English version of R. If you are experiencing trouble with the Utility’s output, consider switching the Window’s language from your native language to English. Then uninstall R, GDAL, and the RTMDx Utility from your computer. Install the English version of R and then reinstall the RTMDx Utility. Appendix L: Firewall permissions (installation failed) It is likely that any dependencies are downloaded via HTTP (port 80). This is probably already open, but only to whitelisted URLs. Hopefully adding the below URLs to your firewall’s permissions should allow installation. The GDAL download is: http://download.gisinternals.com/sdk/downloads/release-‐1600-‐gdal-‐1-‐9-‐2-‐mapserver-‐6-‐2-‐0.zip The base download directory for R and its dependencies is: http://cran.rstudio.com Appendix M: “Specified argument was out of the range of valid values. Parameter name: X called on empty point” This error is likely a projection issue. Make sure that all shapefiles and/or XY coordinates used are projected exactly the same way as one another and the study area boundary file. Appendix N: “The R script couldn’t find any Risk Factors that correlated with the Outcome Event Data.” This error means that a significant risk terrain model could not be found and that there are no factors (that were inputted/tested) that spatially correlate with the outcome event locations. Appendix O: “Unable to access index for repository”, such as the following error message within the “Log” tab of the RTMDx Utility: This is likely caused when the Utility tries to install packages/libraries for R but is unable to do so due to file permissions. Several R packages should be installed automatically during the initial install process, but if your computer has certain administrative privileges, firewalls, or other restrictions that could prevent downloads or installations of the R libraries, this problem could arise. Try uninstalling the RTMDx Utility and uninstall R and then reinstall the RTMDx Utiliy with administrative permissions on the computer. 7 Appendix P: “The model ran successfully, but no HTML report will display.” This could occur when the file name of one of the model’s output files is longer than 164 characters (including the path name). The Windows OS cannot save files that are longer than 164 characters. So, in essence, files created by the RTMDx Utility that are longer than this are not saved and are “lost.” Solution: shorten the file name and or file path and re-‐run the model. 8