1
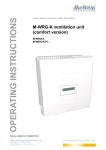
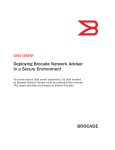
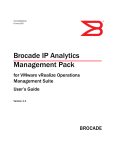
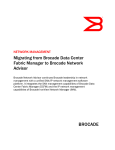
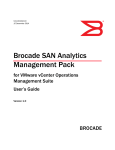
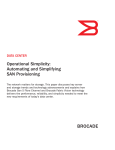
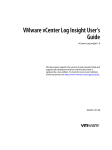
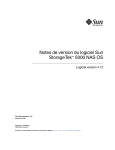
53-1003480-01
13 October 2014
Brocade Fabric OS Switch
Log Insight Content Pack
for VMware vCenter Log Insight
User’s Guide
Version 1.0
®
Copyright © 2014 Brocade Communications Systems, Inc. All Rights Reserved.
Brocade, the B-wing symbol, Brocade Assurance, ADX, AnyIO, DCX, Fabric OS, FastIron, HyperEdge, ICX, MLX, MyBrocade, NetIron,
OpenScript, VCS, VDX, and Vyatta are registered trademarks, and The Effortless Network and the On-Demand Data Center are
trademarks of Brocade Communications Systems, Inc., in the United States and in other countries. Other brands and product
names mentioned may be trademarks of others.
Notice: This document is for informational purposes only and does not set forth any warranty, expressed or implied, concerning
any equipment, equipment feature, or service offered or to be offered by Brocade. Brocade reserves the right to make changes to
this document at any time, without notice, and assumes no responsibility for its use. This informational document describes
features that may not be currently available. Contact a Brocade sales office for information on feature and product availability.
Export of technical data contained in this document may require an export license from the United States government.
The authors and Brocade Communications Systems, Inc. assume no liability or responsibility to any person or entity with respect
to the accuracy of this document or any loss, cost, liability, or damages arising from the information contained herein or the
computer programs that accompany it.
The product described by this document may contain “open source” software covered by the GNU General Public License or other
open source license agreements. To find out which open source software is included in Brocade products, view the licensing
terms applicable to the open source software, and obtain a copy of the programming source code, please visit
http://www.brocade.com/support/oscd.
Brocade Communications Systems, Incorporated
Corporate and Latin American Headquarters
Brocade Communications Systems, Inc.
130 Holger Way
San Jose, CA 95134
Tel: 1-408-333-8000
Fax: 1-408-333-8101
E-mail: [email protected]
Asia-Pacific Headquarters
Brocade Communications Systems China HK, Ltd.
No. 1 Guanghua Road
Chao Yang District
Units 2718 and 2818
Beijing 100020, China
Tel: +8610 6588 8888
Fax: +8610 6588 9999
E-mail: [email protected]
European Headquarters
Brocade Communications Switzerland Sàrl
Centre Swissair
Tour B - 4ème étage
29, Route de l'Aéroport
Case Postale 105
CH-1215 Genève 15
Switzerland
Tel: +41 22 799 5640
Fax: +41 22 799 5641
E-mail: [email protected]
Asia-Pacific Headquarters
Brocade Communications Systems Co., Ltd. (Shenzhen WFOE)
Citic Plaza
No. 233 Tian He Road North
Unit 1308 – 13th Floor
Guangzhou, China
Tel: +8620 3891 2000
Fax: +8620 3891 2111
E-mail: [email protected]
Document History
Title
Publication number Summary of changes Date
Brocade Fabric OS Switch Log Insight Content Pack for
VMware vCenter Log Insight User’s Guide
53-1003480-01
New document.
October 2014
Contents
About This Document
In this chapter . . . . . . . . . . . . . . . . . . . . . . . . . . . . . . . . . . . . . . . . . . . vii
How this document is organized . . . . . . . . . . . . . . . . . . . . . . . . . . . . vii
Supported software . . . . . . . . . . . . . . . . . . . . . . . . . . . . . . . . . . . . . . vii
What’s new in this document . . . . . . . . . . . . . . . . . . . . . . . . . . . . . . . viii
Document conventions . . . . . . . . . . . . . . . . . . . . . . . . . . . . . . . . . . . . viii
Text formatting . . . . . . . . . . . . . . . . . . . . . . . . . . . . . . . . . . . . . . . viii
Notes, cautions, and warnings . . . . . . . . . . . . . . . . . . . . . . . . . . viii
Key terms . . . . . . . . . . . . . . . . . . . . . . . . . . . . . . . . . . . . . . . . . . . viii
Notice to the reader . . . . . . . . . . . . . . . . . . . . . . . . . . . . . . . . . . . . . . . ix
Additional information. . . . . . . . . . . . . . . . . . . . . . . . . . . . . . . . . . . . . . ix
Brocade resources . . . . . . . . . . . . . . . . . . . . . . . . . . . . . . . . . . . . . ix
Other industry resources . . . . . . . . . . . . . . . . . . . . . . . . . . . . . . . . ix
Document feedback . . . . . . . . . . . . . . . . . . . . . . . . . . . . . . . . . . . . . . . x
Chapter 1
Getting Started
In this chapter . . . . . . . . . . . . . . . . . . . . . . . . . . . . . . . . . . . . . . . . . . . . 1
Fabric OS switch content pack overview . . . . . . . . . . . . . . . . . . . . . . . 1
Software requirements . . . . . . . . . . . . . . . . . . . . . . . . . . . . . . . . . 1
Installation . . . . . . . . . . . . . . . . . . . . . . . . . . . . . . . . . . . . . . . . . . . . . . . 1
Importing a content pack . . . . . . . . . . . . . . . . . . . . . . . . . . . . . . . 1
Event handling configuration . . . . . . . . . . . . . . . . . . . . . . . . . . . . . . . . 2
vCenter Log Insight event handling . . . . . . . . . . . . . . . . . . . . . . . 2
Configuring syslog forwarding on a Fabric OS switch . . . . . . . . . 2
Configuring syslog forwarding on Brocade Network Advisor. . . . 3
Monitoring and Alerting Policy Suite (MAPS) configuration . . . . 5
Accessing Log Insight . . . . . . . . . . . . . . . . . . . . . . . . . . . . . . . . . . . . . . 5
Brocade Fabric OS Switch Log Insight Content Pack for VMware vCenter Log Insight User’s Guide
53-1003480-01
iii
Chapter 2
SAN Event Dashboards
In this chapter . . . . . . . . . . . . . . . . . . . . . . . . . . . . . . . . . . . . . . . . . . . . 7
Events dashboards overview . . . . . . . . . . . . . . . . . . . . . . . . . . . . . . . . 7
Accessing a dashboard. . . . . . . . . . . . . . . . . . . . . . . . . . . . . . . . . . . . . 8
Dashboard widget functions . . . . . . . . . . . . . . . . . . . . . . . . . . . . . 9
Defining a custom time frame . . . . . . . . . . . . . . . . . . . . . . . . . . . 9
Cloning a dashboard . . . . . . . . . . . . . . . . . . . . . . . . . . . . . . . . . . . 9
Audit Events dashboard . . . . . . . . . . . . . . . . . . . . . . . . . . . . . . . . . . . 10
Audit Events over Time widget . . . . . . . . . . . . . . . . . . . . . . . . . . 10
Audit Events by Module widget . . . . . . . . . . . . . . . . . . . . . . . . . . 11
Audit Events by Product widget . . . . . . . . . . . . . . . . . . . . . . . . . . 11
Login queries widget . . . . . . . . . . . . . . . . . . . . . . . . . . . . . . . . . . 12
Bottleneck Events dashboard . . . . . . . . . . . . . . . . . . . . . . . . . . . . . . 12
Bottleneck Events over Time widget. . . . . . . . . . . . . . . . . . . . . . 13
Bottleneck Events by Product widget . . . . . . . . . . . . . . . . . . . . . 13
Count of Events grouped by Bottleneck Type widget. . . . . . . . . 14
Callhome Events dashboard . . . . . . . . . . . . . . . . . . . . . . . . . . . . . . . 14
Switch Callhome Events over Time grouped
by Message ID widget . . . . . . . . . . . . . . . . . . . . . . . . . . . . . . . . . 15
Switch Callhome Events by Product widget . . . . . . . . . . . . . . . . 16
Switch Callhome Events by Priority widget. . . . . . . . . . . . . . . . . 16
Fabric Watch Events dashboard . . . . . . . . . . . . . . . . . . . . . . . . . . . . 17
Count of Fabric Watch Events grouped
by Message ID widget . . . . . . . . . . . . . . . . . . . . . . . . . . . . . . . . . 17
Count of Fabric Watch Events over Time grouped
by Priority widget . . . . . . . . . . . . . . . . . . . . . . . . . . . . . . . . . . . . . 17
Fabric Watch Events by Priority widget . . . . . . . . . . . . . . . . . . . . 18
Fabric Watch Events by Product widget . . . . . . . . . . . . . . . . . . . 18
MAPS Events dashboard . . . . . . . . . . . . . . . . . . . . . . . . . . . . . . . . . . 19
Count of MAPS violation Events over Time grouped
by Category widget. . . . . . . . . . . . . . . . . . . . . . . . . . . . . . . . . . . . 19
MAPS violation Events grouped by Priority widget. . . . . . . . . . . 20
MAPS violation Events grouped by Product widget . . . . . . . . . . 20
Count of MAPS Violation Events by Category widget . . . . . . . . . 21
Count of Flow Violation Events over Time grouped
by Category widget. . . . . . . . . . . . . . . . . . . . . . . . . . . . . . . . . . . . 21
Switch Status Events dashboard . . . . . . . . . . . . . . . . . . . . . . . . . . . . 21
Count of Events over Time widget. . . . . . . . . . . . . . . . . . . . . . . . 22
Switch Status Events grouped by Priority widget . . . . . . . . . . . . 22
Switch Status Events by Product widget . . . . . . . . . . . . . . . . . . 23
Syslog Events dashboard . . . . . . . . . . . . . . . . . . . . . . . . . . . . . . . . . . 23
Count of Events grouped by Message ID widget . . . . . . . . . . . . 24
Count of Events over Time grouped by Priority widget . . . . . . . 24
Events by Priority widget . . . . . . . . . . . . . . . . . . . . . . . . . . . . . . . 25
Events by Product widget . . . . . . . . . . . . . . . . . . . . . . . . . . . . . . 25
iv
Brocade Fabric OS Switch Log Insight Content Pack for VMware vCenter Log Insight User’s Guide
53-1003480-01
Chapter 3
Interactive Analytics
In this chapter . . . . . . . . . . . . . . . . . . . . . . . . . . . . . . . . . . . . . . . . . . . 27
Interactive analytics overview . . . . . . . . . . . . . . . . . . . . . . . . . . . . . . 27
Viewing Brocade SAN widget data in Interactive Analytics . . . . 27
Log events . . . . . . . . . . . . . . . . . . . . . . . . . . . . . . . . . . . . . . . . . . . . . . 28
Filtering log events by aggregation and grouping . . . . . . . . . . . 28
Filtering log event charts by time . . . . . . . . . . . . . . . . . . . . . . . . 29
Filtering log event lists by time . . . . . . . . . . . . . . . . . . . . . . . . . . 30
Filtering log events by field value . . . . . . . . . . . . . . . . . . . . . . . . 30
Searching log events . . . . . . . . . . . . . . . . . . . . . . . . . . . . . . . . . . 30
Adding a log event chart to a dashboard . . . . . . . . . . . . . . . . . . 31
Alerts . . . . . . . . . . . . . . . . . . . . . . . . . . . . . . . . . . . . . . . . . . . . . . . . . . 31
Viewing alert queries . . . . . . . . . . . . . . . . . . . . . . . . . . . . . . . . . . 32
Configuring e-mail notification . . . . . . . . . . . . . . . . . . . . . . . . . . 32
Configuring an alert query. . . . . . . . . . . . . . . . . . . . . . . . . . . . . . 32
Running an alert query . . . . . . . . . . . . . . . . . . . . . . . . . . . . . . . . 33
Saving an alert query to a dashboard . . . . . . . . . . . . . . . . . . . . 33
Brocade SAN custom extract fields . . . . . . . . . . . . . . . . . . . . . . . . . . 34
Viewing extract field data . . . . . . . . . . . . . . . . . . . . . . . . . . . . . . 35
Brocade Fabric OS Switch Log Insight Content Pack for VMware vCenter Log Insight User’s Guide
53-1003480-01
v
vi
Brocade Fabric OS Switch Log Insight Content Pack for VMware vCenter Log Insight User’s Guide
53-1003480-01
About This Document
In this chapter
• How this document is organized . . . . . . . . . . . . . . . . . . . . . . . . . . . . . . . . . . vii
• Supported software. . . . . . . . . . . . . . . . . . . . . . . . . . . . . . . . . . . . . . . . . . . . . vii
• What’s new in this document . . . . . . . . . . . . . . . . . . . . . . . . . . . . . . . . . . . . . viii
• Document conventions . . . . . . . . . . . . . . . . . . . . . . . . . . . . . . . . . . . . . . . . . . viii
• Additional information . . . . . . . . . . . . . . . . . . . . . . . . . . . . . . . . . . . . . . . . . . . . ix
• Document feedback . . . . . . . . . . . . . . . . . . . . . . . . . . . . . . . . . . . . . . . . . . . . . x
How this document is organized
This document is organized to help you find the information that you want as quickly and easily as
possible. This document supports the Brocade Fabric OS Content Pack for VMware vCenter Log
Insight.
The document contains the following components:
• Chapter 1, “Getting Started,” provides requirements and instructions for importing a the
Brocade - SAN content pack and configuring event handling.
• Chapter 2, “SAN Event Dashboards,” provides information about the event dashboards that
display.
• Chapter 3, “Interactive Analytics,” provides information about searching and filtering log
events, creating queries to extract events based on timestamp, text, source, and fields in log
events, and custom extract fields.
Supported software
The Brocade Fabric OS Content Pack for VMware vCenter Log Insight is supported with the following
software versions:
• Brocade Network Advisor
• vCenter Log Insight Server
Brocade Fabric OS Switch Log Insight Content Pack for VMware vCenter Log Insight User’s Guide
53-1003480-01
vii
What’s new in this document
This is a new document.
Document conventions
This section describes text formatting conventions and important notice formats used in this
document.
Text formatting
The narrative-text formatting conventions that are used are as follows:
bold text
Identifies command names
Identifies the names of user-manipulated GUI elements
Identifies keywords and operands
Identifies text to enter at the GUI or CLI
italic text
Provides emphasis
Identifies variables
Identifies paths and Internet addresses
Identifies document titles
code text
Identifies CLI output
Identifies command syntax examples
For readability, command names in the narrative portions of this guide are presented in mixed
lettercase: for example, switchShow. In actual examples, command lettercase is all lowercase.
Notes, cautions, and warnings
The following notices and statements are used in this manual. They are listed below in order of
increasing severity of potential hazards.
NOTE
A note provides a tip, guidance, or advice, emphasizes important information, or provides a
reference to related information.
ATTENTION
An Attention statement indicates potential damage to hardware or data.
Key terms
For definitions specific to Brocade and Fibre Channel, see the Brocade Glossary.
For definitions of SAN-specific terms, visit the Storage Networking Industry Association online
dictionary at:
http://www.snia.org/education/dictionary
viii
Brocade Fabric OS Switch Log Insight Content Pack for VMware vCenter Log Insight User’s Guide
53-1003480-01
Notice to the reader
This document may contain references to the trademarks of the following corporations. These
trademarks are the properties of their respective companies and corporations.
These references are made for informational purposes only.
Corporation
Referenced trademarks and products
VMware, Inc.
VMware
Additional information
This section lists additional Brocade and industry-specific documentation that you might find
helpful.
Brocade resources
To get up-to-the-minute information, go to http://my.brocade.com to register at no cost for a user ID
and password.
White papers, online demonstrations, and data sheets are available through the Brocade website
at:
http://www.brocade.com/products-solutions/products/index.page
For additional Brocade documentation, visit the Brocade website:
http://www.brocade.com
Release notes are available on the MyBrocade website and are also bundled with the Fabric OS
firmware.
Other industry resources
For additional resource information, visit the Technical Committee T11 website. This website
provides interface standards for high-performance and mass storage applications for Fibre
Channel, storage management, and other applications:
http://www.t11.org
For information about the Fibre Channel industry, visit the Fibre Channel Industry Association
website:
http://www.fibrechannel.org
Brocade Fabric OS Switch Log Insight Content Pack for VMware vCenter Log Insight User’s Guide
53-1003480-01
ix
Document feedback
Quality is our first concern at Brocade and we have made every effort to ensure the accuracy and
completeness of this document. However, if you find an error or an omission, or you think that a
topic needs further development, we want to hear from you. Forward your feedback to:
[email protected]
Provide the title and version number of the document and as much detail as possible about your
comment, including the topic heading and page number and your suggestions for improvement.
x
Brocade Fabric OS Switch Log Insight Content Pack for VMware vCenter Log Insight User’s Guide
53-1003480-01
Chapter
1
Getting Started
In this chapter
• Fabric OS switch content pack overview . . . . . . . . . . . . . . . . . . . . . . . . . . . . . 1
• Installation . . . . . . . . . . . . . . . . . . . . . . . . . . . . . . . . . . . . . . . . . . . . . . . . . . . . . 1
• Event handling configuration . . . . . . . . . . . . . . . . . . . . . . . . . . . . . . . . . . . . . . 2
Fabric OS switch content pack overview
You can use the Brocade Fabric OS Switch Log Insight Content Pack for VMware vCenter Operations
Management Suite to collect data using the syslog protocol. This content pack helps you analyze
syslog messages received from Fabric OS switches and display the details in dashboard. You can
also configure Log Insight to generate alerts for critical syslog events.
Software requirements
• Brocade Network Advisor Professional Plus, Enterprise, or Headless editions
• vCenter Log Insight
Installation
You must import the Brocade Fabric OS Switch Log Insight Content Pack to collect, import, and
analyze Fabric OS syslogs to provide real-time answers to problems, and derive important insights
about systems, services, and applications.
Importing a content pack
To import the Brocade Fabric OS Switch Log Insight Content Pack, complete the following steps.
1. Select Content Packs from the Settings list.
FIGURE 1
Settings list
Brocade Fabric OS Switch Log Insight Content Pack for VMware vCenter Log Insight User’s Guide
53-1003480-01
1
1
Event handling configuration
2. Click Import Content Pack.
The Import Content Pack dialog box displays.
3. Browse to the location of the Brocade - SAN.vlcp file and click Open.
4. Click Import.
5. The Brocade - SAN content pack displays in the Content Packs list.
Event handling configuration
The Brocade Fabric OS Switch Log Insight Content Pack for VMware vCenter Operations
Management Suite can receive syslog messages directly from Fabric OS switches or from all
Fabric OS switches managed by Brocade Network Advisor.
You must configure vCenter Log Insight, Fabric OS switches, and Brocade Network Advisor to
enable event handling so that the Log Insight server receives events from Fabric OS switches and
Brocade Network Advisor.
vCenter Log Insight event handling
Make sure that the vCenter Log Insight is configured to listen to the syslog messages on the one of
the following ports:
TABLE 1
Syslog port numbers
Environment
Port number
UDP
514
TCP
514
TCP (SSL)
1514
Configuring syslog forwarding on a Fabric OS switch
You must register the Log Insight server IP address for each Fabric OS switch on which you want to
analyze data. If you are using Brocade Network Advisor, you should also make sure that Fabric OS
switches are configured to send traps to Brocade Network Advisor.
To configure the switch to forward all system events and error messages to the system logging
daemon (syslogd) of the Log Insight and Brocade Network Advisor server, complete the following
steps.
1. Log in to the switch as admin.
2. Execute the syslogdIpAdd IP_address command to add a server to which system messages are
forwarded.
switch:admin> syslogdipadd 192.0.2.2
You can configure up to six syslog servers to receive the syslog messages.
2
Brocade Fabric OS Switch Log Insight Content Pack for VMware vCenter Log Insight User’s Guide
53-1003480-01
Event handling configuration
1
3. Verify the syslog configuration on the switch by executing the syslogdIpShow command.
switch:admin> syslogdipshow
syslog.1 192.0.2.2
Remove a configured syslog server by executing the syslogdIpRemove IP_address command.
Configuring syslog forwarding on Brocade Network Advisor
You must register the Log Insight server IP address on Brocade Network Advisor to receive all
system events and error messages for Fabric OS switches managed by Brocade Network Advisor.
To configure the Brocade Network Advisor to forward all system events and error messages for all
managed Fabric OS switches to the Log Insight server, complete the following steps.
1. Select Monitor > Syslog Configuration > Syslog Forwarding.
The Syslog Forwarding dialog box, shown in Figure 2, displays.
FIGURE 2
Syslog Forwarding dialog box
2. Select the Enable syslog forwarding check box.
3. Click Add.
The Add Syslog Destination dialog box, shown in Figure 3, displays. The Enable and Syslog
Repeater check boxes are selected by default.
Brocade Fabric OS Switch Log Insight Content Pack for VMware vCenter Log Insight User’s Guide
53-1003480-01
3
1
Event handling configuration
FIGURE 3
Add Syslog Destination dialog box
4. Enter a general description of the Log Insight syslog destination in the Description field.
5. Enter the IP address of the Log Insight syslog destination in the IP Address field.
This is a mandatory field. You can enter an IPv4 or IPv6 address, however, you cannot enter a
DNS name.
6. Enter the syslog listening port of the Log Insight recipient in the Port # field.
This is a mandatory field. Valid numeric values range from 1 through 65535. The default
is 514.
7.
Select the Enable check box to enable syslog forwarding to this recipient.
8. Clear the Syslog Repeater check box.
You can only configure Brocade Network Advisor to send syslog messages for managed
Fabric OS switches.
9. Select up to five filters from the Available Filters list and click the right arrow button to move
them to the Selected Filters list.
Filters are not mandatory. Filters enable you to create a group of Fabric OS switches and the
severity level at which to trigger syslog messaging. For step-by-step instructions about
configuring a filter, refer to the Brocade Network Advisor User Manual or online help.
10. Click OK on the Add Syslog Destination dialog box.
4
Brocade Fabric OS Switch Log Insight Content Pack for VMware vCenter Log Insight User’s Guide
53-1003480-01
Accessing Log Insight
1
Monitoring and Alerting Policy Suite (MAPS) configuration
MAPS is supported on Fabric OS switches running 7.2 and later. If you have Fabric OS switches
running 7.2 or later and want to utilize the MAPS widget in Log Insight, you need to enable MAPS on
the switch and configure a MAPS policy with the RASLOG action. To configure MAPS directly on the
switch, refer to the Fabric OS Monitoring and Alerting Policy Suite Administrator’s Guide. To
configure MAPS in Brocade Network Advisor, refer to the Brocade Network Advisor User Manual or
online help
Accessing Log Insight
To launch the VMware vCenter Log Insight application, complete the following steps.
1. Open a web browser and enter the IP address of the Log Insight server in the Address bar.
The VMware vCenter Log Insight login dialog box displays.
2. Enter your user name and password.
3. Click Login.
The VMware vCenter Log Insight application Dashboard screen displays.
Brocade Fabric OS Switch Log Insight Content Pack for VMware vCenter Log Insight User’s Guide
53-1003480-01
5
1
6
Accessing Log Insight
Brocade Fabric OS Switch Log Insight Content Pack for VMware vCenter Log Insight User’s Guide
53-1003480-01
Chapter
SAN Event Dashboards
2
In this chapter
• Events dashboards overview . . . . . . . . . . . . . . . . . . . . . . . . . . . . . . . . . . . . . . 7
• Accessing a dashboard . . . . . . . . . . . . . . . . . . . . . . . . . . . . . . . . . . . . . . . . . . . 8
• Audit Events dashboard . . . . . . . . . . . . . . . . . . . . . . . . . . . . . . . . . . . . . . . . . 10
• Bottleneck Events dashboard. . . . . . . . . . . . . . . . . . . . . . . . . . . . . . . . . . . . . 12
• Callhome Events dashboard . . . . . . . . . . . . . . . . . . . . . . . . . . . . . . . . . . . . . . 14
• Fabric Watch Events dashboard . . . . . . . . . . . . . . . . . . . . . . . . . . . . . . . . . . . 17
• MAPS Events dashboard. . . . . . . . . . . . . . . . . . . . . . . . . . . . . . . . . . . . . . . . . 19
• Switch Status Events dashboard . . . . . . . . . . . . . . . . . . . . . . . . . . . . . . . . . . 21
• Syslog Events dashboard . . . . . . . . . . . . . . . . . . . . . . . . . . . . . . . . . . . . . . . . 23
Events dashboards overview
The Brocade Fabric OS Switch Log Insight Content Pack for VMware vCenter Operations
Management Suite displays Audit, Bottleneck, Call Home, Fabric, Monitoring and Alerting Policy
Suite (MAPS), Switch, and Syslog alerts received from the Brocade Network Advisor server or
Fabric OS switches. Before you can view event alerts, you must configure event handling for
vCenter Operations Manager and Brocade Network Advisor (refer to “Event handling configuration”
on page 2).
Log Insight allows two types of dashboards:
• Custom — Created by users and can be cloned, edited, and deleted. You can also add, clone,
move, and delete log chart widgets in all custom dashboards. Custom dashboards are
categorized as follows:
-
My Dashboards — Created by you and only visible to you.
Shared Dashboards — Created by another user and visible to all users.
• Content pack — Imported with a content pack and visible to any user with that content pack.
Content pack dashboards cannot be edited; however, you can clone it to your custom
dashboards. Once cloned, you can edit the dashboard as needed.
The Brocade Fabric OS Switch Log Insight Content Pack for VMware vCenter Operations
Management Suite includes the following dashboards:
• Audit Events dashboard — Displays all audit events received from Fabric OS switches. For
detailed information, refer to “Audit Events dashboard” on page 10.
• Bottleneck Events dashboard — Displays all bottlenecked related events received from Fabric
OS switches. For detailed information, refer to “Bottleneck Events dashboard” on page 12.
Brocade Fabric OS Switch Log Insight Content Pack for VMware vCenter Log Insight User’s Guide
53-1003480-01
7
2
Accessing a dashboard
• Callhome Events dashboard — Displays all call home related events received from Fabric OS
switches. For detailed information, refer to “Callhome Events dashboard” on page 14.
• Fabric Watch Events dashboard — Displays all Fabric Watch related events received from
Fabric OS switches. For detailed information, refer to “Fabric Watch Events dashboard” on
page 17.
• MAPS Events dashboard — Displays all MAPS violation events received from Fabric OS
switches. For detailed information, refer to “MAPS Events dashboard” on page 19.
• Switch Status Events dashboard — Displays displays Fabric Watch events received from Fabric
OS switches. For detailed information, refer to “Switch Status Events dashboard” on page 21
• Syslog Events dashboard — Displays all syslog messages received from Fabric OS switches. For
detailed information, refer to “Syslog Events dashboard” on page 23
Accessing a dashboard
To access a custom or content pack dashboard, complete the following steps.
1. Click the Dashboards tab.
2. Select one of the following options:
• My Dashboards — Displays a list of dashboards created by you.
• Shared Dashboards — Displays a list of dashboards shared with all users.
• Brocade - SAN — Displays the default content pack dashboards.
3. Select the time range for which you want to view data:
•
•
•
•
•
Latest 5 minutes of data
Latest hour of data
Latest 6 hours of data
Latest 24 hours of data
Custom (refer to “Defining a custom time frame” on page 9)
4. Select the dashboard you want to view.
Brocade - SAN content pack options include:
•
•
•
•
•
•
•
8
Audit Events dashboard
Bottleneck Events dashboard
Callhome Events dashboard
Fabric Watch Events dashboard
MAPS Events dashboard
Switch Status Events dashboard
Syslog Events dashboard
Brocade Fabric OS Switch Log Insight Content Pack for VMware vCenter Log Insight User’s Guide
53-1003480-01
Accessing a dashboard
2
Dashboard widget functions
Depending on the widget, you can perform the following functions:
•
•
•
•
•
Click the
icon to display additional information about a widget.
Click the
icon to display the widget data in the Interactive Analytics tab.
Click the
icon to select another action for the widget (such as Clone).
Place your cursor on a bar in the widget to display additional information.
Double-click a bar in the widget to display the widget data in the Interactive Analytics tab.
Defining a custom time frame
To define a custom time frame for the dashboard, complete the following steps.
1. Select Custom from the time range list.
2. Click the calendar icon and select a start date in the first date field.
You can also enter the date and time using the following format: YYYY-MM_DD HH:MM (for
example 2013-10-17 06:08).
3. Click the calendar icon and select a end date in the last date field.
4. Click Go.
Cloning a dashboard
To clone a content pack dashboard, complete the following steps.
1. Click the Dashboards tab.
2. Select Brocade - SAN from the Dashboards list.
3. Point to the dashboard you want to clone.
4. Click the Add to custom dashboard (
) icon and select Clone Dashboard.
5. Change the name of the dashboard, if necessary, in the Name field.
6. Share the dashboard with other users by selecting the Share this dashboard among all uses
check box.
7.
Click Save.
A “new dashboard created” message displays. To view or edit the dashboard, refer to
“Accessing a dashboard” on page 8.
Brocade Fabric OS Switch Log Insight Content Pack for VMware vCenter Log Insight User’s Guide
53-1003480-01
9
2
Audit Events dashboard
Audit Events dashboard
The Audit Events dashboard displays all audit events (Audit type syslog messages) received from
Fabric OS switches. The Audit Events dashboard contains the following widgets:
•
•
•
•
Audit Events over Time widget
Audit Events by Module widget
Audit Events by Product widget
Login queries widget
Table 2 lists the audit data received from the Fabric OS devices, which is used to populate the audit
widgets.
TABLE 2
Audit data
Data
Description
Example values
dcm_audit_module
The Fabric OS subsystem which generated this audit
event.
Security or Fabric
dcm_audit_priority
The priority of the audit event.
Informational or Warning
dcm_audit_type
The type of the audit event.
Login or Logout
dcm_audit_status
The status of the event.
Login failed or success
dcm_audit_info
The information about the event.
Failed login attempt via HTTP
dcm_audit_IPAddress
The IP Address of the Fabric OS switch.
IP address
Audit Events over Time widget
The Audit Events over Time widget displays all audit events received from Fabric OS switches over a
specified period of time.
FIGURE 4
Audit Events over Time
Place your cursor on a bar in the widget to display the time range configured for the dashboard and
the number of audit events that occurred during that time frame.
10
Brocade Fabric OS Switch Log Insight Content Pack for VMware vCenter Log Insight User’s Guide
53-1003480-01
Audit Events dashboard
2
Audit Events by Module widget
The Audit Events by Module widget displays all audit events received from Brocade Fabric OS
switches grouped by Fabric OS subsystem. For example, Security, Fabric, and so on.
FIGURE 5
Audit Events by Module
Place your cursor on a bar in the widget to display the affected module (such as security, fabric,
RAS, and so on) and the number of audit events that occurred on that module.
Audit Events by Product widget
The Audit Events by Product widget displays all audit events received from Brocade Fabric OS
switches grouped by product. This enables you to view all syslog messages received from a specific
Fabric OS switch.
FIGURE 6
Audit Events by Product
Place your cursor on a bar in the widget to display the product’s IP address and the number of audit
events that occurred on that product.
Brocade Fabric OS Switch Log Insight Content Pack for VMware vCenter Log Insight User’s Guide
53-1003480-01
11
2
Bottleneck Events dashboard
Login queries widget
The Login queries widget displays all login attempts received from Brocade Fabric OS switches over
a specified time range.
FIGURE 7
Login queries widget
Bottleneck Events dashboard
The Bottleneck Events dashboard displays all bottlenecked related events (AN-1003, AN-1004,
AN-1007, AN-1008, and AN-1010) received from Fabric OS switches. The Bottleneck Events
dashboard contains the following widgets:
• Bottleneck Events over Time widget
• Bottleneck Events by Product widget
• Count of Events grouped by Bottleneck Type widget
Table 3 details the bottleneck event types covered by the Bottleneck Events dashboard.
TABLE 3
Type
Bottleneck event types
Description
AN-1003 Latency bottleneck on port <slot number>/<port number within slot number>. <percentage of
seconds affected by latency bottlenecking> pct. of <observation period over which the percentage of
affected seconds is reported> secs. affected. Avg. delay <observed average time between frames
during affected seconds> us. Avg. slowdown <observed throughput drop factor during affected
seconds>.
AN-1004 Congestion bottleneck on port <slot number>/<port number within slot number>. <percentage of
seconds affected by congestion bottlenecking> pct. of <observation period over which the percentage
of affected seconds is reported> secs. affected.
AN-1007
AN-1008
AN-1010
Severe latency bottleneck detected at slot <slot number> port <port number within slot number>.
Table 4 lists the data received from the Fabric OS devices, which is used to populate the bottleneck
widgets.
TABLE 4
12
Bottleneck data
Data
Description
Example values
dcm_bottleneck_type
Displays the type of bottleneck.
Congestion or Latency
Brocade Fabric OS Switch Log Insight Content Pack for VMware vCenter Log Insight User’s Guide
53-1003480-01
Bottleneck Events dashboard
2
Bottleneck Events over Time widget
The Bottleneck Events over Time widget displays all bottleneck events received from Brocade
Fabric OS switches over a specified time.
FIGURE 8
Bottleneck Events over Time
Place your cursor on a bar in the widget to display the time range configured for the widget and the
number of bottleneck events that occurred during that time frame.
Bottleneck Events by Product widget
All bottleneck events (AN-1003, AN-1004, AN-1007, AN-1008 & AN-1010) received from Brocade
Fabric OS switches grouped by switch.
FIGURE 9
Bottleneck Events by Product
Place your cursor on a bar in the widget to display the product’s IP address and the number of
bottleneck events that occurred on that product.
Brocade Fabric OS Switch Log Insight Content Pack for VMware vCenter Log Insight User’s Guide
53-1003480-01
13
2
Callhome Events dashboard
Count of Events grouped by Bottleneck Type widget
All bottleneck events (AN-1003, AN-1004, AN-1007, AN-1008 & AN-1010) received from Brocade
Fabric OS switches grouped by bottleneck type i.e. Congestion or Latency.
FIGURE 10
Count of Events grouped by Bottleneck Type
Place your cursor on a bar in the widget to display the affected bottleneck type (such as congestion
or latency) and the number of bottleneck events that occurred on that type.
Callhome Events dashboard
The Callhome Events dashboard displays all call home related events (for list of call home events,
refer to Table 5) received from Fabric OS switches. The Callhome Events dashboard contains the
following widgets:
• Switch Callhome Events over Time grouped by Message ID widget
• Switch Callhome Events by Product widget
• Switch Callhome Events by Priority widget
Table 5 details the call home event types covered by the Callhome Events dashboard.
14
TABLE 5
Call Home events
Event ID
Description
MS-1009
Error in registered link incident record (RLIR)
FW-1402
Flash usage is out of range
FW-1426
Faulty or Missing Power supply
FW-1427
Faulty Power supply
FW-1428
Missing Power supply
FW-1429
Problem in power supply arrangement
FW-1430
Faulty Temperature sensors
FW-1431
Faulty fans
FW-1432
Faulty WWN Cards
FW-1433
Faulty CPs
FW-1434
Faulty Blades
FW-1435
Flash usage is out of range
FW-1436
Marginal port
FW-1437
Faulty Port
Brocade Fabric OS Switch Log Insight Content Pack for VMware vCenter Log Insight User’s Guide
53-1003480-01
Callhome Events dashboard
TABLE 5
Call Home events
Event ID
Description
FW-1438
Faulty or Missing SFPs
MAPS-1021
Triggered by any of the following violations on a MAPS-enabled switch:
• Faulty or Absent Power Supplies
• Faulty or Absent Fans
• Faulty Temperature sensors
• Flash usage is out of range
• Faulty Ports
• Marginal ports
• Missing SFPs
• Error ports
• Faulty WWN Cards
• Faulty CPs
• Core blade redundancy
• Faulty or absent Blades
2
Switch Callhome Events over Time grouped
by Message ID widget
The Switch Callhome Events over Time grouped by Message ID widget displays all call home events
(listed in Table 5) received from Brocade Fabric OS switches grouped by message ID over a
specified time.
FIGURE 11
Switch Callhome Events over Time grouped by Message ID widget
Place your cursor on a bar in the widget to display the time range configured for the widget, the
message ID, and the number of call home events that occurred during that time frame.
Brocade Fabric OS Switch Log Insight Content Pack for VMware vCenter Log Insight User’s Guide
53-1003480-01
15
2
Callhome Events dashboard
Switch Callhome Events by Product widget
The Switch Callhome Events by Product widget displays all call home events (listed in Table 5)
received from Brocade Fabric OS switches grouped by product.
FIGURE 12
Switch Callhome Events by Product widget
Place your cursor on a bar in the widget to display the IP address of the product and the number of
call home events that occurred on that product.
Switch Callhome Events by Priority widget
The Switch Callhome Events by Product widget displays all call home events (listed in Table 5)
received from Brocade Fabric OS switches grouped by priority.
FIGURE 13
Switch Callhome Events by Priority widget
Place your cursor on a bar in the widget to display the product’s priority and the number of call
home events that occurred for that priority.
16
Brocade Fabric OS Switch Log Insight Content Pack for VMware vCenter Log Insight User’s Guide
53-1003480-01
Fabric Watch Events dashboard
2
Fabric Watch Events dashboard
The Fabric Watch Events dashboard displays all Fabric Watch related events (prefixed by FW-)
received from Fabric OS switches. The Callhome Events dashboard contains the following widgets:
•
•
•
•
Count of Fabric Watch Events grouped by Message ID widget
Count of Fabric Watch Events over Time grouped by Priority widget
Fabric Watch Events by Priority widget
Fabric Watch Events by Product widget
Count of Fabric Watch Events grouped
by Message ID widget
The Count of Fabric Watch Events grouped by Message ID widget displays all Fabric Watch events
(prefixed by FW-) received from Brocade Fabric OS switches grouped by message ID.
FIGURE 14
Count of Fabric Watch Events grouped by Message ID widget
Place your cursor on a bar in the widget to display the message ID and the number of Fabric Watch
events that occurred for that message ID.
Count of Fabric Watch Events over Time grouped
by Priority widget
The Count of Fabric Watch Events over Time grouped by Priority widget displays all Fabric Watch
events (prefixed by FW-) received from Brocade Fabric OS switches grouped by priority.
FIGURE 15
Count of Fabric Watch Events over Time grouped by Priority widget
Place your cursor on a bar in the widget to display the time range configured for the dashboard, the
priority, and the number of events that occurred during that priority.
Brocade Fabric OS Switch Log Insight Content Pack for VMware vCenter Log Insight User’s Guide
53-1003480-01
17
2
Fabric Watch Events dashboard
Fabric Watch Events by Priority widget
The Fabric Watch Events by Priority widget displays all Fabric Watch events (prefixed by FW-)
received from Brocade Fabric OS switches grouped by priority (for example info, warning, error, and
so on).
FIGURE 16
Fabric Watch Events by Priority widget
Place your cursor on a bar in the widget to display the priority and the number of events that
occurred during that priority.
Fabric Watch Events by Product widget
The Fabric Watch Events by Product widget displays all Fabric Watch events (prefixed by FW-)
received from Brocade Fabric OS switches grouped by product.
FIGURE 17
Fabric Watch Events by Product widget
Place your cursor on a bar in the widget to display the IP address of the product and the number of
events that occurred on that product.
18
Brocade Fabric OS Switch Log Insight Content Pack for VMware vCenter Log Insight User’s Guide
53-1003480-01
MAPS Events dashboard
2
MAPS Events dashboard
The MAPS Events dashboard displays all MAPS violation events (prefixed by MAPS-) received from
Fabric OS switches. The MAPS Events dashboard contains the following widgets:
•
•
•
•
•
Count of MAPS violation Events over Time grouped by Category widget
MAPS violation Events grouped by Priority widget
MAPS violation Events grouped by Product widget
Count of MAPS Violation Events by Category widget
Count of Flow Violation Events over Time grouped by Category widget
Table 6 lists the MAPS data received from the Fabric OS devices, which is used to populate the
MAPS events widgets.
TABLE 6
MAPS data
Data
Description
Example values
dcm_flow_currentValue
The current value of the violation count.
Numeric value
dcm_maps_category
The MAPS violation category.
Traffic Performance, Port Health, and so
on.
dcm_maps_rulename
The MAPS violation rule name.
String
dcm_maps_rulecondition The MAPs violation rule condition.
ALL_PORTS(RX/min>=0)
dcm_maps_object
The MAPs violation occurred object details.
Switch, Chassis
dcm_flash_usage
The flash usage details.
Numeric value
dcm_maps_currentValue
The current value.
SEC_HTTP, 1 Violations
Count of MAPS violation Events over Time grouped
by Category widget
The Count of MAPS violation Events over Time grouped by Category widget displays all MAPS
violation events (prefixed by MAPS-) received from Brocade Fabric OS switches grouped by category
(switch resource, FRU, port health, and so on).
FIGURE 18
Count of MAPS violation Events over Time grouped by Category widget
Place your cursor on a bar in the widget to display the time range specified for the dashboard, the
category, and the number of events that occurred for that category.
Brocade Fabric OS Switch Log Insight Content Pack for VMware vCenter Log Insight User’s Guide
53-1003480-01
19
2
MAPS Events dashboard
MAPS violation Events grouped by Priority widget
The MAPS violation Events by Priority widget displays all MAPS violation events (prefixed by MAPS-)
received from Brocade Fabric OS switches grouped by priority (info, warning, and so on).
FIGURE 19
Count of MAPS violation Events by Category widget
Place your cursor on a bar in the widget to display the priority and the number of events that
occurred for that priority.
MAPS violation Events grouped by Product widget
The MAPS violation Events by Product widget displays all MAPS violation events (prefixed by MAPS-)
received from Brocade Fabric OS switches grouped by product.
FIGURE 20
Count of MAPS violation Events by Category widget
Place your cursor on a bar in the widget to display the Product’s IP address and the number of
events that occurred for that product.
20
Brocade Fabric OS Switch Log Insight Content Pack for VMware vCenter Log Insight User’s Guide
53-1003480-01
Switch Status Events dashboard
2
Count of MAPS Violation Events by Category widget
The Count of MAPS violation Events by Category widget displays all MAPS violation events (prefixed
by MAPS-) received from Brocade Fabric OS switches grouped by category (switch resource, FRU,
port health, and so on).
FIGURE 21
Count of MAPS violation Events by Category widget
Place your cursor on a bar in the widget to display the category and the number of events that
occurred for that category.
Count of Flow Violation Events over Time grouped
by Category widget
The Count of Flow violation Events over Time grouped by Category widget displays Flow violation
events (MAPS-1001, MAPS-1002, and MAPS-1003) received from Brocade Fabric OS switches
grouped by category (switch resource, FRU, port health, and so on).
Place your cursor on a bar in the widget to display the time range specified for the dashboard, the
category, and the number of events that occurred for that category.
Switch Status Events dashboard
The Switch Status Events dashboard displays Fabric Watch events (FW-1424 and FW-1425)
received from Fabric OS switches. The Switch Status Events dashboard contains the following
widgets:
• Count of MAPS violation Events over Time grouped by Category widget
• MAPS violation Events grouped by Priority widget
• MAPS violation Events grouped by Product widget
Table 7 lists the Fabric Watch events received from the Fabric OS devices.
TABLE 7
Switch Status events
Event ID
Description
FW-1424
Switch status changed from <previous state> to <current state>.
FW-1425
Switch status changed from <bad state> to HEALTHY.
Brocade Fabric OS Switch Log Insight Content Pack for VMware vCenter Log Insight User’s Guide
53-1003480-01
21
2
Switch Status Events dashboard
Table 8 lists the data received from the Fabric OS devices, which is used to populate the switch
status events widgets.
TABLE 8
Switch Status data
Data
Description
Example values
dcm_switch_status
The switch transition status (previous and current status)
Healthy to Down
Count of Events over Time widget
The Count of Events over Time widget displays the events (FW-1424 and FW-1425) received from
Brocade Fabric OS switches grouped by time range.
FIGURE 22
Count of Events over Time widget
Place your cursor on a bar in the widget to display the time range and the number of events that
occurred during that time range.
Switch Status Events grouped by Priority widget
The Switch Status Events grouped by Priority widget displays the events (FW-1424 and FW-1425)
received from Brocade Fabric OS switches grouped by priority (info, warning, and so on).
FIGURE 23
Switch Status Events grouped by Priority widget
Place your cursor on a bar in the widget to display the priority and the number of events that
occurred for that priority.
22
Brocade Fabric OS Switch Log Insight Content Pack for VMware vCenter Log Insight User’s Guide
53-1003480-01
Syslog Events dashboard
2
Switch Status Events by Product widget
The Switch Status Events grouped by Product widget displays the events (FW-1424 and FW-1425)
received from Brocade Fabric OS switches grouped by product.
FIGURE 24
Switch Status Events grouped by Product widget
Place your cursor on a bar in the widget to display the product and the number of events that
occurred for that product.
Syslog Events dashboard
The Syslog Events dashboard displays all syslog messages received from Fabric OS switches. The
Syslog Events dashboard contains the following widgets:
• Count of MAPS violation Events over Time grouped by Category widget
• MAPS violation Events grouped by Priority widget
• MAPS violation Events grouped by Product widget
Table 9 lists the data received from the Fabric OS devices, which is used to populate the syslog
events widgets.
TABLE 9
Syslog data
Data
Description
Example values
dcm_syslog_message-id
The message id.
FW-1435, MAPS-1003
dcm_wwn_address
The world wide name of the switch.
switch WWN
dcm_device_name
The name of the switch.
switch name
dcm_device_port
The port number of the switch.
port number
dcm_log_level
The syslog priority level.
Info, Warning
Brocade Fabric OS Switch Log Insight Content Pack for VMware vCenter Log Insight User’s Guide
53-1003480-01
23
2
Syslog Events dashboard
Count of Events grouped by Message ID widget
The Count of Events grouped by Message ID widget displays all syslog events received from
Brocade Fabric OS switches grouped by message ID.
FIGURE 25
Count of Events grouped by Message ID widget
Place your cursor on a bar in the widget to display the message ID and the number of syslog events
that occurred for that message ID.
Count of Events over Time grouped by Priority widget
The Count of Events over Time grouped by Priority widget displays all syslog events received from
Brocade Fabric OS switches grouped by priority.
FIGURE 26
Count of Events over Time grouped by Priority widget
Place your cursor on a bar in the widget to display the time range configured for the dashboard, the
priority, and the number of syslog events that occurred during that priority.
24
Brocade Fabric OS Switch Log Insight Content Pack for VMware vCenter Log Insight User’s Guide
53-1003480-01
Syslog Events dashboard
2
Events by Priority widget
The Events by Priority widget displays all syslog events received from Brocade Fabric OS switches
grouped by priority (for example info, warning, error, and so on).
FIGURE 27
Events by Priority widget
Place your cursor on a bar in the widget to display the priority and the number of syslog events that
occurred during that priority.
Events by Product widget
The Events by Product widget displays all syslog events received from Brocade Fabric OS switches
grouped by product.
FIGURE 28
Events by Product widget
Place your cursor on a bar in the widget to display the IP address of the product and the number of
syslog events that occurred on that product.
Brocade Fabric OS Switch Log Insight Content Pack for VMware vCenter Log Insight User’s Guide
53-1003480-01
25
2
26
Syslog Events dashboard
Brocade Fabric OS Switch Log Insight Content Pack for VMware vCenter Log Insight User’s Guide
53-1003480-01
Chapter
3
Interactive Analytics
In this chapter
• Interactive analytics overview. . . . . . . . . . . . . . . . . . . . . . . . . . . . . . . . . . . . .
• Log events . . . . . . . . . . . . . . . . . . . . . . . . . . . . . . . . . . . . . . . . . . . . . . . . . . . .
• Alerts . . . . . . . . . . . . . . . . . . . . . . . . . . . . . . . . . . . . . . . . . . . . . . . . . . . . . . . .
• Brocade SAN custom extract fields . . . . . . . . . . . . . . . . . . . . . . . . . . . . . . . .
27
28
31
34
Interactive analytics overview
You can use the Interactive Analytics tab to search and filter log events and configure alert queries
to notify you when an alert is triggered. Alerts display as charts which you can save to the
Dashboard tab.
Viewing Brocade SAN widget data in Interactive Analytics
To view a Brocade SAN content pack widget in the Interactive Analytics tab, complete the following
steps.
1. From the Dashboards tab, select a dashboard (refer to “Accessing a dashboard” on page 8).
2. Click the
icon of the widget that you want to display the Interactive Analytics tab.
The Interactive Analytics tab displays with the selected widget data populated.
Brocade Fabric OS Switch Log Insight Content Pack for VMware vCenter Log Insight User’s Guide
53-1003480-01
27
3
Log events
FIGURE 29
Interactive Analytics tab
Log events
Log events display on the Interactive Analytics tab in chart format (top of tab) and in a list of log
events (bottom of tab). Log event charts display as a graphical analysis of the log events for a
specified time period.
You can filter log events on the Interactive Analytics tab by time period (“Filtering log event charts
by time” on page 29), by field values (“Filtering log events by field value” on page 30), or by
changing the aggregation and grouping.
Filtering log events by aggregation and grouping
The number of drop-down menus that display under the chart depends on the selected aggregation
function.
To filter the events by aggregation and grouping of the results, complete the following steps.
1. From the Dashboards tab, select a dashboard (refer to “Accessing a dashboard” on page 8).
2. Click the
icon of the widget that you want to display in the Interactive Analytics tab.
3. Select one of the following options from the first drop-down list:
• Count — Creates a chart of the number of events for a specific query. Go to step 5.
• Minimum — Creates a chart of the maximum value for a field. Continue with step 4.
• Maximum — Creates a chart of the minimum value for a field. Continue with step 4.
28
Brocade Fabric OS Switch Log Insight Content Pack for VMware vCenter Log Insight User’s Guide
53-1003480-01
Log events
3
• Average — Creates a chart of the average value for a field. Continue with step 4.
• Standard Deviation — Creates a chart of the standard deviation for a field’s values.
Continue with step 4.
• Sum — Creates a chart of the sum of values for a field. Continue with step 4.
• Variance — Creates a chart of the variance for the values of a field. Continue with step 4.
4. Select one of the following from the drop-down list:
• Brocade - SAN content pack fields — These fields only display when you view data for a
dashboard widget. The available fields depend on the selected widget. For a list of all
possible fields, refer to “Brocade SAN custom extract fields” on page 34.
•
•
•
•
facility
hostname
priority
source
5. Select one or more of the following check boxes from the drop-down list:
If you selected
• Time Series — Select to view the number of events over time.
• Brocade - SAN content pack fields — These fields only display when you view data for a
dashboard widget. The available fields depend on the selected widget. For a list of all
possible fields, refer to “Brocade SAN custom extract fields” on page 34.
•
•
•
•
facility
hostname
priority
source
6. Click Update.
To display log events as a widget on a dashboard, “Adding a log event chart to a dashboard” on
page 31.
Filtering log event charts by time
To filter log event charts by time, complete the following steps.
1. From the Dashboards tab, select a dashboard (refer to “Accessing a dashboard” on page 8).
2. Click the
icon of the widget that you want to display in the Interactive Analytics tab.
3. Select the time range for which you want to view data in the Time Range area. Options include
•
•
•
•
•
•
Latest 5 minutes of data
Latest hour of data
Latest 6 hours of data
Latest 24 hours of data
All Time
Custom (refer to “Defining a custom time frame” on page 9)
Both the chart and the list of log events update when the filter is complete.
Brocade Fabric OS Switch Log Insight Content Pack for VMware vCenter Log Insight User’s Guide
53-1003480-01
29
3
Log events
Filtering log event lists by time
To filter log event lists by time, complete the following steps.
1. From the Dashboards tab, select a dashboard (refer to “Accessing a dashboard” on page 8).
2. Click the
icon of the widget that you want to display in the Interactive Analytics tab.
3. Click a bar on the chart to only display logs for that time period in the list of log events.
Filtering log events by field value
To filter log events by field value, complete the following steps.
1. From the Dashboards tab, select a dashboard (refer to “Accessing a dashboard” on page 8).
2. Click the
FIGURE 30
icon of the widget that you want to display in the Interactive Analytics tab.
Event log
3. In the list of log events area (beneath the chart), click the field value hyperlink by which you
want to filter the list.
Place your cursor on a hyperlink to display the associated value as a tooltip. When you place
your cursor on a Brocade SAN content pack field the associated value is highlighted in the log
event text (Figure 30). Field value options include:
•
•
•
•
•
facility
hostname
priority
source
Brocade SAN content pack fields — These fields only display when you view data for a
dashboard widget. The available fields depend on the selected widget. For a list of all
possible fields, refer to “Brocade SAN custom extract fields” on page 34.
4. Repeat step 3 for each constraint that you want to include in the filter.
Searching log events
To search for a log event by term, enter the text or number you are looking for in the Search field
and click Search.
All log events that contain the specified term display beneath the Search field with the search term
highlighted in yellow.
30
Brocade Fabric OS Switch Log Insight Content Pack for VMware vCenter Log Insight User’s Guide
53-1003480-01
Alerts
3
Adding a log event chart to a dashboard
Once you display a log event on the Interactive Analytics tab, you can save it to one of your custom
dashboards.
NOTE
You cannot save a log event chart to a Brocade SAN content pack dashboard.
To save a log event chart to a dashboard, complete the following steps.
1. Display the log event chart on the on the Interactive Analytics tab.
Create a unique log event chart by filtering the log, refer to “Filtering log events by aggregation
and grouping” on page 28, “Filtering log event charts by time” on page 29, or “Filtering log
events by field value” on page 30.
2. Click Add to Dashboard (upper left in the chart area).
3. Edit the name of the log event chart in the Name field, if necessary.
4. Select the custom dashboard you want to add the log event chart to in the Select Dashboard
list.
OR
Create a new dashboard by selecting New Dashboard and complete the following steps:
a.
Enter a name for the new dashboard in the Name field.
b.
Share the dashboard with other users by selecting the Share this dashboard among all
uses check box.
c.
Click Save.
5. (Optional) Enter any additional information in the Notes text box.
6. Click Add.
The log event chart is added as a widget on the selected dashboard.
Alerts
NOTE
You can only manage your own alerts.
The Brocade Fabric OS Switch Log Insight Content Pack provides preconfigured alert queries that
run every 5 minutes. When the number of events defined in the query exceed the configured
thresholds, the system sends an e-mail notification.
The Brocade Fabric OS Switch Log Insight Content Pack includes the following preconfigured alert
queries:
• Switch Status Degraded Alert — The system generates a switch status degraded alert when the
switch status degrades to marginal or down. This alert depends on the FW-1424 syslog
message to generate the alert.
• Switch Panic or Crash Alert — The system generates a switch panic or crash alert when a
switch is panicked or crashed.
Brocade Fabric OS Switch Log Insight Content Pack for VMware vCenter Log Insight User’s Guide
53-1003480-01
31
3
Alerts
• Call Home Alert — The system generates a call home alert upon receiving any critical events
from the switch, such as MS-1009, FW-1402, FW-1426, FW-1427, FW-1428, FW-1429,
FW-1430, FW-1431, FW-1432, FW-1433 FW-1434, FW-1435, FW-1436, FW-1437, FW-1438,
and MAPS-1021.
• MAPS Violation Alert — The system generates a MAPS violation alert if any MAPS rules are
violated. This alert depends on MAPS-1001, MAPS-1002, and MAPS-1003 syslog events.
• Bottleneck Alert — The system generates a bottleneck alert if any bottleneck events are
generated, such as AN-1003, AN-1004, AN-1007, AN-1008, and AN-1010.
Viewing alert queries
To view existing alert queries, complete the following steps.
1. Click the Interactive Analytics tab.
2. From the drop-down menu to the right of the Search button, select Manage Alerts.
All configured alerts display in the Manage Alerts list.
3. Click Save to My Alerts.
Configuring e-mail notification
You must be logged into the Log Insight Web user interface and SMTP must be configured before
you can e-mail alert details. For more information, refer to the VMware vCenter Log Insight online
help.
To configure an e-mail to receive alert messages, complete the following steps.
1. Click the Interactive Analytics tab.
2. From the drop-down menu to the right of the Search button, select Manage Alerts.
3. In the Manage Alerts list, click the alert query for which you want to configure e-mail
notification.
4. Select the Enable Email check box.
If you clear the Enable Email check box, the alert query is disabled.
5. Enter an e-mail address in the Email field.
You can configure notification for more than e-mail by entering one or more e-mail addresses
separated by commas.
6. Click Save to My Alerts.
Configuring an alert query
To configure an alert query, complete the following steps.
1. Click the Interactive Analytics tab.
2. From the drop-down menu to the right of the Search button, select Manage Alerts.
3. In the Manage Alerts list, click the alert query for which you want to configure a new alert.
32
Brocade Fabric OS Switch Log Insight Content Pack for VMware vCenter Log Insight User’s Guide
53-1003480-01
Alerts
3
4. Select one of the following options;
• Select the on any match option to send an alert for each match. Go to step 7.
• Select the when option to configure an alert query based on number of events within a
specified time period. Continue with step 5.
5. Configure the number of events needed to trigger an alert by selecting more than or less than
from the first drop-down list and entering a corresponding value in the field.
6. Configure how often to run the alert query by selecting a time value in the second drop-down
list.
Valid values include: 5 Minutes, 15 Minutes, 30 Minutes, 1 Hour, 6 Hours, 12 Hours, 1 Day, or
Custom. If you select Custom, enter the time value in minutes.
7.
Click Save to My Alerts.
Running an alert query
To run an alert query, complete the following steps.
1. Click the Interactive Analytics tab.
2. From the drop-down menu to the right of the Search button, select Manage Alerts.
All configured alerts display in the Manage Alerts list.
3. In the Manage Alerts list, click the alert query you want to run.
4. Click Run Query.
The results of the selected query displays in chart format in the Interactive Analytics tab.
Saving an alert query to a dashboard
Once you run an alert and the result displays on the Interactive Analytics tab, you can save it to one
of your custom dashboards.
NOTE
You cannot save alert query results to a Brocade SAN content pack dashboard.
To save the alert query results to a dashboard, complete the following steps.
1. Run the alert query (refer to “Running an alert query” on page 33)
The results of the selected query displays in chart format in the Interactive Analytics tab.
2. Click Add to Dashboard (upper left in the chart area).
3. Edit the name of the query in the Name field, if necessary.
4. Select the custom dashboard you want to add the query to in the Select Dashboard list.
OR
Create a new dashboard by selecting New Dashboard and complete the following steps:
a.
Enter a name for the new dashboard in the Name field.
b.
Share the dashboard with other users by selecting the Share this dashboard among all
uses check box.
Brocade Fabric OS Switch Log Insight Content Pack for VMware vCenter Log Insight User’s Guide
53-1003480-01
33
3
Brocade SAN custom extract fields
c.
Click Save.
5. (Optional) Enter any additional information in the Notes text box.
6. Click Add.
The query is added as a widget on the selected dashboard.
Brocade SAN custom extract fields
The Brocade Fabric OS Switch Log Insight Content Pack for VMware vCenter Operations
Management Suite includes Brocade SAN custom extract fields (refer to Table 10 on page 34). You
can use these fields to retrieve data from the Fabric OS syslog messages (refer to “Accessing a
dashboard” on page 8), create an alert query (refer to “Configuring an alert query” on page 32), or
define a widget on a custom dashboard (“Adding a log event chart to a dashboard” on page 31).
TABLE 10
34
Default Brocade SAN custom extract fields
Custom field name
Description
Example values
dcm_audit_module
The Fabric OS subsystem which
generated this audit event.
Security or Fabric
dcm_audit_priority
The priority of the audit event.
Informational or Warning
dcm_audit_type
The type of the audit event.
Login or Logout
dcm_audit_status
The status of the event.
Login failed or success
dcm_audit_info
The information about the event.
Failed login attempt via HTTP
dcm_audit_IPAddress
The IP Address of the Fabric OS switch.
IP address
dcm_bottleneck_type
Displays the type of bottleneck.
Congestion or Latency
dcm_switch_status
The switch transition status (previous and
current status).
Healthy to Down
dcm_vf_id
The virtual Fabric identifier of the switch.
dcm_syslog_message-id
The message identifier.
FW-1435, MAPS-1003
dcm_wwn_address
The world wide name of the switch.
Switch WWN
dcm_log_level
The syslog priority level.
Info, Warning
dcm_device_name
The name of the switch.
switch name
dcm_device_port
The port number of the switch.
port number
dcm_flash_usage
The flash usage details.
Numeric value
dcm_maps_rulename
The MAPS violation rule name.
String
dcm_maps_rulecondition The MAPs violation rule condition.
ALL_PORTS(RX/min>=0)
dcm_maps_object
The MAPs violation occurred object
details.
Switch, Chassis
dcm_maps_category
The MAPS violation category.
Traffic Performance, Port Health, and so
on.
dcm_maps_currentValue
The current value.
SEC_HTTP, 1 Violations
dcm_flow_currentValue
The current value of the violation count.
Numeric value
Brocade Fabric OS Switch Log Insight Content Pack for VMware vCenter Log Insight User’s Guide
53-1003480-01
Brocade SAN custom extract fields
3
Viewing extract field data
You can view the extract field data in graphical format as a bar chart or view the values used to
define the extract field.
To view the extract field data, complete the following steps.
1. From the Dashboards tab, select a dashboard (refer to “Accessing a dashboard” on page 8).
2. Click the
icon of the widget that you want to display in the Interactive Analytics tab.
3. Click the + icon to display graphical data for a field value.
FIGURE 31
Extract field graphical data
4. Click the eye icon to display field values for the extract field.
The eye icon does not display for the facility, hostname, priority, and source field values.
FIGURE 32
Extract field data values
Brocade Fabric OS Switch Log Insight Content Pack for VMware vCenter Log Insight User’s Guide
53-1003480-01
35
3
36
Brocade SAN custom extract fields
Brocade Fabric OS Switch Log Insight Content Pack for VMware vCenter Log Insight User’s Guide
53-1003480-01